Durr AG · XETR:DUE
Durr — Q1 2011 Earnings Presentation
23 slides from Durr's earnings presentation, May 3, 2011
Slide 1: Welcome to the conference call
Welcome to the conference call Dürr AG Results January - March 2011 Dürr Group Ralf Dieter, CEO Ralph Heuwing, CFO Bietigheim-Bissingen, May 3, 2011
Slide 2: Disclaimer
Disclaimer This presentation has been prepared independently by Dürr AG (“Dürr”). The presentation contains statements which address such key issues as Dürr´s strategy, future financial results, market positions and product development. Such statements should be carefully considered, and it should b
Slide 3: Book to bill ratio at 1.6
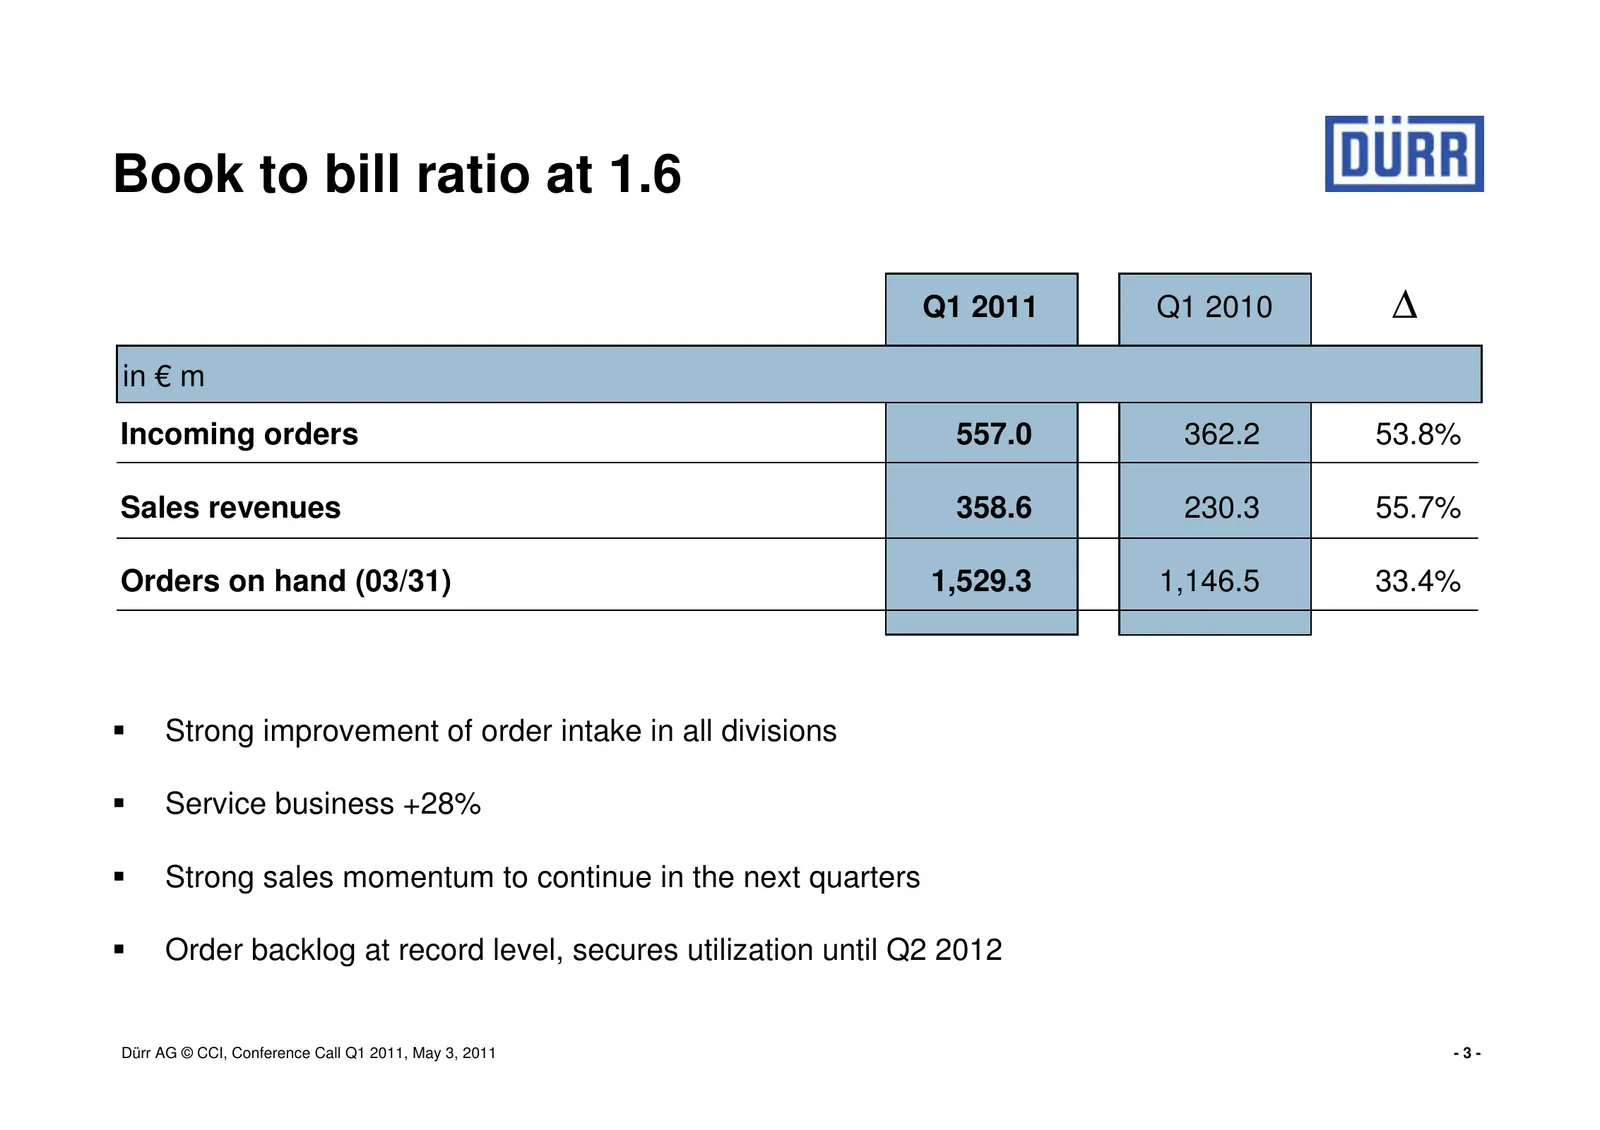
Book to bill ratio at 1.6 Q1 2011 Q1 2010 ∆ in € m Incoming orders 557.0 362.2 53.8% Sales revenues 358.6 230.3 55.7% Orders on hand (03/31) 1,529.3 1,146.5 33.4% Strong improvement of order intake in all divisions Service business +28% Strong sales momentum to continue in the next quarters Order ba
Slide 4: Incoming orders above pre-crisis level
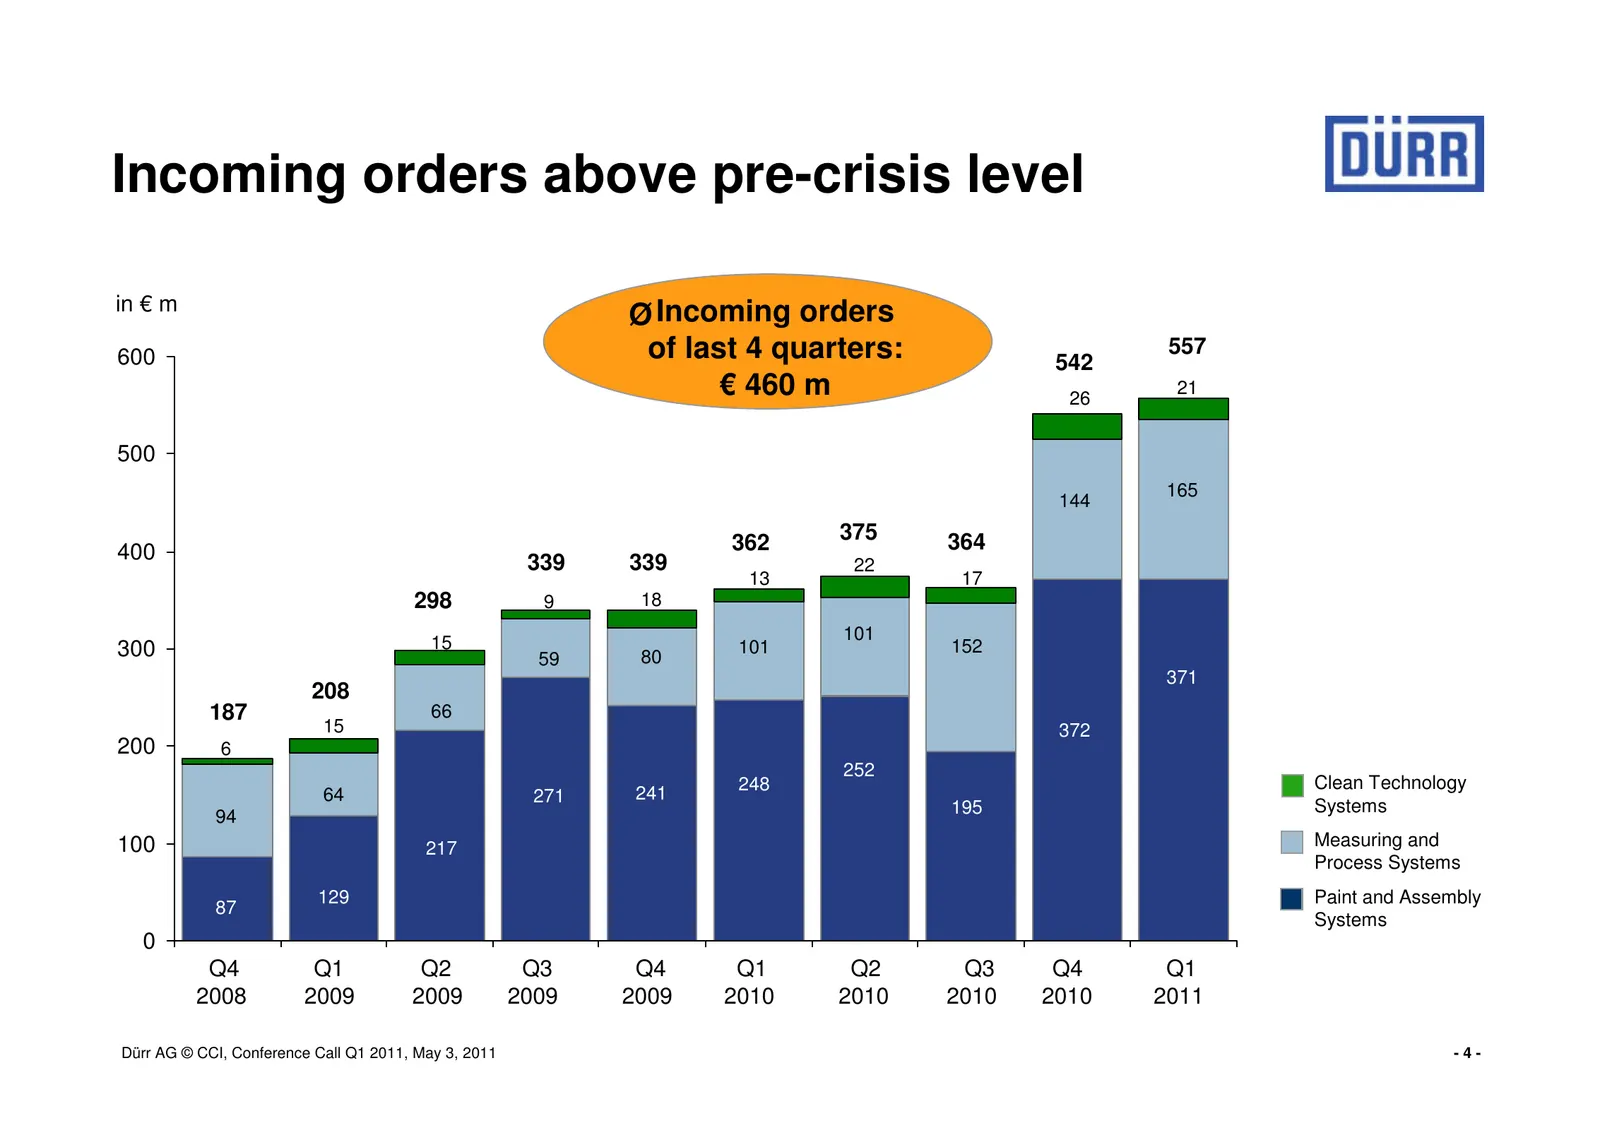
Incoming orders above pre-crisis level in € m Ø Incoming orders 600 of last 4 quarters: 542 557 € 460 m 26 21 500 165 144 362 375 364 400 339 339 22 13 17 298 9 18 101 300 15 101 152 59 80 371 208 187 66 15 372 200 6 252 248 Clean Technology 64 271 241 195 Systems 94 100 217 Measuring and Process Sy
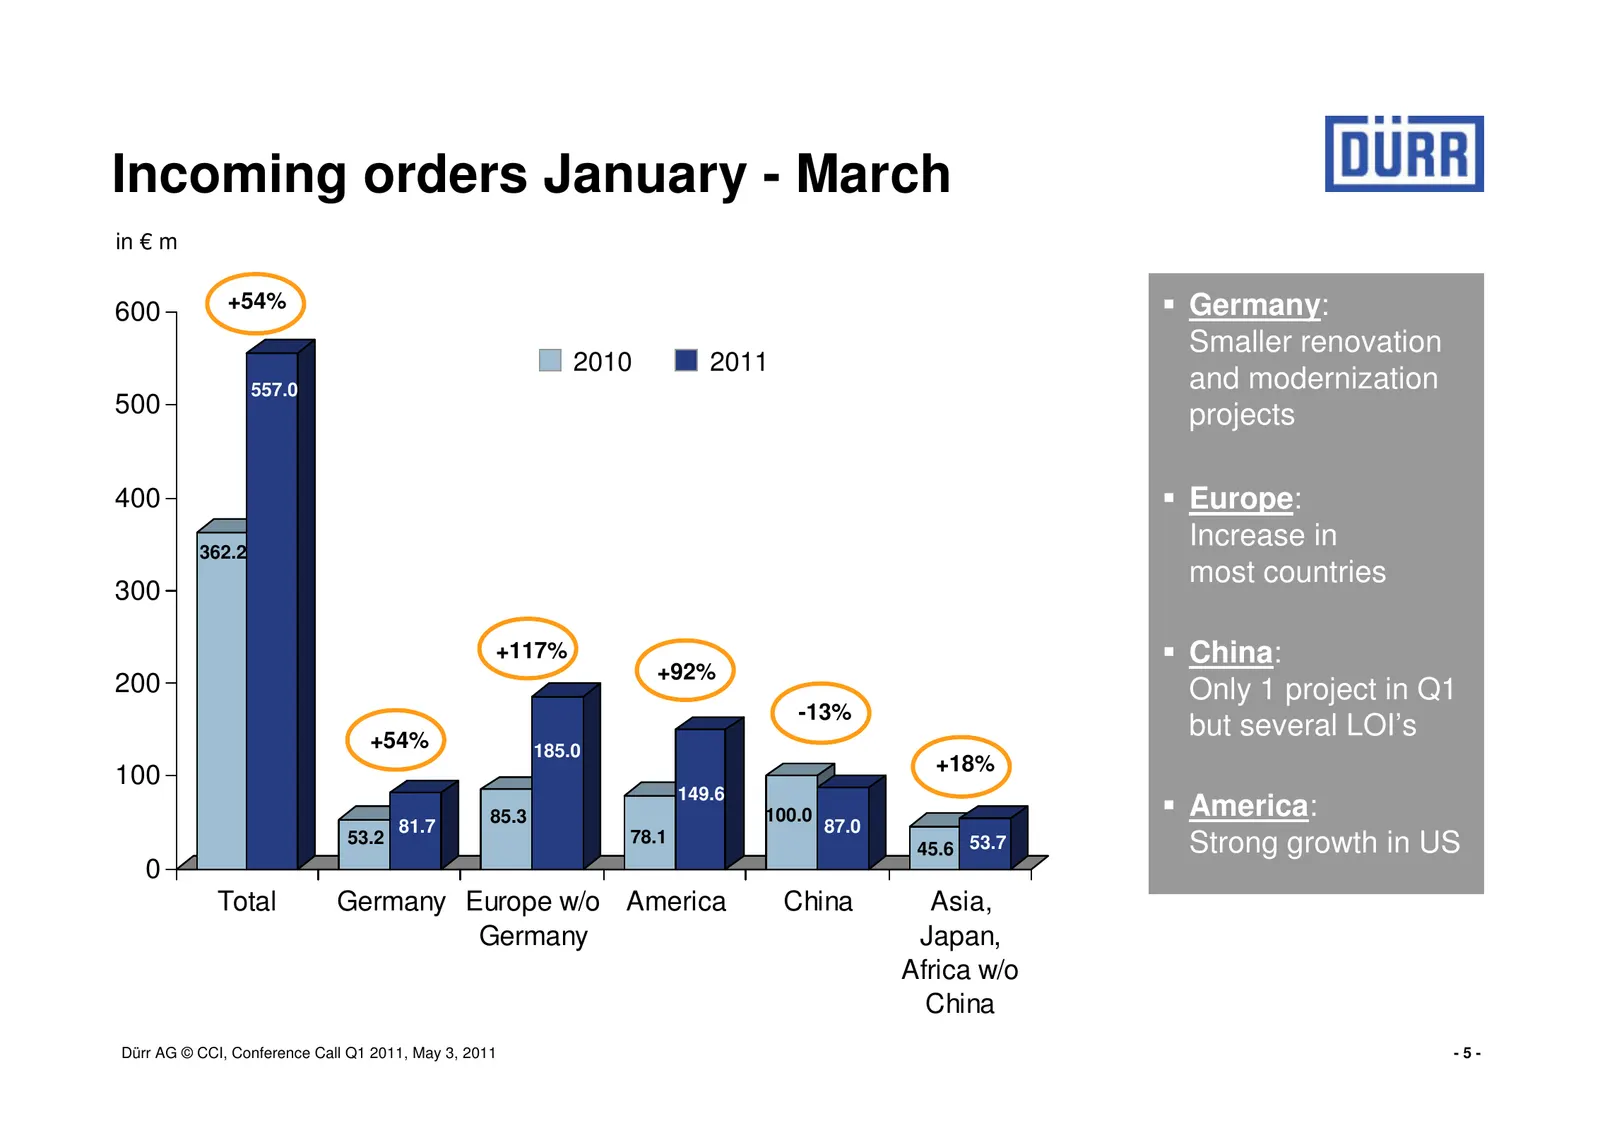
Slide 5: Incoming orders January - March
Incoming orders January - March in € m +54% Germany: 600 Smaller renovation 2010 2011 557.0 and modernization 500 projects 400 Europe: 362.2 Increase in most countries 300 +117% China: +92% 200 Only 1 project in Q1 -13% +54% but several LOI’s 185.0 +18% 100 149.6 85.3 100.0 America: 81.7 87.0 53.2 7
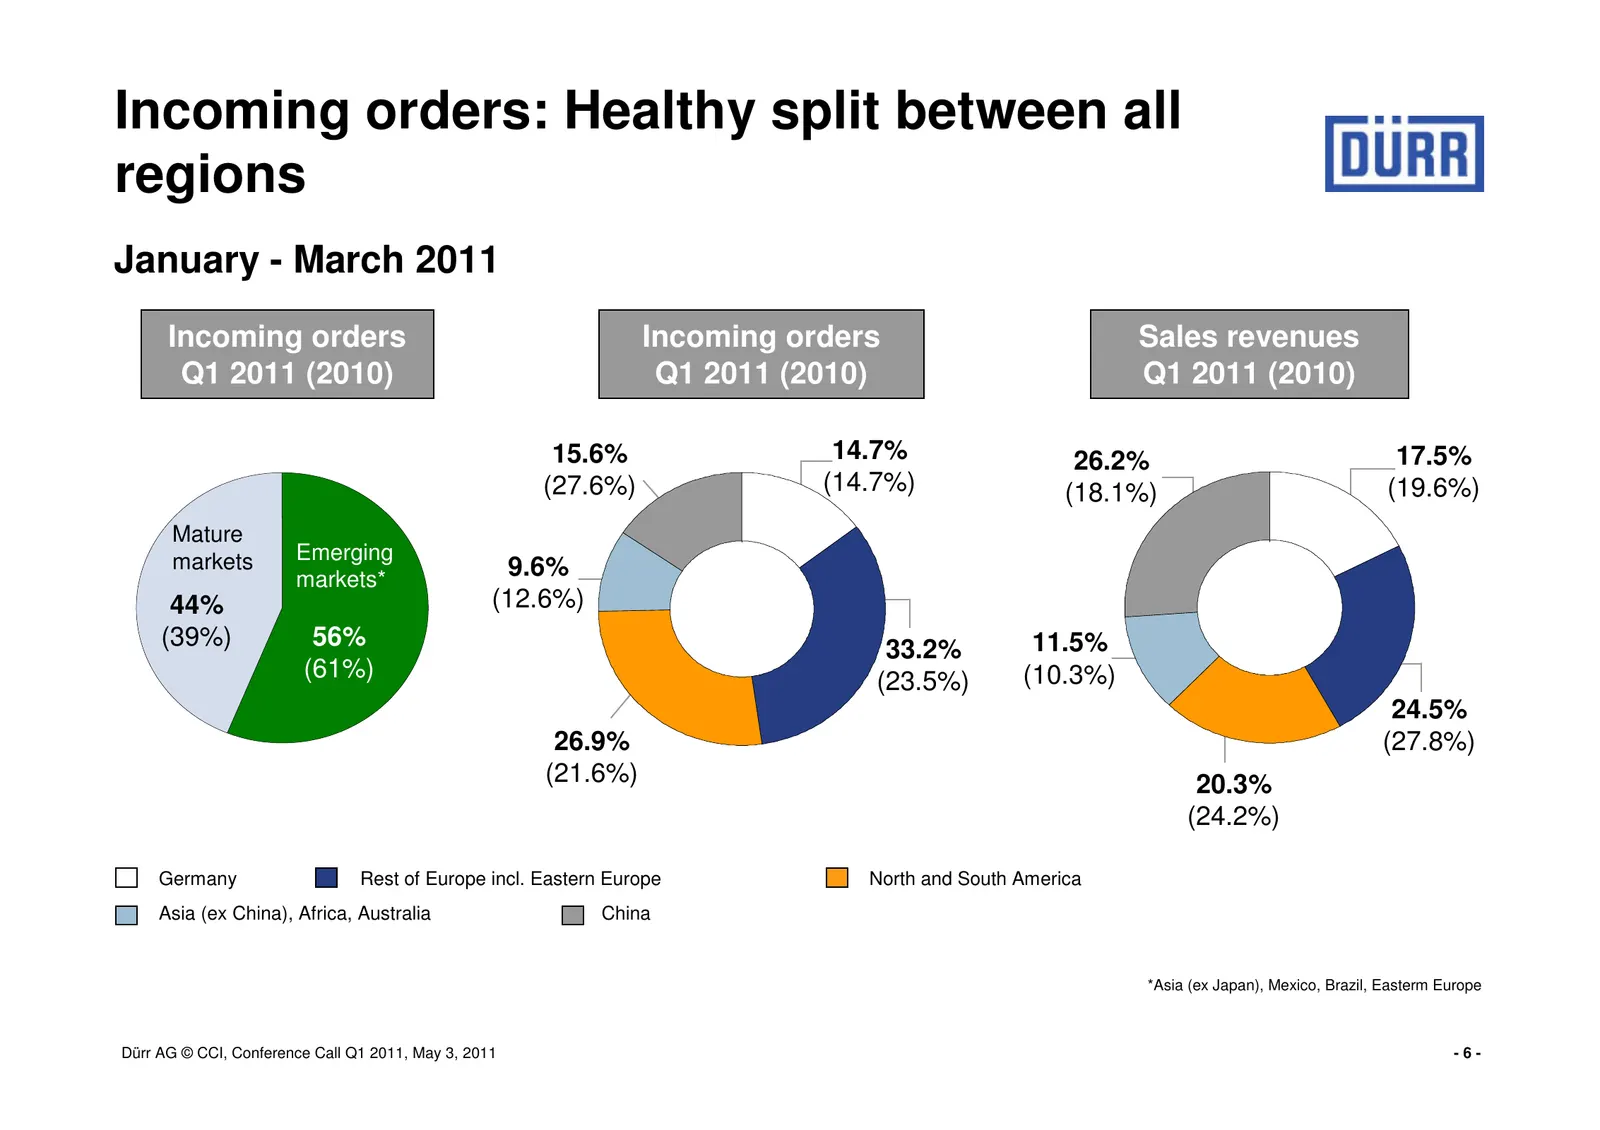
Slide 6: Incoming orders: Healthy split between all regions
Incoming orders: Healthy split between all regions January - March 2011 Incoming orders Incoming orders Sales revenues Q1 2011 (2010) Q1 2011 (2010) Q1 2011 (2010) 15.6% 14.7% 26.2% 17.5% (27.6%) (14.7%) (18.1%) (19.6%) Mature markets Emerging markets* 9.6% 44% (12.6%) (39%) 56% 33.2% 11.5% (61%) (2
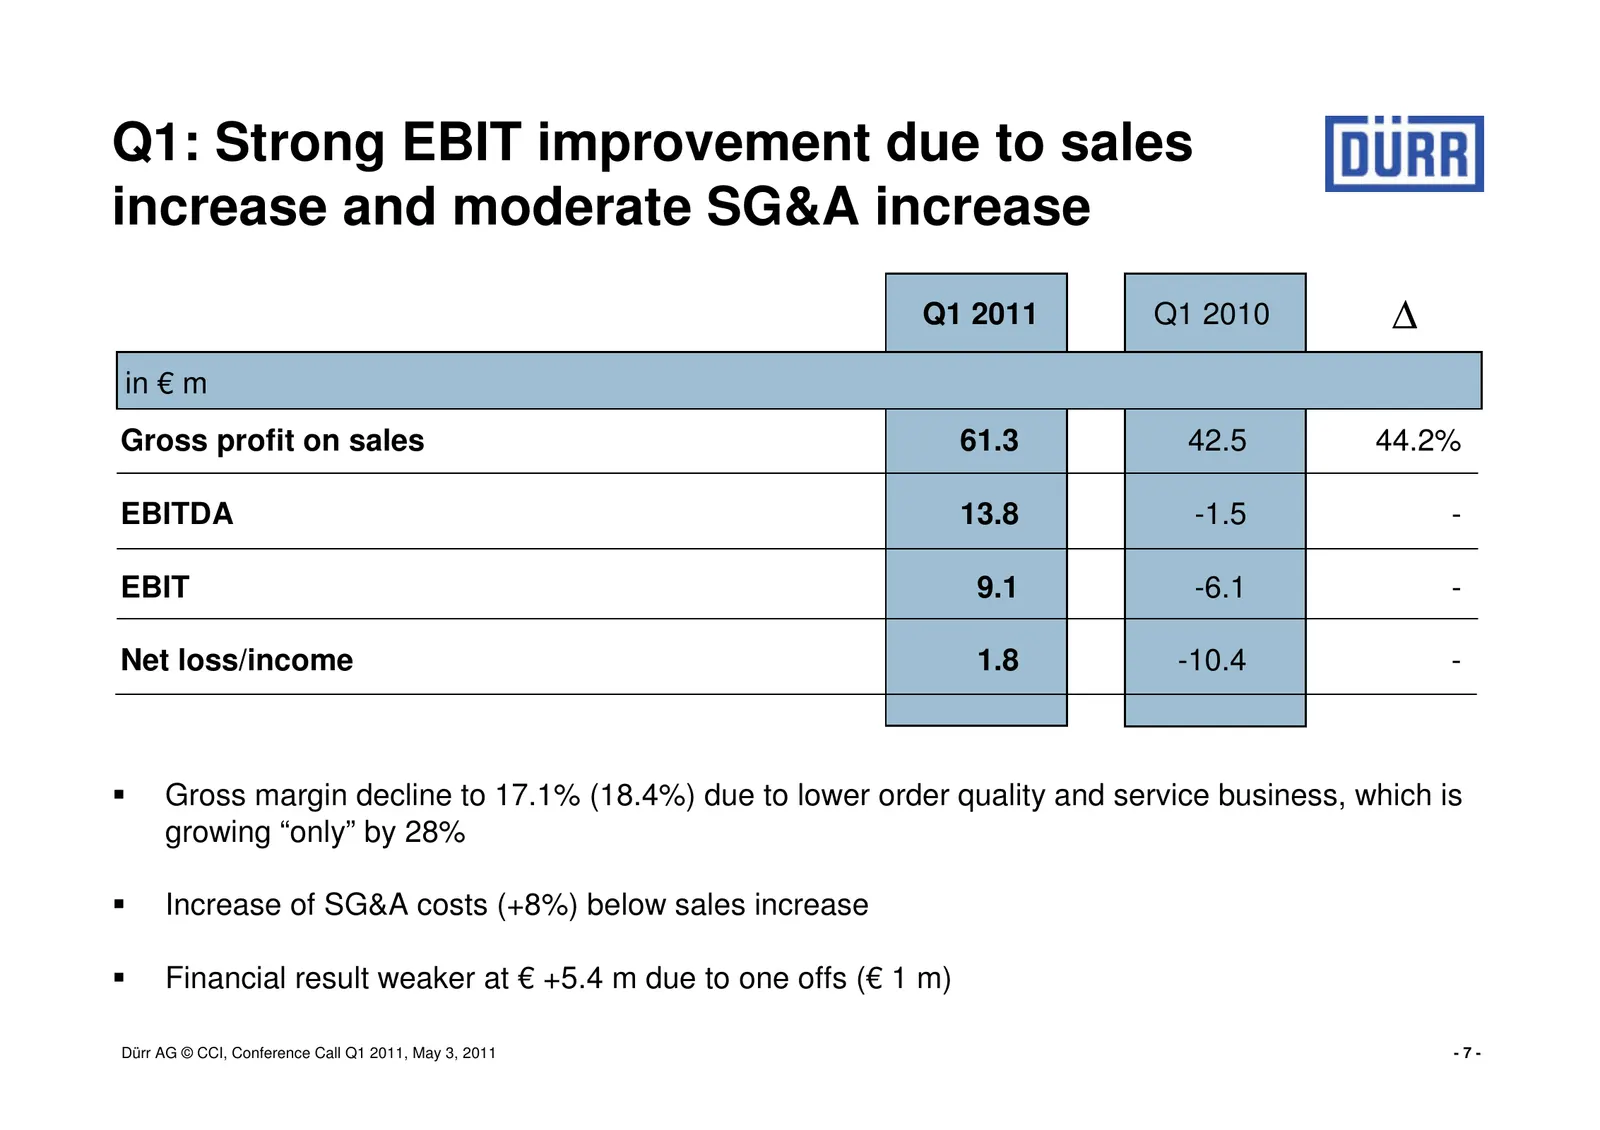
Slide 7: Q1: Strong EBIT improvement due to sales increase and moderate SG&A increase
Q1: Strong EBIT improvement due to sales increase and moderate SG&A increase Q1 2011 Q1 2010 ∆ in € m Gross profit on sales 61.3 42.5 44.2% EBITDA 13.8 -1.5 - EBIT 9.1 -6.1 - Net loss/income 1.8 -10.4 - Gross margin decline to 17.1% (18.4%) due to lower order quality and service business, which is g
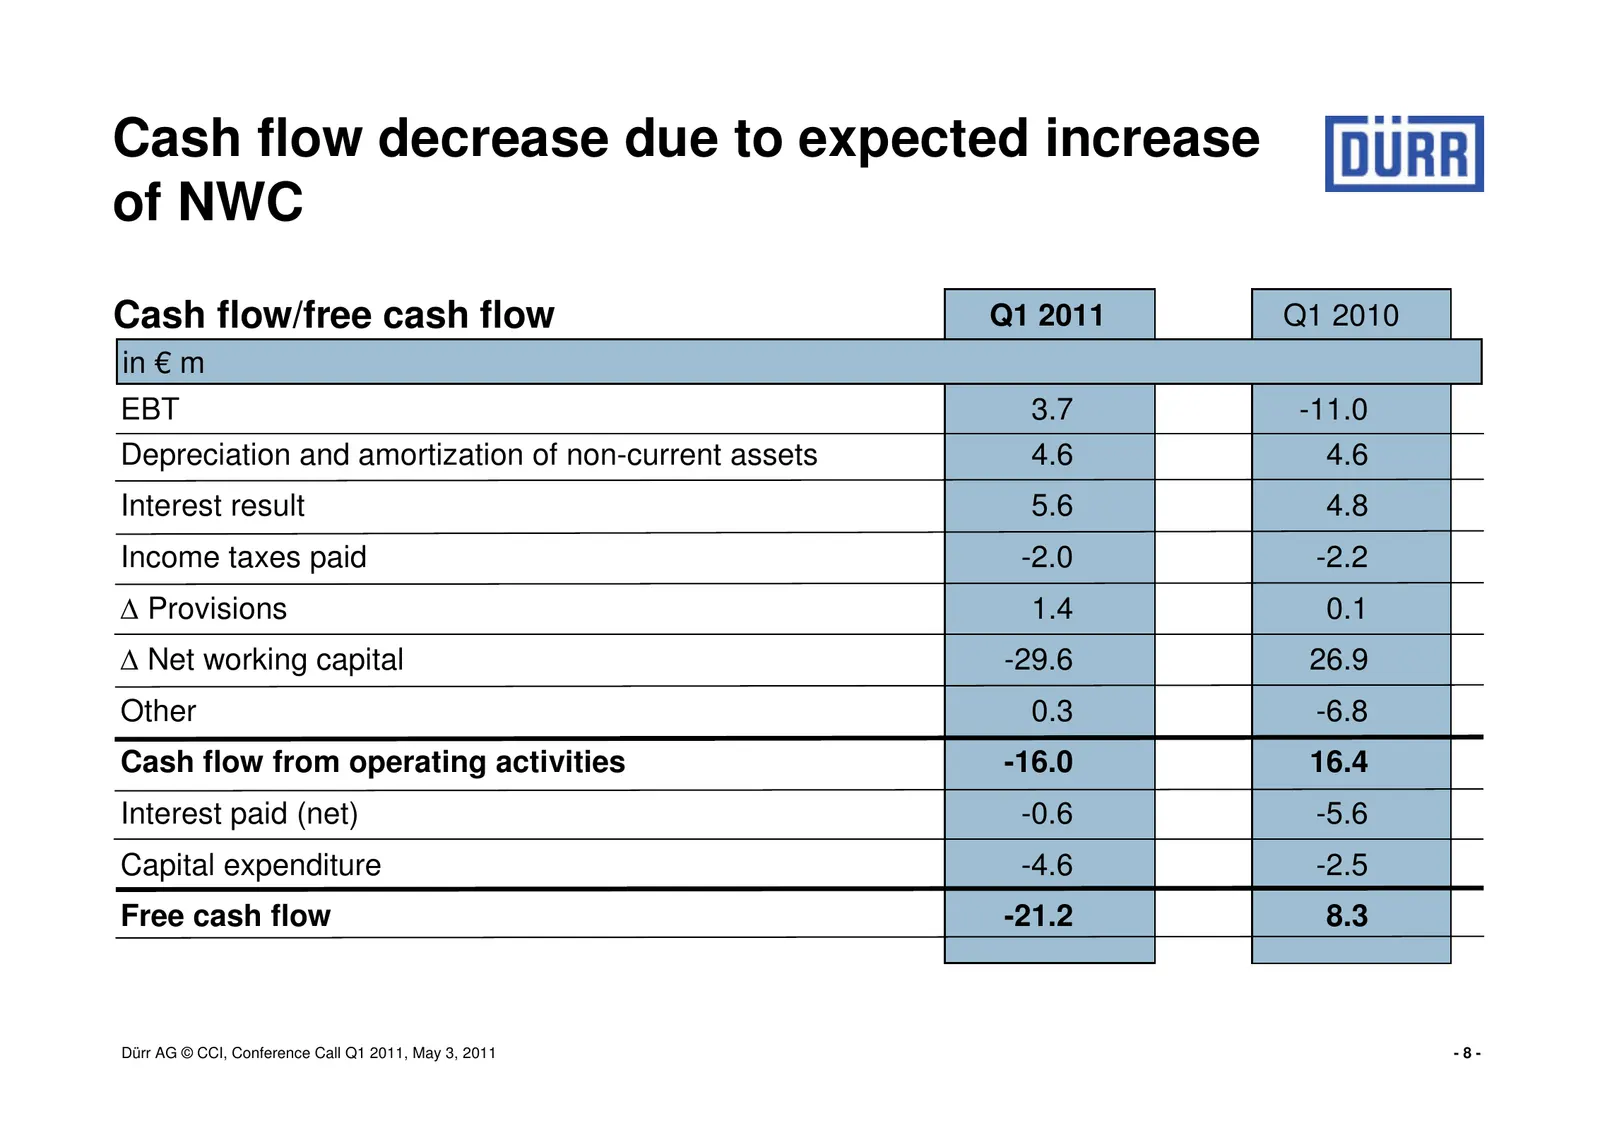
Slide 8: Cash flow decrease due to expected increase of NWC
Cash flow decrease due to expected increase of NWC Cash flow/free cash flow Q1 2011 Q1 2010 in € m EBT 3.7 -11.0 Depreciation and amortization of non-current assets 4.6 4.6 Interest result 5.6 4.8 Income taxes paid -2.0 -2.2 ∆ Provisions 1.4 0.1 ∆ Net working capital -29.6 26.9 Other 0.3 -6.8 Cash f
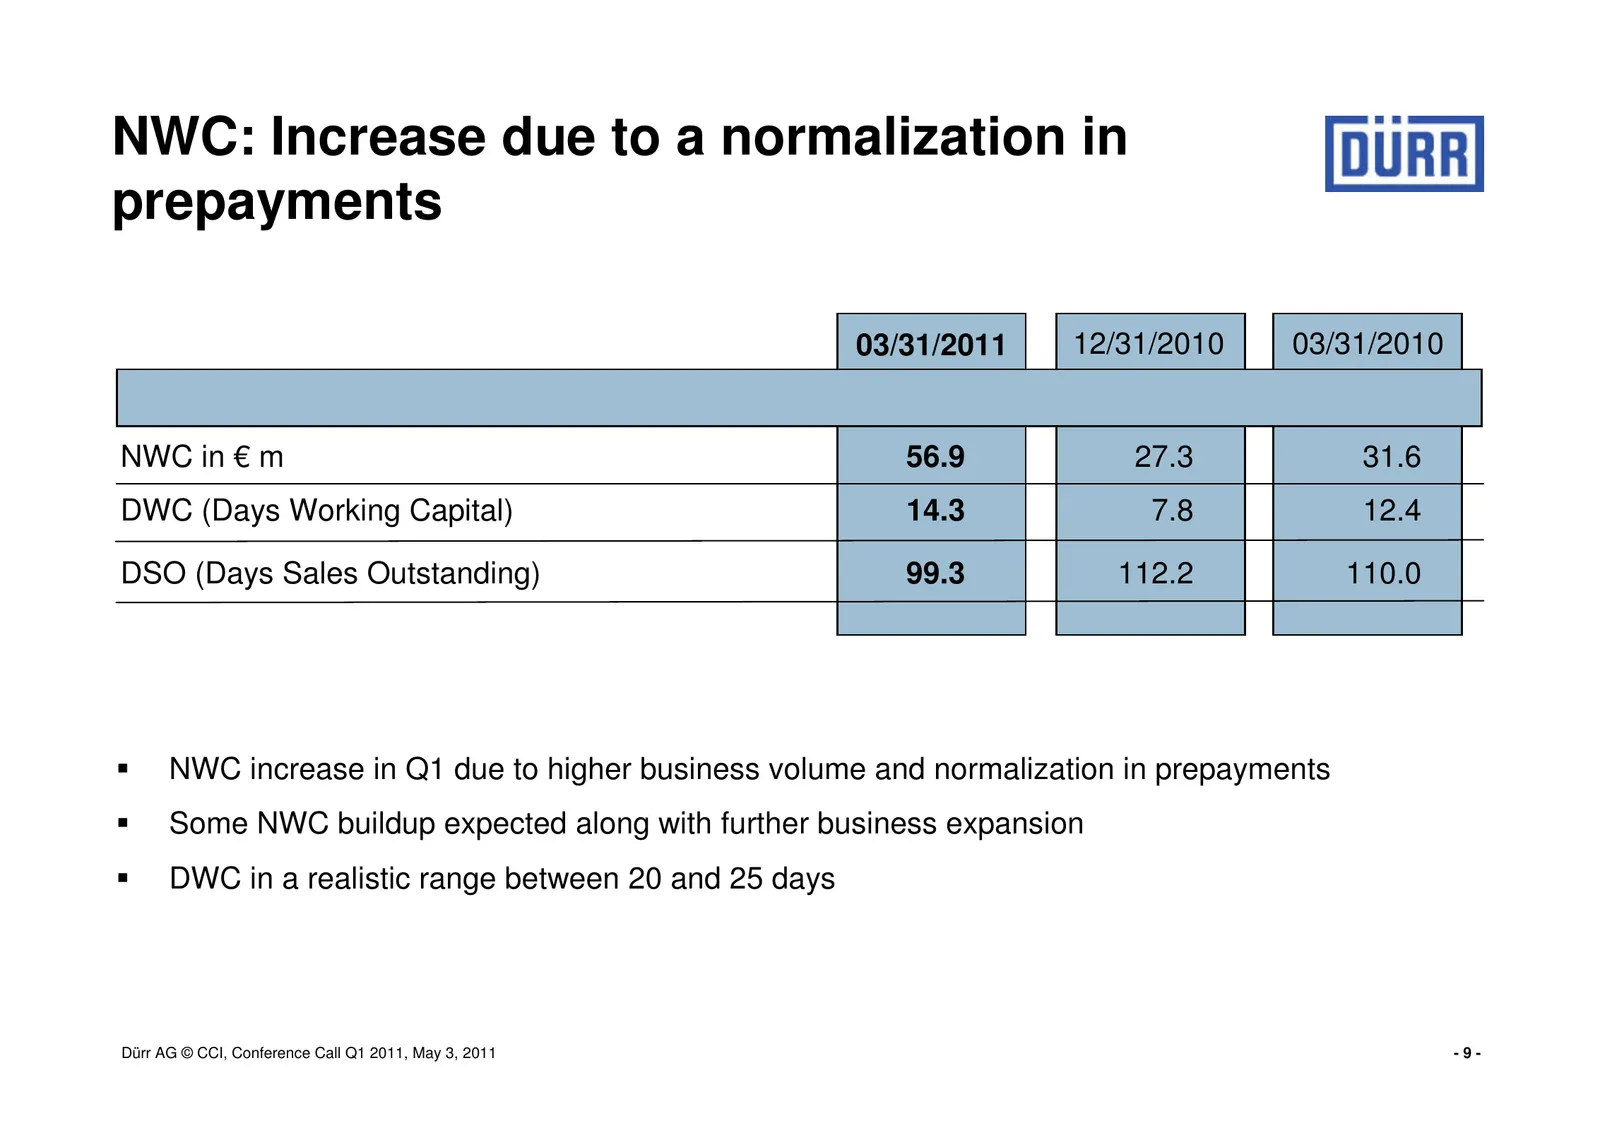
Slide 9: NWC: Increase due to a normalization in prepayments
NWC: Increase due to a normalization in prepayments 03/31/2011 12/31/2010 03/31/2010 NWC in € m 56.9 27.3 31.6 DWC (Days Working Capital) 14.3 7.8 12.4 DSO (Days Sales Outstanding) 99.3 112.2 110.0 NWC increase in Q1 due to higher business volume and normalization in prepayments Some NWC buildup exp
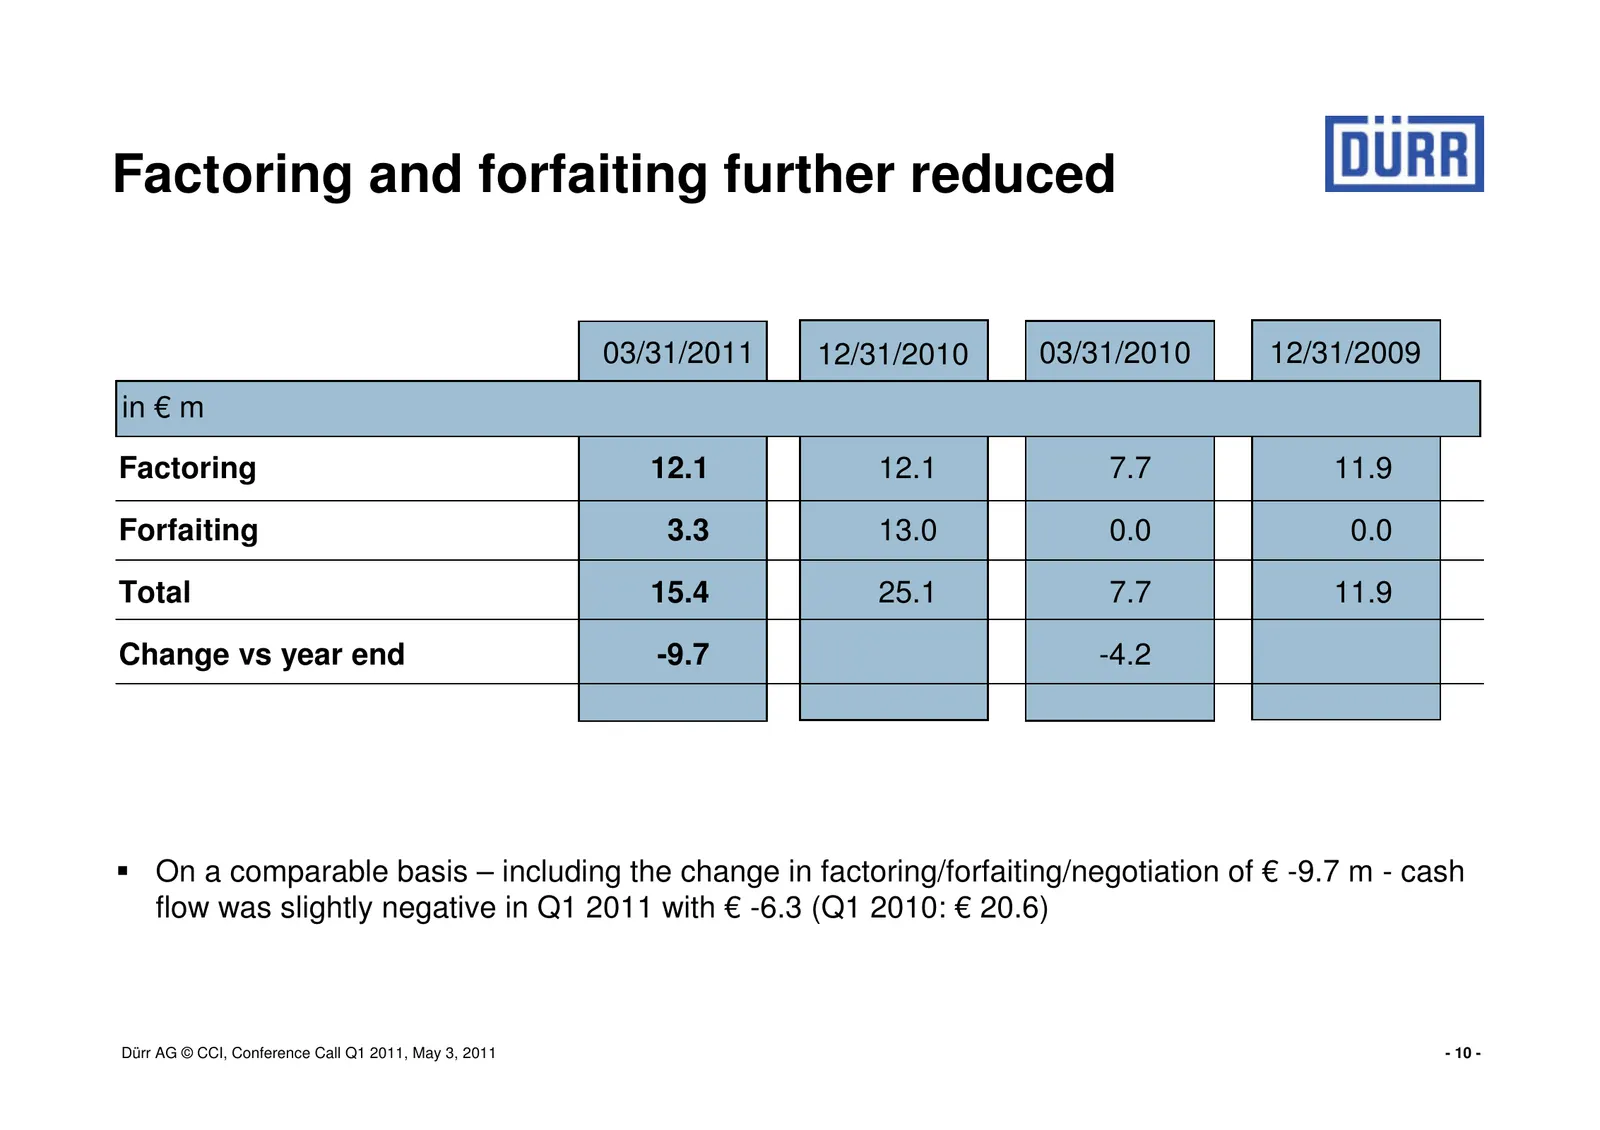
Slide 10: Factoring and forfaiting further reduced
Factoring and forfaiting further reduced 03/31/2011 12/31/2010 03/31/2010 12/31/2009 in € m Factoring 12.1 12.1 7.7 11.9 Forfaiting 3.3 13.0 0.0 0.0 Total 15.4 25.1 7.7 11.9 Change vs year end -9.7 -4.2 On a comparable basis – including the change in factoring/forfaiting/negotiation of € -9.7 m - ca
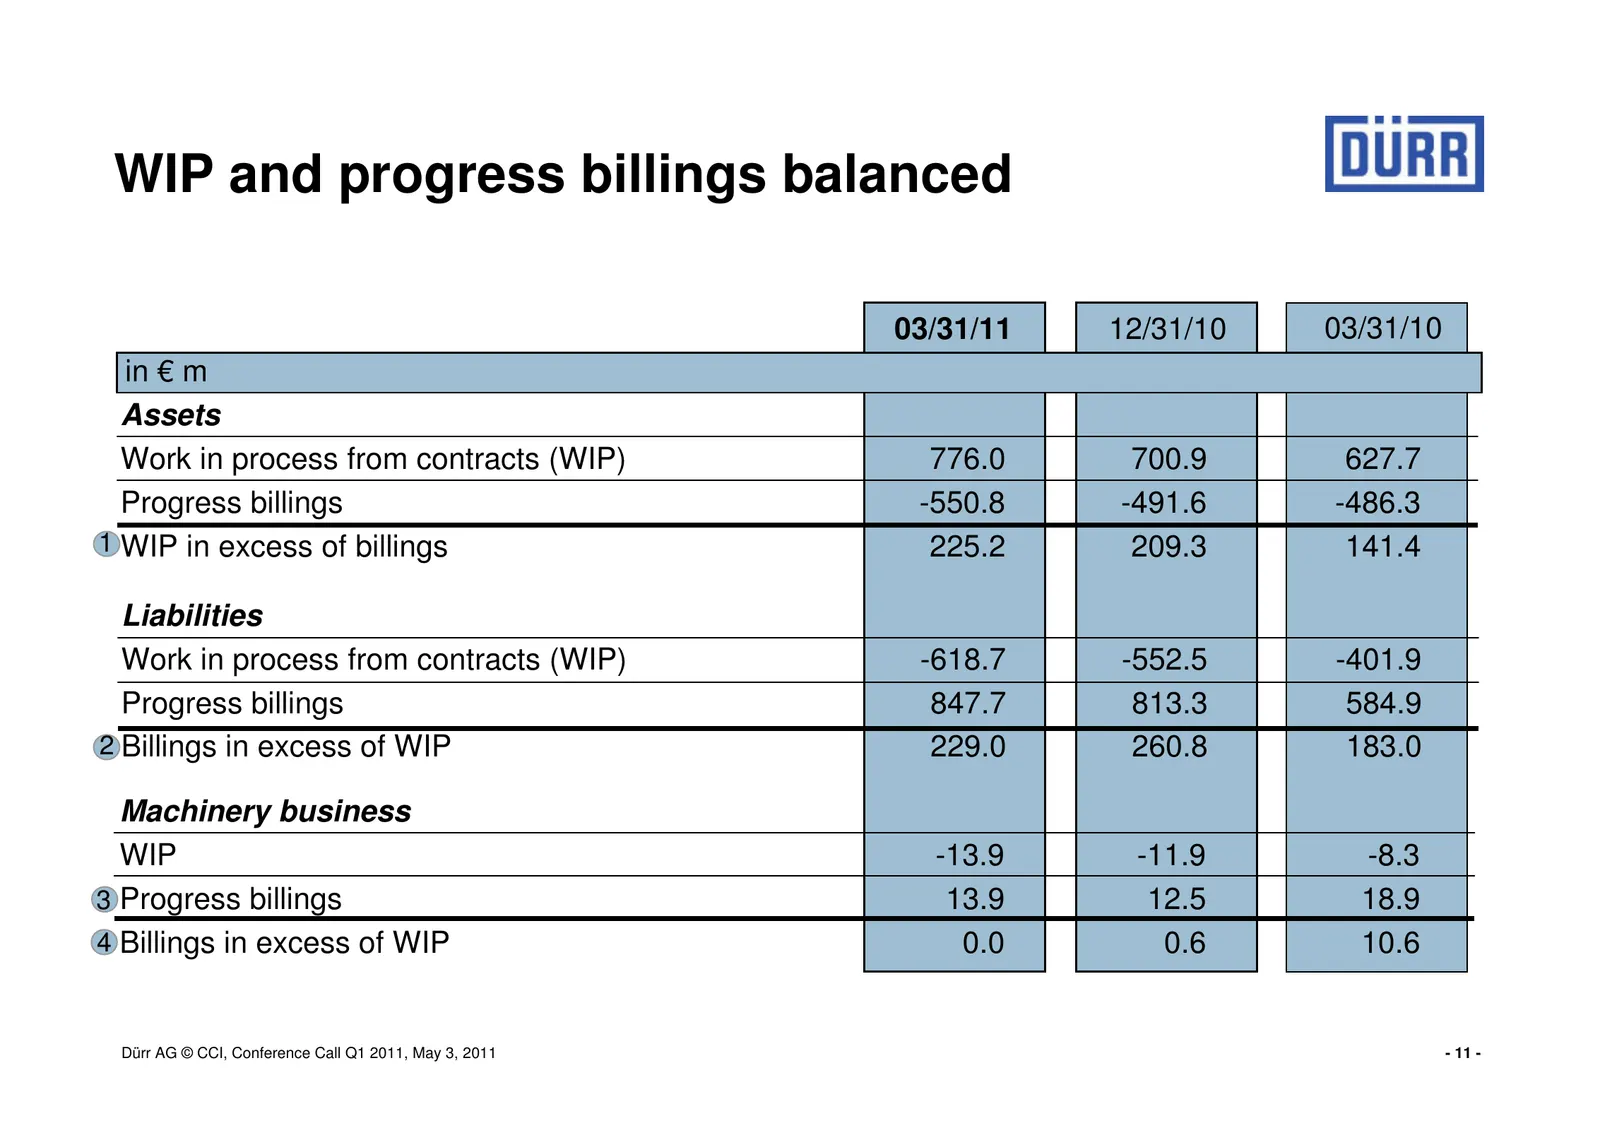
Slide 11: WIP and progress billings balanced
WIP and progress billings balanced 03/31/11 12/31/10 03/31/10 in € m Assets Work in process from contracts (WIP) 776.0 700.9 627.7 Progress billings -550.8 -491.6 -486.3 1 WIP in excess of billings 225.2 209.3 141.4 Liabilities Work in process from contracts (WIP) -618.7 -552.5 -401.9 Progress billi
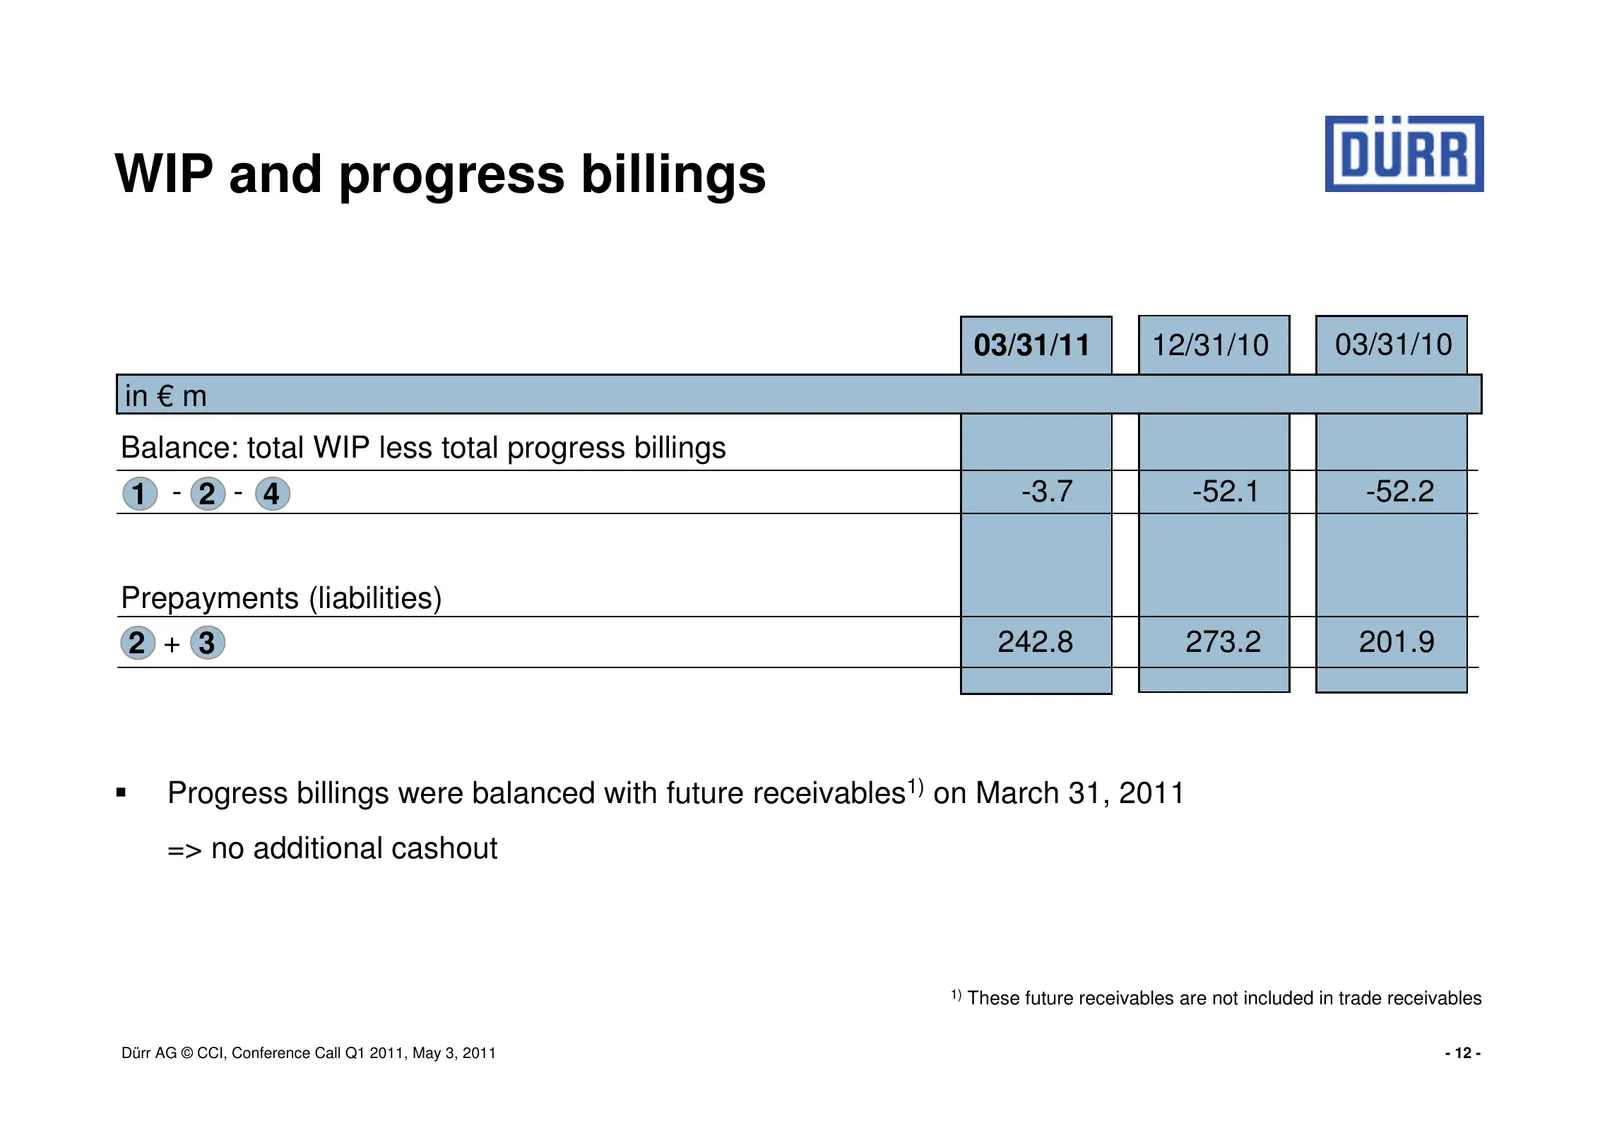
Slide 12: WIP and progress billings
WIP and progress billings 03/31/11 12/31/10 03/31/10 in € m Balance: total WIP less total progress billings 1 - 2 - 4 -3.7 -52.1 -52.2 Prepayments (liabilities) 2 + 3 242.8 273.2 201.9 Progress billings were balanced with future receivables1) on March 31, 2011 => no additional cashout 1) These futur
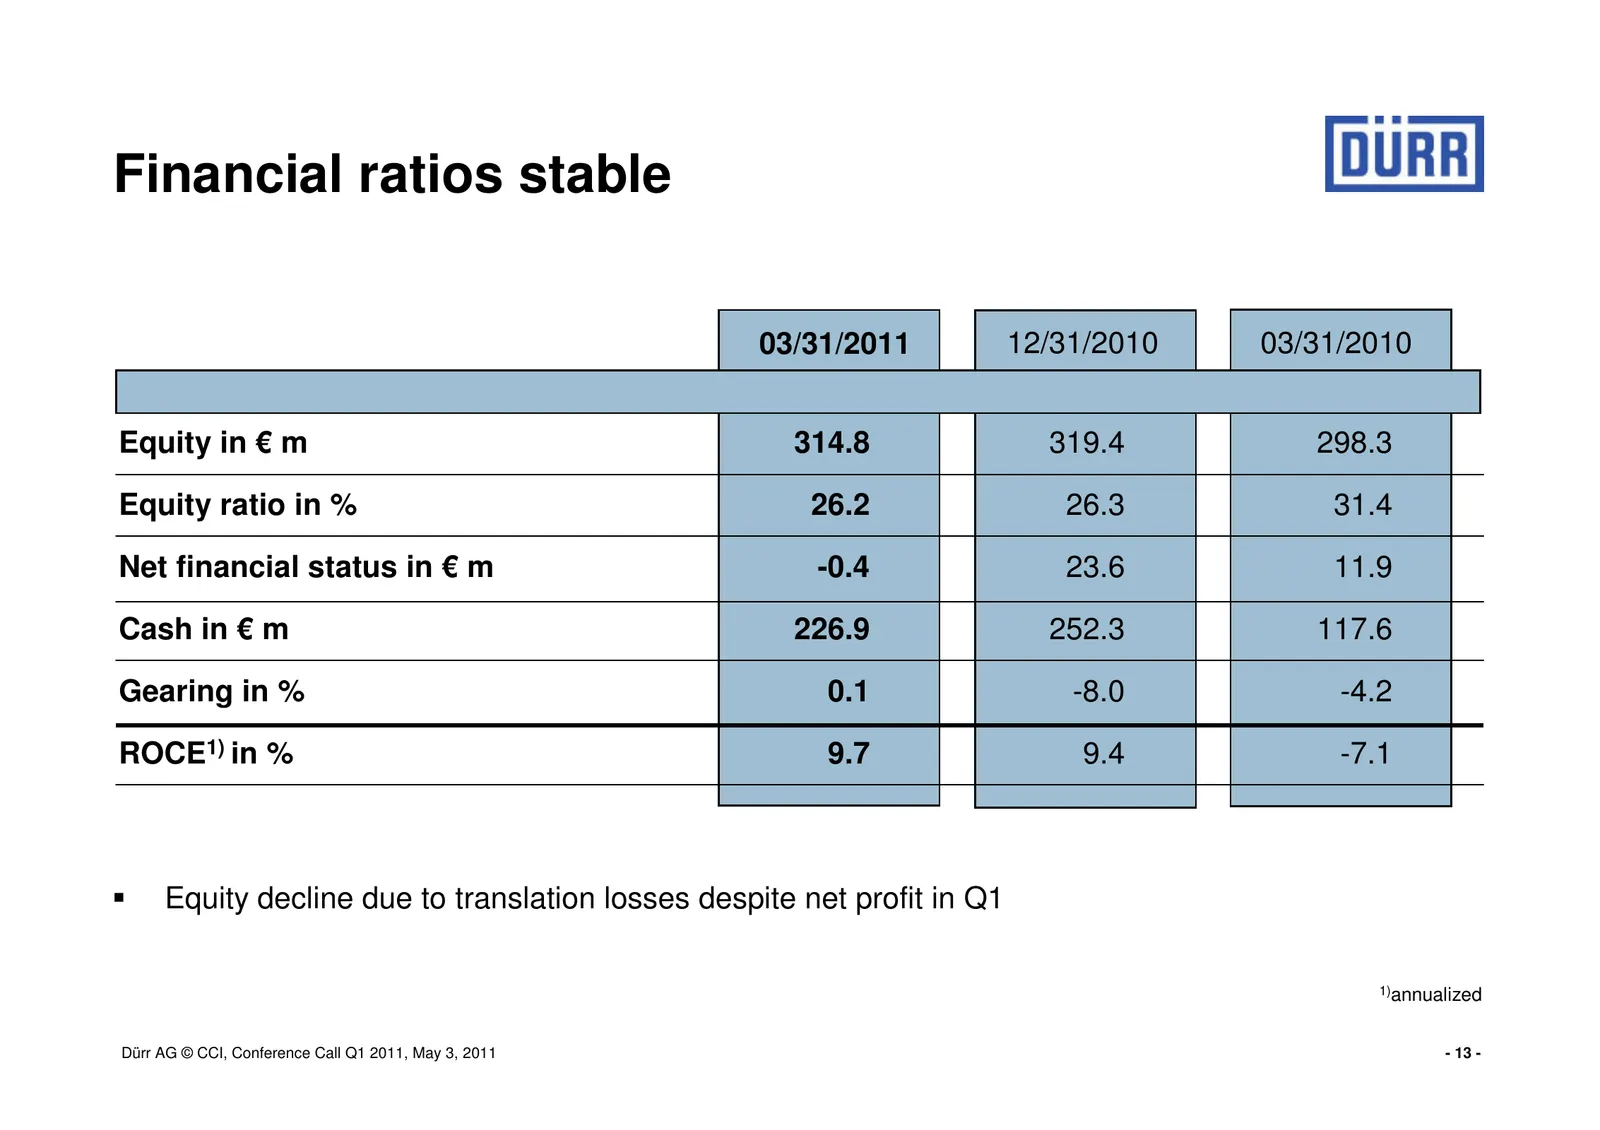
Slide 13: Financial ratios stable
Financial ratios stable 03/31/2011 12/31/2010 03/31/2010 Equity in € m 314.8 319.4 298.3 Equity ratio in % 26.2 26.3 31.4 Net financial status in € m -0.4 23.6 11.9 Cash in € m 226.9 252.3 117.6 Gearing in % 0.1 -8.0 -4.2 ROCE1) in % 9.7 9.4 -7.1 Equity decline due to translation losses despite net
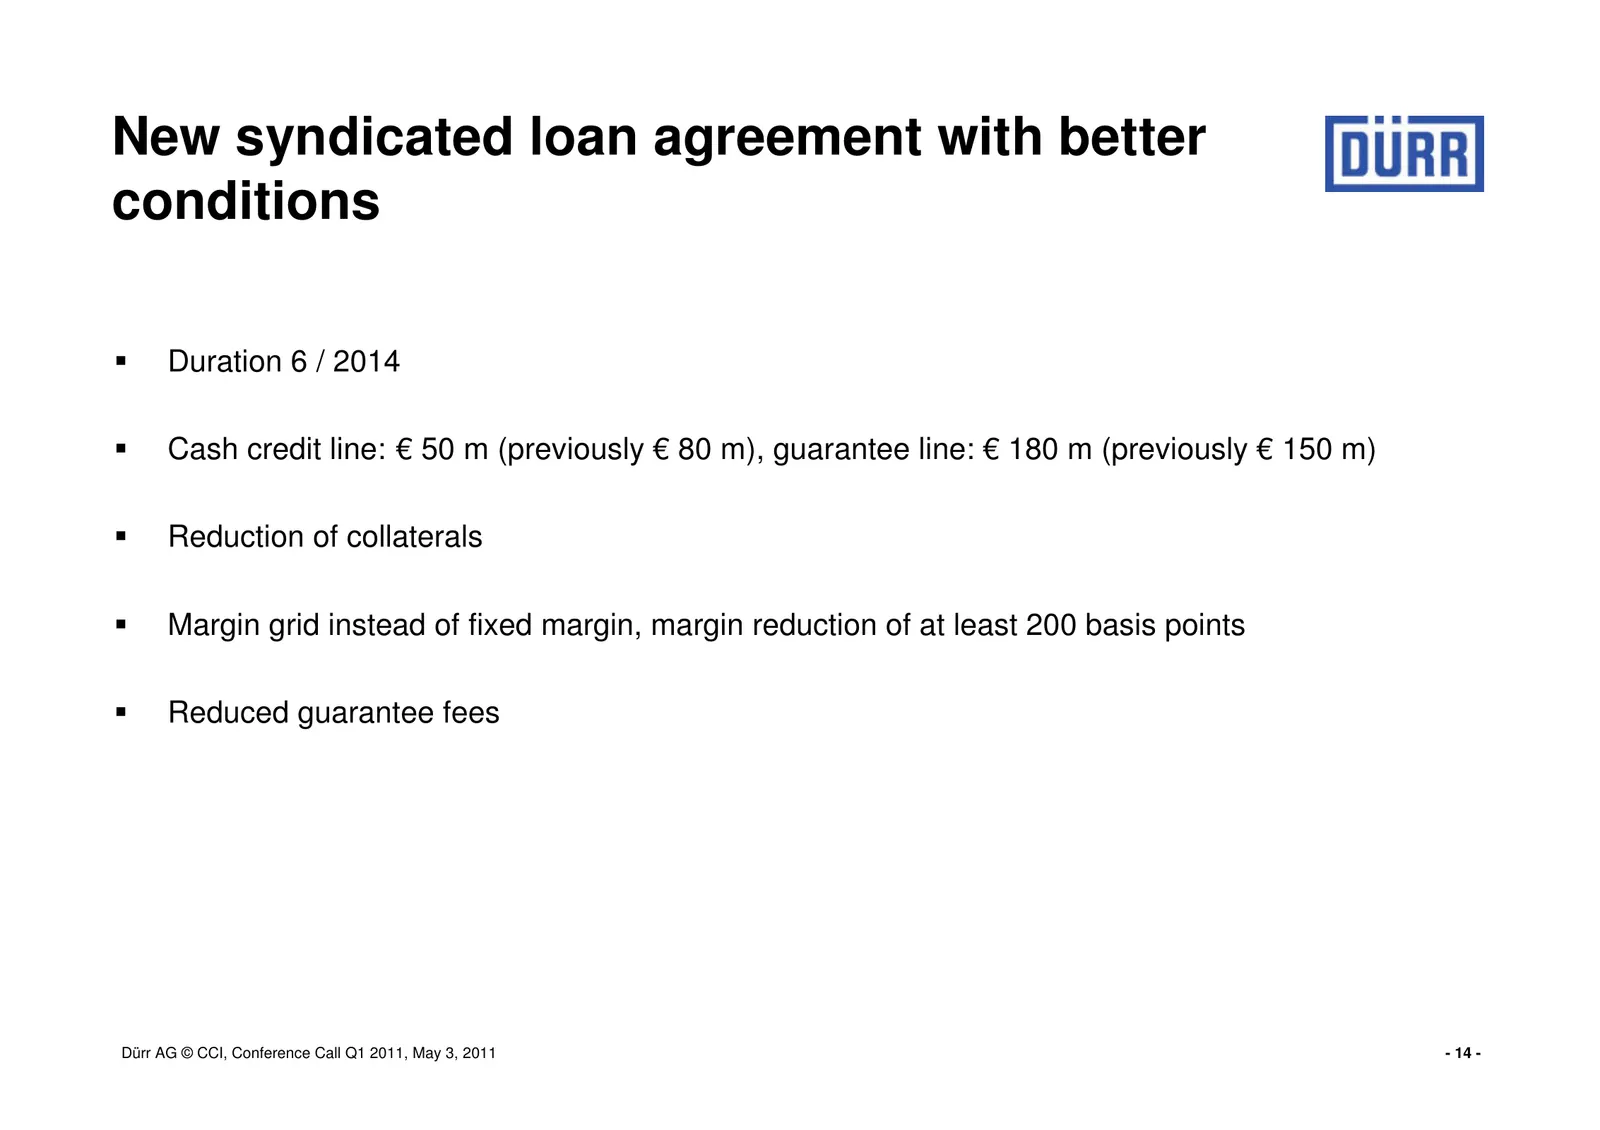
Slide 14: New syndicated loan agreement with better conditions
New syndicated loan agreement with better conditions Duration 6 / 2014 Cash credit line: € 50 m (previously € 80 m), guarantee line: € 180 m (previously € 150 m) Reduction of collaterals Margin grid instead of fixed margin, margin reduction of at least 200 basis points Reduced guarantee fees Dürr AG
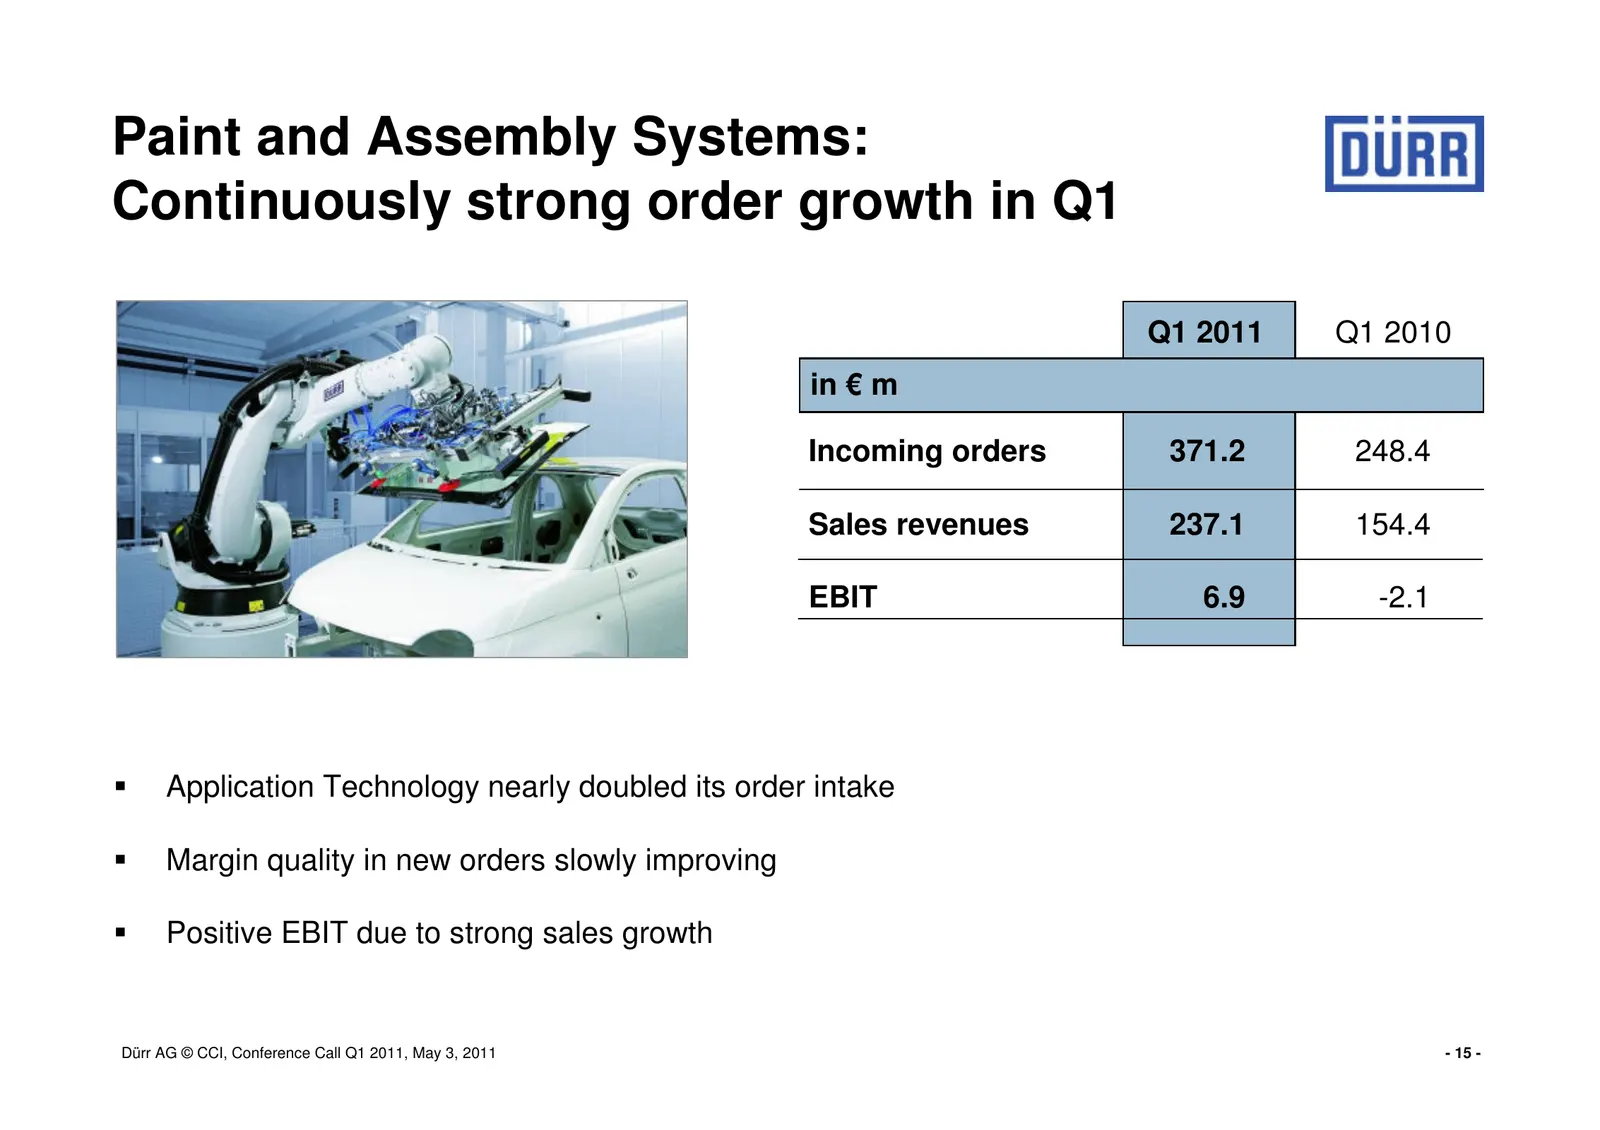
Slide 15: Paint and Assembly Systems: Continuously strong order growth in Q1
Paint and Assembly Systems: Continuously strong order growth in Q1 Q1 2011 Q1 2010 in € m Incoming orders 371.2 248.4 Sales revenues 237.1 154.4 EBIT 6.9 -2.1 Application Technology nearly doubled its order intake Margin quality in new orders slowly improving Positive EBIT due to strong sales growth
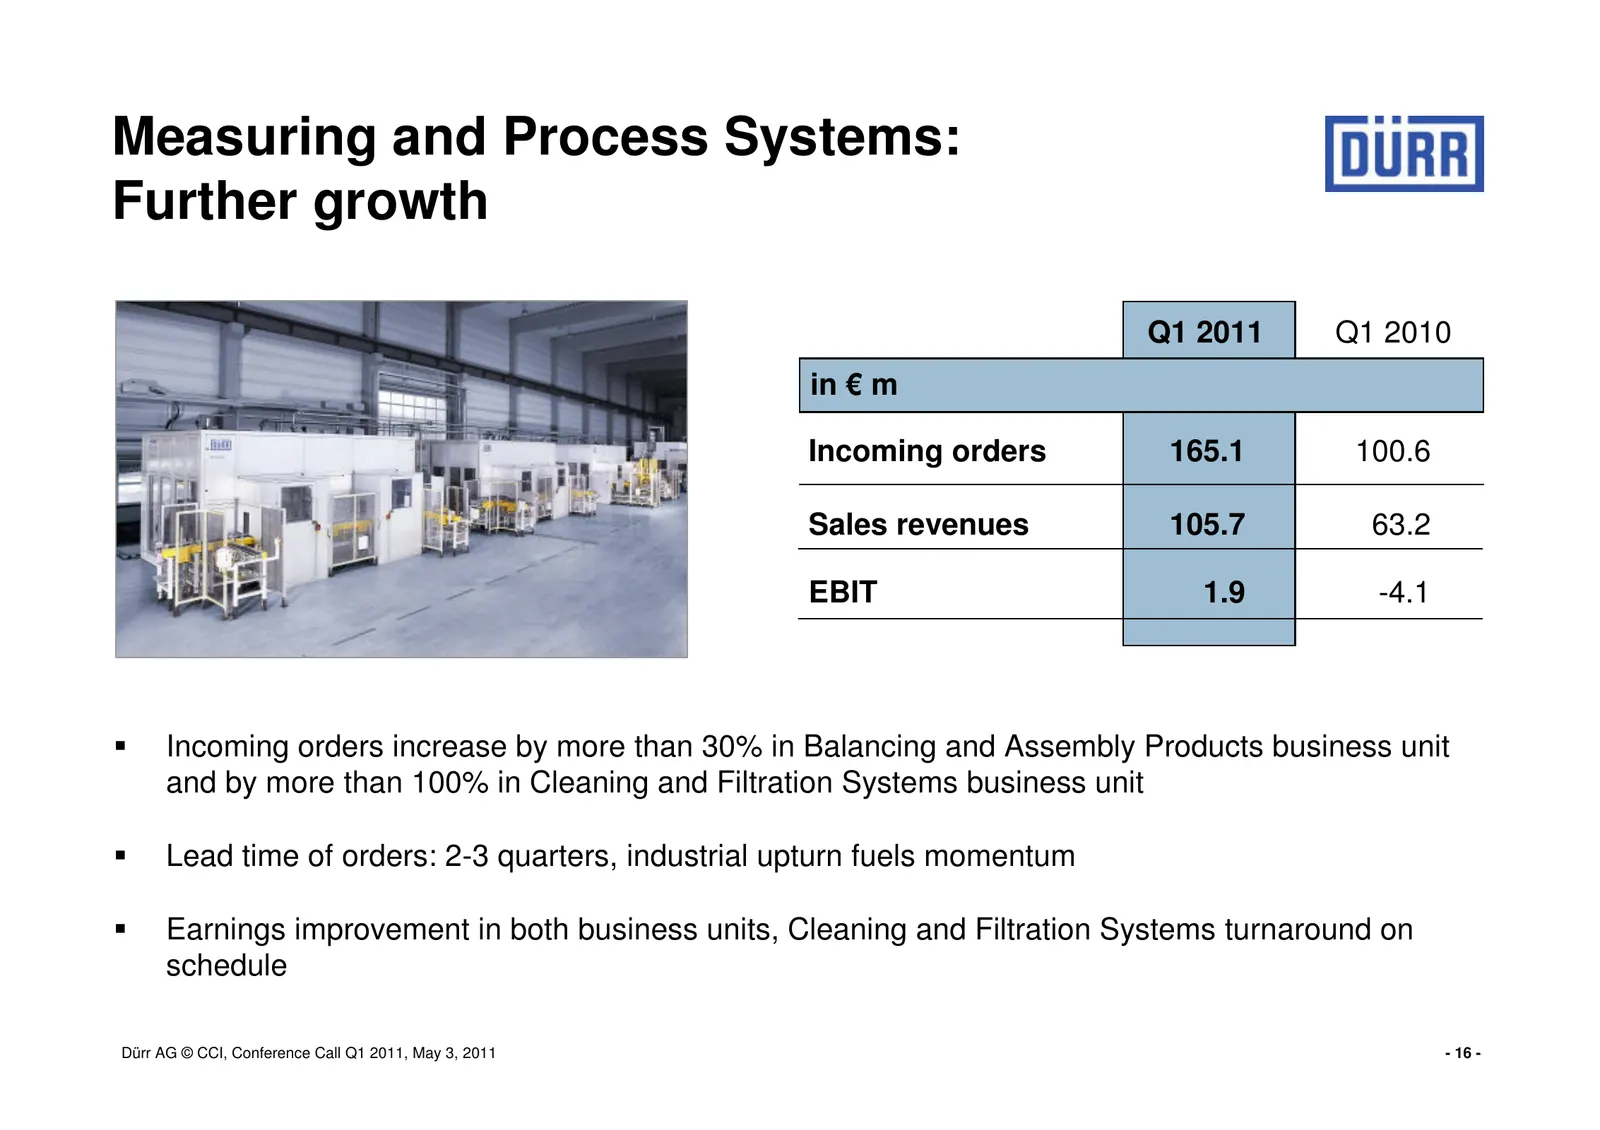
Slide 16: Measuring and Process Systems: Further growth
Measuring and Process Systems: Further growth Q1 2011 Q1 2010 in € m Incoming orders 165.1 100.6 Sales revenues 105.7 63.2 EBIT 1.9 -4.1 Incoming orders increase by more than 30% in Balancing and Assembly Products business unit and by more than 100% in Cleaning and Filtration Systems business unit L
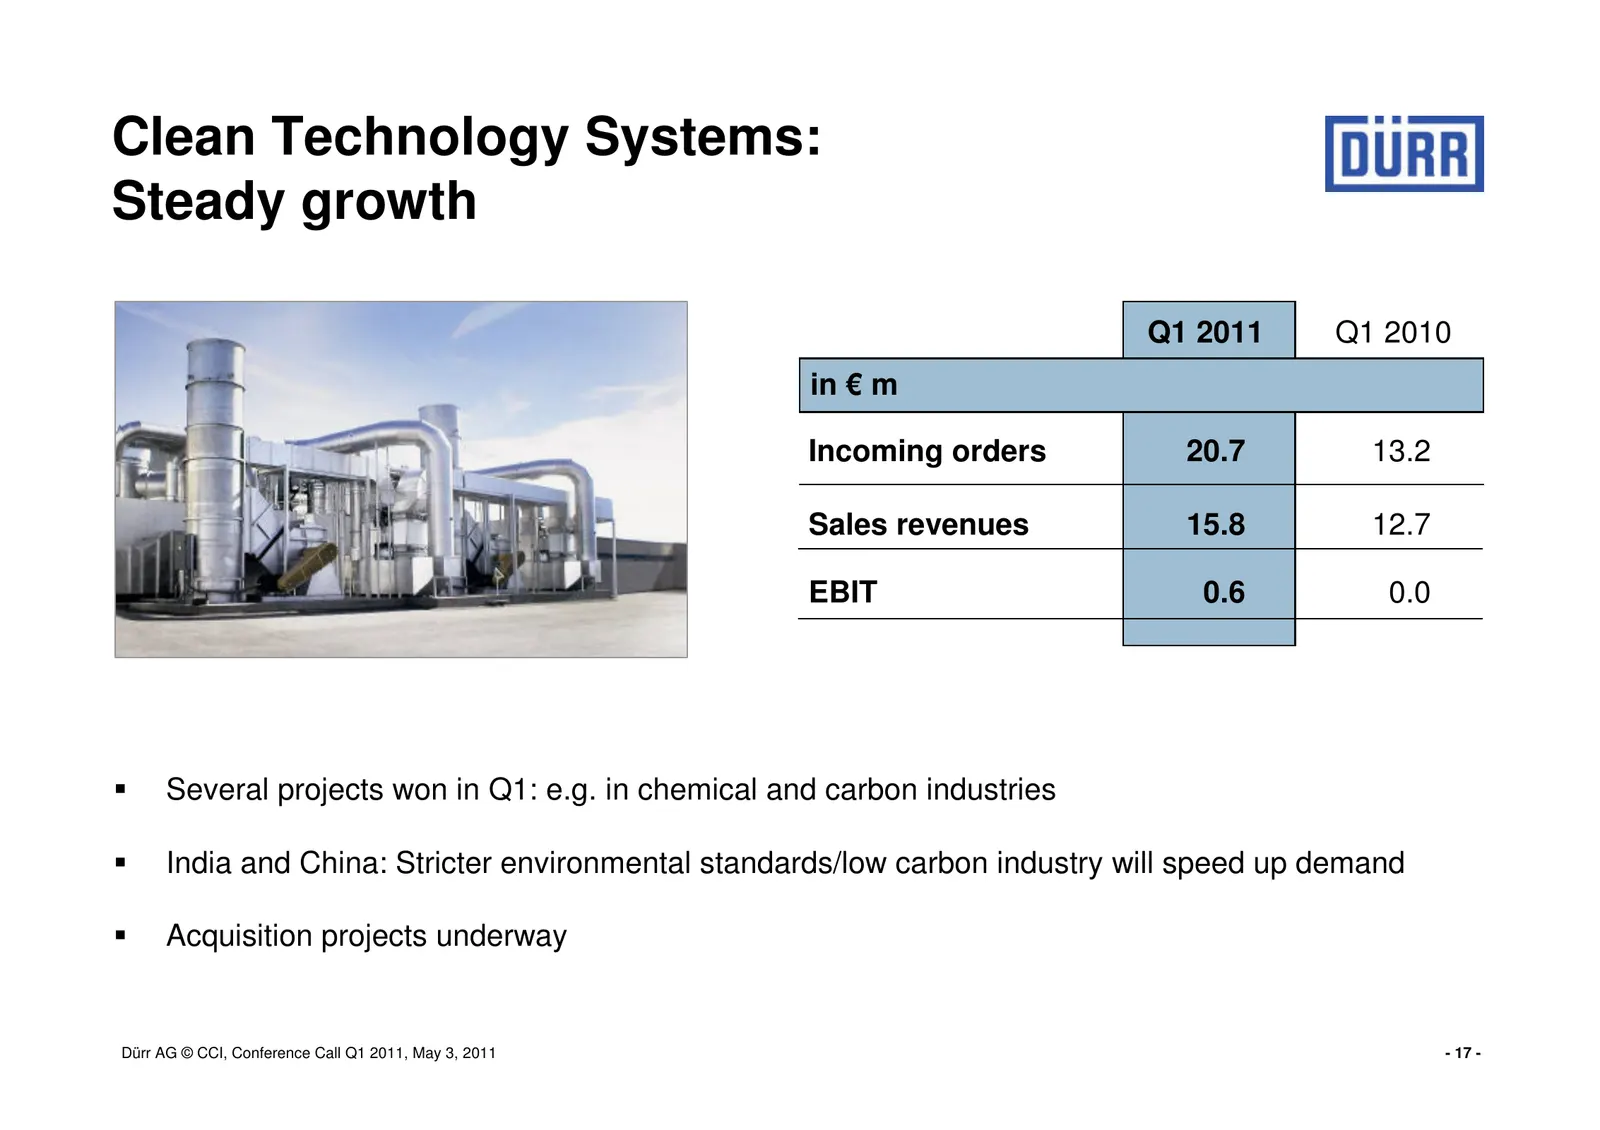
Slide 17: Clean Technology Systems: Steady growth
Clean Technology Systems: Steady growth Q1 2011 Q1 2010 in € m Incoming orders 20.7 13.2 Sales revenues 15.8 12.7 EBIT 0.6 0.0 Several projects won in Q1: e.g. in chemical and carbon industries India and China: Stricter environmental standards/low carbon industry will speed up demand Acquisition pro
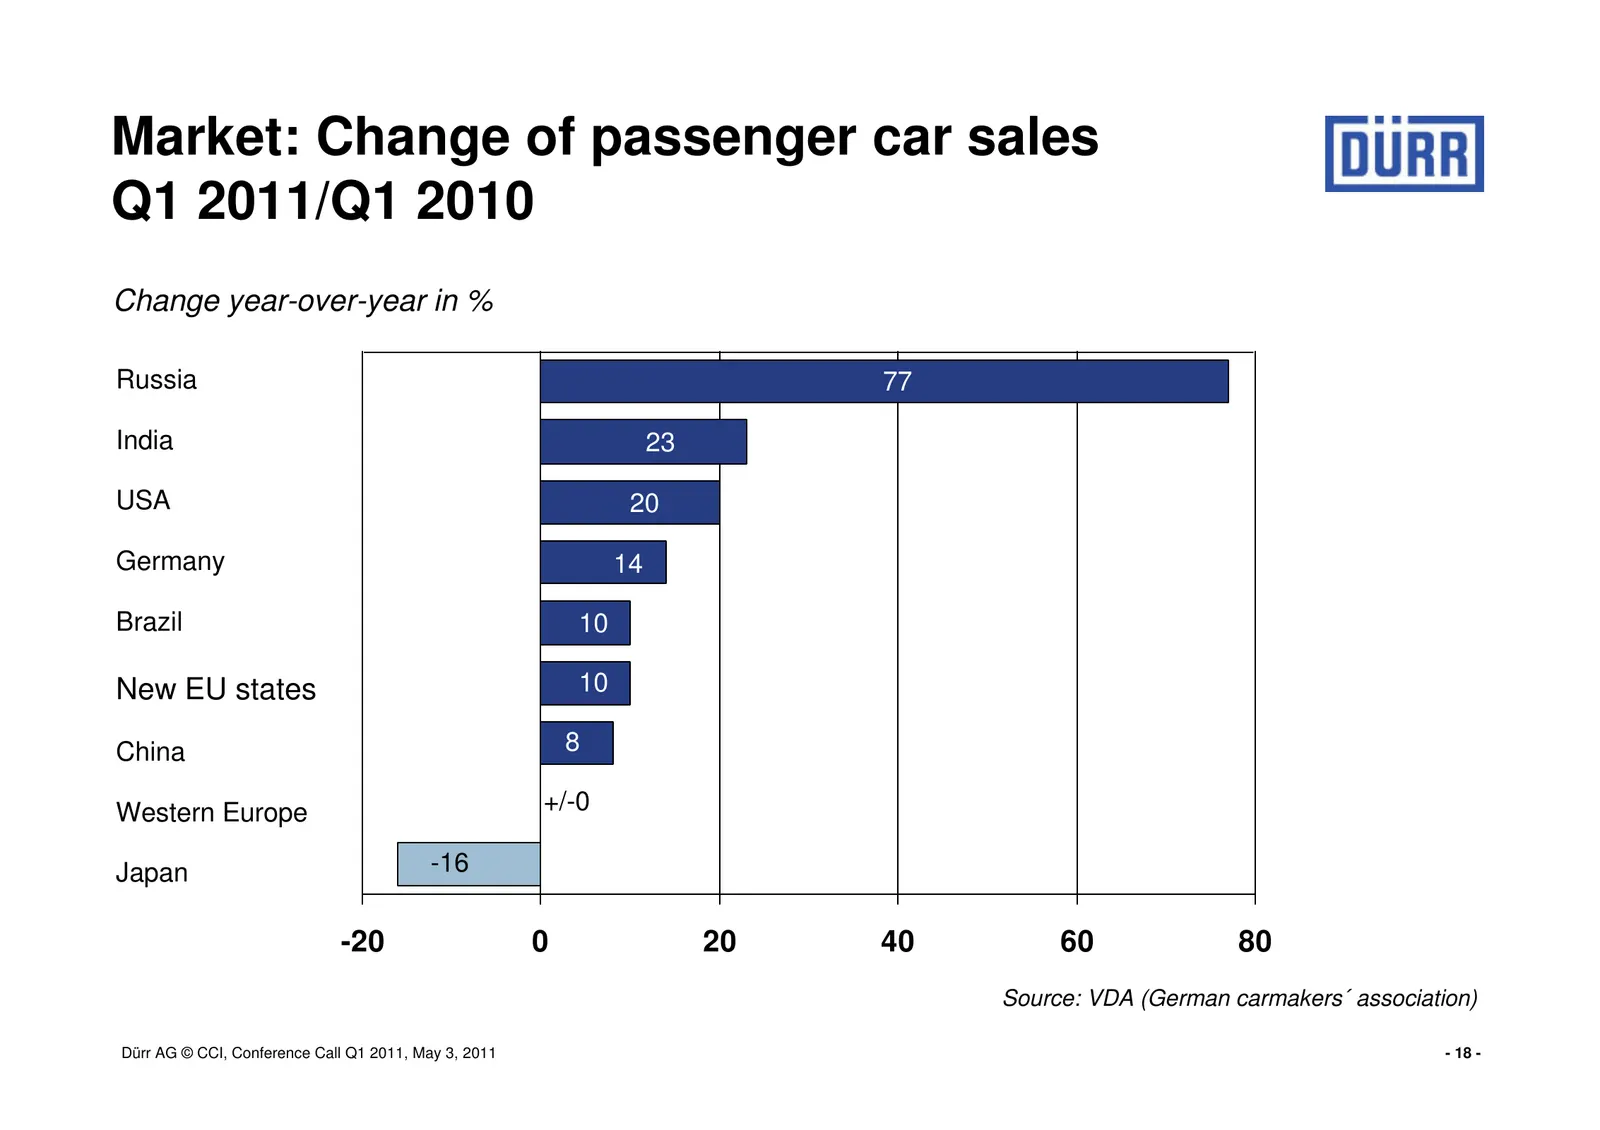
Slide 18: Market: Change of passenger car sales Q1 2011/Q1 2010
Market: Change of passenger car sales Q1 2011/Q1 2010 Change year-over-year in % Russia 77 India 23 USA 20 Germany 14 Brazil 10 New EU states 10 China 8 Western Europe +/-0 Japan -16 -20 0 20 40 60 80 Source: VDA (German carmakers´ association) Dürr AG © CCI, Conference Call Q1 2011, May 3, 2011 - 1
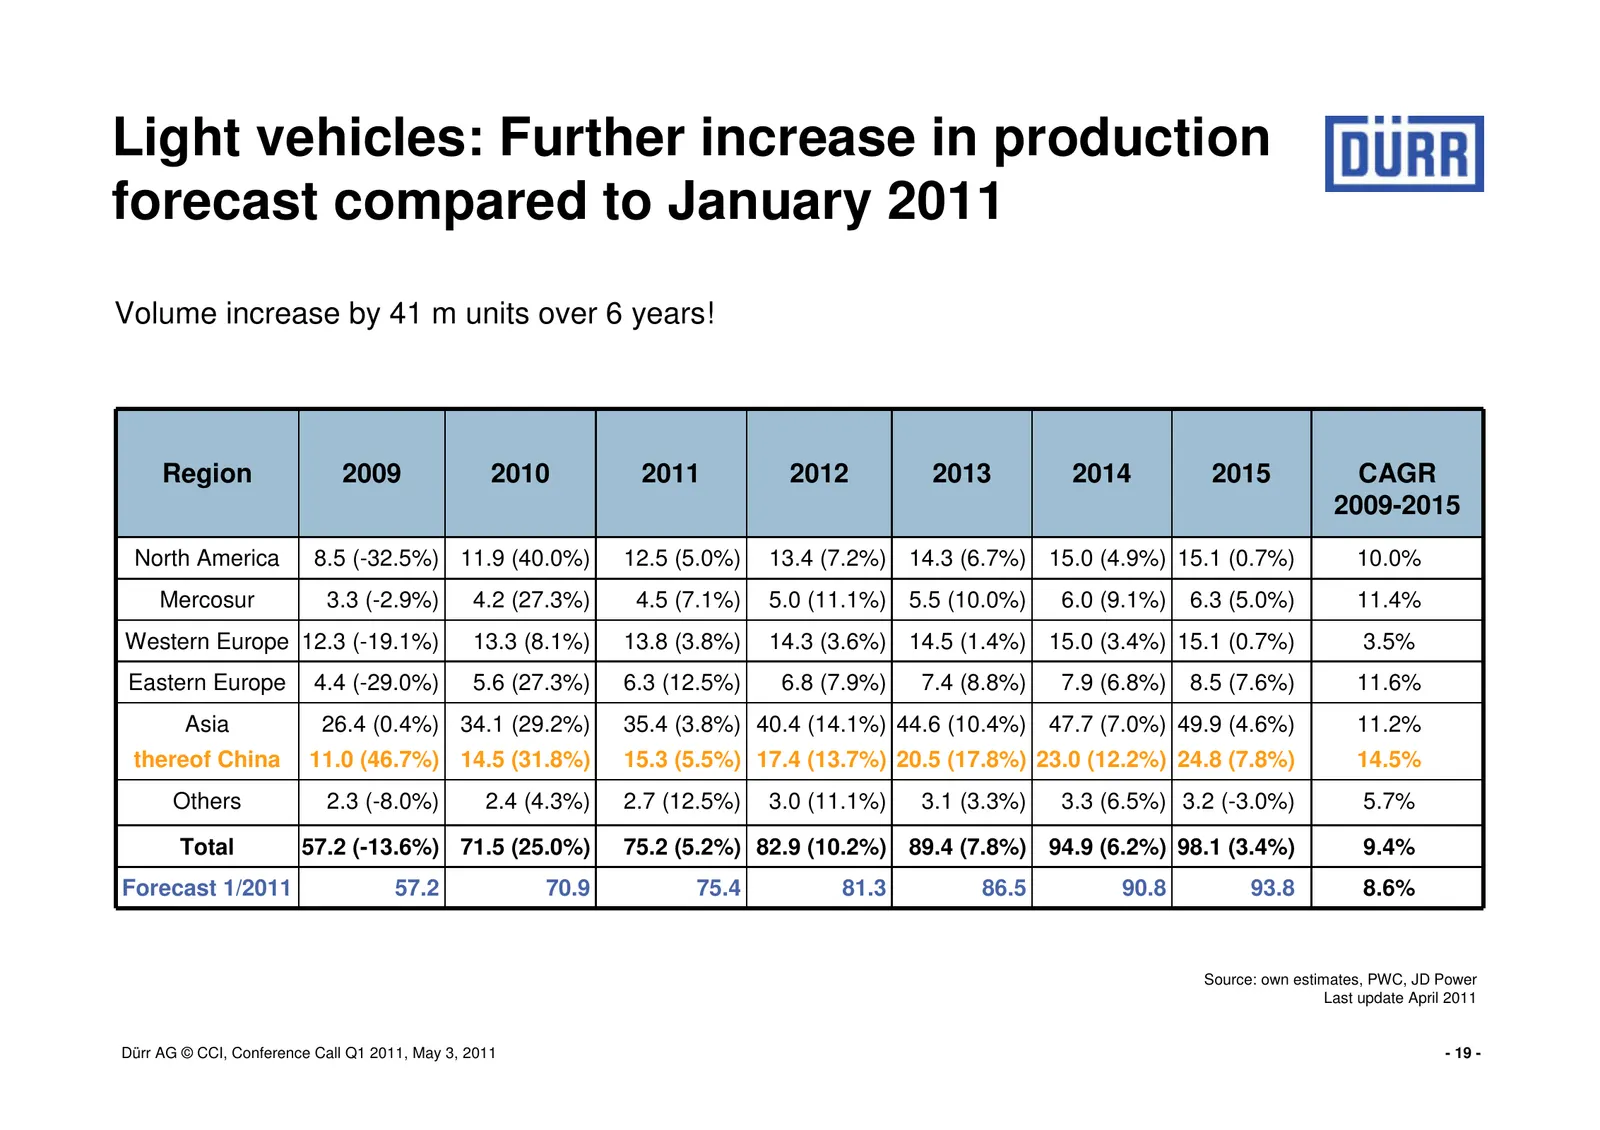
Slide 19: Light vehicles: Further increase in production forecast compared to January 2011
Light vehicles: Further increase in production forecast compared to January 2011 Volume increase by 41 m units over 6 years! Region 2009 2010 2011 2012 2013 2014 2015 CAGR 2009-2015 North America 8.5 (-32.5%) 11.9 (40.0%) 12.5 (5.0%) 13.4 (7.2%) 14.3 (6.7%) 15.0 (4.9%) 15.1 (0.7%) 10.0% Mercosur 3.3
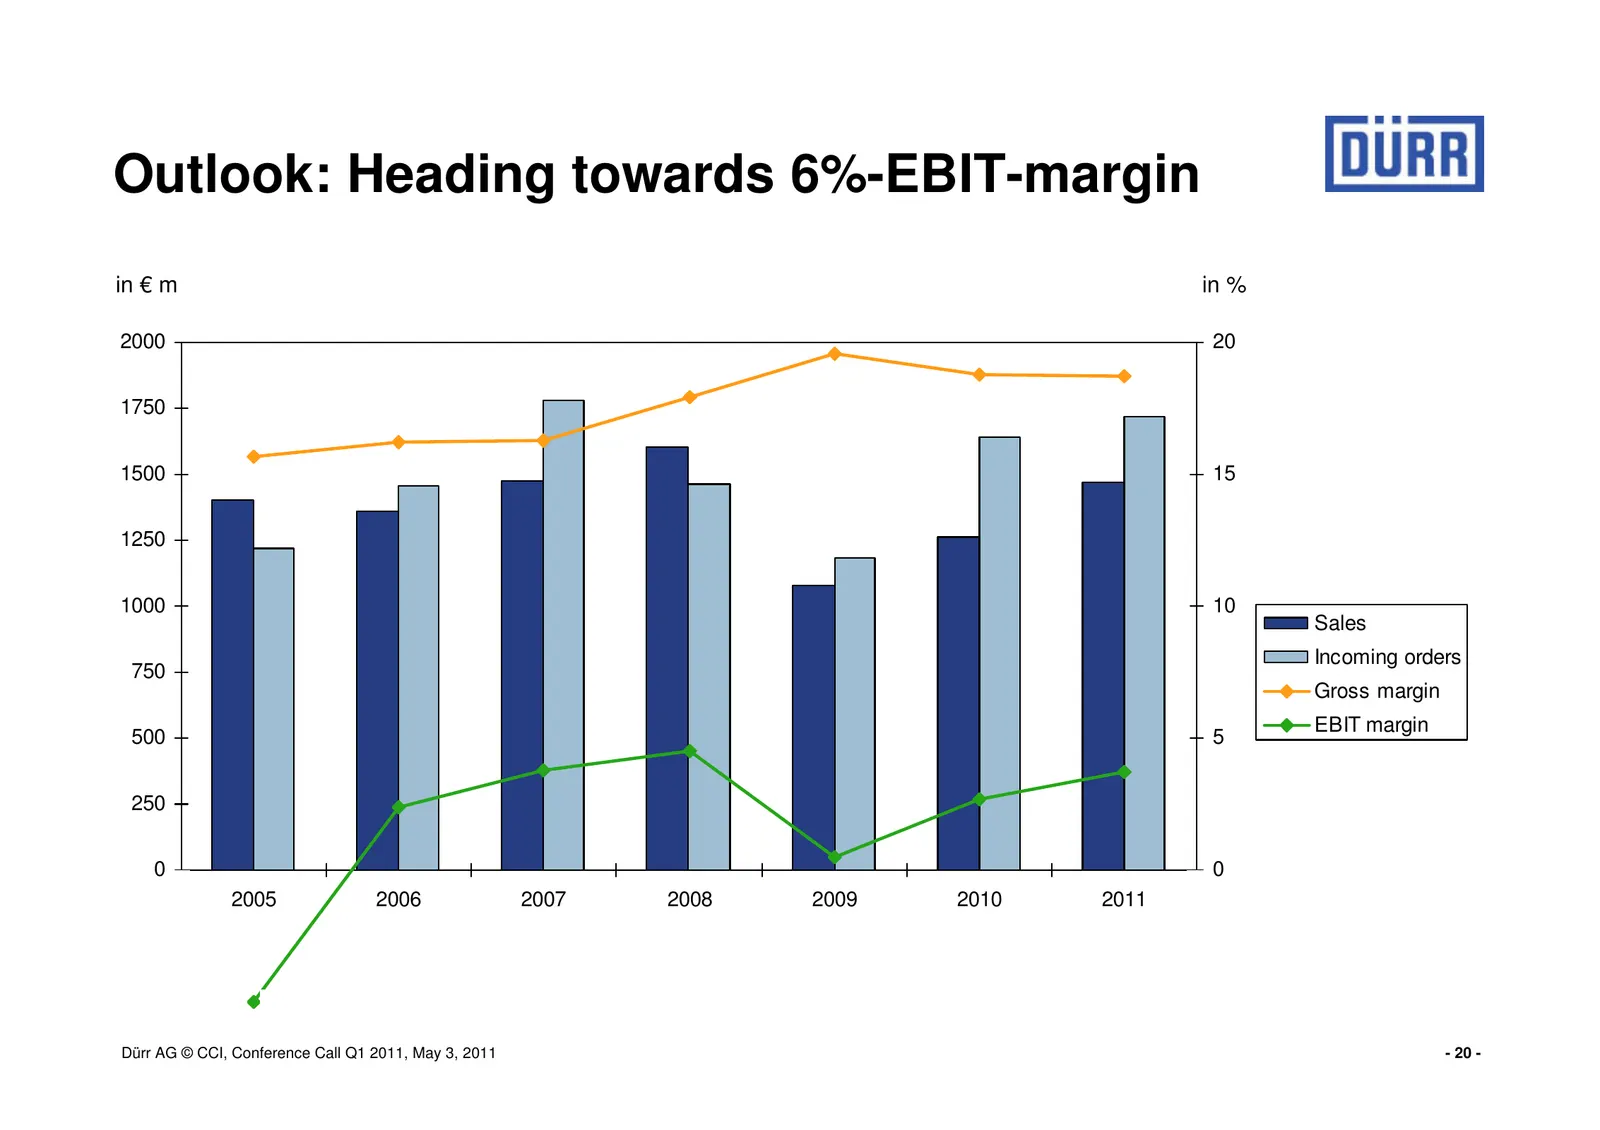
Slide 20: Outlook: Heading towards 6%-EBIT-margin
Outlook: Heading towards 6%-EBIT-margin in € m in % 2000 20 1750 1500 15 1250 1000 10 Sales Incoming orders 750 Gross margin EBIT margin 500 5 250 0 0 2005 2006 2007 2008 2009 2010 2011 -250 -500 -5 Dürr AG © CCI, Conference Call Q1 2011, May 3, 2011 - 20 -
Slide 21: Shareholder structure: Increasing free float
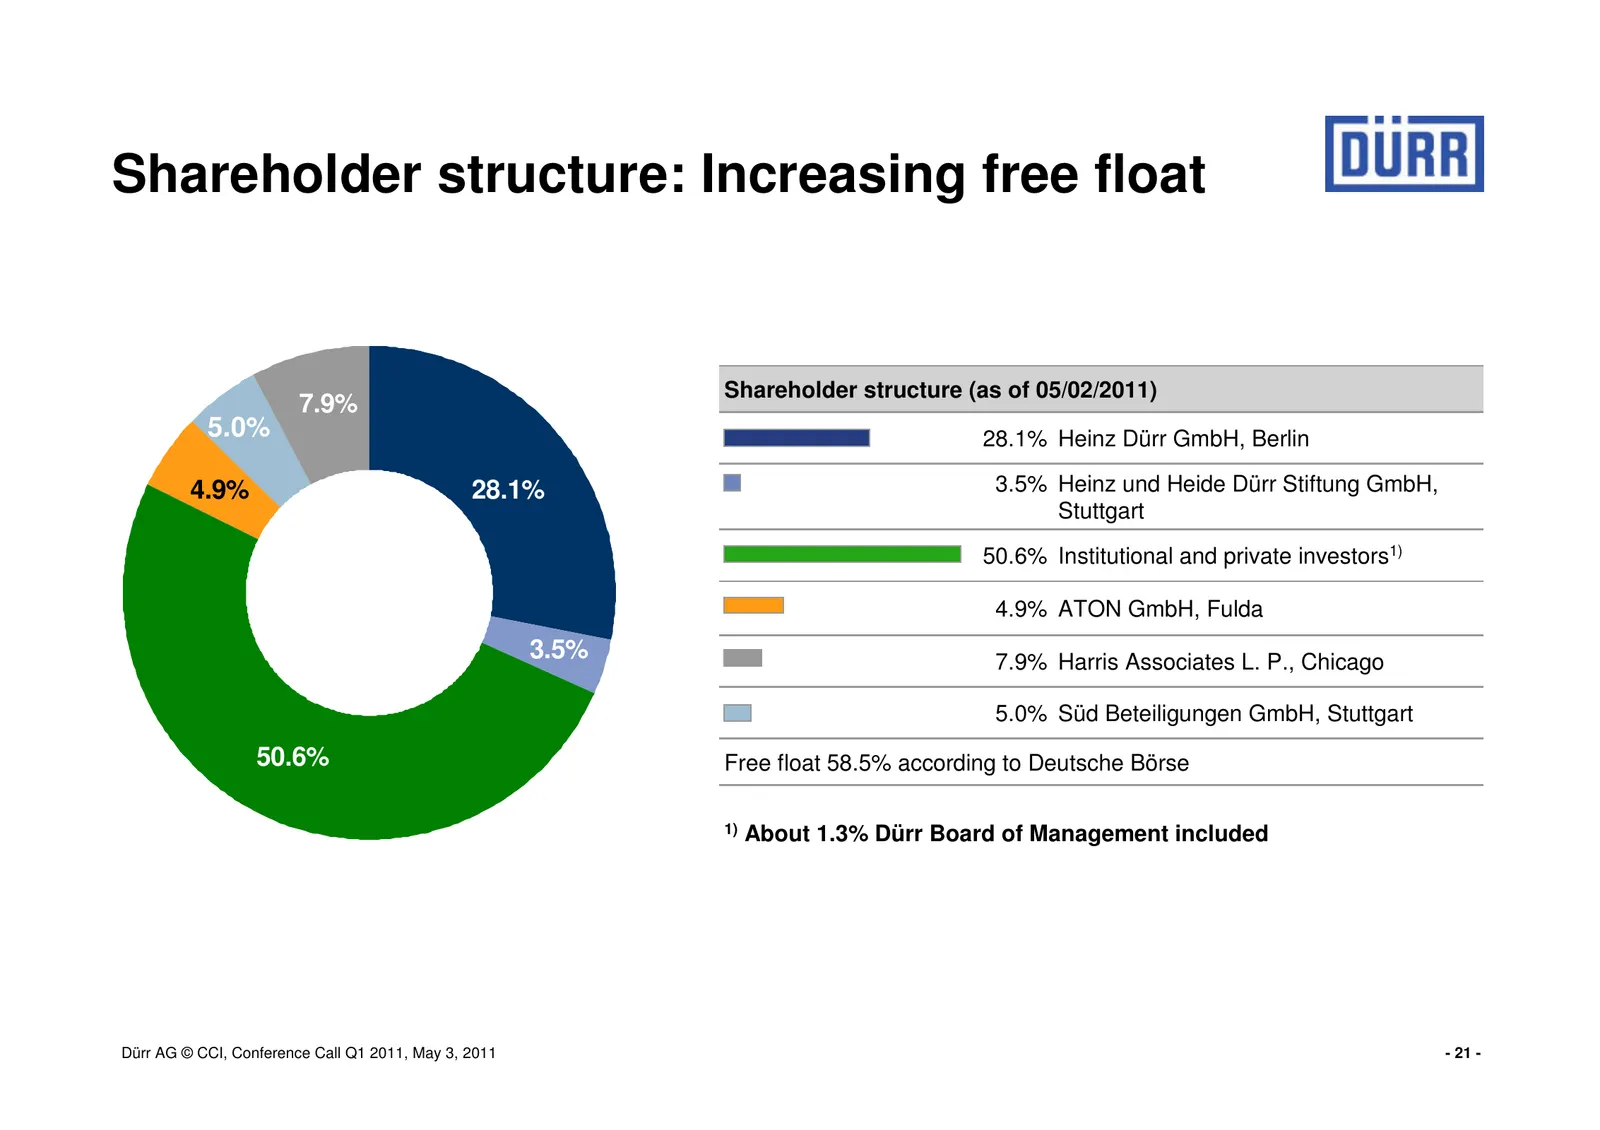
Shareholder structure: Increasing free float Shareholder structure (as of 05/02/2011) 7.9% 5.0% 28.1% Heinz Dürr GmbH, Berlin 4.9% 28.1% 3.5% Heinz und Heide Dürr Stiftung GmbH, Stuttgart 50.6% Institutional and private investors1) 4.9% ATON GmbH, Fulda 3.5% 7.9% Harris Associates L. P., Chicago 5.0
Slide 22: Summary
Summary Q1 better than expected, continued demand, project pipeline still strong Further improvement of long term market outlook (PWC) Refinancing activities finalized with new syndicated loan contract Several acquisitions planned Outlook 2011 supported by sales and incoming orders. Gross margin sho
Slide 23: Financial calendar
Financial calendar 05/06/2011 Annual general meeting, Bietigheim-Bissingen 08/04/2011 Interim financial report for the first half of 2011 11/03/2011 Interim report for the first nine months of 2011 Contact: Dürr Aktiengesellschaft Günter Dielmann Corporate Communications & Investor Relations Carl-Be
Source: Internet Archive copy of durr.com
More decks from Durr AG
 Q3 2026 Earnings Presentation33 slides · Nov 12, 2026
 Q2 2026 Earnings Presentation39 slides · Aug 6, 2026
 Q1 2026 Earnings Presentation35 slides · May 12, 2026
 Fact Sheet (2025)2 slides · Dec 2, 2025
 Q3 2025 Earnings Presentation46 slides · Nov 13, 2025
 Q2 2025 Earnings Presentation31 slides · Jul 24, 2025