CNX Midstream Partners LP — Barclays CEO Energy-Power Conference 2020
21 slides from CNX Midstream Partners LP's conference presentation, Sep 9, 2020
Slide 1: A Differentiated Company
Filed by CNX Resources Corporation Commission File No.: 001-14901 Pursuant to Rule 425 under the Securities Act of 1933 Subject Company: CNX Midstream Partners LP Commission File No.: 001-36635 Date: September 9, 2020 September 9, 2020 Barclays CEO Energy-Power Conference A Differentiated Company
Slide 2: Cautionary Language
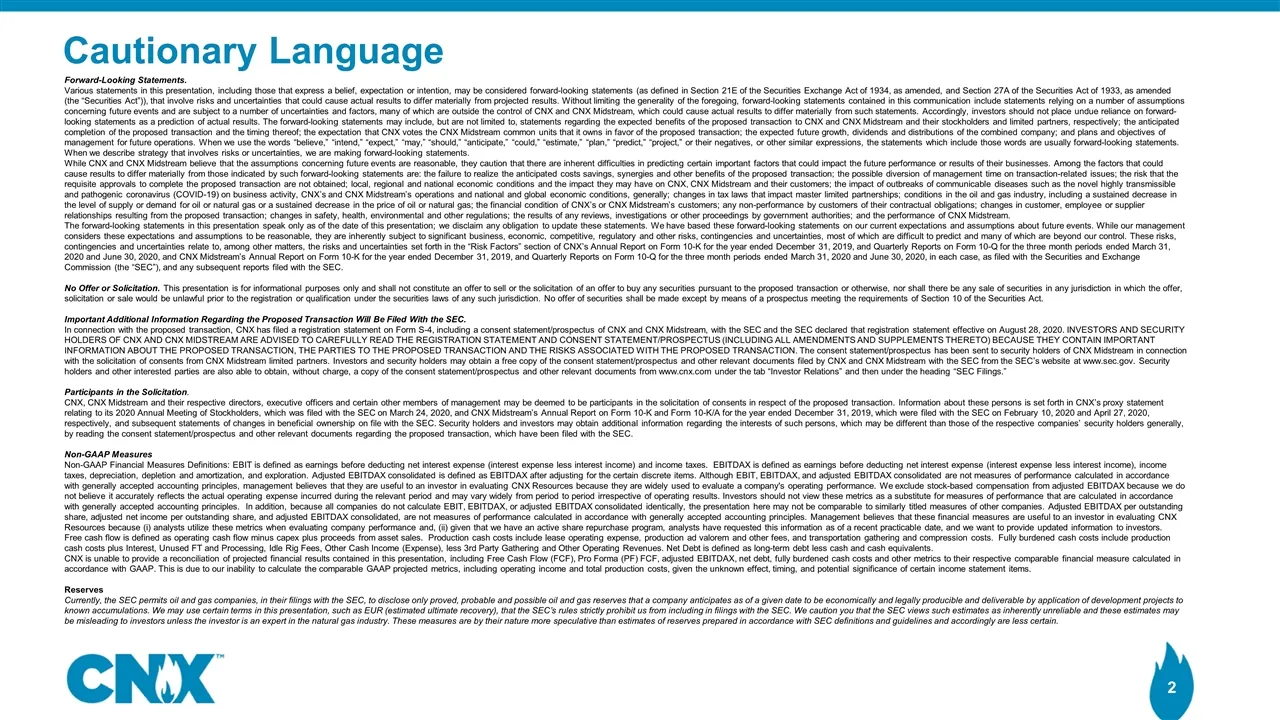
Cautionary Language Forward-Looking Statements. Various statements in this presentation, including those that express a belief, expectation or intention, may be considered forward-looking statements (as defined in Section 21E of the Securities Exchange Act of 1934, as amended, and Section 27A of the
Slide 3: Low Risk 7-Year Free Cash Flow Plan
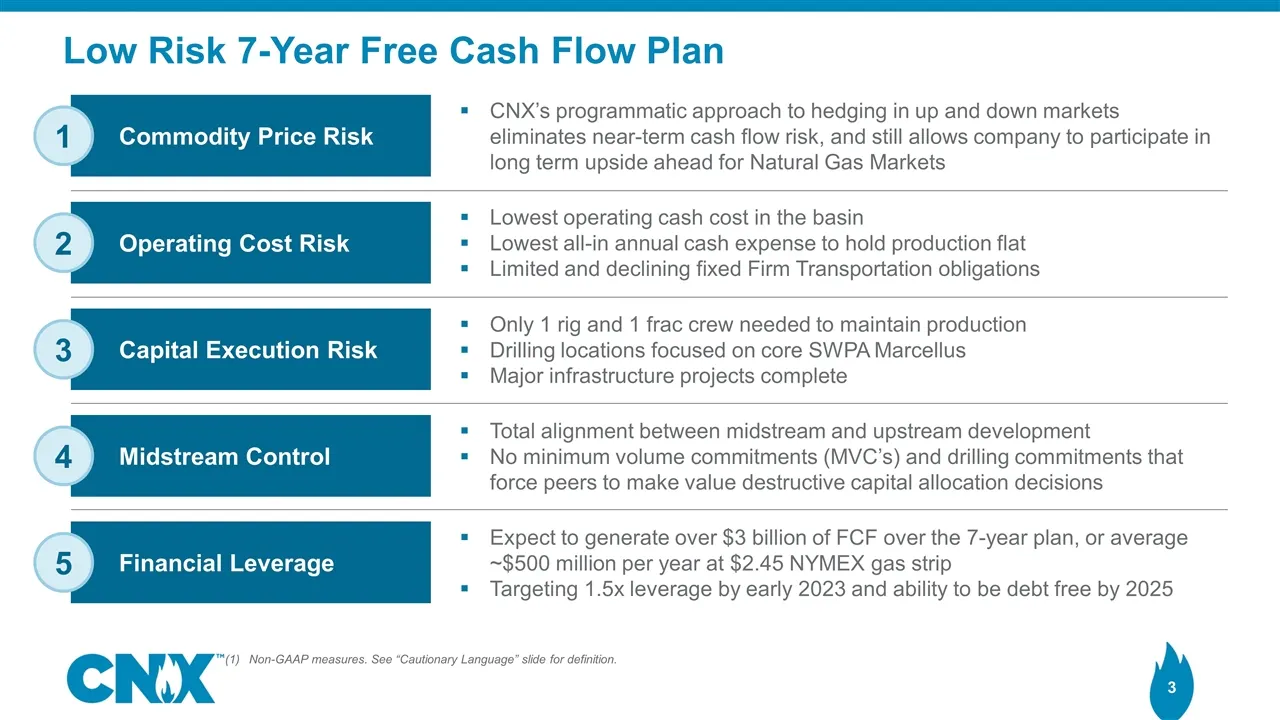
Low Risk 7-Year Free Cash Flow Plan Operating Cost Risk Lowest operating cash cost in the basin Lowest all-in annual cash expense to hold production flat Limited and declining fixed Firm Transportation obligations 2 Capital Execution Risk Only 1 rig and 1 frac crew needed to maintain production Dril
Slide 4: Low Risk Differentiates CNX
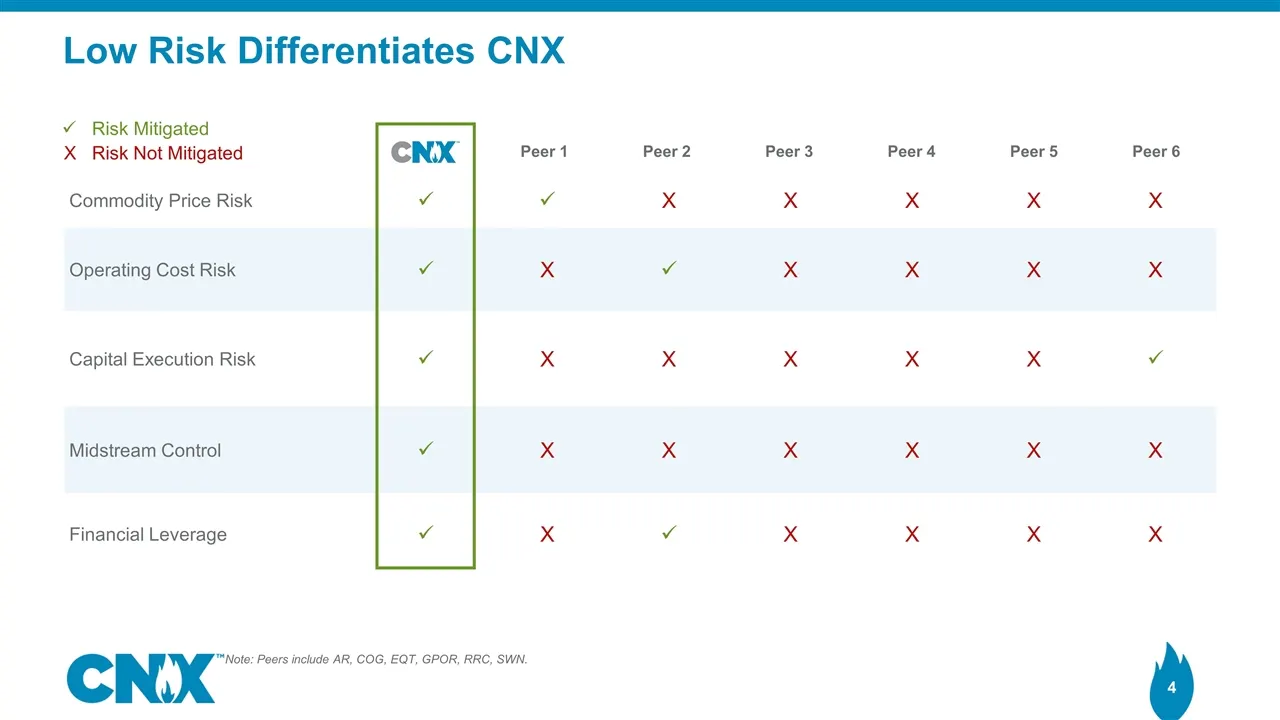
Low Risk Differentiates CNX Commodity Price Risk ü ü X X X X X Operating Cost Risk ü X ü X X X X Capital Execution Risk ü X X X X X ü Midstream Control ü X X X X X X Financial Leverage ü X ü X X X X Peer 1 Peer 2 Peer 3 Peer 4 Peer 5 Peer 6 Note: Peers include AR, COG, EQT, GPOR, RRC, SWN. ü Risk Mi
Slide 5: Gas Price Risk Differentiation
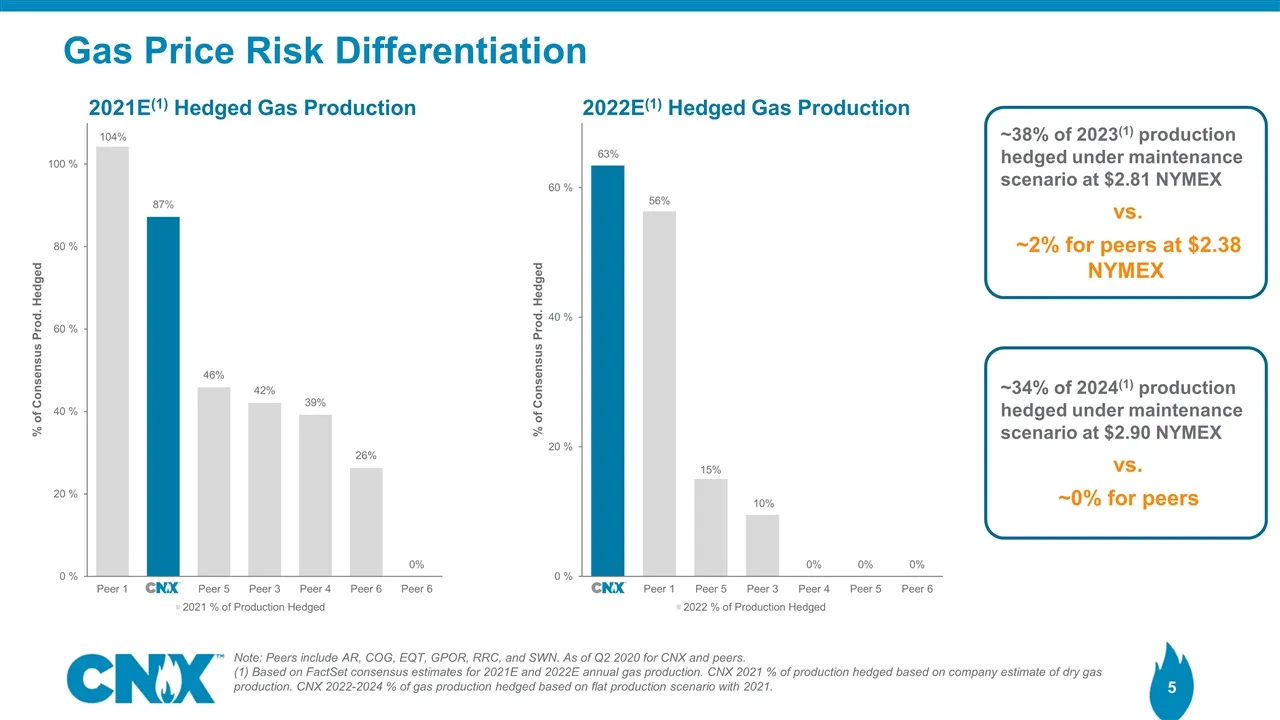
Gas Price Risk Differentiation Note: Peers include AR, COG, EQT, GPOR, RRC, and SWN. As of Q2 2020 for CNX and peers. (1) Based on FactSet consensus estimates for 2021E and 2022E annual gas production. CNX 2021 % of production hedged based on company estimate of dry gas production. CNX 2022-2024 % o
Slide 6: Lowest Cost Position Protects Cash Flows in Down Market
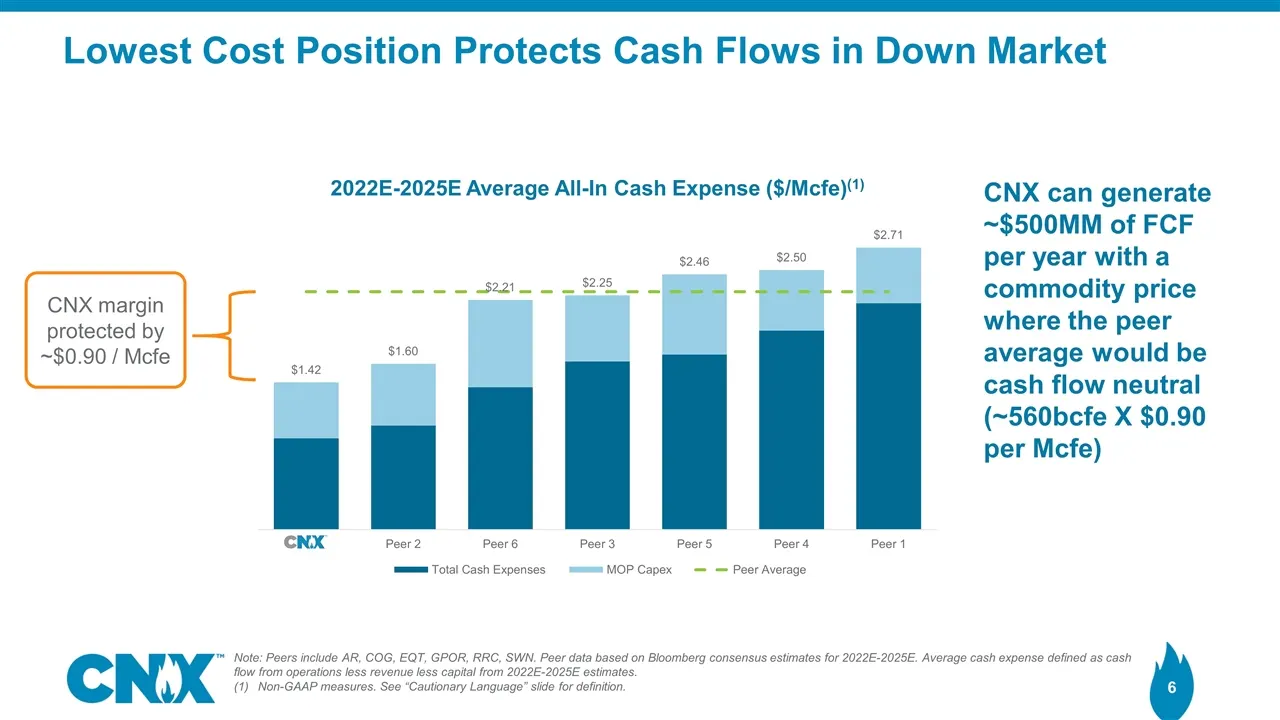
Lowest Cost Position Protects Cash Flows in Down Market CNX margin protected by ~$0.90 / Mcfe CNX can generate ~$500MM of FCF per year with a commodity price where the peer average would be cash flow neutral (~560bcfe X $0.90 per Mcfe) Note: Peers include AR, COG, EQT, GPOR, RRC, SWN. Peer data base
Slide 7: Significant Upside to FCF if Gas Prices Go Up
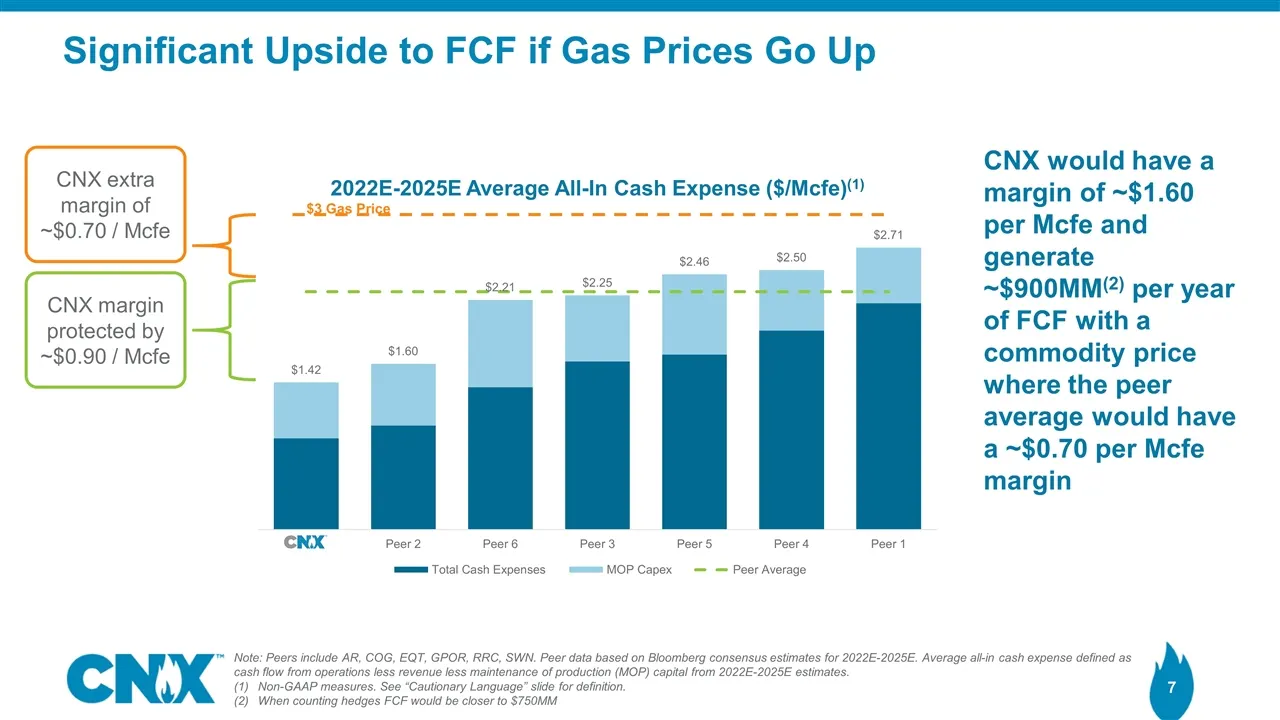
Significant Upside to FCF if Gas Prices Go Up CNX margin protected by ~$0.90 / Mcfe CNX would have a margin of ~$1.60 per Mcfe and generate ~$900MM(2) per year of FCF with a commodity price where the peer average would have a ~$0.70 per Mcfe margin CNX extra margin of ~$0.70 / Mcfe $3 Gas Price Note
Slide 8: Capital Execution Risk Differentiation
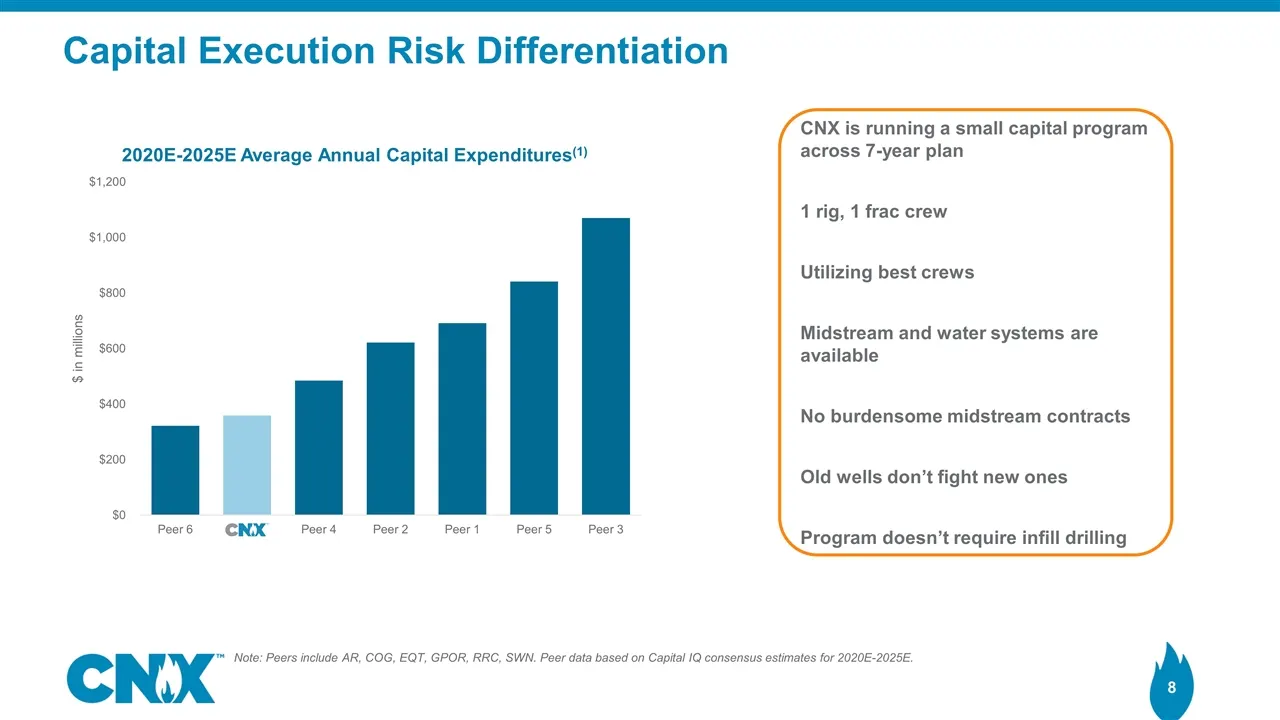
Capital Execution Risk Differentiation CNX is running a small capital program across 7-year plan 1 rig, 1 frac crew Utilizing best crews Midstream and water systems are available No burdensome midstream contracts Old wells don’t fight new ones Program doesn’t require infill drilling Note: Peers incl
Slide 9: Midstream Ownership Eliminates Risks
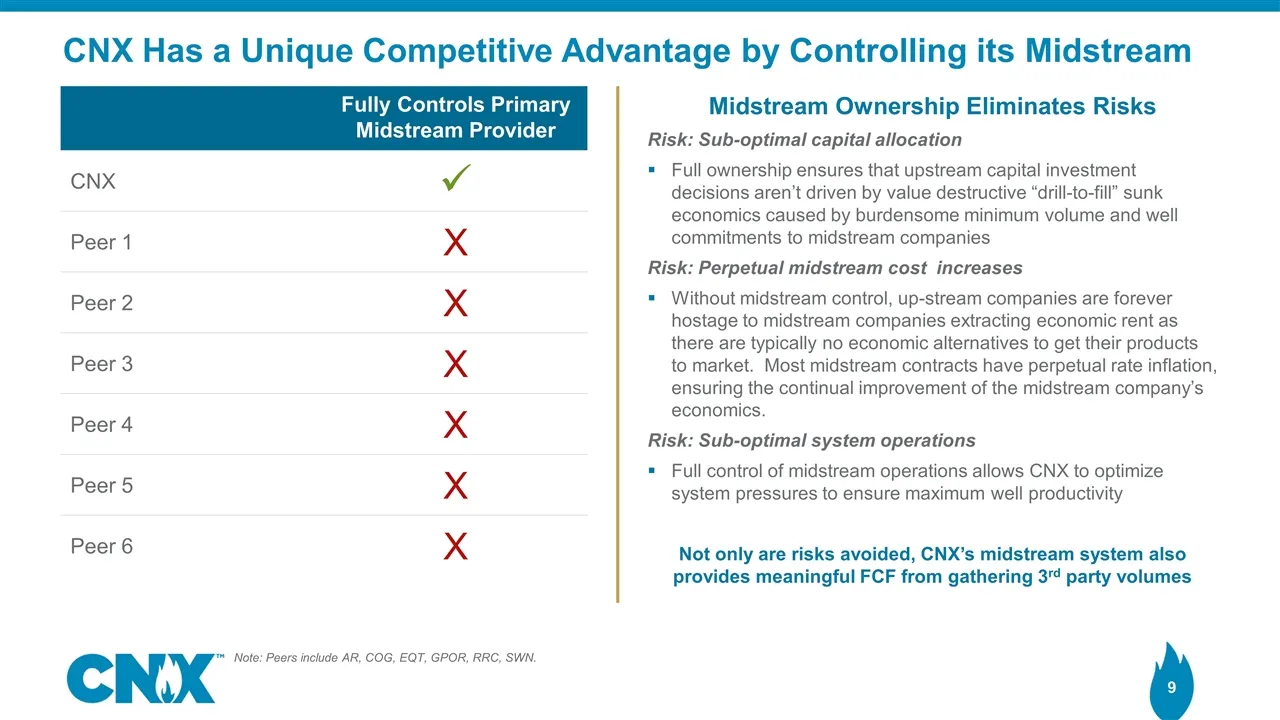
Midstream Ownership Eliminates Risks Risk: Sub-optimal capital allocation Full ownership ensures that upstream capital investment decisions aren’t driven by value destructive “drill-to-fill” sunk economics caused by burdensome minimum volume and well commitments to midstream companies Risk: Perpetua
Slide 10: Midstream Control Differentiation
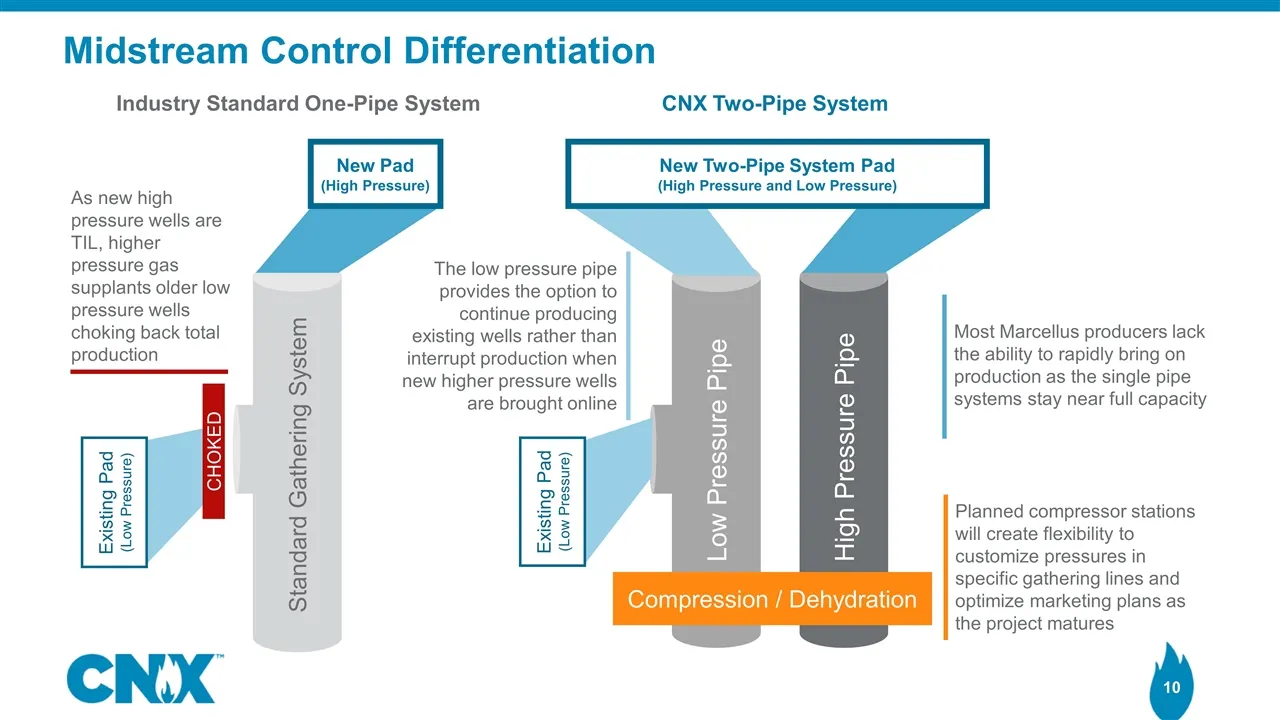
Midstream Control Differentiation Standard Gathering System Industry Standard One-Pipe System CNX Two-Pipe System High Pressure Pipe Low Pressure Pipe New Pad (High Pressure) Compression / Dehydration As new high pressure wells are TIL, higher pressure gas supplants older low pressure wells choking
Slide 11: Operational Leverage
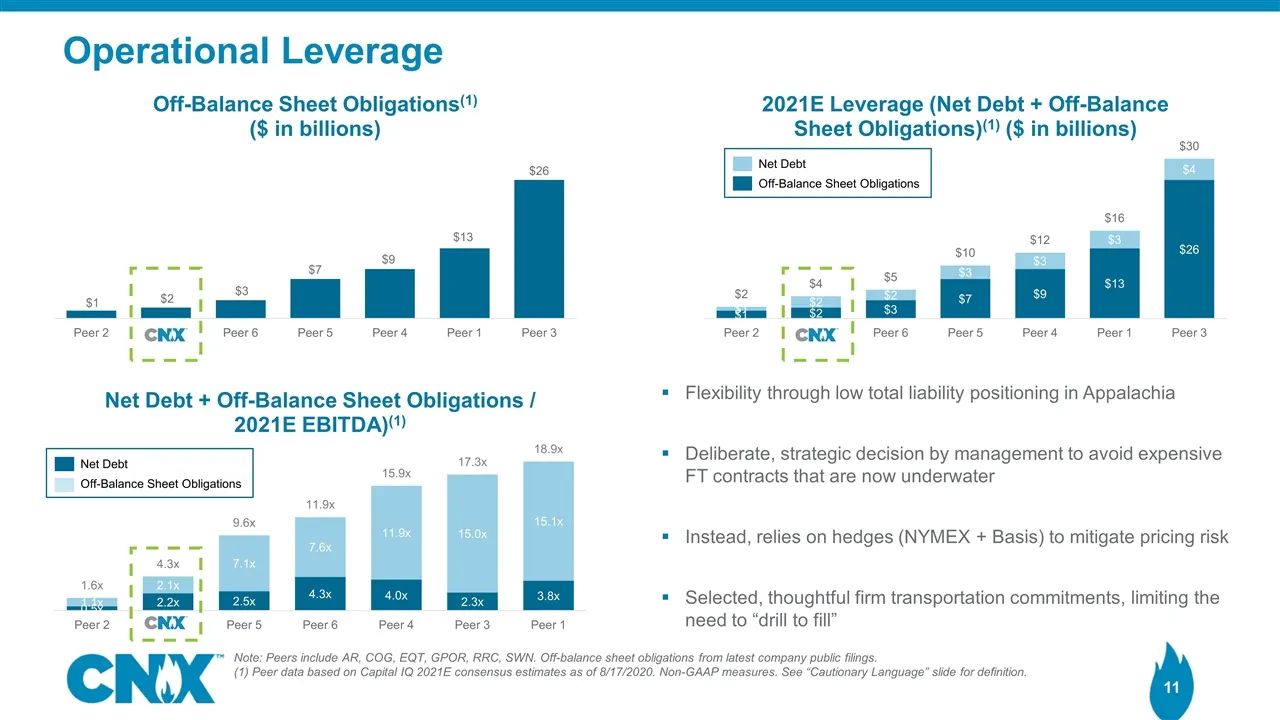
Operational Leverage Note: Peers include AR, COG, EQT, GPOR, RRC, SWN. Off-balance sheet obligations from latest company public filings. (1) Peer data based on Capital IQ 2021E consensus estimates as of 8/17/2020. Non-GAAP measures. See “Cautionary Language” slide for definition. Net Debt Off-Balanc
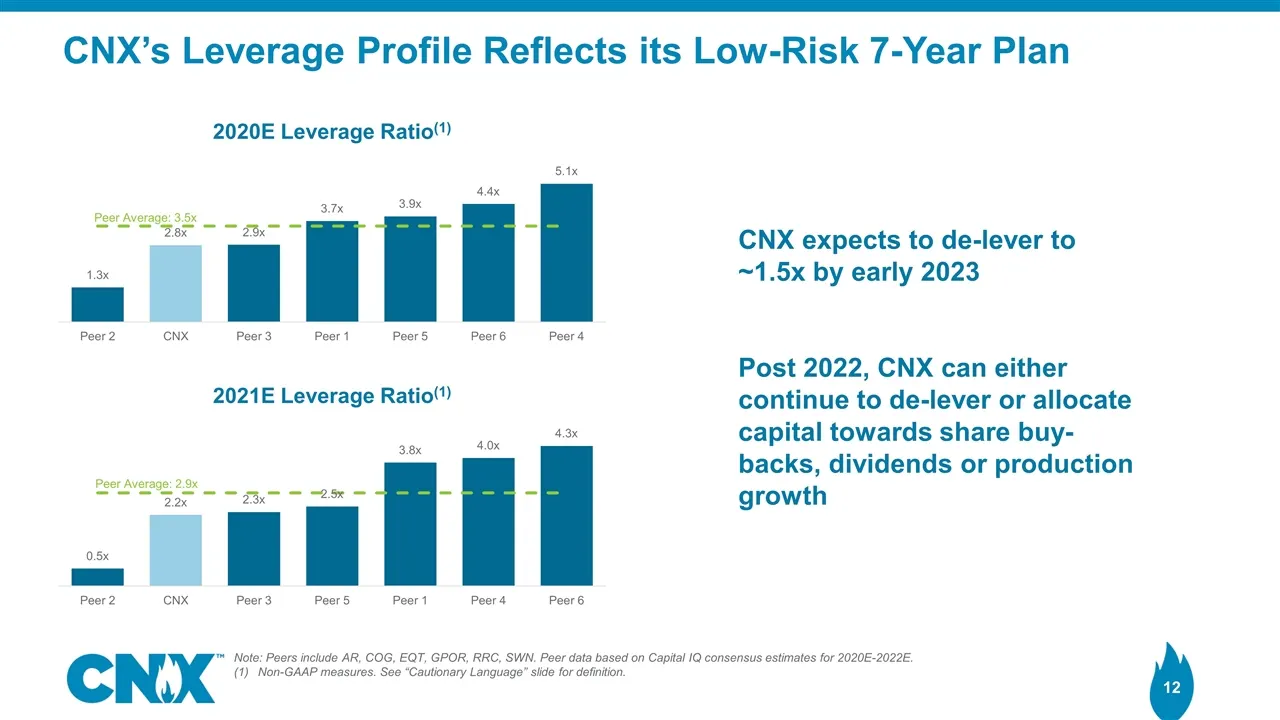
Slide 12: CNX's Leverage Profile Reflects its Low-Risk 7-Year Plan
CNX’s Leverage Profile Reflects its Low-Risk 7-Year Plan CNX expects to de-lever to ~1.5x by early 2023 Post 2022, CNX can either continue to de-lever or allocate capital towards share buy-backs, dividends or production growth Peer Average: 3.5x Peer Average: 2.9x Note: Peers include AR, COG, EQT, G
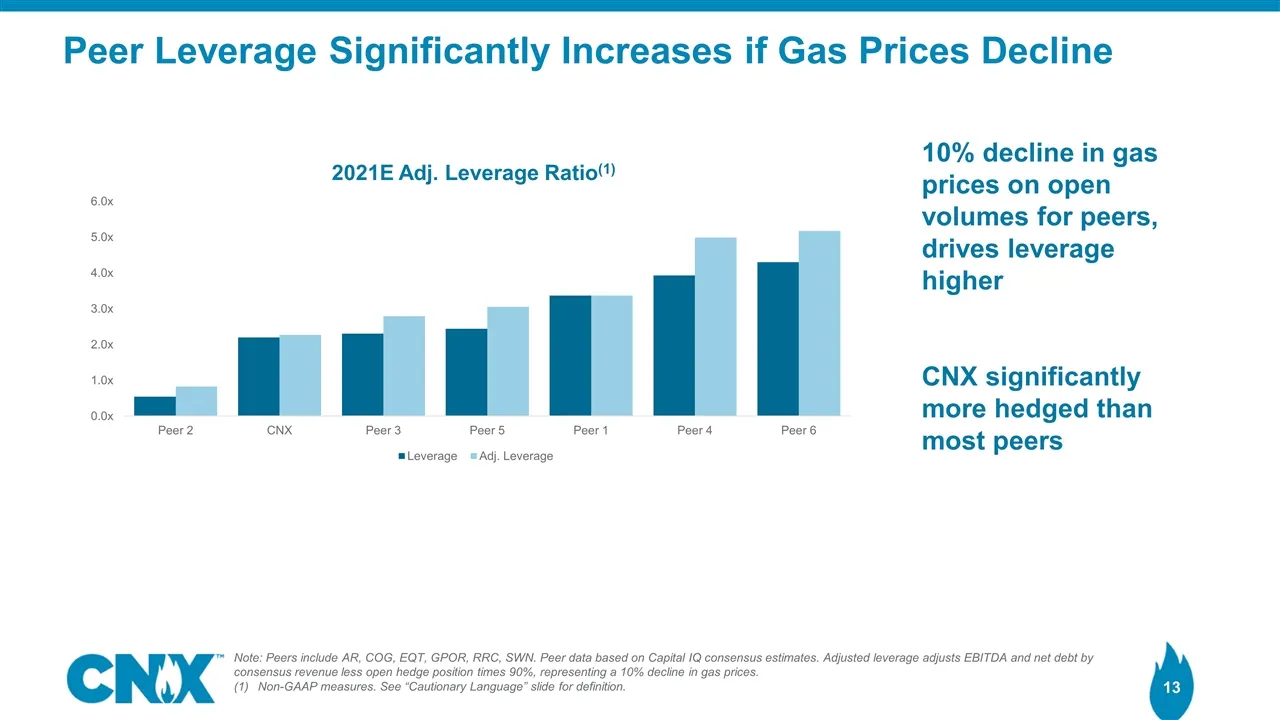
Slide 13: Peer Leverage Significantly Increases if Gas Prices Decline
Peer Leverage Significantly Increases if Gas Prices Decline 10% decline in gas prices on open volumes for peers, drives leverage higher CNX significantly more hedged than most peers Note: Peers include AR, COG, EQT, GPOR, RRC, SWN. Peer data based on Capital IQ consensus estimates. Adjusted leverage
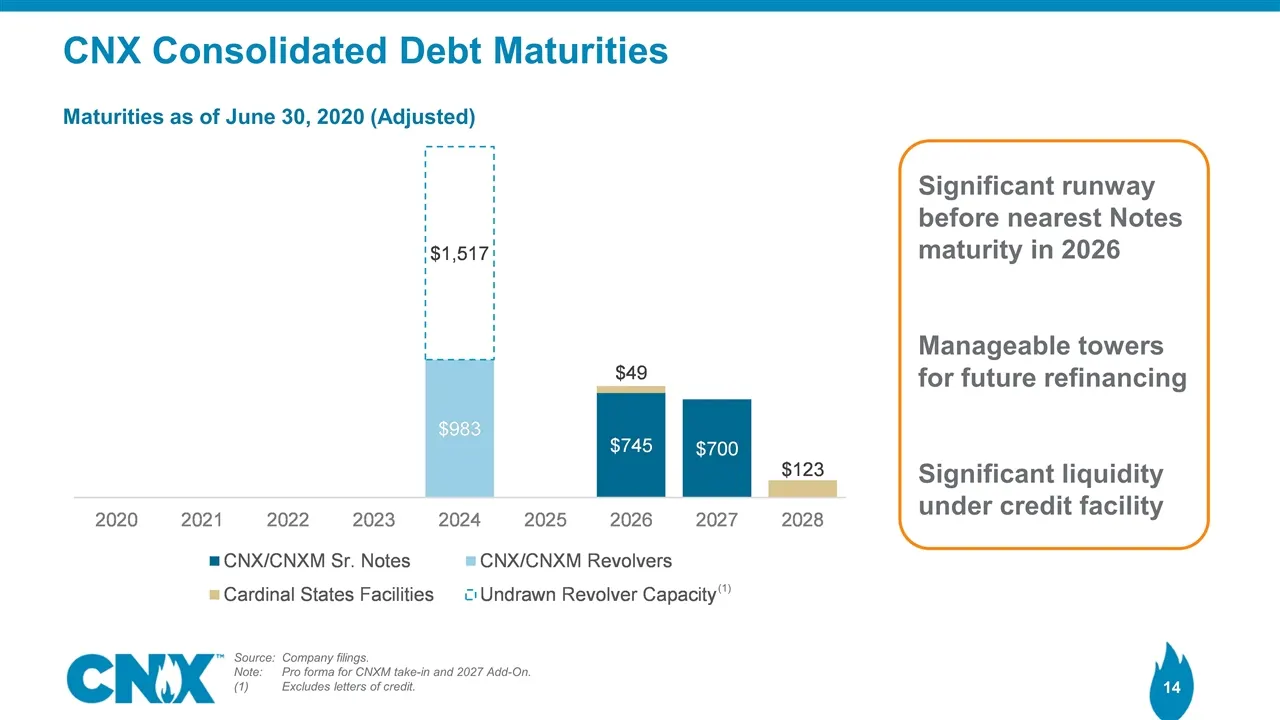
Slide 14: CNX Consolidated Debt Maturities
CNX Consolidated Debt Maturities Source: Company filings. Note: Pro forma for CNXM take-in and 2027 Add-On. Excludes letters of credit. Maturities as of June 30, 2020 (Adjusted) Significant runway before nearest Notes maturity in 2026 Manageable towers for future refinancing Significant liquidity un
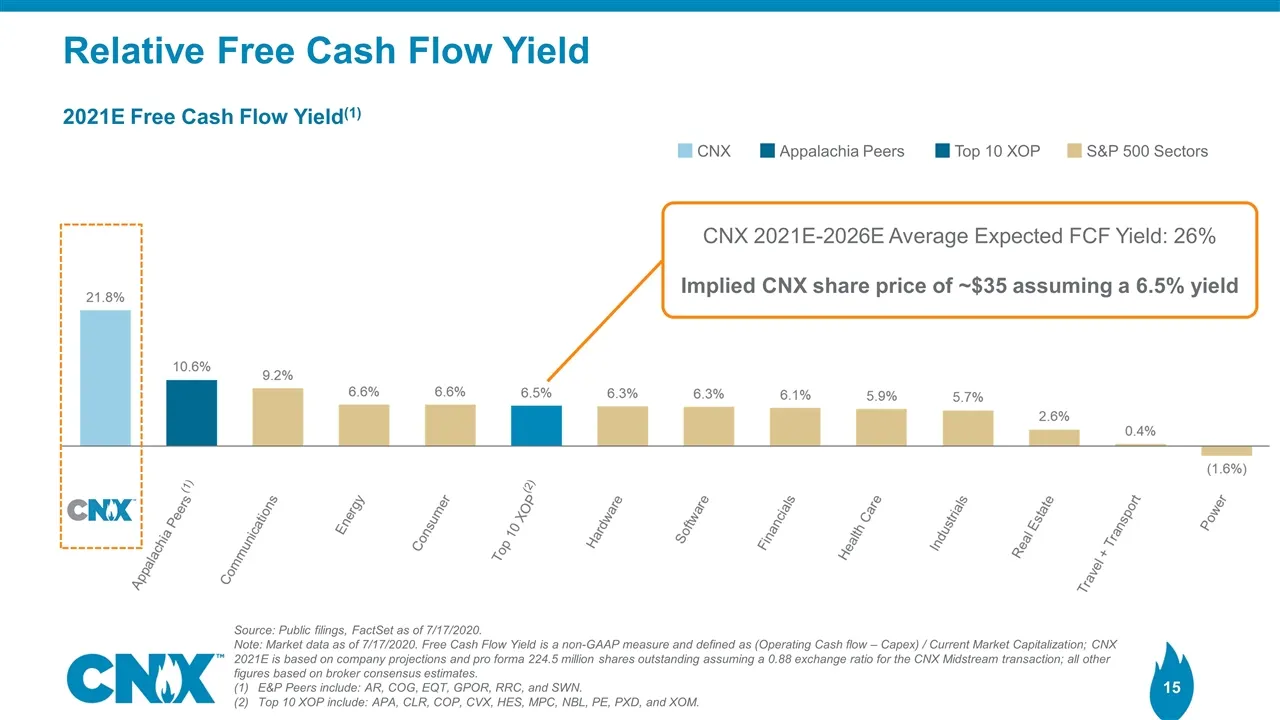
Slide 15: Relative Free Cash Flow Yield
Source: Public filings, FactSet as of 7/17/2020. Note: Market data as of 7/17/2020. Free Cash Flow Yield is a non-GAAP measure and defined as (Operating Cash flow – Capex) / Current Market Capitalization; CNX 2021E is based on company projections and pro forma 224.5 million shares outstanding assumi
Slide 16: CNX Should Trade at a Lower FCF Yield Due to Lower Risk
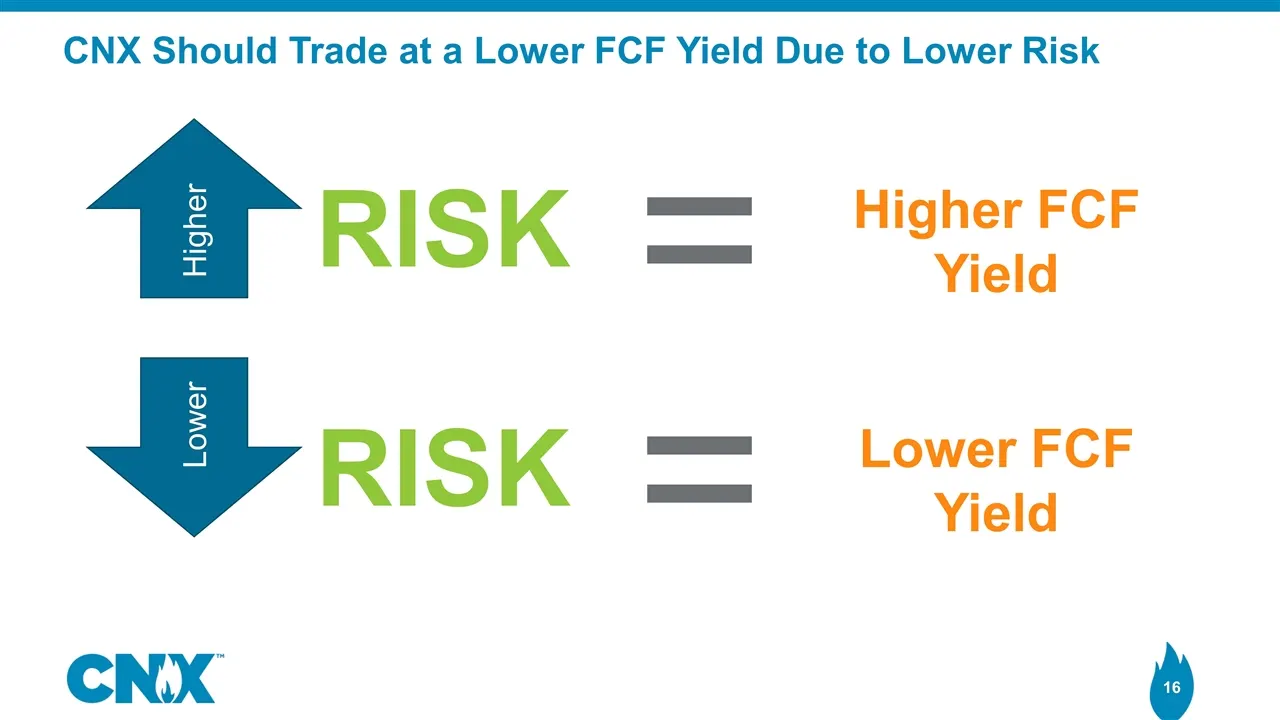
CNX Should Trade at a Lower FCF Yield Due to Lower Risk RISK Higher = Higher FCF Yield RISK Lower = Lower FCF Yield
Slide 17: CNX Trades at a Significant Discount on Free Cash Flow Metric
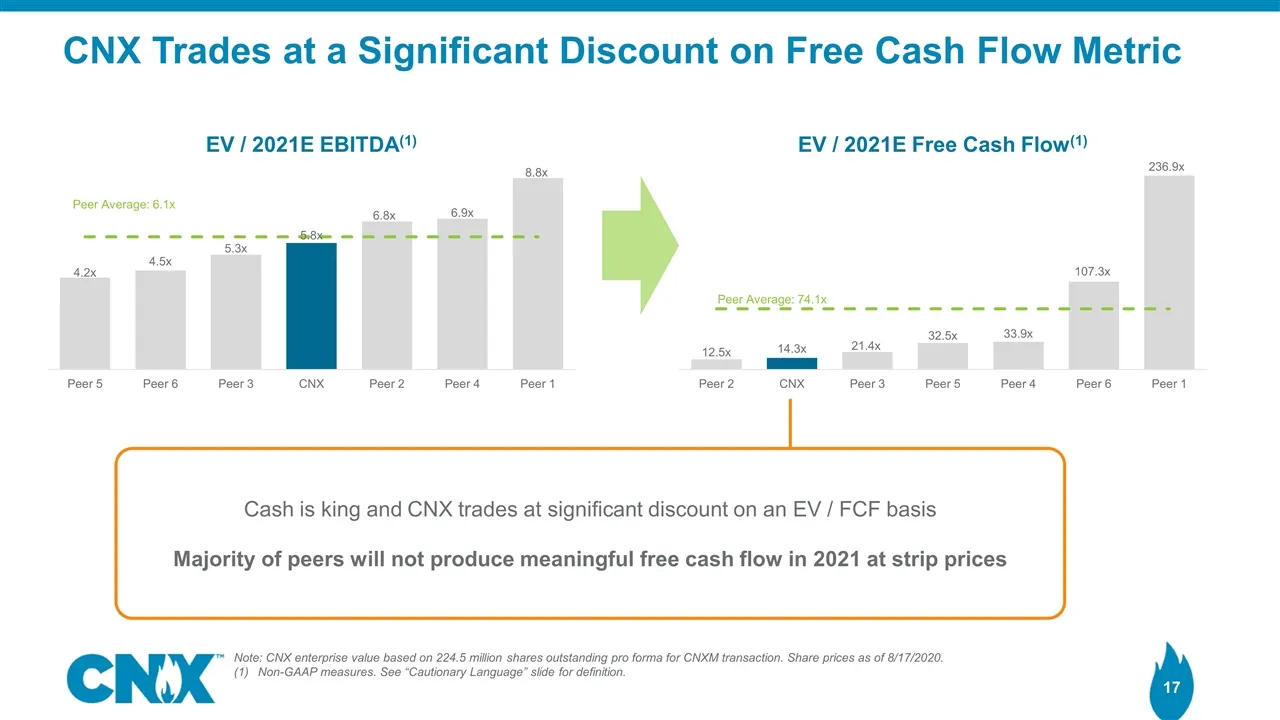
Note: CNX enterprise value based on 224.5 million shares outstanding pro forma for CNXM transaction. Share prices as of 8/17/2020. Non-GAAP measures. See “Cautionary Language” slide for definition. CNX Trades at a Significant Discount on Free Cash Flow Metric Cash is king and CNX trades at significa
Slide 18: Expected FCF Creates Great Share Price Appreciation Potential
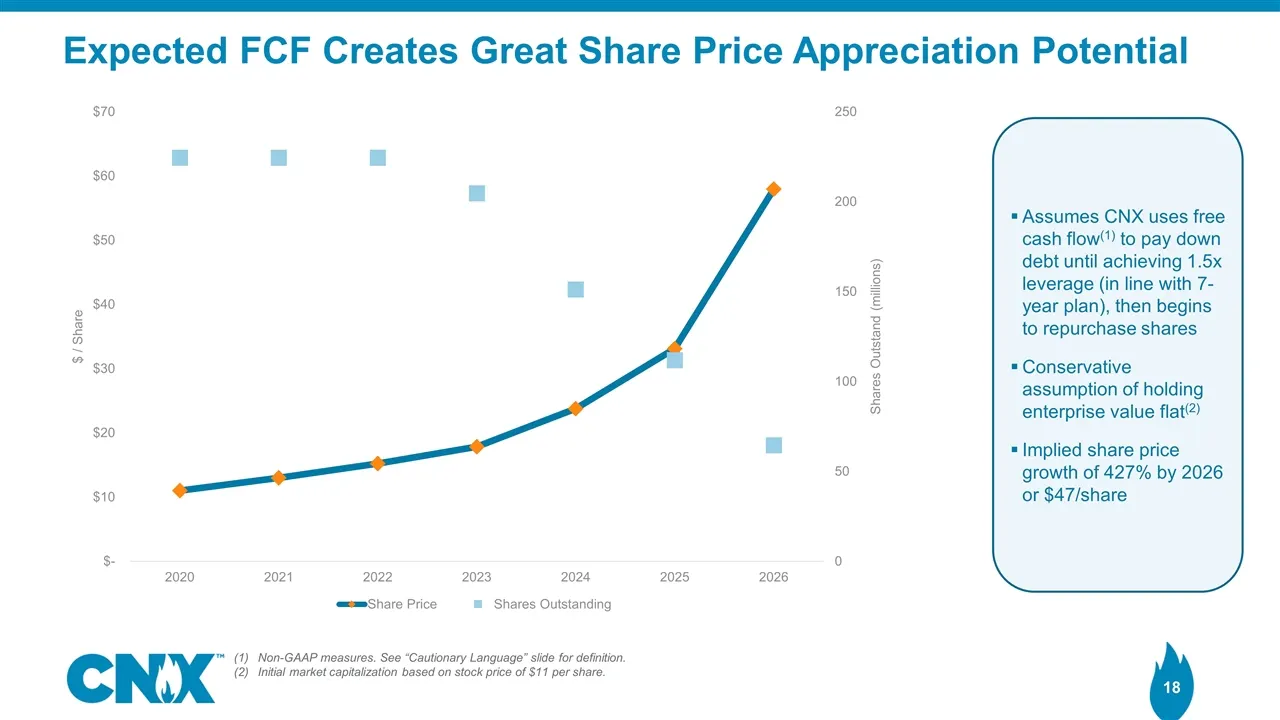
Non-GAAP measures. See “Cautionary Language” slide for definition. Initial market capitalization based on stock price of $11 per share. Assumes CNX uses free cash flow(1) to pay down debt until achieving 1.5x leverage (in line with 7-year plan), then begins to repurchase shares Conservative assumpti
Slide 19: Free Cash Flow Provides Significant Upside
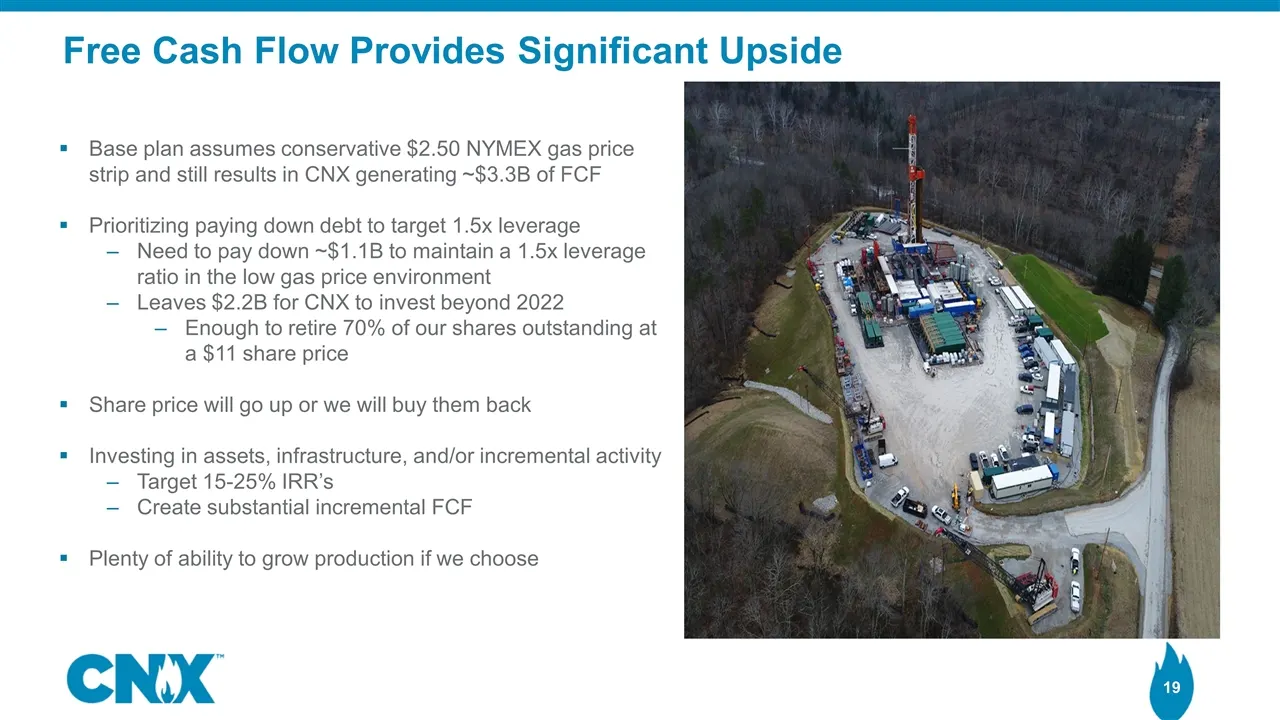
Free Cash Flow Provides Significant Upside Base plan assumes conservative $2.50 NYMEX gas price strip and still results in CNX generating ~$3.3B of FCF Prioritizing paying down debt to target 1.5x leverage Need to pay down ~$1.1B to maintain a 1.5x leverage ratio in the low gas price environment Lea
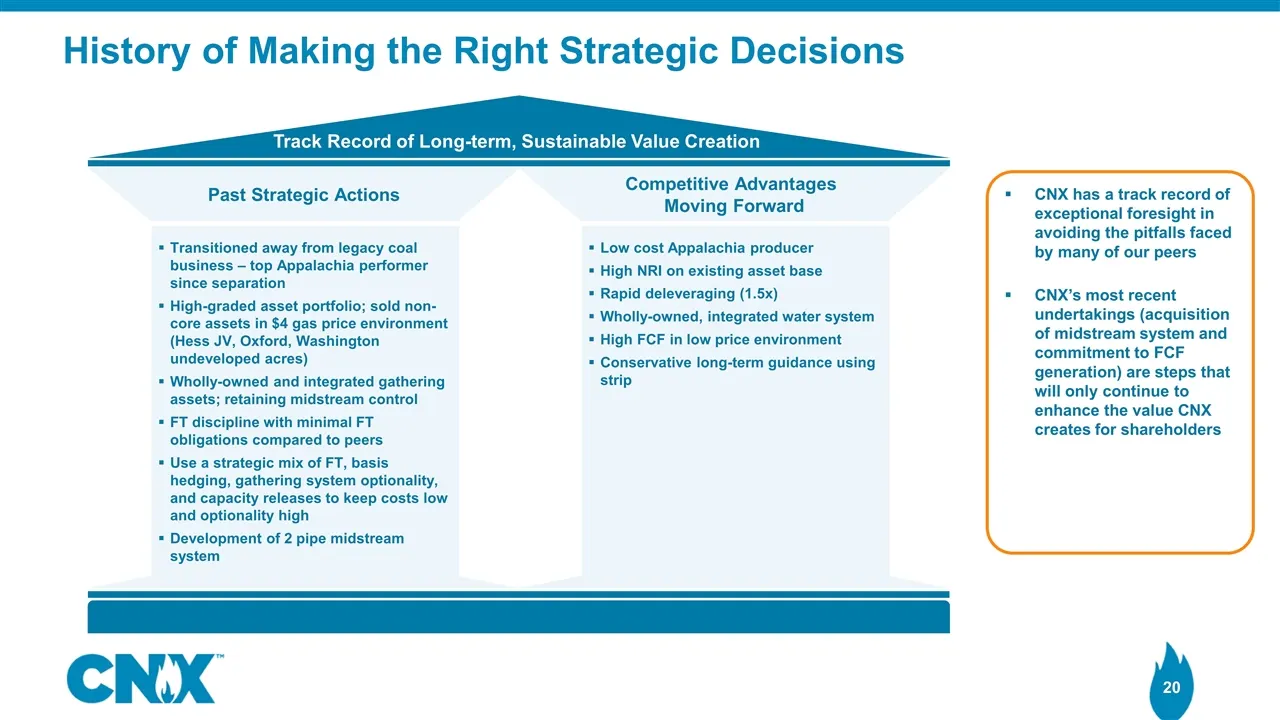
Slide 20: History of Making the Right Strategic Decisions
History of Making the Right Strategic Decisions Track Record of Long-term, Sustainable Value Creation Full Value Chain (suppliers & customers) Industry Peers Investors & Lenders Civil Society & Public Sector Past Strategic Actions Transitioned away from legacy coal business – top Appalachia performe
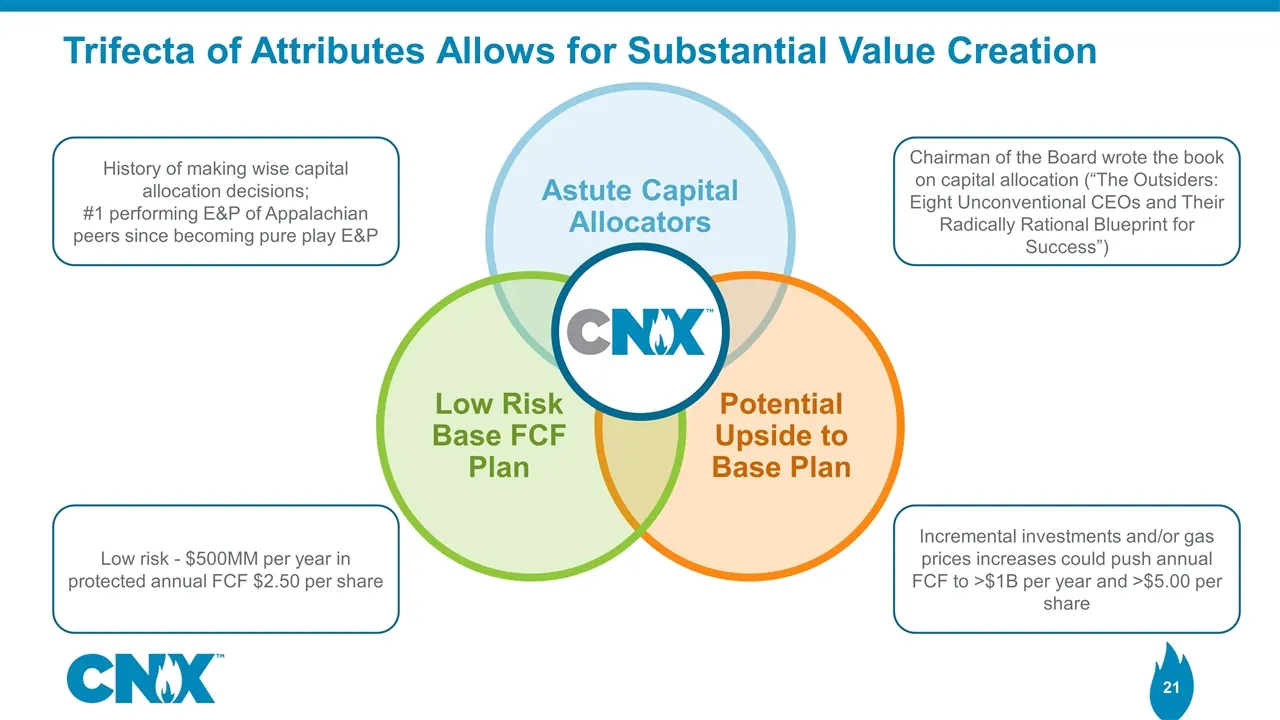
Slide 21: Astute Capital Allocators
Astute Capital Allocators Potential Upside to Base Plan Low Risk Base FCF Plan Trifecta of Attributes Allows for Substantial Value Creation History of making wise capital allocation decisions; #1 performing E&P of Appalachian peers since becoming pure play E&P Chairman of the Board wrote the book on
Source: SEC EDGAR · 425 filed Sep 9, 2020