South Jersey Industries — Investor Day (October 2018)
81 slides from South Jersey Industries's investor day presentation, Oct 22, 2018

Slide 1: 2018 Investor Conference
2018 Investor Conference October 22, 2018
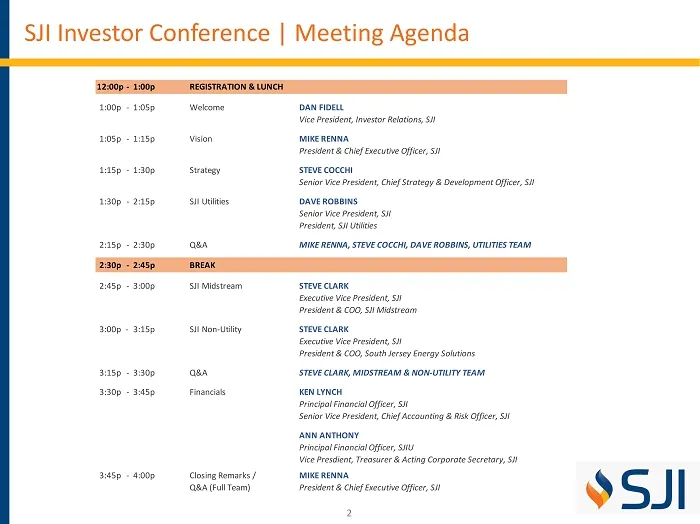
Slide 2: SJI Investor Conference Meeting Agenda
2 SJI Investor Conference | Meeting Agenda 1:00p -1:05p Welcome DAN FIDELL Vice President, Investor Relations, SJI 1:05p -1:15p Vision MIKE RENNA President & Chief Executive Officer, SJI 1:15p -1:30p Strategy STEVE COCCHI Senior Vice President, Chief Strategy & Development Officer, SJI 1:30p -2:15p
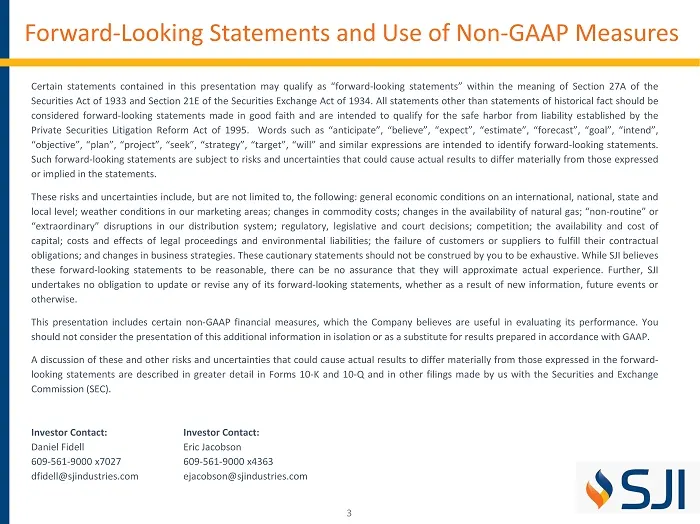
Slide 3: Forward-Looking Statements and Use of Non-GAAP Measures
3 Forward - Looking Statements and Use of Non - GAAP Measures Certain statements contained in this presentation may qualify as “forward - looking statements” within the meaning of Section 27 A of the Securities Act of 1933 and Section 21 E of the Securities Exchange Act of 1934 . All statements othe

Slide 4: Vision
4 Vision Mike Renna President and Chief Executive Officer, SJI
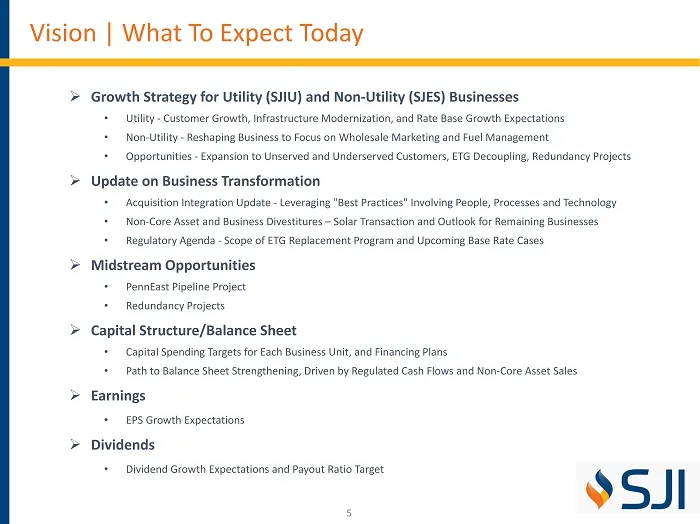
Slide 5: Vision: What To Expect Today
5 Vision | What To Expect Today » Growth Strategy for Utility (SJIU) and Non - Utility (SJES ) Businesses • Utility - Customer Growth, Infrastructure Modernization, and Rate Base Growth Expectations • Non - Utility - Reshaping Business to Focus on Wholesale Marketing and Fuel Management • Opportunit
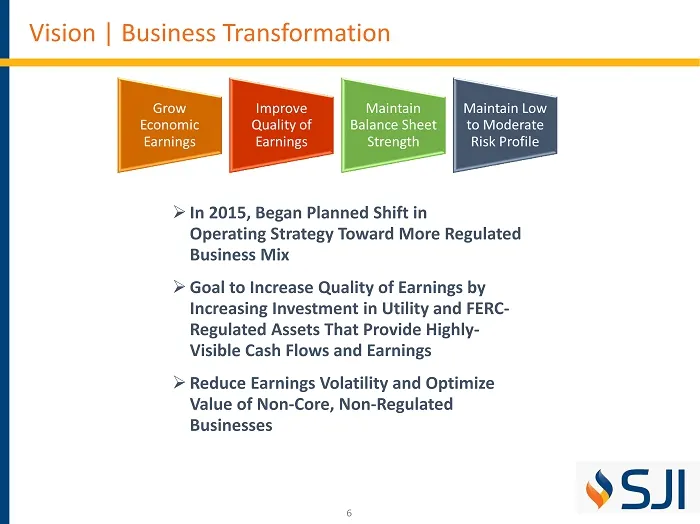
Slide 6: Vision: Business Transformation
6 Vision | Business Transformation » In 2015, Began Planned Shift in Operating Strategy Toward More Regulated Business Mix » Goal to Increase Quality of Earnings by Increasing Investment in Utility and FERC - Regulated Assets That Provide Highly - Visible Cash Flows and Earnings » Reduce Earnings Vo
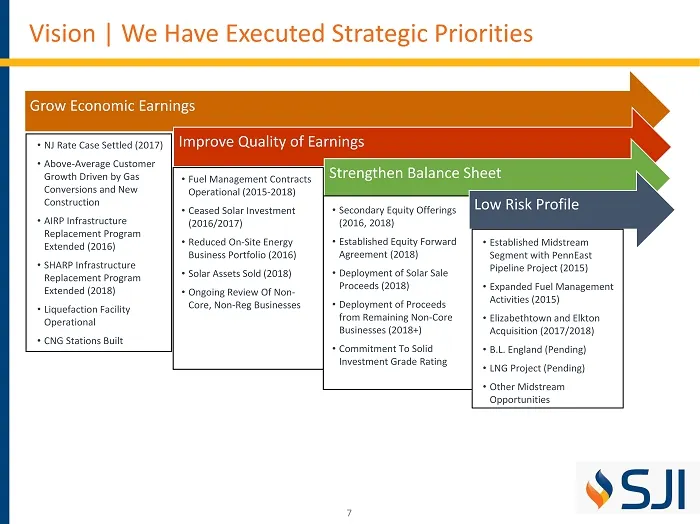
Slide 7: Grow Economic Earnings, Improve Quality of Earnings, Strengthen Balance Sheet
7 Grow Economic Earnings Improve Quality of Earnings Strengthen Balance Sheet Low Risk Profile • NJ Rate Case Settled (2017) • Above - Average Customer Growth Driven by Gas Conversions and New Construction • AIRP Infrastructure Replacement Program Extended (2016) • SHARP Infrastructure Replacement P
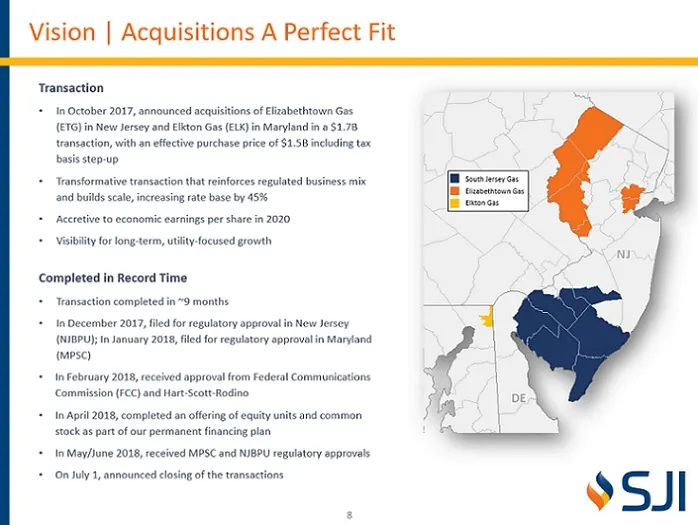
Slide 8: Vision: Acquisitions A Perfect Fit
8 Vision | Acquisitions A Perfect Fit 980388_1.wor - NY008P5T NJ NJ NJ NJ NJ NJ NJ NJ NJ NJ NJ NJ NJ NJ NJ NJ NJ NJ NJ NJ NJ NJ NJ NJ NJ NJ NJ NJ NJ NJ NJ NJ NJ NJ NJ NJ NJ NJ NJ NJ NJ NJ NJ NJ NJ NJ NJ NJ NJ PA PA PA PA PA PA PA PA PA PA PA PA PA PA PA PA PA PA PA PA PA PA PA PA PA PA PA PA PA PA P
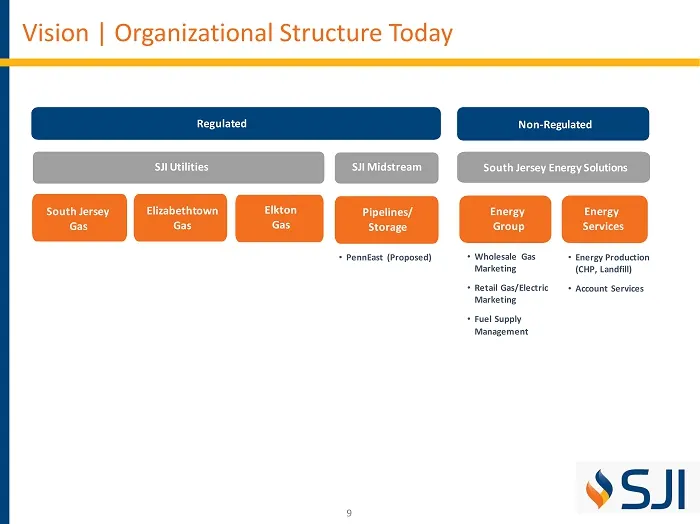
Slide 9: Vision: Organizational Structure Today
9 Vision | Organizational Structure Today Regulated Non - Regulated SJI Utilities SJI Midstream S outh Jersey Energy Solutions South Jersey Gas Elizabethtown Gas Elkton Gas Pipelines/ Storage Energy Group Energy Services • PennEast (Proposed) • Wholesale Gas M arketing • Retail Gas/Electric Marketin
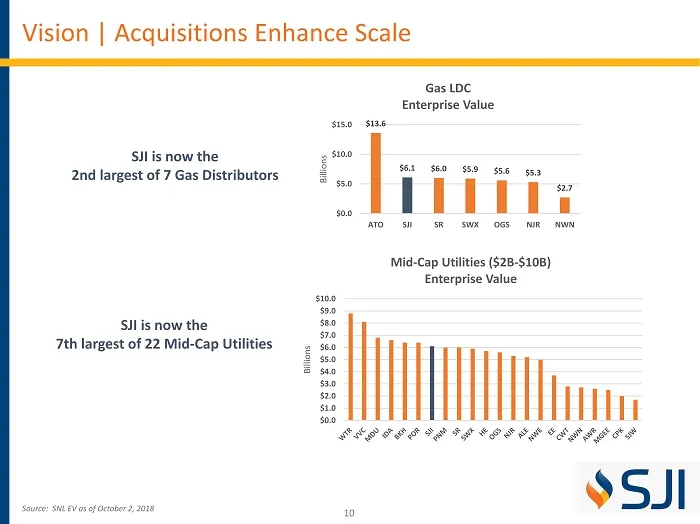
Slide 10: Vision: Acquisitions Enhance Scale
10 Vision | Acquisitions Enhance Scale Source: SNL EV as of October 2, 2018 SJI is now the 2nd largest of 7 Gas Distributors SJI is now the 7th largest of 22 Mid - Cap Utilities $13.6 $6.1 $6.0 $5.9 $5.6 $5.3 $2.7 $0.0 $5.0 $10.0 $15.0 ATO SJI SR SWX OGS NJR NWN Billions Gas LDC Enterprise Value $0.
Slide 11: Vision: More Regulated and Stable Earnings Mix
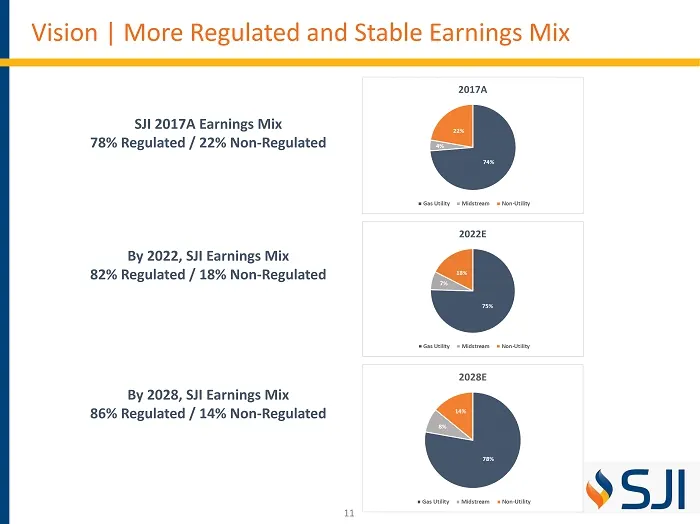
11 Vision | More Regulated and Stable Earnings Mix SJI 2017A Earnings Mix 78% Regulated / 22% Non - Regulated By 2022, SJI Earnings Mix 82% Regulated / 18% Non - Regulated By 2028, SJI Earnings Mix 86% Regulated / 14% Non - Regulated
Slide 12: Vision: Capital Expenditures 2018-2022
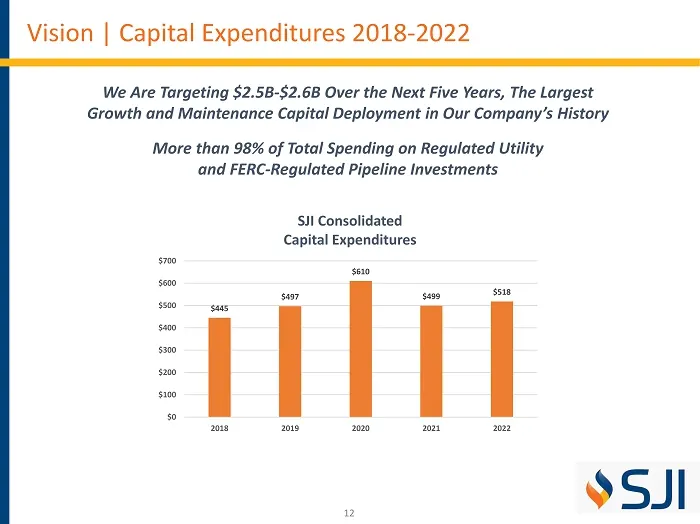
12 Vision | Capital Expenditures 2018 - 2022 We Are Targeting $2.5B - $2.6B Over the Next Five Years, The Largest Growth and Maintenance Capital Deployment in Our Company’s History More than 98% of Total Spending on Regulated Utility and FERC - Regulated Pipeline Investments $445 $497 $610 $499 $518
Slide 13: Vision: Vision To Drive Shareholder Value
13 Vision | Vision To Drive Shareholder Value Our Vision: ▪ Our vision is to drive shareholder value through investment in expanding and modernizing our utility infrastructure and through regulatory innovation that provides safety, reliability, value and certainty to our customers. ▪ Knowing the cri
Slide 14: Summary: Future State – Focus and Targets
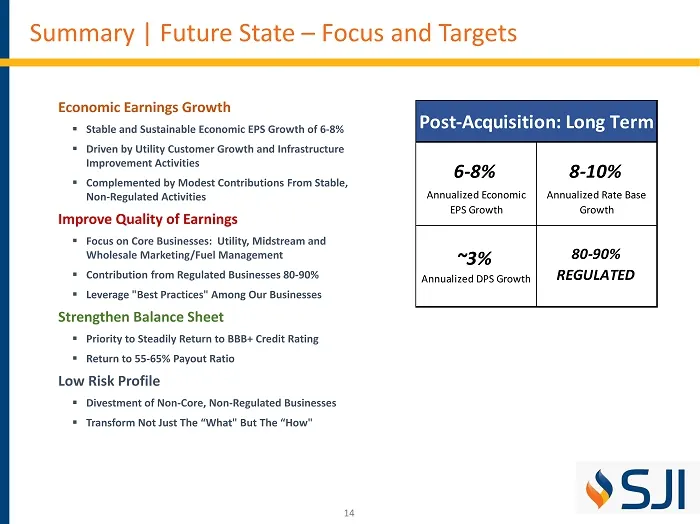
14 Summary | Future State – Focus and Targets Economic Earnings Growth ▪ Stable and Sustainable Economic EPS Growth of 6 - 8% ▪ Driven by Utility Customer Growth and Infrastructure Improvement Activities ▪ Complemented by Modest Contributions From Stable, Non - Regulated Activities Improve Quality o
Slide 15: Strategy
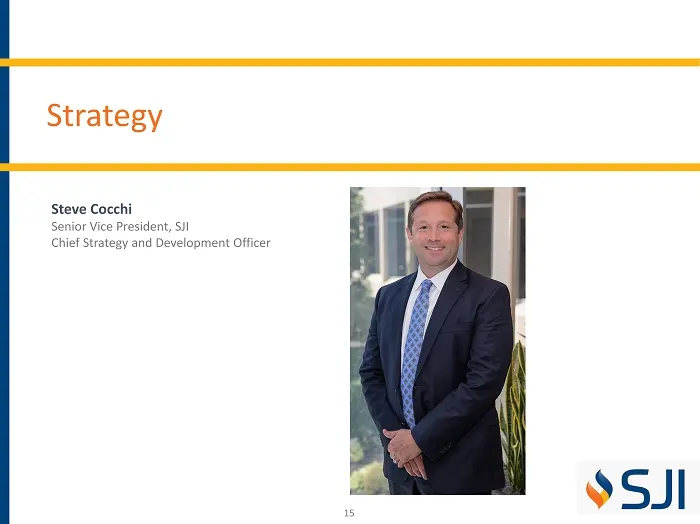
15 Strategy Steve Cocchi Senior Vice President, SJI Chief Strategy and Development Officer
Slide 16: Strategy: Business Transformation
16 Strategy | Business Transformation » Acquisition Integration ▪ Integration of ETG/Elkton and Adoption of Best Practices » Business Transformation Initiative ▪ Leveraging Talent and Technology to Improve Business Processes and Results » Non - Core Businesses ▪ Complete Review of Remaining Non - Co
Slide 17: Strategy: Acquisition Integration
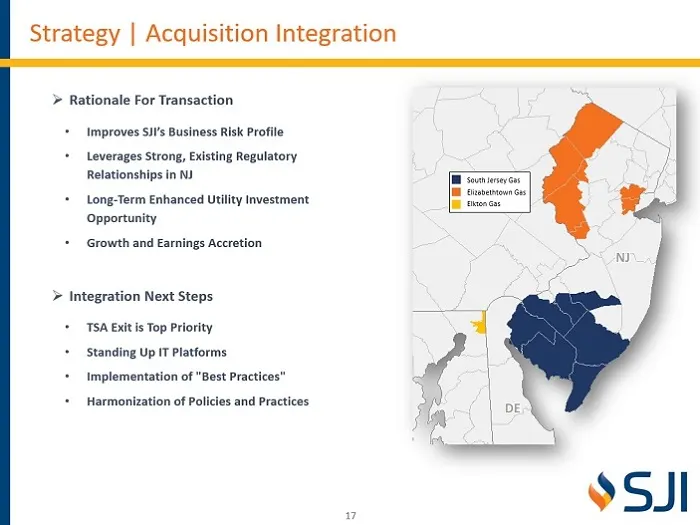
17 Strategy | Acquisition Integration 980388_1.wor - NY008P5T NJ NJ NJ NJ NJ NJ NJ NJ NJ NJ NJ NJ NJ NJ NJ NJ NJ NJ NJ NJ NJ NJ NJ NJ NJ NJ NJ NJ NJ NJ NJ NJ NJ NJ NJ NJ NJ NJ NJ NJ NJ NJ NJ NJ NJ NJ NJ NJ NJ PA PA PA PA PA PA PA PA PA PA PA PA PA PA PA PA PA PA PA PA PA PA PA PA PA PA PA PA PA PA P
Slide 18: Strategy: Non-Core Businesses
18 Strategy | Non - Core Businesses » Non - Core Businesses • As part of our business transformation plan, we are seeking to optimize the value of our non - core, non - regulated businesses • These businesses include our investment/ownership in solar, combined heat - and - power assets, landfill gas
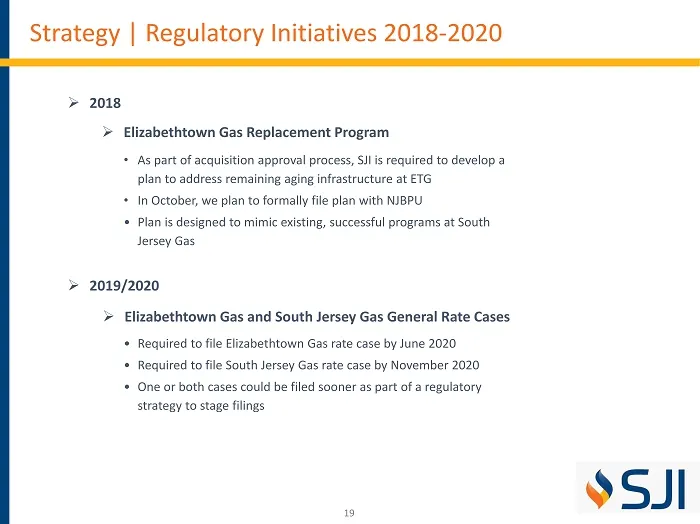
Slide 19: Strategy: Regulatory Initiatives 2018-2020
19 Strategy | Regulatory Initiatives 2018 - 2020 » 2018 » Elizabethtown Gas Replacement Program • As part of acquisition approval process, SJI is required to develop a plan to address remaining aging infrastructure at ETG • In October, we plan to formally file plan with NJBPU • Plan is designed to m
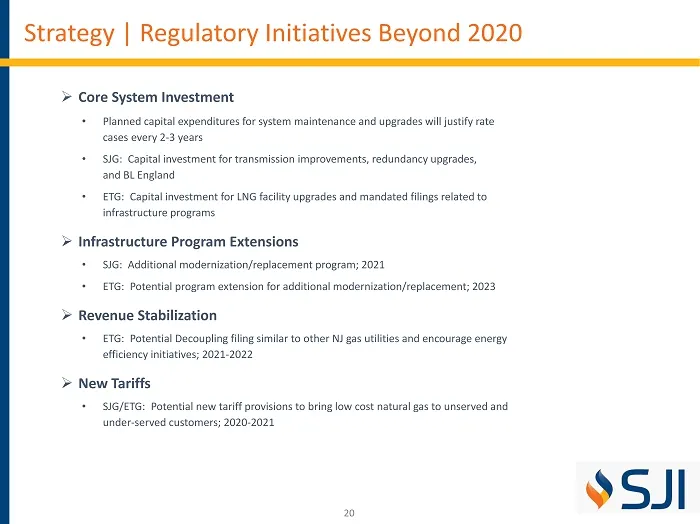
Slide 20: Strategy: Regulatory Initiatives Beyond 2020
20 Strategy | Regulatory Initiatives Beyond 2020 » Core System Investment • Planned capital expenditures for system maintenance and upgrades will justify rate cases every 2 - 3 years • SJG: Capital investment for transmission improvements, redundancy upgrades, and BL England • ETG: Capital investmen
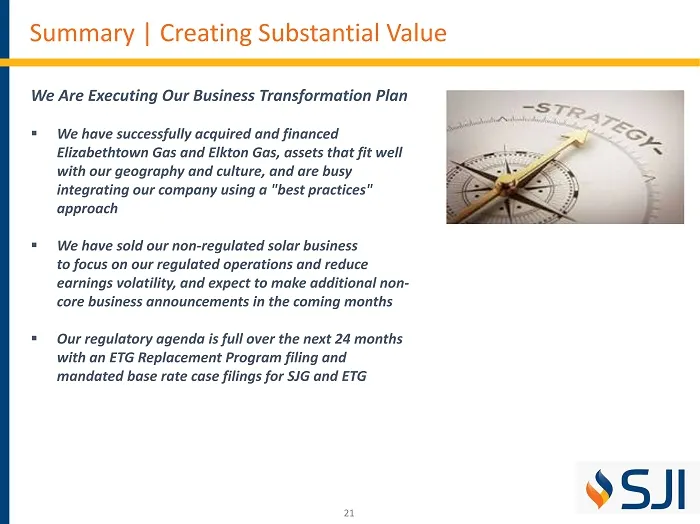
Slide 21: Summary: Creating Substantial Value
21 Summary | Creating Substantial Value We Are Executing Our Business Transformation Plan ▪ We have successfully acquired and financed Elizabethtown Gas and Elkton Gas, assets that fit well with our geography and culture, and are busy integrating our company using a "best practices" approach ▪ We ha
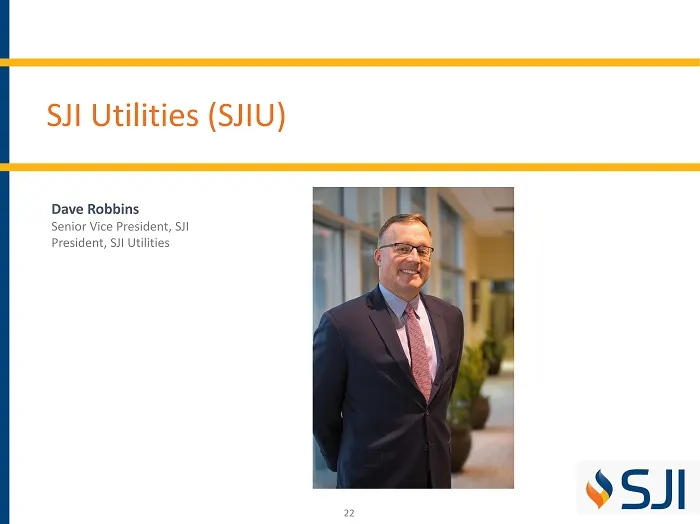
Slide 22: SJI Utilities (SJIU)
22 SJI Utilities (SJIU) Dave Robbins Senior Vice President, SJI President, SJI Utilities
Slide 23: SJI Utilities: Overview
23 SJI Utilities | Overview Our Vision: ▪ Our vision is to drive shareholder value through investment in expanding and modernizing our utility infrastructure and through regulatory innovation that provides safety, reliability, value and certainty to our customers. ▪ Knowing the criticality of reliab
Slide 24: SJI Utilities: Largest Stand-Alone Natural Gas Utility in New Jersey
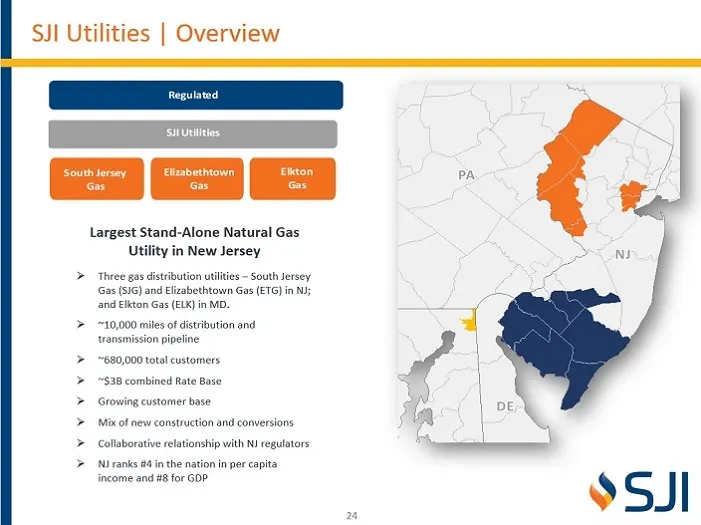
24 SJI Utilities | Overview Largest Stand - Alone Natural Gas Utility in New Jersey » Three gas distribution utilities – South Jersey Gas (SJG) and Elizabethtown Gas (ETG) in NJ; and Elkton Gas (ELK) in MD. » ~10,000 miles of distribution and transmission pipeline » ~680,000 total customers » ~$3B c
Slide 25: SJI Utilities: Opportunity For Infrastructure Upgrades
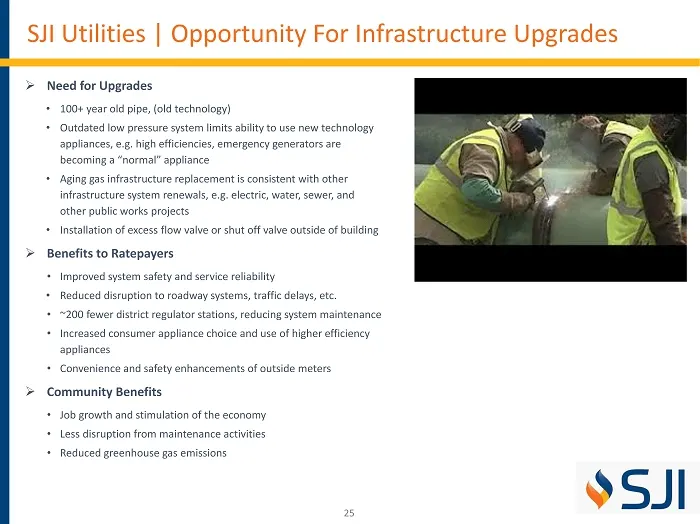
25 SJI Utilities | Opportunity For Infrastructure Upgrades » Need for Upgrades • 100+ year old pipe, (old technology) • Outdated low pressure system limits ability to use new technology appliances, e.g. high efficiencies, emergency generators are becoming a “normal” appliance • Aging gas infrastruct
Slide 26: SJI Utilities: Safety is Our Top Priority
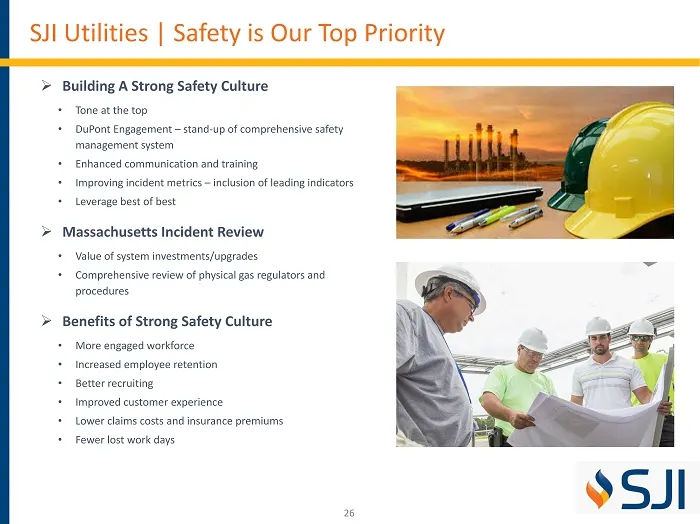
26 SJI Utilities | Safety is Our Top Priority » Building A Strong Safety Culture • Tone at the top • DuPont Engagement – stand - up of comprehensive safety management system • Enhanced communication and training • Improving incident metrics – inclusion of leading indicators • Leverage best of best »
Slide 27: SJI Utilities: Focus on Customer Experience
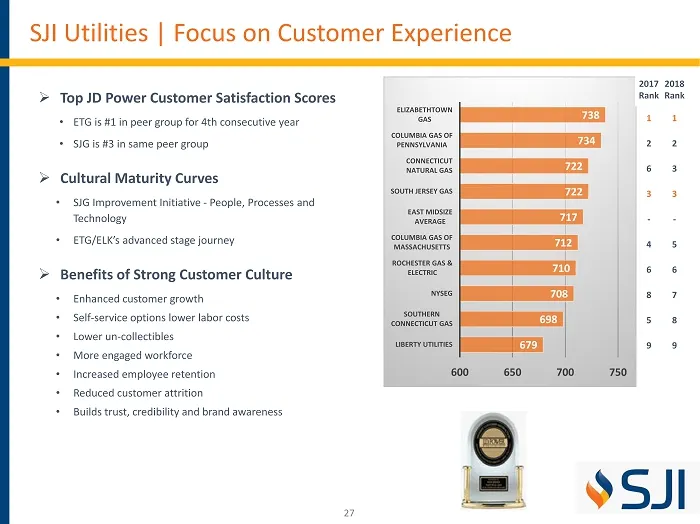
27 SJI Utilities | Focus on Customer Experience » Top JD Power Customer Satisfaction Scores • ETG is #1 in peer group for 4th consecutive year • SJG is #3 in same peer group » Cultural Maturity Curves • SJG Improvement Initiative - People, Processes and Technology • ETG/ELK’s advanced stage journey
Slide 28: South Jersey Gas: Overview
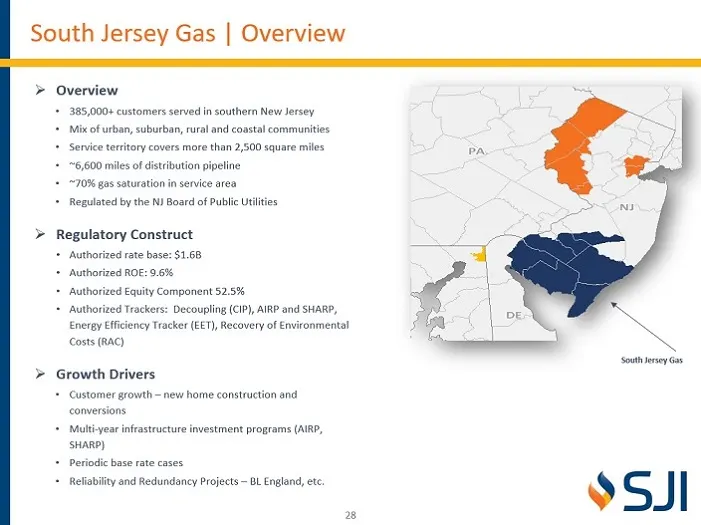
28 South Jersey Gas | Overview » Overview • 385,000+ customers served in southern New Jersey • Mix of urban, suburban, rural and coastal communities • Service territory covers more than 2,500 square miles • ~6,600 miles of distribution pipeline • ~70% gas saturation in service area • Regulated by th
Slide 29: South Jersey Gas: Customer Growth
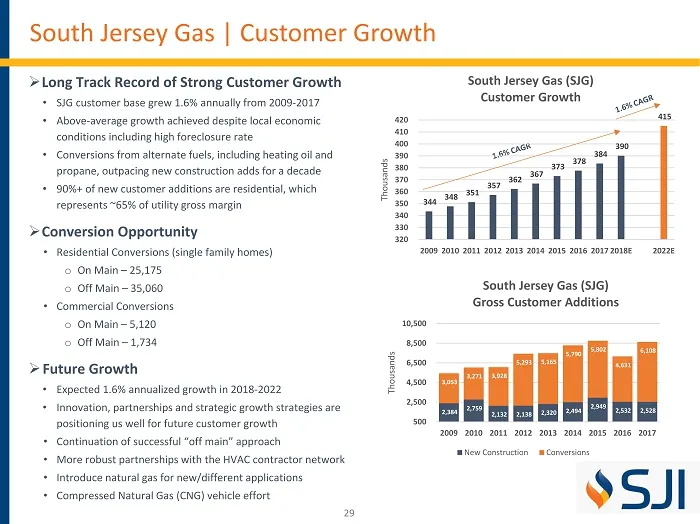
29 South Jersey Gas | Customer Growth » Long Track Record of Strong Customer Growth • SJG customer base grew 1.6% annually from 2009 - 2017 • Above - average growth achieved despite local economic conditions including high foreclosure rate • Conversions from alternate fuels, including heating oil an
Slide 30: South Jersey Gas: Infrastructure Modernization Programs
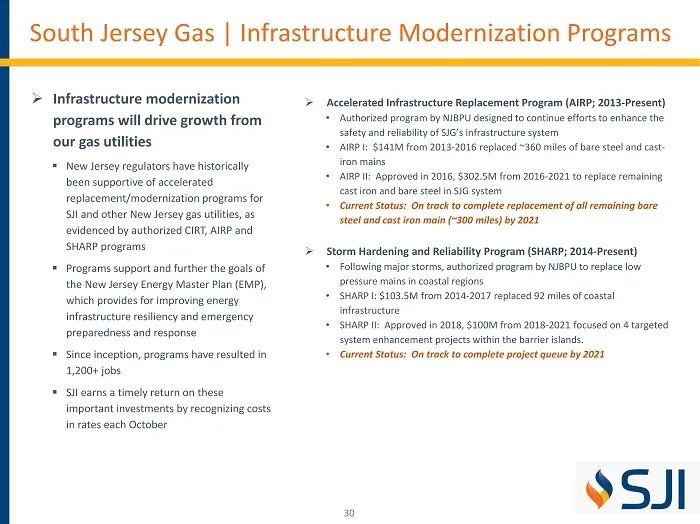
30 South Jersey Gas | Infrastructure Modernization Programs » Infrastructure modernization programs will drive growth from our gas utilities ▪ New Jersey regulators have historically been supportive of accelerated replacement/modernization programs for SJI and other New Jersey gas utilities , as evi
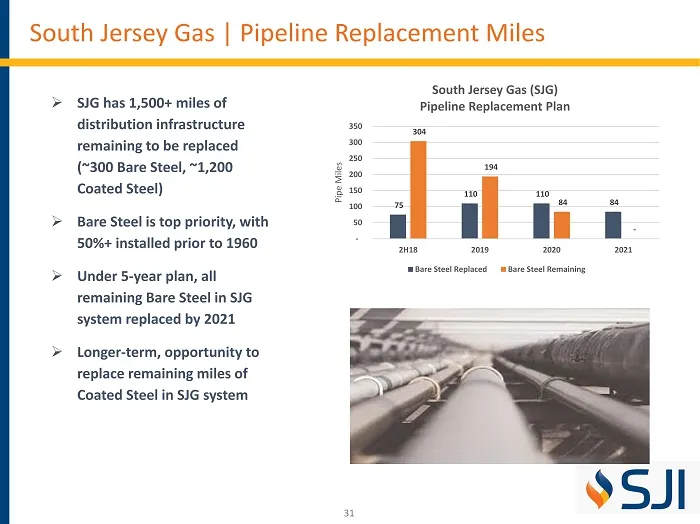
Slide 31: South Jersey Gas: Pipeline Replacement Miles
31 South Jersey Gas | Pipeline Replacement Miles » SJG has 1,500+ miles of distribution infrastructure remaining to be replaced (~300 Bare Steel, ~1,200 Coated Steel) » Bare Steel is top priority, with 50%+ installed prior to 1960 » Under 5 - year plan, all remaining Bare Steel in SJG system replace
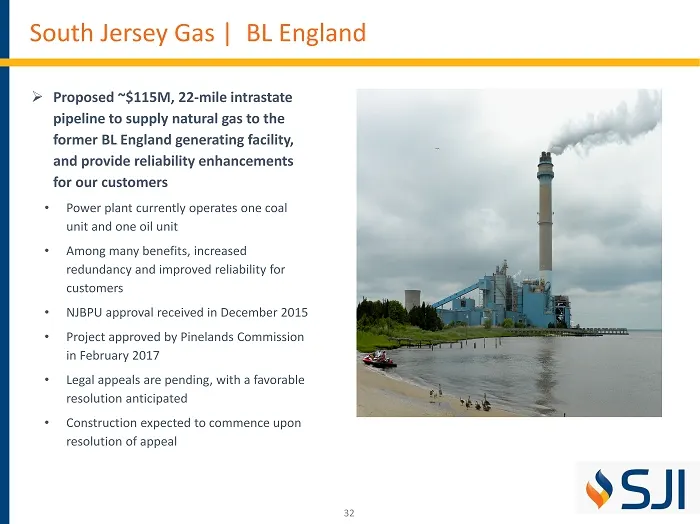
Slide 32: South Jersey Gas: BL England
32 South Jersey Gas | BL England » Proposed ~$115M, 22 - mile intrastate pipeline to supply natural gas to the former BL England generating facility, and provide reliability enhancements for our customers • Power plant currently operates one coal unit and one oil unit • Among many benefits, increase
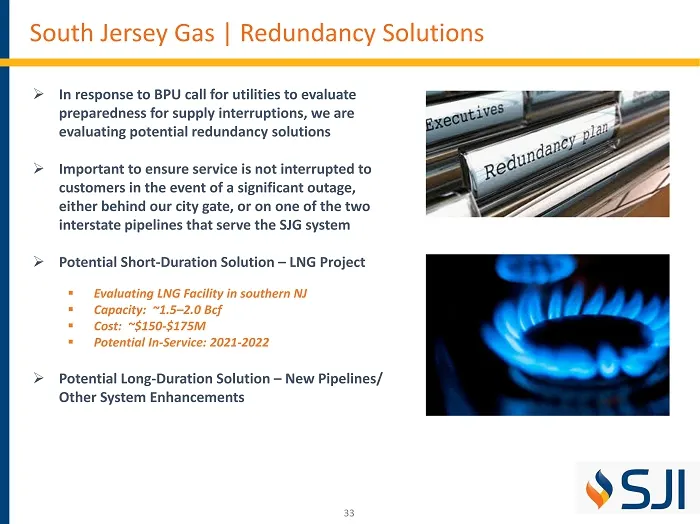
Slide 33: South Jersey Gas: Redundancy Solutions
33 South Jersey Gas | Redundancy Solutions » In response to BPU call for utilities to evaluate preparedness for supply interruptions, we are evaluating potential redundancy solutions » Important to ensure service is not interrupted to customers in the event of a significant outage, either behind our
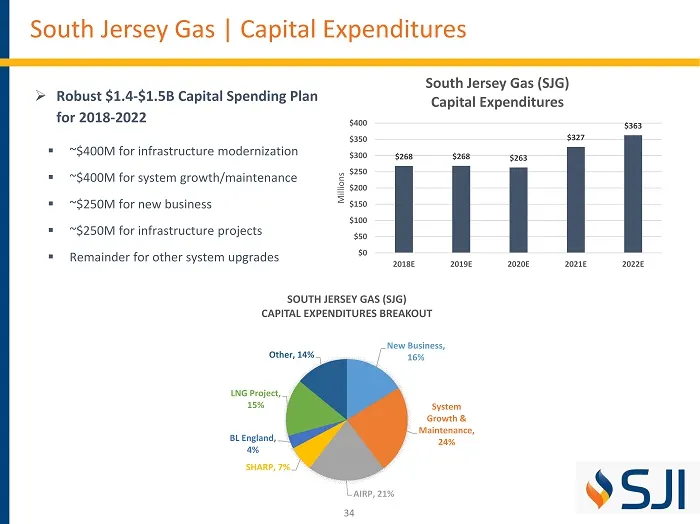
Slide 34: South Jersey Gas: Capital Expenditures
34 South Jersey Gas | Capital Expenditures » Robust $1.4 - $1.5B Capital Spending Plan for 2018 - 2022 ▪ ~$400M for infrastructure modernization ▪ ~$400M for system growth/maintenance ▪ ~$250M for new business ▪ ~$250M for infrastructure projects ▪ Remainder for other system upgrades $268 $268 $263
Slide 35: South Jersey Gas: Rate Base Growth
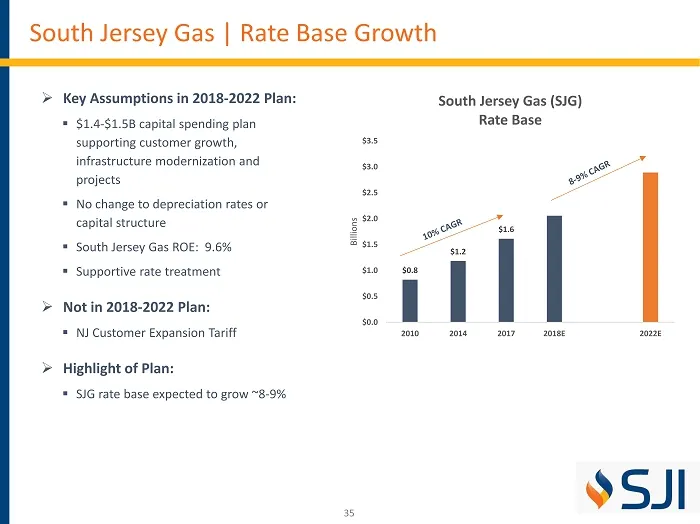
35 South Jersey Gas | Rate Base Growth » Key Assumptions in 2018 - 2022 Plan: ▪ $1.4 - $1.5B capital spending plan supporting customer growth, infrastructure modernization and projects ▪ No change to depreciation rates or capital structure ▪ South Jersey Gas ROE: 9.6% ▪ Supportive rate treatment » N
Slide 36: South Jersey Gas: Earnings Growth
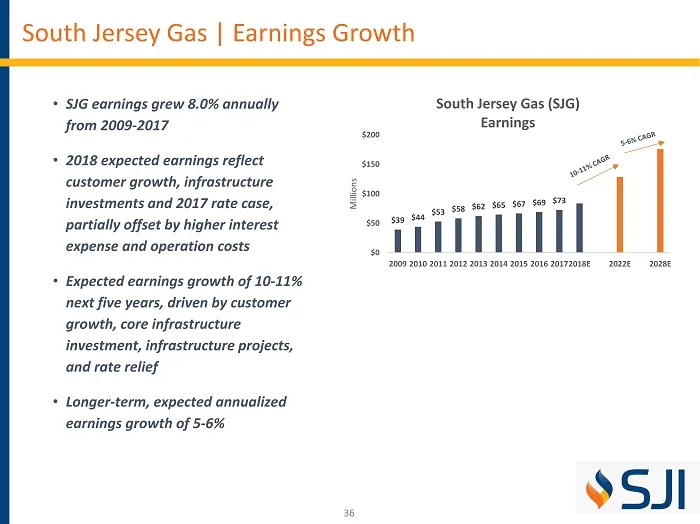
36 South Jersey Gas | Earnings Growth • SJG earnings grew 8.0% annually from 2009 - 2017 • 2018 expected earnings reflect customer growth, infrastructure investments and 2017 rate case, partially offset by higher interest expense and operation costs • Expected earnings growth of 10 - 11% next five y
Slide 37: South Jersey Gas: Upcoming Initiatives
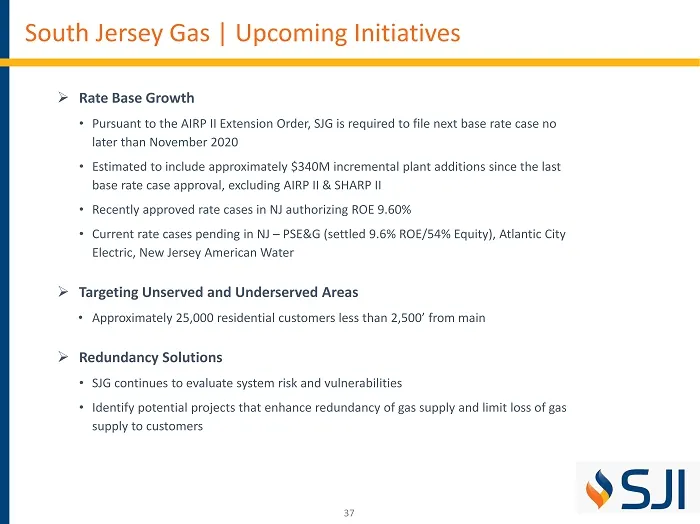
37 South Jersey Gas | Upcoming Initiatives » Rate Base Growth • Pursuant to the AIRP II Extension Order, SJG is required to file next base rate case no later than November 2020 • Estimated to include approximately $340M incremental plant additions since the last base rate case approval, excluding AI
Slide 38: Elizabethtown Gas: Overview
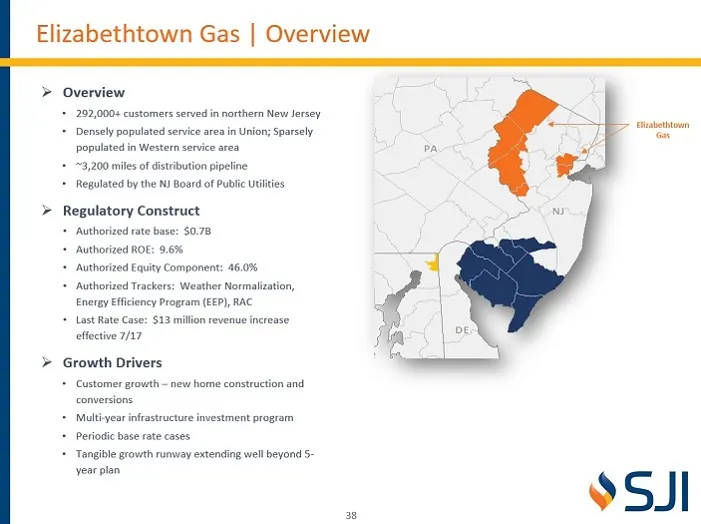
38 Elizabethtown Gas | Overview » Overview • 292,000+ customers served in northern New Jersey • Densely populated service area in Union; Sparsely populated in Western service area • ~3,200 miles of distribution pipeline • Regulated by the NJ Board of Public Utilities » Regulatory Construct • Authori
Slide 39: Elizabethtown Gas: Customer Growth
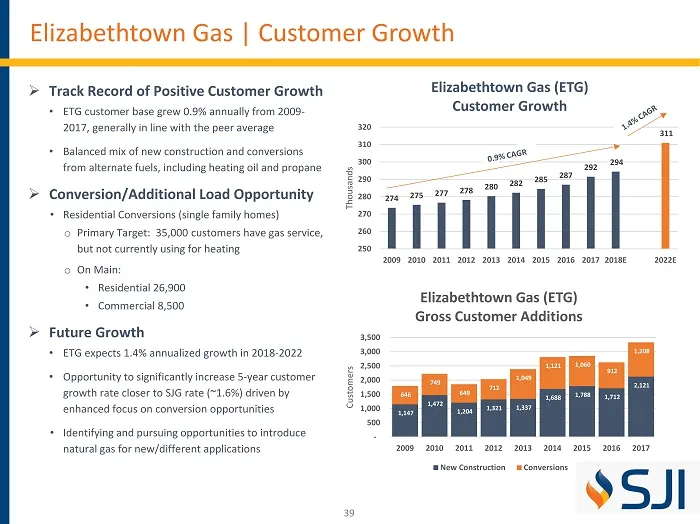
39 274 275 277 278 280 282 285 287 292 294 311 250 260 270 280 290 300 310 320 2009 2010 2011 2012 2013 2014 2015 2016 2017 2018E 2022E Thousands Elizabethtown Gas (ETG) Customer Growth Elizabethtown Gas | Customer Growth » Track Record of Positive Customer Growth • ETG customer base grew 0.9% annua
Slide 40: Elizabethtown Gas: New Infrastructure Program
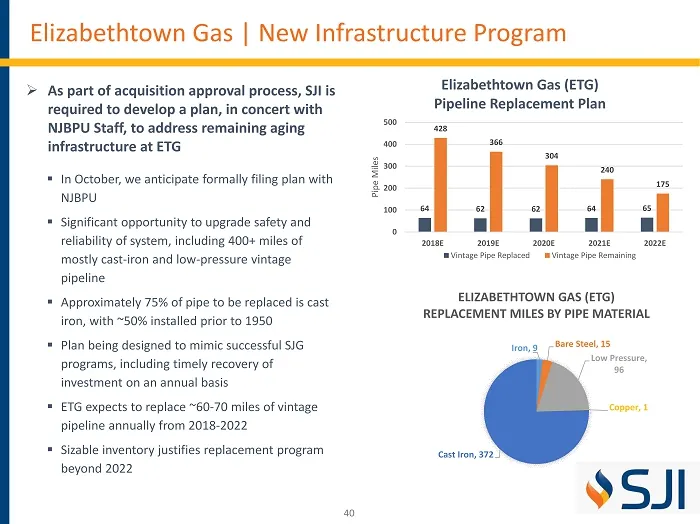
40 Elizabethtown Gas | New Infrastructure Program » As part of acquisition approval process, SJI is required to develop a plan, in concert with NJBPU Staff, to address remaining aging infrastructure at ETG ▪ In October, we anticipate formally filing plan with NJBPU ▪ Significant opportunity to upgra
Slide 41: Elizabethtown Gas: Capital Expenditures
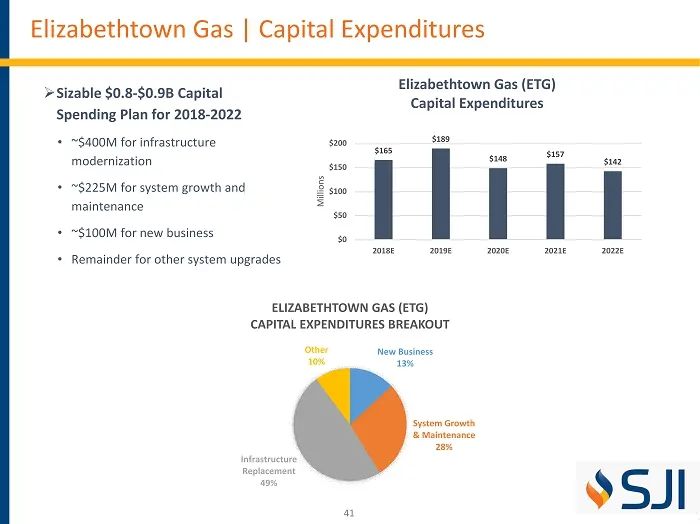
41 Elizabethtown Gas | Capital Expenditures » Sizable $0.8 - $0.9B Capital Spending Plan for 2018 - 2022 • ~$400M for infrastructure modernization • ~$225M for system growth and maintenance • ~$100M for new business • Remainder for other system upgrades $165 $189 $148 $157 $142 $0 $50 $100 $150 $200
Slide 42: Elizabethtown Gas: Rate Base Growth
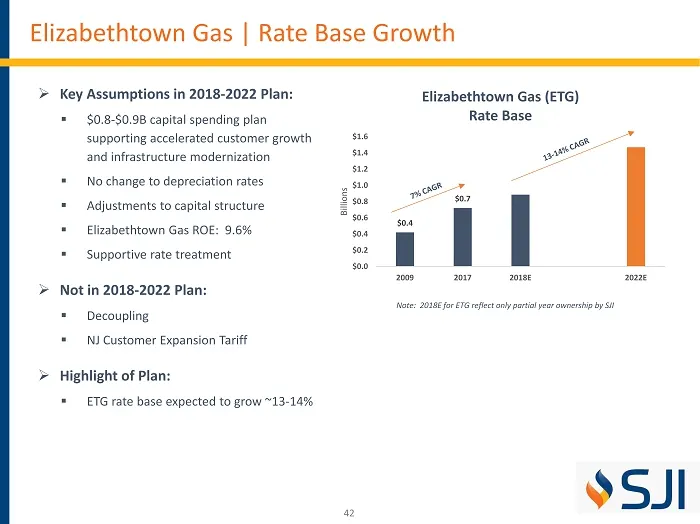
42 Elizabethtown Gas | Rate Base Growth » Key Assumptions in 2018 - 2022 Plan: ▪ $0.8 - $0.9B capital spending plan supporting accelerated customer growth and infrastructure modernization ▪ No change to depreciation rates ▪ Adjustments to capital structure ▪ Elizabethtown Gas ROE: 9.6% ▪ Supportive
Slide 43: Elizabethtown Gas: Earnings Growth
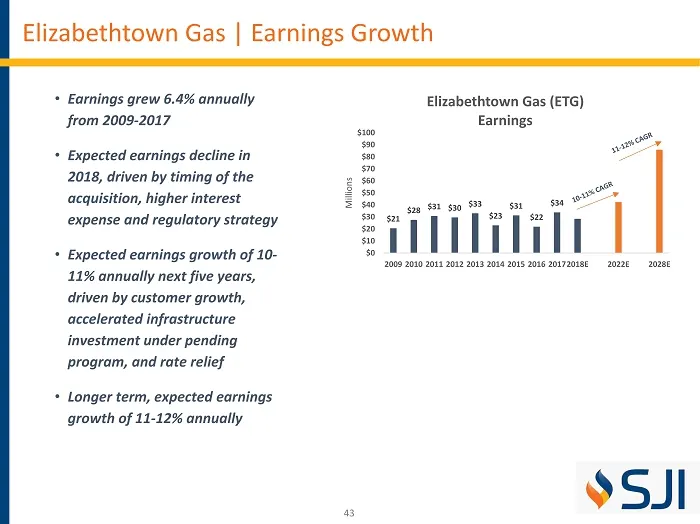
43 Elizabethtown Gas | Earnings Growth • Earnings grew 6.4% annually from 2009 - 2017 • Expected earnings decline in 2018, driven by timing of the acquisition, higher interest expense and regulatory strategy • Expected earnings growth of 10 - 11% annually next five years, driven by customer growth,
Slide 44: Elizabethtown Gas: Upcoming Initiatives
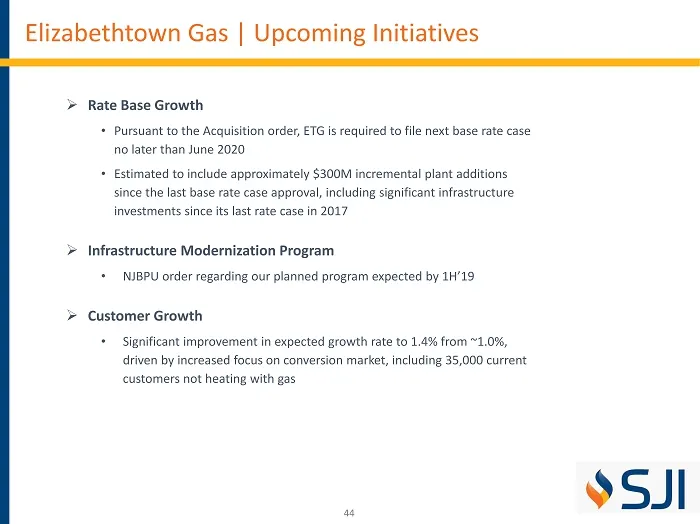
44 Elizabethtown Gas | Upcoming Initiatives » Rate Base Growth • Pursuant to the Acquisition order, ETG is required to file next base rate case no later than June 2020 • Estimated to include approximately $300M incremental plant additions since the last base rate case approval, including significant
Slide 45: Elkton Gas: Overview
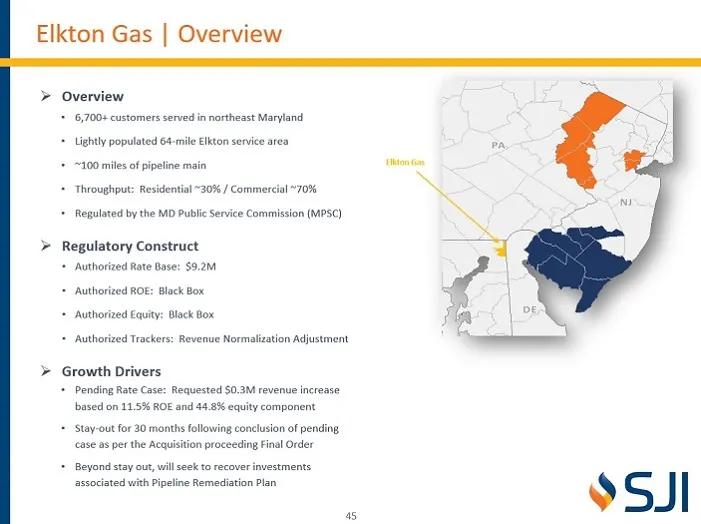
45 Elkton Gas | Overview » Overview • 6,700+ customers served in northeast Maryland • Lightly populated 64 - mile Elkton service area • ~100 miles of pipeline main • Throughput: Residential ~30% / Commercial ~70% • Regulated by the MD Public Service Commission (MPSC) » Regulatory Construct • Authori
Slide 46: SJI Utilities: Well Positioned For Strong Growth
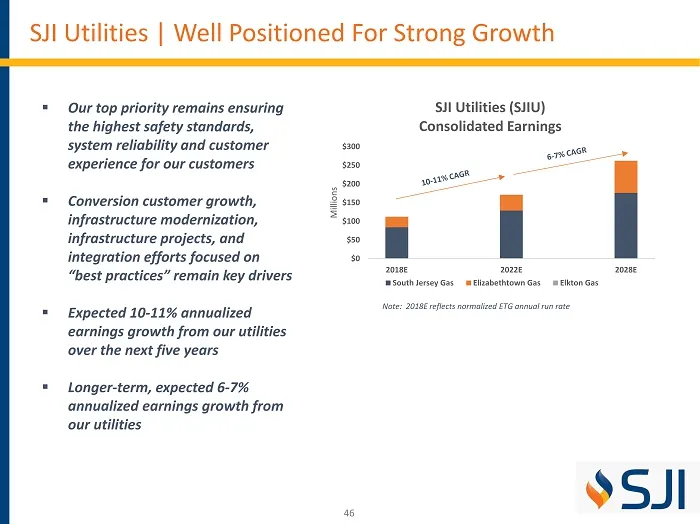
46 SJI Utilities | Well Positioned For Strong Growth ▪ Our top priority remains ensuring the highest safety standards, system reliability and customer experience for our customers ▪ Conversion customer growth, infrastructure modernization, infrastructure projects, and integration efforts focused on
Slide 47: SJI Midstream
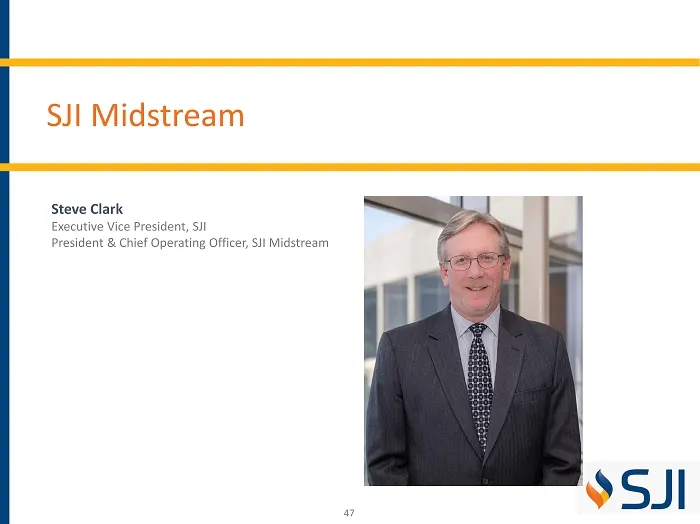
47 SJI Midstream Steve Clark Executive Vice President, SJI President & Chief Operating Officer, SJI Midstream
Slide 48: SJI Midstream: Overview
48 SJI Midstream | Overview Our Vision: ▪ Our vision is to drive shareholder value through investment in expanding and modernizing our utility infrastructure and through regulatory innovation that provides safety, reliability, value and certainty to our customers. ▪ Knowing the criticality of reliab
Slide 49: SJI Midstream: PennEast Overview
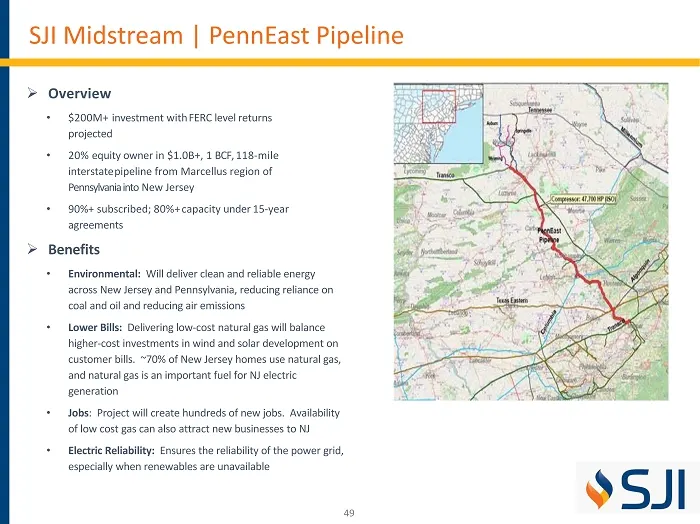
49 » Overview • $200M + investment with FERC level returns projected • 20% equity owner in $1.0B+, 1 BCF, 118 - mile interstate pipeline from Marcellus region of P ennsylvania int o N ew Jersey • 90%+ subscribed; 80% + capacity under 15 - year agreements » Benefits • Environmental: Will deliver clea
Slide 50: SJI Midstream: PennEast Status
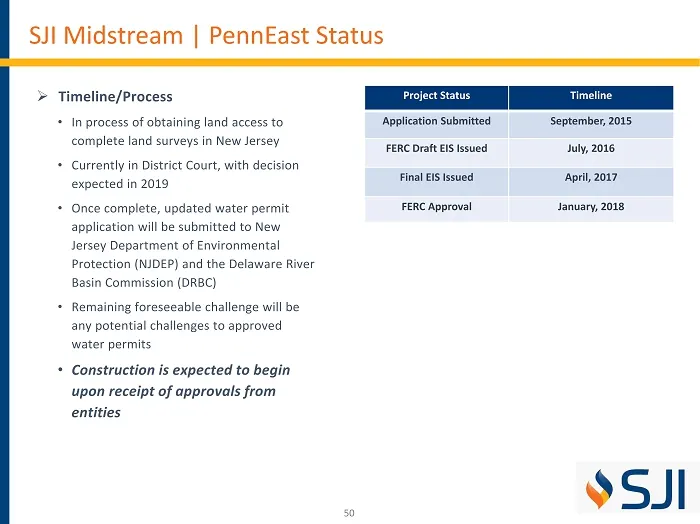
50 » Timeline/Process • In process of obtaining land access to complete land surveys in New Jersey • Currently in District Court, with decision expected in 2019 • Once complete, updated water permit application will be submitted to New Jersey Department of Environmental Protection (NJDEP) and the De
Slide 51: SJI Midstream: Earnings Growth
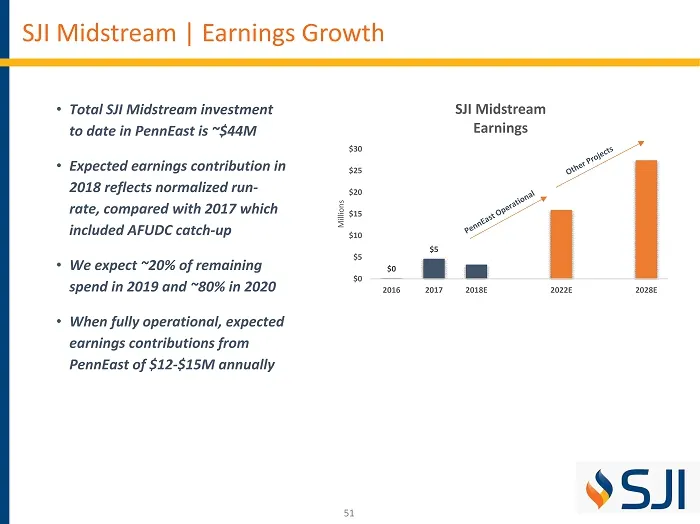
51 SJI Midstream | Earnings Growth • Total SJI Midstream investment to date in PennEast is ~$44M • Expected earnings contribution in 2018 reflects normalized run - rate, compared with 2017 which included AFUDC catch - up • We expect ~20% of remaining spend in 2019 and ~80% in 2020 • When fully opera
Slide 52: Summary: Midstream Investment Rationale
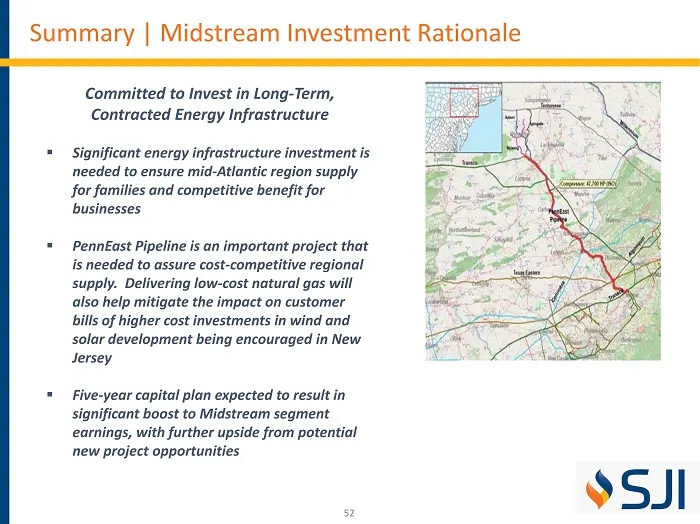
52 Summary | Midstream Investment Rationale Committed to Invest in Long - Term, Contracted Energy Infrastructure ▪ Significant energy infrastructure investment is needed to ensure mid - Atlantic region supply for families and competitive benefit for businesses ▪ PennEast Pipeline is an important pro
Slide 53: South Jersey Energy Solutions
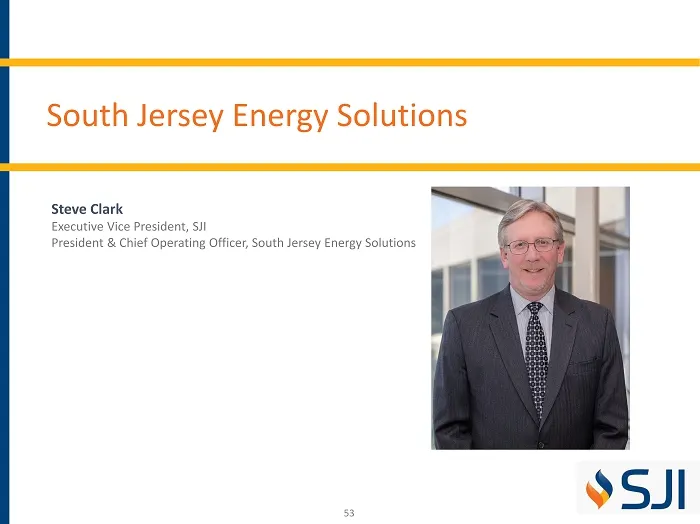
53 South Jersey Energy Solutions Steve Clark Executive Vice President, SJI President & Chief Operating Officer, South Jersey Energy Solutions
Slide 54: South Jersey Energy Solutions: Overview
54 South Jersey Energy Solutions | Overview Our Vision: ▪ Our vision is to drive shareholder value through investment in expanding and modernizing our utility infrastructure and through regulatory innovation that provides safety, reliability, value and certainty to our customers. ▪ Knowing the criti
Slide 55: Business Rationale: South Jersey Energy Solutions Overview
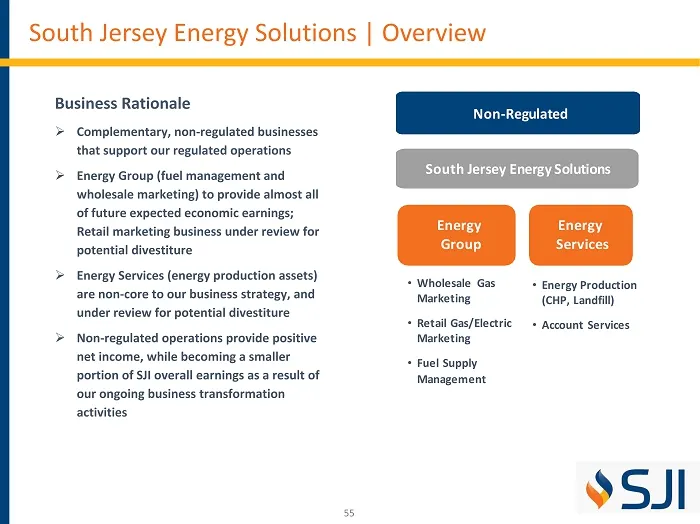
55 Business Rationale » Complementary, non - regulated businesses that support our regulated operations » Energy Group (fuel management and wholesale marketing) to provide almost all of future expected economic earnings; Retail marketing business under review for potential divestiture » Energy Servi
Slide 56: Energy Group: Overview
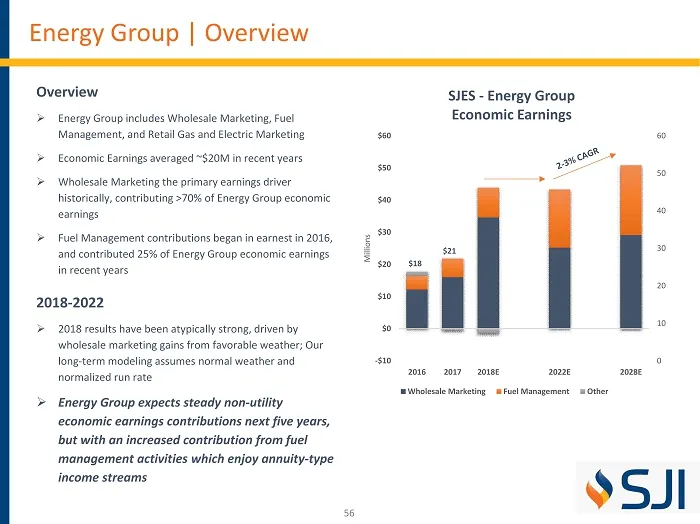
56 Overview » Energy Group includes Wholesale Marketing, Fuel Management, and Retail Gas and Electric Marketing » Economic Earnings averaged ~$20M in recent years » Wholesale Marketing the primary earnings driver historically, contributing >70% of Energy Group economic earnings » Fuel Management con
Slide 57: Energy Group: Wholesale Marketing Overview
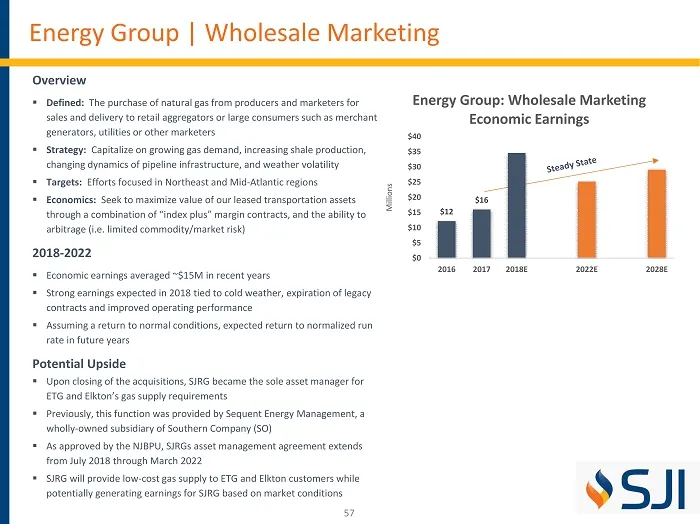
57 Overview ▪ Defined: The purchase of natural gas from producers and marketers for sales and delivery to retail aggregators or large consumers such as merchant generators, utilities or other marketers ▪ Strategy: Capitalize on growing gas demand, increasing shale production, changing dynamics of pi
Slide 58: Energy Group: Wholesale Marketing
58 Energy Group | Wholesale Marketing » How We Make Money • Optimization of leased pipeline transportation and storage services • Trading of physical gas or gas derivatives, either as a position or hedging • Utilization of a variety of strategies including asset management agreements; fuel managemen
Slide 59: Energy Group: Fuel Management Overview
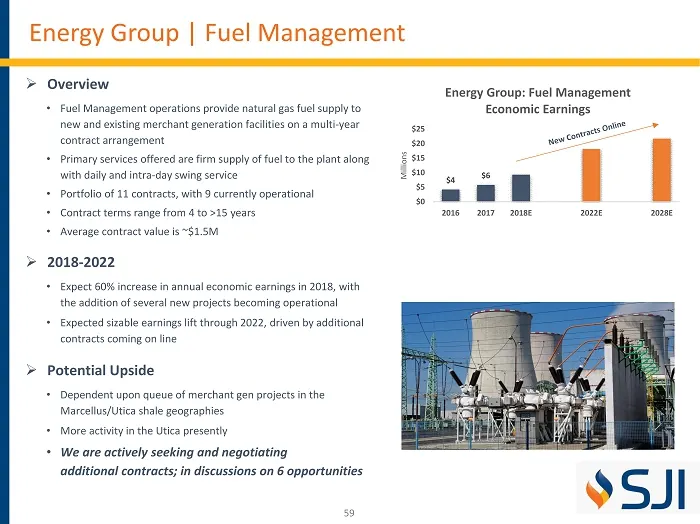
59 » Overview • Fuel Management operations provide natural gas fuel supply to new and existing merchant generation facilities on a multi - year contract arrangement • Primary services offered are firm supply of fuel to the plant along with daily and intra - day swing service • Portfolio of 11 contra
Slide 60: Energy Group: Fuel Management Contracts
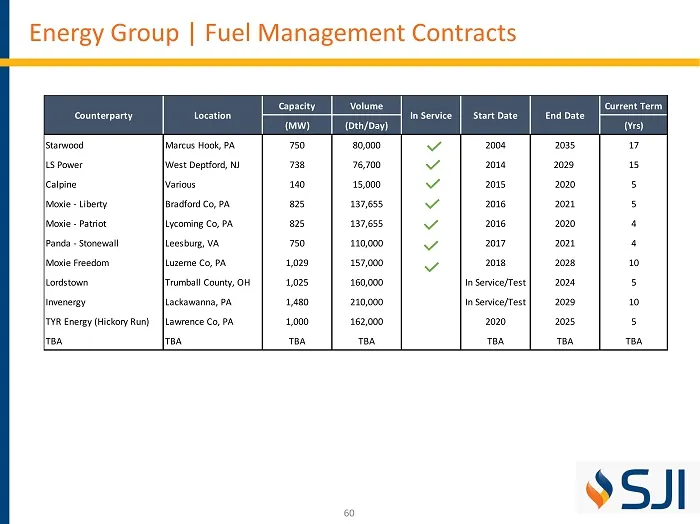
60 Energy Group | Fuel Management Contracts Capacity Volume Current Term (MW) (Dth/Day) (Yrs) Starwood Marcus Hook, PA 750 80,000 2004 2035 17 LS Power West Deptford, NJ 738 76,700 2014 2029 15 Calpine Various 140 15,000 2015 2020 5 Moxie - Liberty Bradford Co, PA 825 137,655 2016 2021 5 Moxie - Pat
Slide 61: Fuel Management: How We Make Money
61 » How We Make Money • Intrinsic - Monthly Demand Fee; Utilization Fee; Profit Sharing/Asset Management Agreement • Extrinsic - Supply Arrangements; Segmenting of Capacity; Balancing Services » Market Position • We estimate capturing a 20% market share of new merchant gen projects over the last 5
Slide 62: Energy Services: Overview
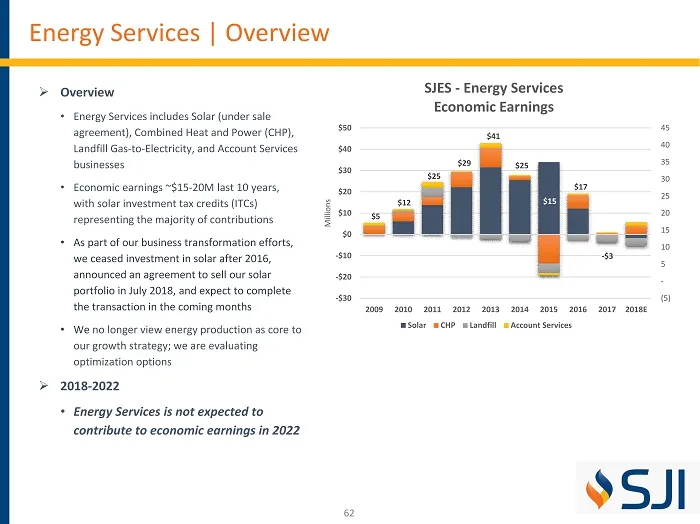
62 » Overview • Energy Services includes Solar (under sale agreement), Combined Heat and Power (CHP), Landfill Gas - to - Electricity, and Account Services businesses • Economic earnings ~$15 - 20M last 10 years, with solar investment tax credits (ITCs) representing the majority of contributions • A
Slide 63: Energy Services: Solar
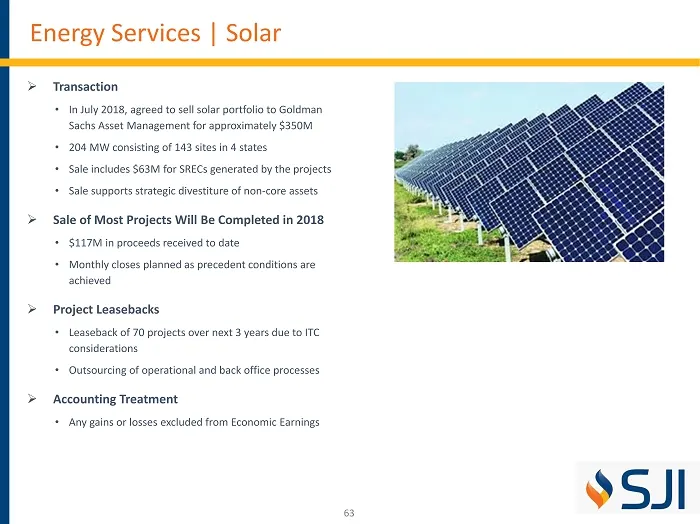
63 Energy Services | Solar » Transaction • In July 2018, agreed to sell solar portfolio to Goldman Sachs Asset Management for approximately $350M • 204 MW consisting of 143 sites in 4 states • Sale includes $63M for SRECs generated by the projects • Sale supports strategic divestiture of non - core
Slide 64: Energy Services: CHP
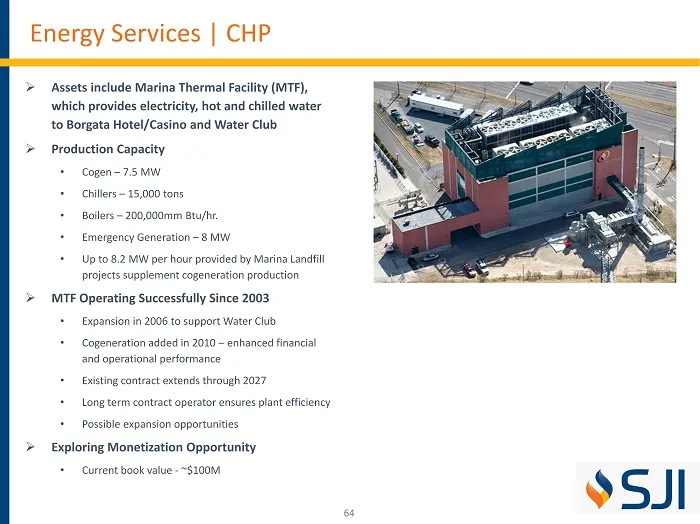
64 Energy Services | CHP » Assets include Marina Thermal Facility (MTF), which provides electricity, hot and chilled water to Borgata Hotel/Casino and Water Club » Production Capacity • Cogen – 7.5 MW • Chillers – 15,000 tons • Boilers – 200,000mm Btu/hr. • Emergency Generation – 8 MW • Up to 8.2 MW
Slide 65: Energy Services: Landfill
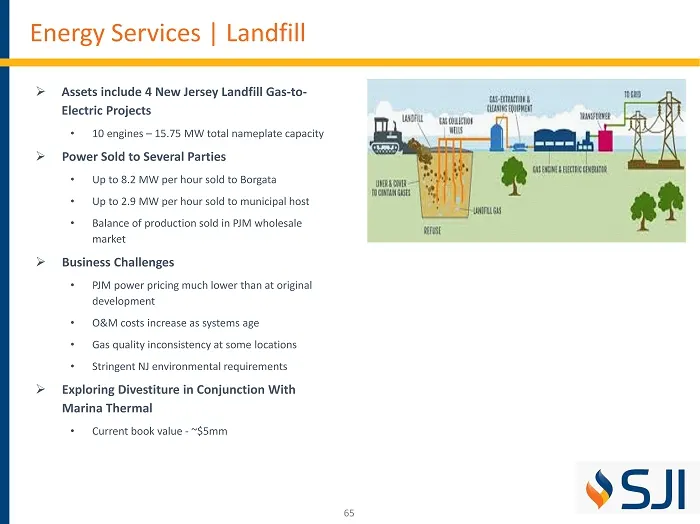
65 Energy Services | Landfill » Assets include 4 New Jersey Landfill Gas - to - Electric Projects • 10 engines – 15.75 MW total nameplate capacity » Power Sold to Several Parties • Up to 8.2 MW per hour sold to Borgata • Up to 2.9 MW per hour sold to municipal host • Balance of production sold in PJ
Slide 66: South Jersey Energy Solutions: Earnings Growth
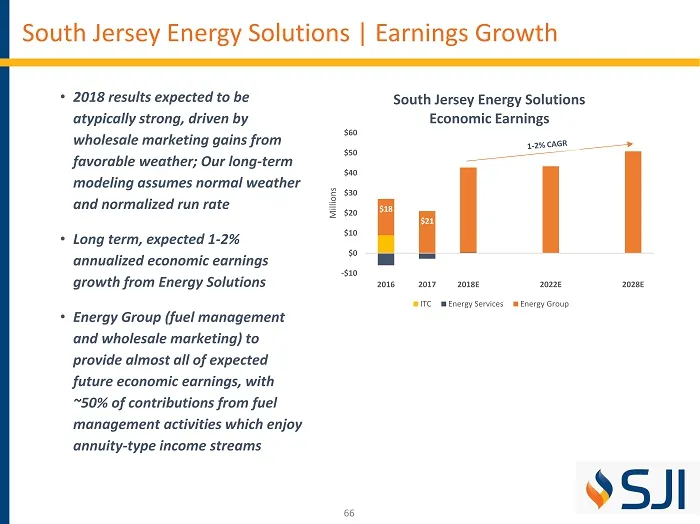
66 South Jersey Energy Solutions | Earnings Growth • 2018 results expected to be atypically strong, driven by wholesale marketing gains from favorable weather; Our long - term modeling assumes normal weather and normalized run rate • Long term, expected 1 - 2% annualized economic earnings growth fro
Slide 67: Summary: Energy Solutions Investment Rationale
67 Summary | Energy Solutions Investment Rationale Positive Cash Flow With Reduced Volatility ▪ Our focus is on maximizing profitability from our Energy Group operations, including Wholesale Marketing and Fuel Management activities ▪ We expect a reduction in Energy Group risk profile, with additiona
Slide 68: Financials
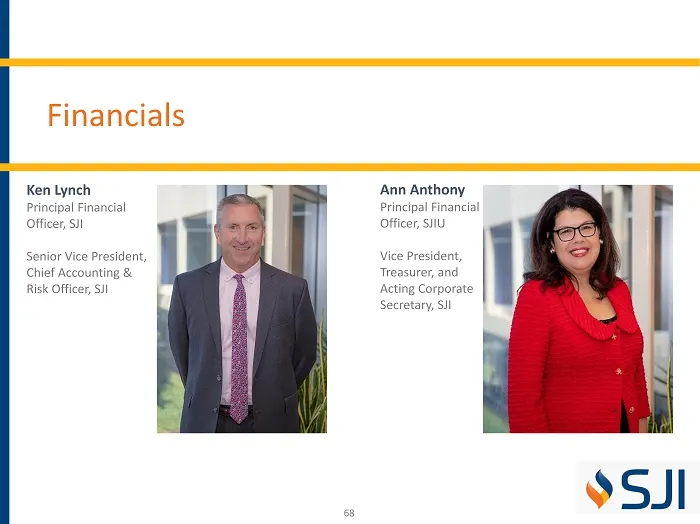
68 Financials Ken Lynch Principal Financial Officer, SJI Senior Vice President, Chief Accounting & Risk Officer, SJI Ann Anthony Principal Financial Officer, SJIU Vice President, Treasurer, and Acting Corporate Secretary, SJI
Slide 69: Financials: Capital Allocation Framework
69 Financials | Capital Allocation Framework » Strategic Growth Plan is Focused on Utilities and Midstream Projects ▪ Consolidated Capital Spending Plan ▪ Consolidated Rate Base Growth Projections ▪ Consolidated EPS Growth Projections » Balance Sheet Strengthening a Core Focus ▪ Committed to Solid I
Slide 70: Financials: Capital Expenditures 2018-2022
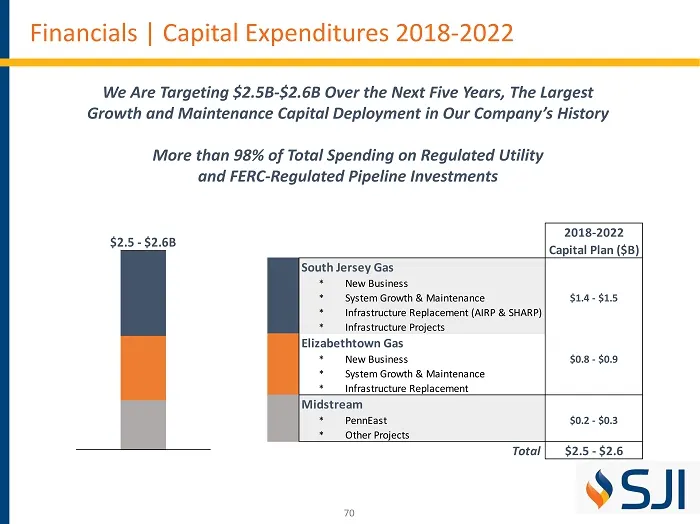
70 Financials | Capital Expenditures 2018 - 2022 We Are Targeting $2.5B - $2.6B Over the Next Five Years, The Largest Growth and Maintenance Capital Deployment in Our Company’s History More than 98% of Total Spending on Regulated Utility and FERC - Regulated Pipeline Investments 2018-2022 Capital Pl
Slide 71: Financials: Capital Expenditures By Segment
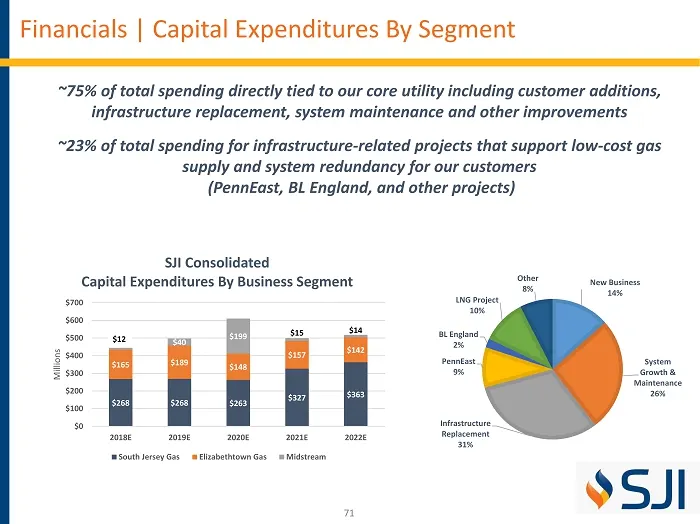
71 Financials | Capital Expenditures By Segment ~75% of total spending directly tied to our core utility including customer additions, infrastructure replacement, system maintenance and other improvements ~23% of total spending for infrastructure - related projects that support low - cost gas supply
Slide 72: Financials: Rate Base Growth 2018-2022
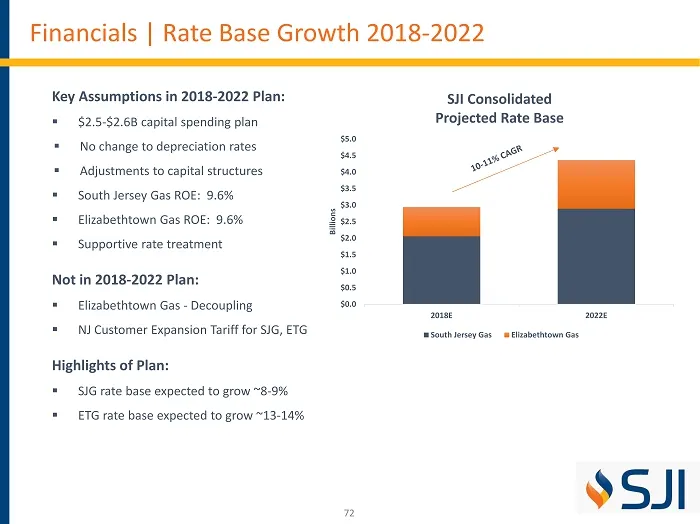
72 Financials | Rate Base Growth 2018 - 2022 Key Assumptions in 2018 - 2022 Plan: ▪ $2.5 - $2.6B capital spending plan ▪ No change to depreciation rates ▪ Adjustments to capital structures ▪ South Jersey Gas ROE: 9.6% ▪ Elizabethtown Gas ROE: 9.6% ▪ Supportive rate treatment Not in 2018 - 2022 Plan:
Slide 73: Financials: Economic EPS Growth 2018-2022
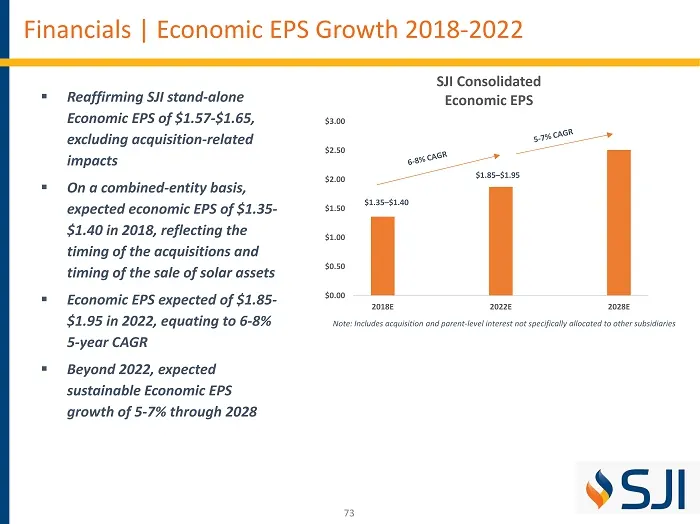
73 Financials | Economic EPS Growth 2018 - 2022 $1.35 – $1.40 ▪ Reaffirming SJI stand - alone Economic EPS of $1.57 - $1.65, excluding acquisition - related impacts ▪ On a combined - entity basis, expected economic EPS of $1.35 - $1.40 in 2018, reflecting the timing of the acquisitions and timing of
Slide 74: Financials: Financing Growth 2018-2022
74 Financials | Financing Growth 2018 - 2022 » Cash Flow From Operations is Always The First Choice to Support Investment in the Business ▪ Expected Cash Flow From Operations ~$1.1B ▪ Anticipated Investments ~($1.9B) ▪ Financing Needed ~$0.8B » Forecast Assumes a Mix of Debt and Equity ▪ Equity Forw
Slide 75: Financials: Balance Sheet and Credit Metrics
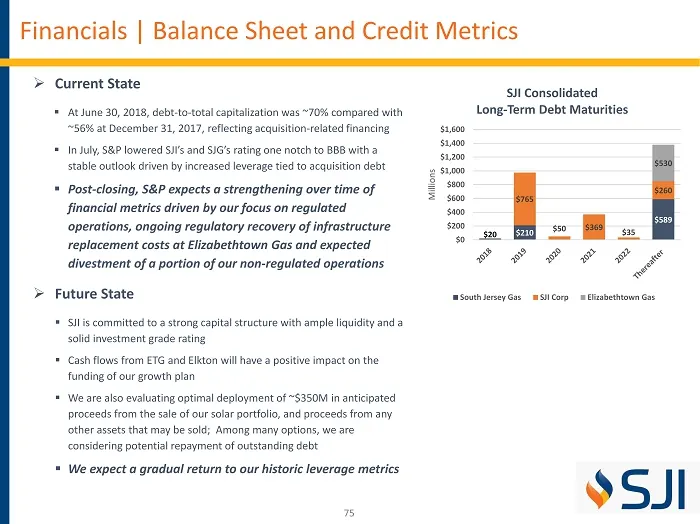
75 Financials | Balance Sheet and Credit Metrics » Current State ▪ At June 30, 2018, debt - to - total capitalization was ~70% compared with ~56% at December 31, 2017, reflecting acquisition - related financing ▪ In July, S&P lowered SJI’s and SJG’s rating one notch to BBB with a stable outlook driv
Slide 76: Financials: Dividend Growth 2018-2022
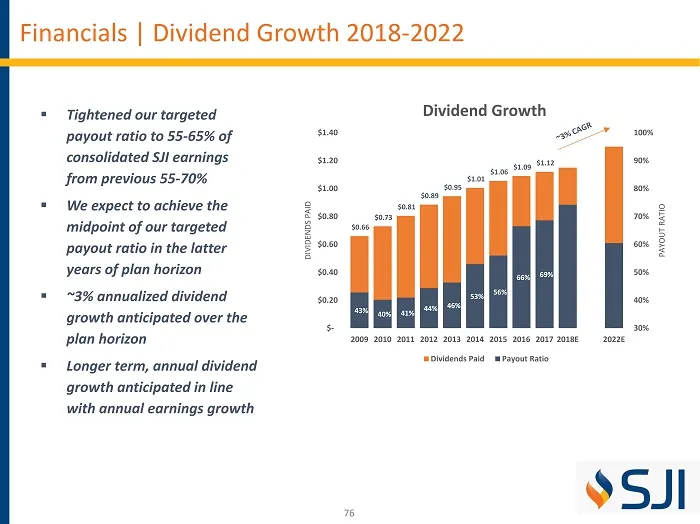
76 Financials | Dividend Growth 2018 - 2022 ▪ Tightened our targeted payout ratio to 55 - 65% of consolidated SJI earnings from previous 55 - 70% ▪ We expect to achieve the midpoint of our targeted payout ratio in the latter years of plan horizon ▪ ~3% annualized dividend growth anticipated over the
Slide 77: Closing Remarks
77 Closing Remarks Michael J. Renna President and Chief Executive Officer, SJI
Slide 78: SJI: Well Positioned For Top-Tier Shareholder Returns
78 SJI | Well Positioned For Top - Tier Shareholder Returns x We have kept our promises to you to transform the business x Strong utility growth position x Lowered risk profile with asset sales x Commitment to strong balance sheet, credit ratings x Steady - state base capital spending plan x Increme
Slide 79: Thank You For Your Interest in SJI!
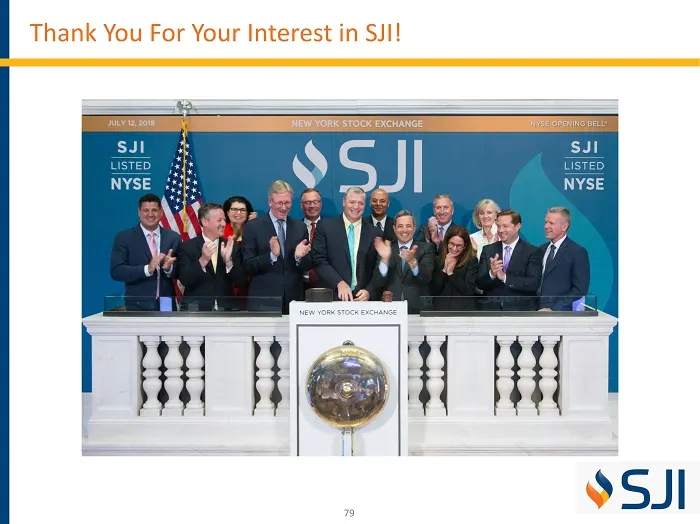
79 Thank You For Your Interest in SJI!
Slide 80: SJI Board of Directors
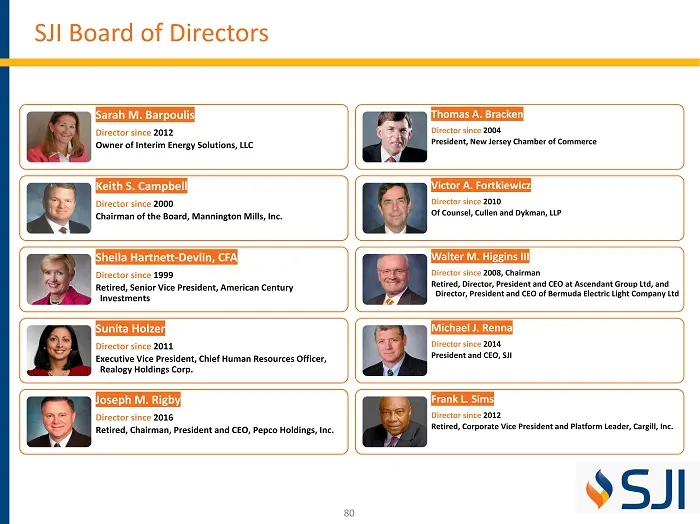
80 SJI Board of Directors Sarah M. Barpoulis Director since 2012 Owner of Interim Energy Solutions, LLC Keith S. Campbell Director since 2000 Chairman of the Board, Mannington Mills, Inc. Sheila Hartnett - Devlin, CFA Director since 1999 Retired, Senior Vice President, American Century Investments S
Slide 81: Non-GAAP Financial Measures
81 Non - GAAP Financial Measures Management uses the non - generally accepted accounting principles (non - GAAP) financial measures of Economic Earnings and Economic Earnings per share when evaluating its results of operations. These non - GAAP financial measures should not be considered as an alter
Source: SEC EDGAR · 8-K filed Oct 22, 2018
More decks from South Jersey Industries Inc
 FY2021 Earnings Presentation29 slides · Feb 24, 2022
 Q3 2021 Earnings Presentation31 slides · Nov 3, 2021
 Q2 2021 Earnings Presentation31 slides · Aug 4, 2021
 Investor Day (May 2021)88 slides · May 6, 2021
 FY2020 Earnings Presentation31 slides · Feb 24, 2021
 Q3 2020 Earnings Presentation37 slides · Nov 4, 2020