Sunrise Senior Living — Sunrise Assisted Living — Investor Presentation (June 2001)
46 slides from Sunrise Senior Living's investor presentation, Jun 14, 2001
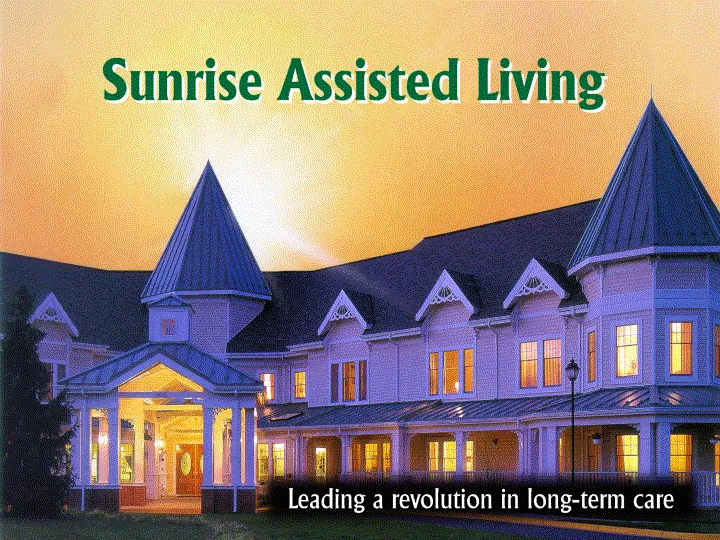
Slide 1: Sunrise Assisted Living
Slide 2: Company Presentation, June 14, 2001
SUNRISE ASSISTED LIVING, INC. COMPANY PRESENTATION JUNE 14, 2001
Slide 3: Forward-looking statements
SUNRISE ASSISTED LIVING, INC. Estimates of future earnings are by definition, and certain other matters discussed in this presentation may be, forward-looking statements within the meaning of the Private Securities Litigation Reform Act of 1995. Although ‘Sunrise believes the expectations reflected
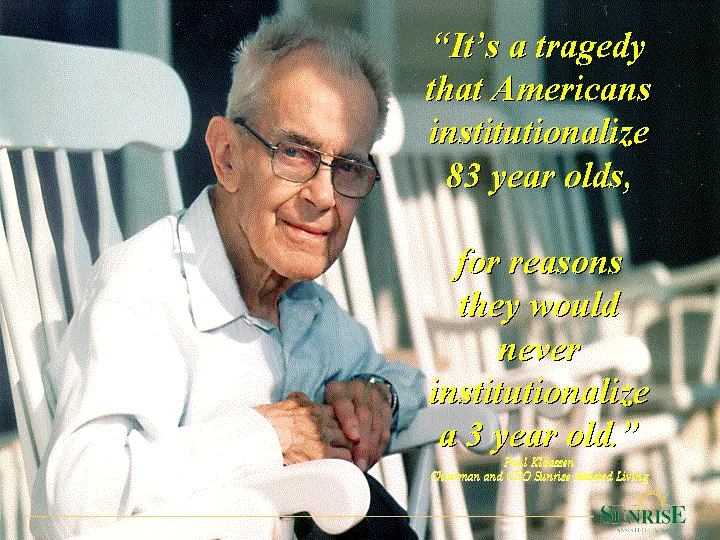
Slide 4: Quote from Paul Klaassen, Chairman and CEO
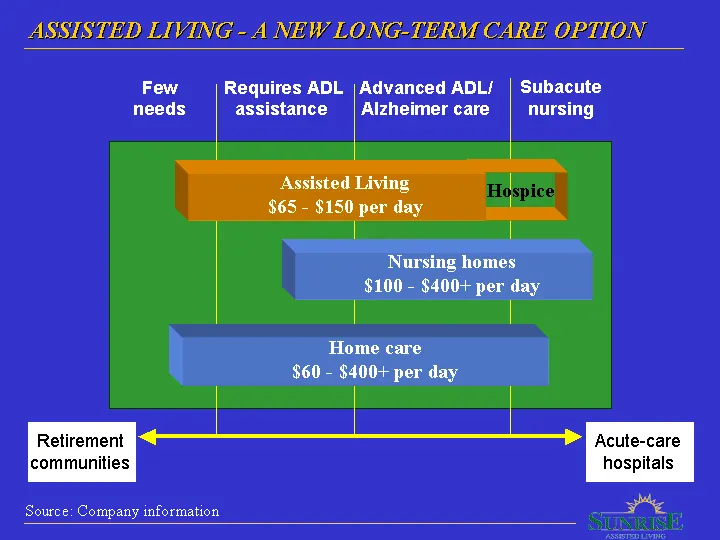
Slide 5: Assisted Living: A New Long-Term Care Option
ASSISTED LIVING A NEW LONG-TERM CARE OPTION Few Requires ADL |Advanced ADL/ | Subacute needs assistance | Alzheimer care nursing Nursing homes $100 - $400+ per day Home care $60 - $400+ per day Source: Company information Acute-care hospitals ie
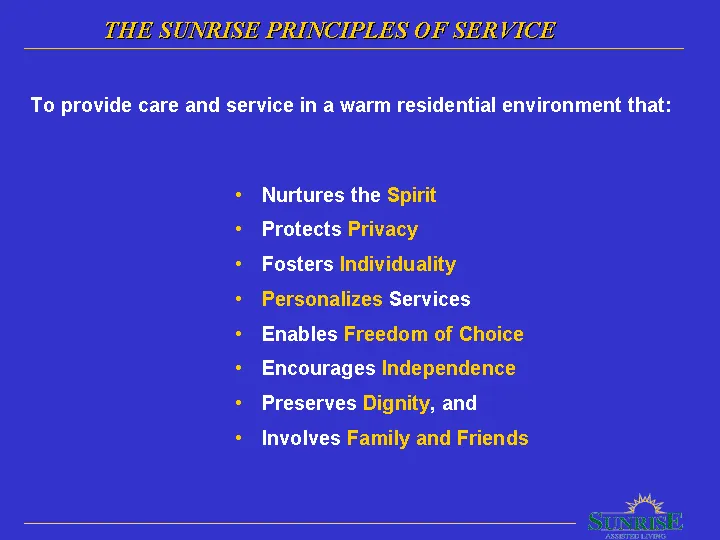
Slide 6: The Sunrise Principles of Service
THE SUNRISE PRINCIPLES OF SERVICE To provide care and service in a warm residential environment that: + Nurtures the Spirit + Protects Privacy + Fosters Individuality ° Personalizes Services - Enables Freedom of Choice + Encourages Independence + Preserves Dignity, and + Involves Family and Friends
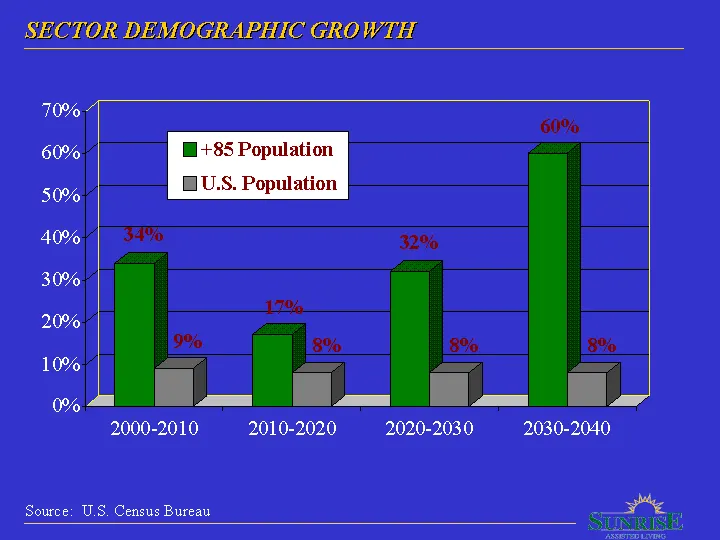
Slide 7: Sector Demographic Growth
SECTOR DEMOGRAPHIC GROWTH 70% on |—cLVKk 50% 40% 60% 30% 20% 10% 0% 2000-2010 2010-2020 2020-2030 2030-2040 Source: U.S. Census Bureau
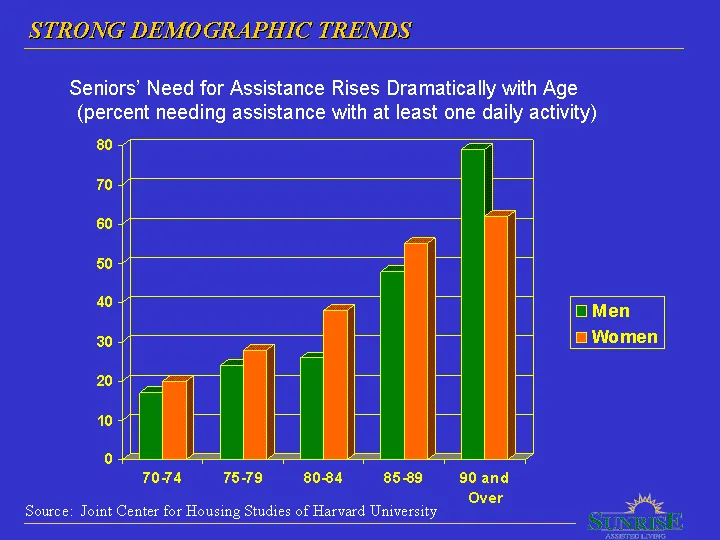
Slide 8: Strong Demographic Trends
STRONG DEMOGRAPHIC TRENDS, Seniors’ Need for Assistance Rises Dramatically with Age (percent needing assistance with at least one daily activity) 80 70 60 50 “0 OMen Women 30 20 10 C) 70-74 75-79 80-84 85-89 90and Over Source: Joint Center for Housing Studies of Harvard University
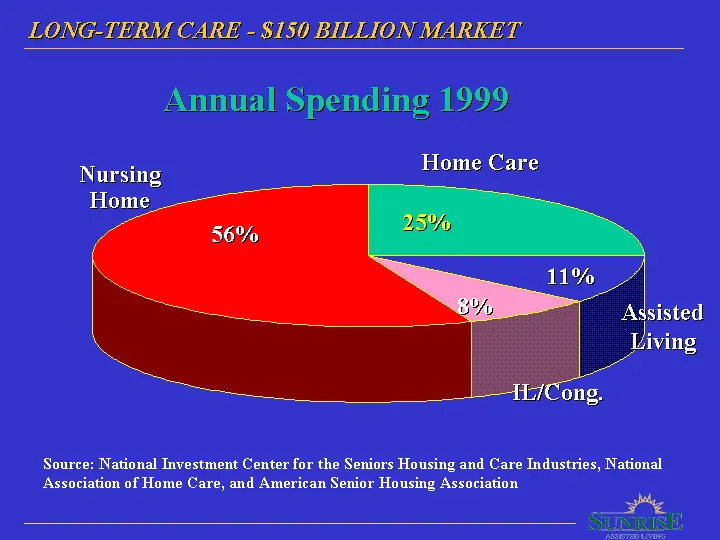
Slide 9: Long-Term Care - $150 Billion Market
LONG-TERM CARE - $150 BILLION MARKET Annual Spending 1999 Home Care Nursing Home EL sisted iving, L/Cong, Source: National Investment Center for the Seniors Housing and Care Industries, National Association of Home Care, and American Senior Housing Association
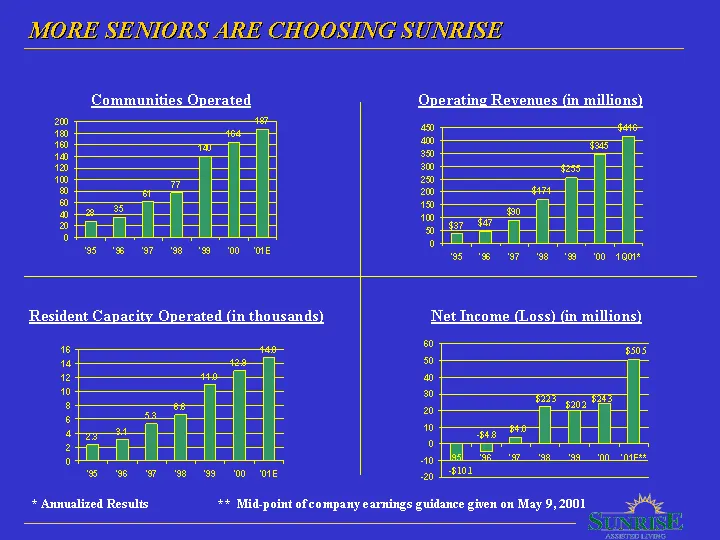
Slide 10: More Seniors Are Choosing Sunrise
MORE SENIORS ARE CHOOSING SUNKISE Communities Operated Operating Revenues (in millions) g a 160 “ as 1 30 % on ie = ao = 200 a io a 3s 10 80 a eee 4 SDT DD Dw 95'S SF SB "0 100 Resident Capacity Operated (in thousands} Net Income ya os 144 so nef © no 2 e val ia bat ay ” $48 : a a 40 x 6 ew se sw OE
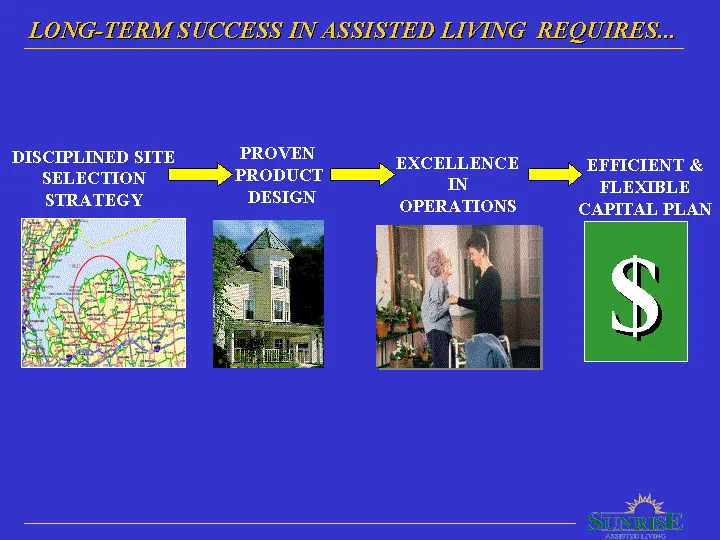
Slide 11: Long-Term Success in Assisted Living Requires...
LONG-TERM SUCCESS IN ASSISTED LIVING REQUIRES... DISCIPLINED SITE PROVEN EXCELLENCE EFFICIENT & SELECTION ==> PRODUCT > as DESIGN FLEXIBLE OPERATIONS
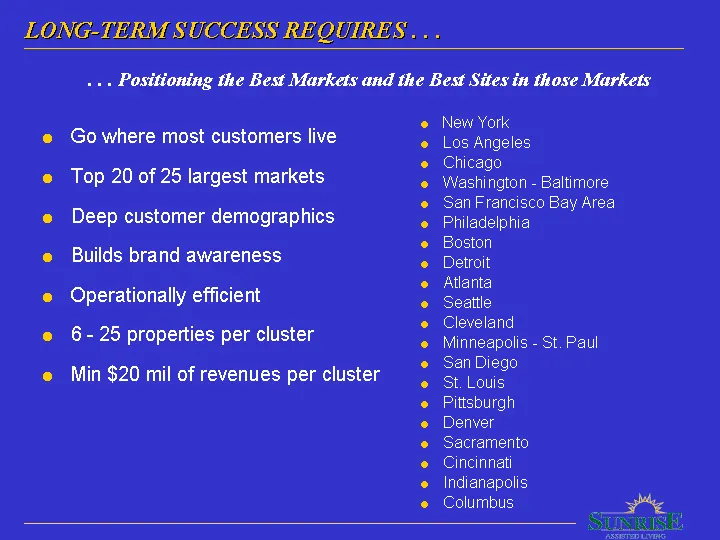
Slide 12: Long-Term Success Requires... Best Markets and Sites
LONG-TERM SUCCESS REQUIRES... ... Positioning the Best Markets and the Best Sites in those Markets New York Los Angeles Chicago Washington - Baltimore San Francisco Bay Area Philadelphia Boston Detroit Atlanta Seattle Cleveland Minneapolis - St. Paul San Diego St. Louis Pittsburgh Denver Sacramento
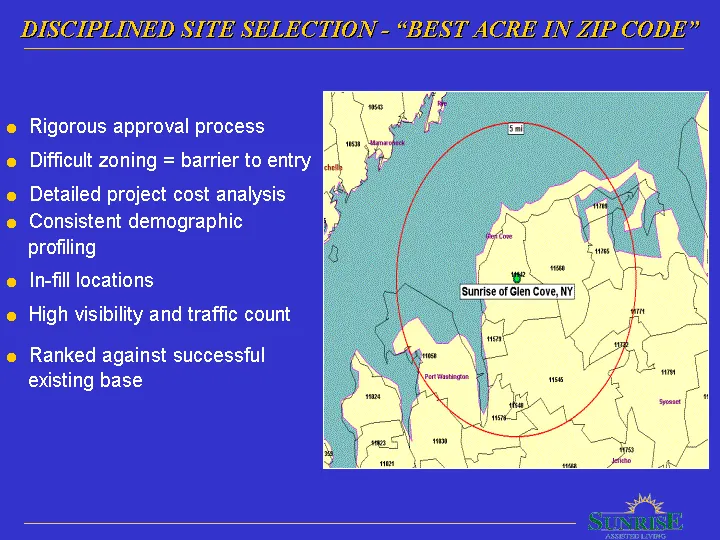
Slide 13: Disciplined Site Selection - Best Acre in Zip Code
DISCIPLINED SITE SELECTION - “BEST ACKE IN ZIP CODE” ie ~__{Suniseofcien cove.ny] ~~! my eae
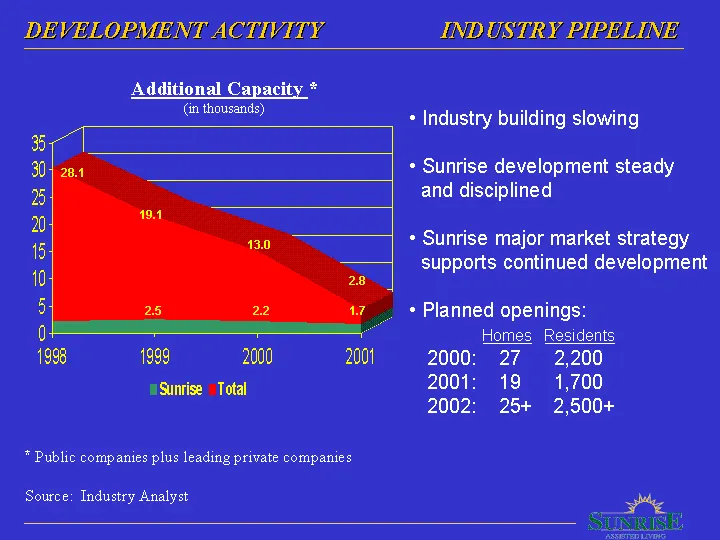
Slide 14: Development Activity Industry Pipeline
DEVELOPMENT ACTIVITY INDUSTRY PIPELINE Additional Capacity * (in thousands) + Industry building slowing 5) 30 + Sunrise development steady B and disciplined t + Sunrise major market strategy 0 supports continued development 5 + Planned openings: 0 Homes Residents 1998 1999 2000 2001 2000: 27 2,200 1
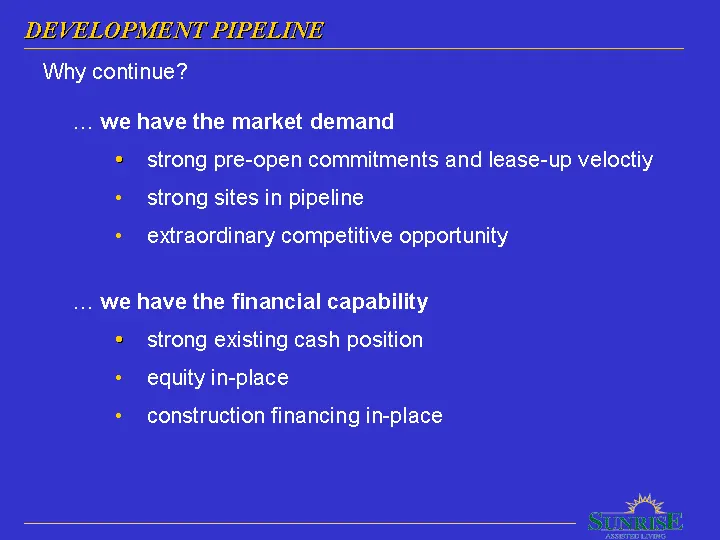
Slide 15: Development Pipeline
DEVELOPMENT PIPELINE Why continue? ... we have the market demand « strong pre-open commitments and lease-up veloctiy - strong sites in pipeline - extraordinary competitive opportunity ... we have the financial capability « strong existing cash position ° equity in-place * construction financing in-p
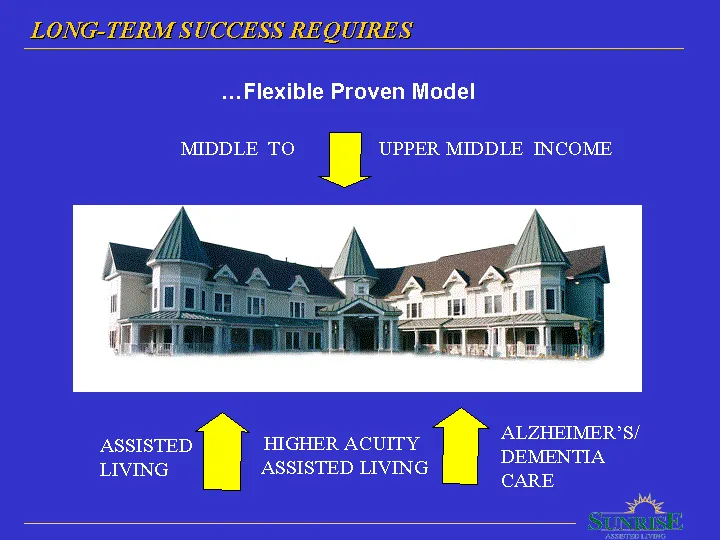
Slide 16: Long Term Success Requires... Flexible Proven Model
LONG TERM SUCCESS REQUIRES, ...Flexible Proven Model MIDDLE TO i | UPPER MIDDLE INCOME ALZHEIMER’S/ DEMENTIA CARE ASSISTED HIGHER ACUITY LIVING ASSISTED LIVING
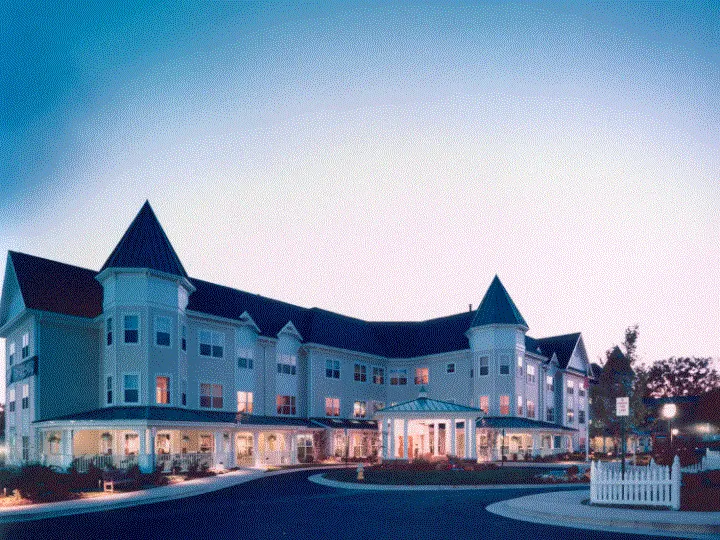
Slide 17
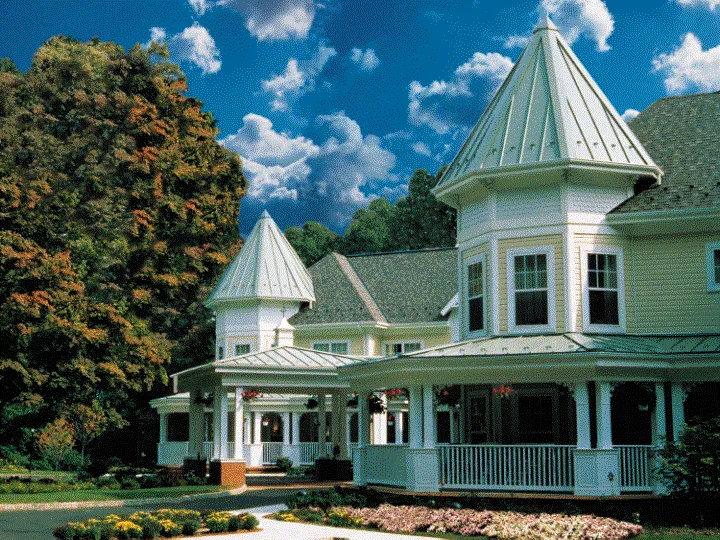
Slide 18
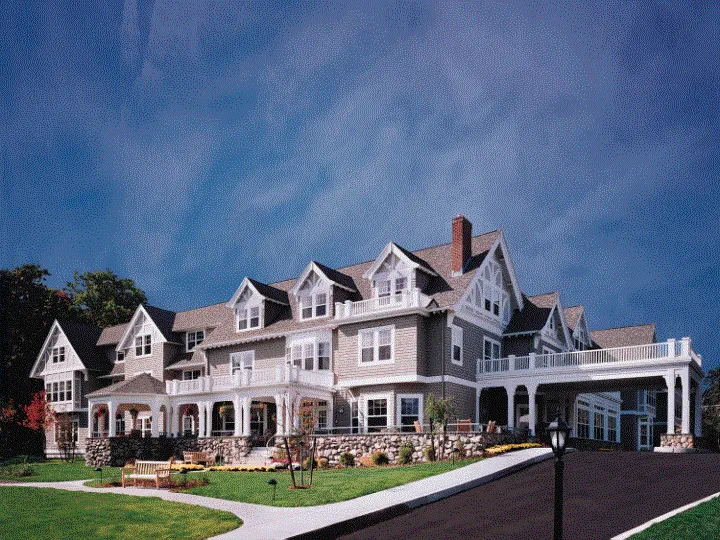
Slide 19
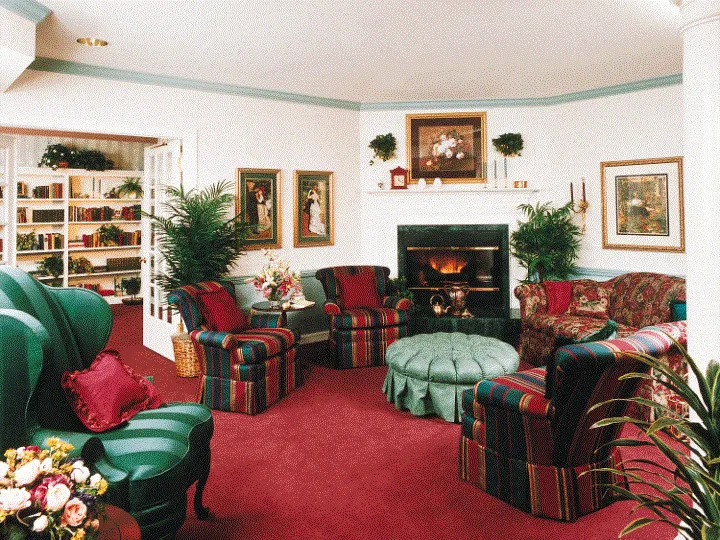
Slide 20
Slide 21
Slide 22
Slide 23: Model Economics
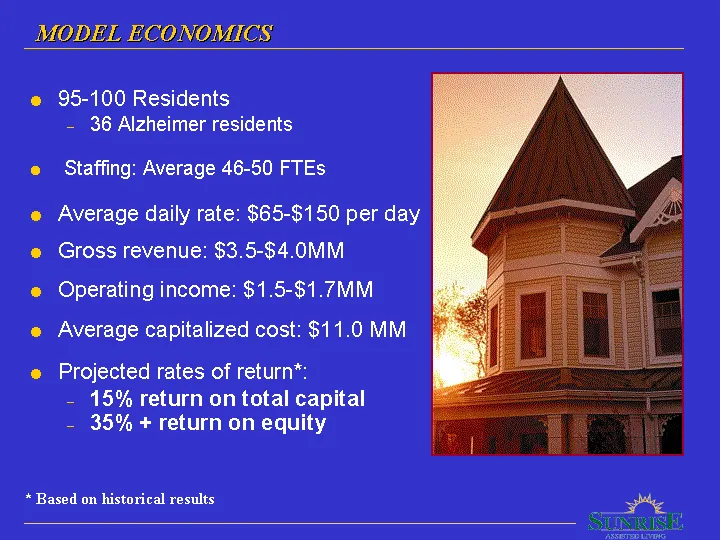
MODEL ECONOMICS, e 95-100 Residents — 36 Alzheimer residents e Staffing: Average 46-50 FTEs e Average daily rate: $65-$150 per day e Gross revenue: $3.5-$4.0MM e Operating income: $1.5-$1.7MM e Average capitalized cost: $11.0 MM e Projected rates of return*: - 15% return on total capital - 35% + ret
Slide 24: Long Term Success Requires... Excellence in Operations
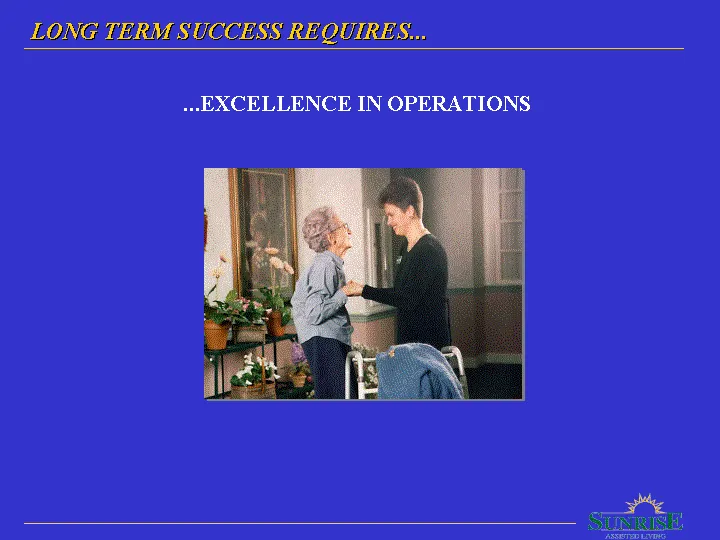
LONG TERM SUCCESS REQUIRES... .«» EXCELLENCE IN OPERATIONS
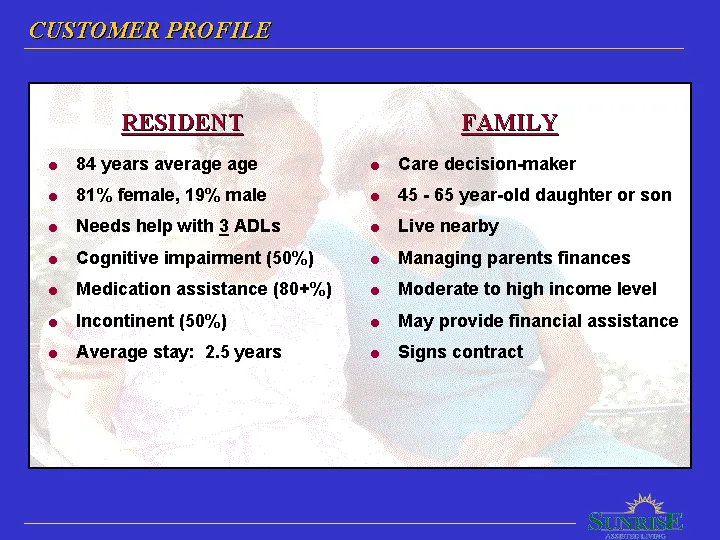
Slide 25: Customer Profile
CUSTOMER PROFILE RESIDENT e 84 years average age e 81% female, 19% male e Needs help with 3 ADLs e Cognitive impairment (50%) e Medication assistance (80+%) e Incontinent (50%) e Average stay: 2.5 years 45 - 65 year-old daughter or son Live nearby Managing parents finances Moderate to high income le
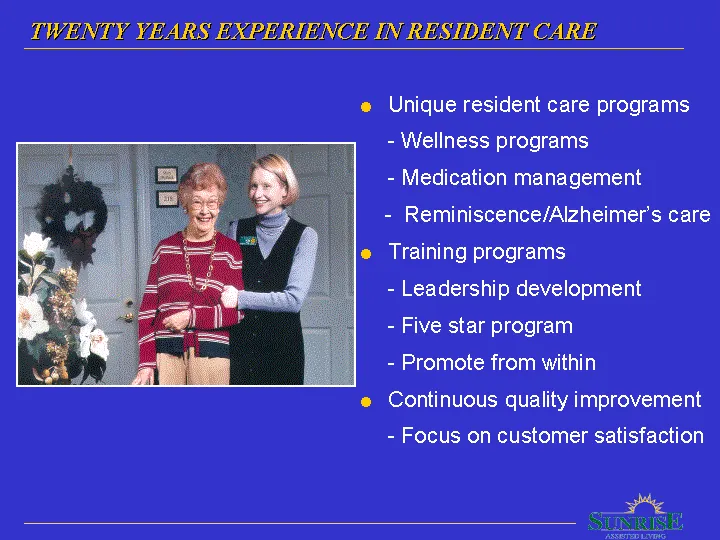
Slide 26: Twenty Years Experience in Resident Care
TWENTY YEARS EXPERIENCE IN RESIDENT CARE e Unique resident care programs - Wellness programs - Medication management - Reminiscence/Alzheimer's care e Training programs - Leadership development - Five star program - Promote from within e Continuous quality improvement - Focus on customer satisfactio
Slide 27: Long Term Success Requires... Efficient & Flexible Capital Plan
LONG TERM SUCCESS REQUIRES... ... EFFICIENT & FLEXIBLE CAPITAL PLAN
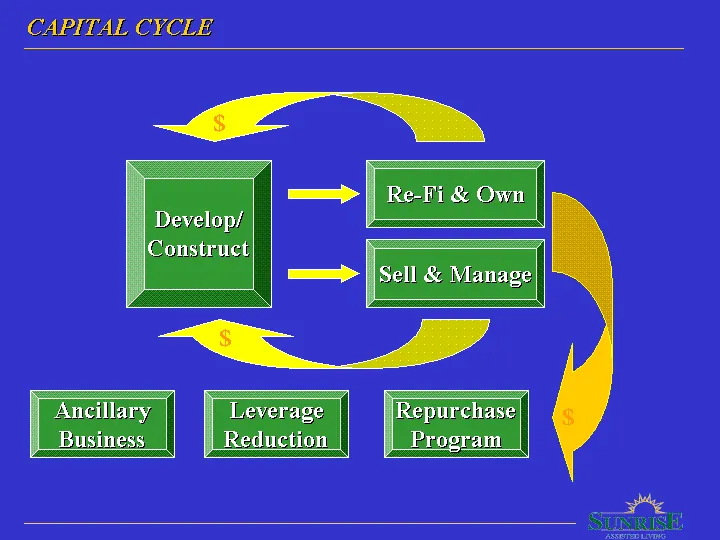
Slide 28: Capital Cycle
CAPITAL CYCLE i — [eon — fee]
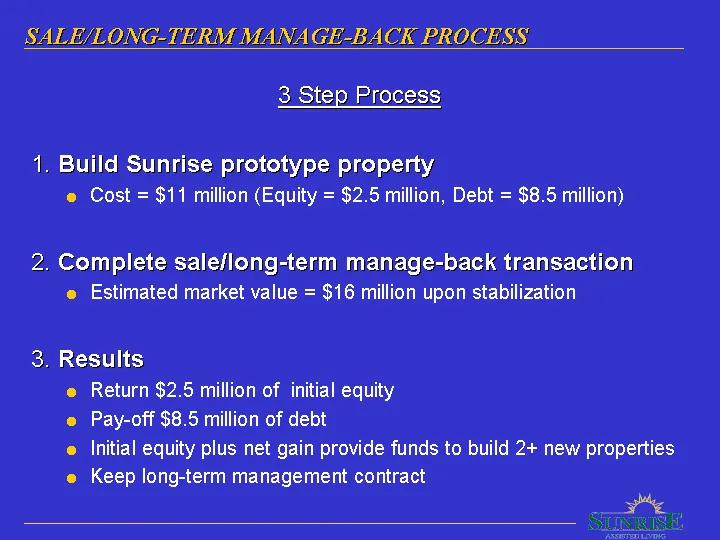
Slide 29: Sale/Long-Term Manage-Back Process
SALE/LONG- TERM MANAGE-BACK PROCESS: 3 Step Process 1. Build Sunrise prototype property e Cost = $11 million (Equity = $2.5 million, Debt = $8.5 million) 2, Complete sale/long-term manage-back transaction e Estimated market value = $16 million upon stabilization 3. Results e Return $2.5 million of i
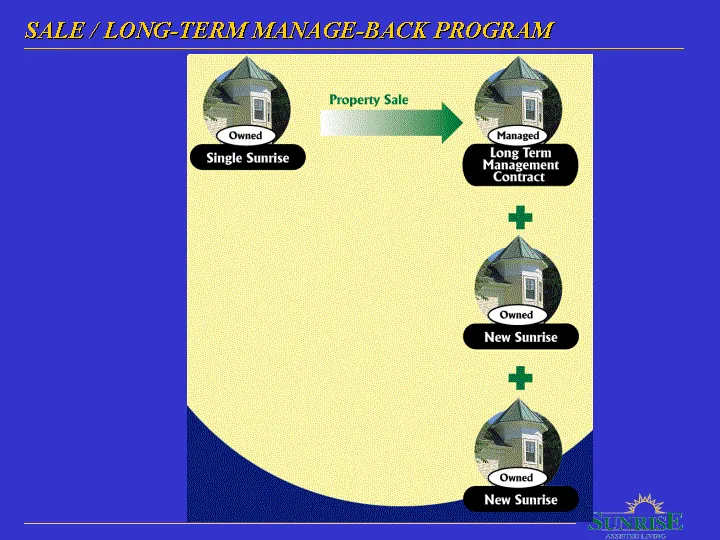
Slide 30: Sale / Long-Term Manage-Back Program
SALE / LONG-TERM MANAGH-BACK PROGRAM Long Term Management Contract Single Sunrise : = New Sunrise Gi) New Sunrise
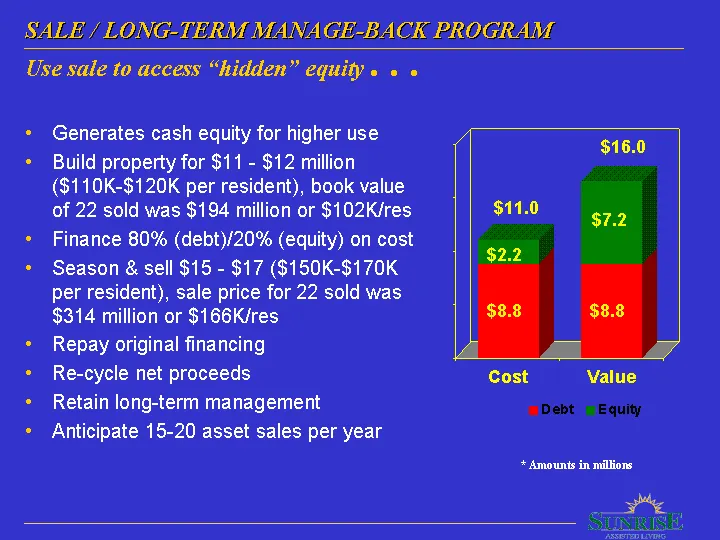
Slide 31: Sale / Long-Term Manage-Back Program
SALE / LONG-TERM MANAGH-BACK PROGRAM Use sale to access “hidden” equity» « « + Generates cash equity for higher use + Build property for $11 - $12 million ($110K-$120K per resident), book value of 22 sold was $194 million or $102K/res + Finance 80% (debt)/20% (equity) on cost + Season & sell $15 - $
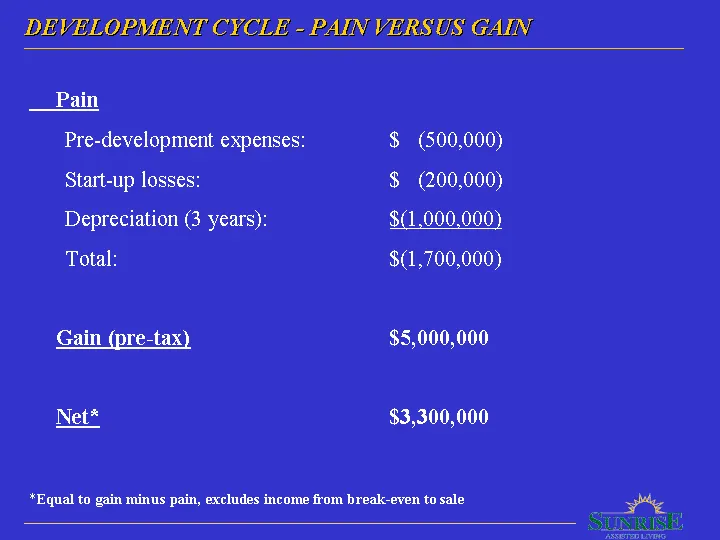
Slide 32: Development Cycle - Pain Versus Gain
DEVELOPMENT CYCLE - PAIN VERSUS GAIN Pain Pre-development expenses: $ (500,000) Start-up losses: $ (200,000) Depreciation (3 years): $1,000,000 Total: $(1,700,000) Gain (pre-tax) $5,000,000 Net* $3,300,000 *Equal to gain minus pain, excludes income from break-even to sale
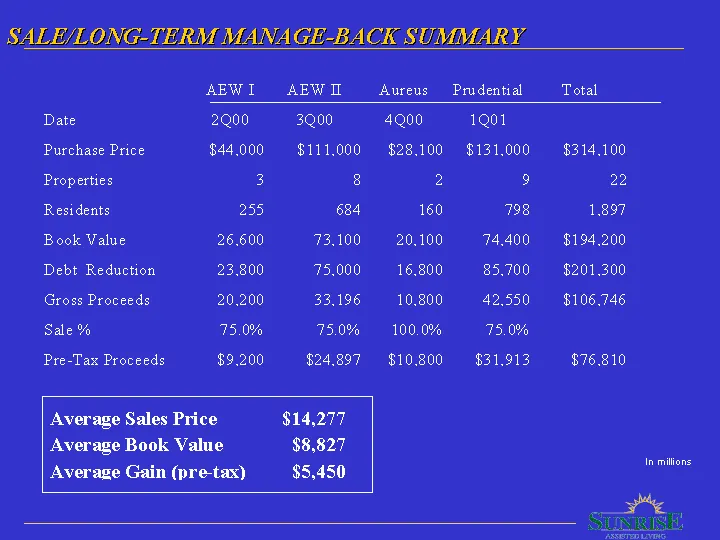
Slide 33: Sale/Long-Term Manage-Back Summary
SALE/LONG- TERM MANAGE-BACK SUMMARY AEWI AEWI Aureus Prudential Total Date 2Q00 3Q00 4Q00 1Q01 Purchase Price $44,000 $111,000 $28,100 $131,000 $314,100 Properties 3 8 2 9 22 Residents 255 684 160 798 1.897 Book Value 26.600 73.100 20.100 74,400 $194,200 Debt Reduction 23.800 75.000 16,800 85,700 $2
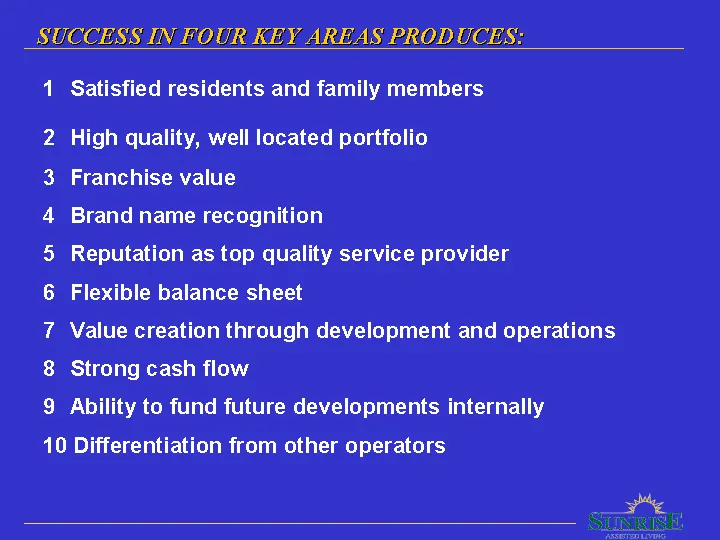
Slide 34: Success in Four Key Areas Produces
SUCCESS IN FOUR KEY AREAS PRODUCES: = Satisfied residents and family members High quality, well located portfolio Franchise value Brand name recognition Reputation as top quality service provider Flexible balance sheet Value creation through development and operations Strong cash flow Ability to fun
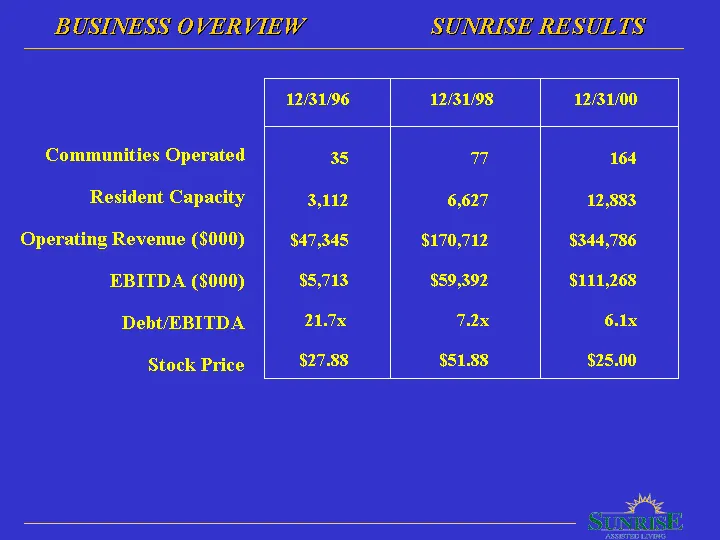
Slide 35: Business Overview Sunrise Results
BUSINESS OVERVIEW SUNRISE RESULTS, 12/31/96 12/31/98 12/3100 Communities Operated 35 7 164 Resident Capacity 3,112 6,627 12,883 Operating Revenue ($000) $47,345 $170,712 $344,786 EBITDA ($000) $5,713 $59,392 $111,268 Debt(EBITDA 21.7x 7x 6.1x Stock Price $27.88 $51.88 $25.00
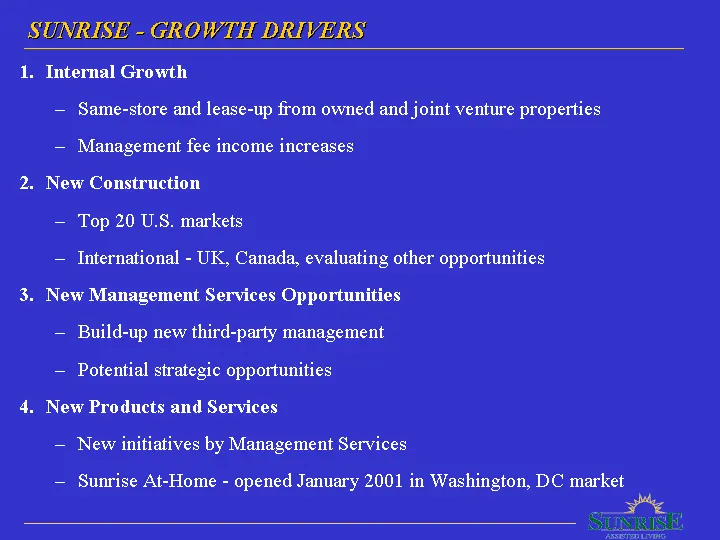
Slide 36: Sunrise Growth Drivers
SUNEISH ~GROWIH DRIVERS 1. Internal Growth — Same-store and lease-up from owned and joint venture properties — Management fee income increases 2. New Construction = Top 20 U.S. markets — International - UK, Canada, evaluating other opportunities 3. New Management Services Opportunities — Build-up ne
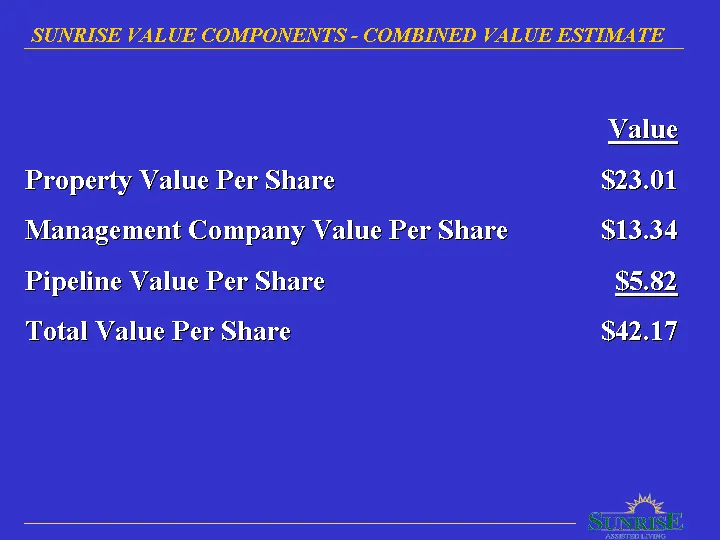
Slide 37: Sunrise Value Components - Combined Value Estimate
SUNRISE VALUE COMPONENTS - COMBINED VALUE ESTIMATE Value Property Value Per Share $23.01 Management Company Value Per Share $13.34 Pipeline Value Per Share $5.82 Total Value Per Share $42.17
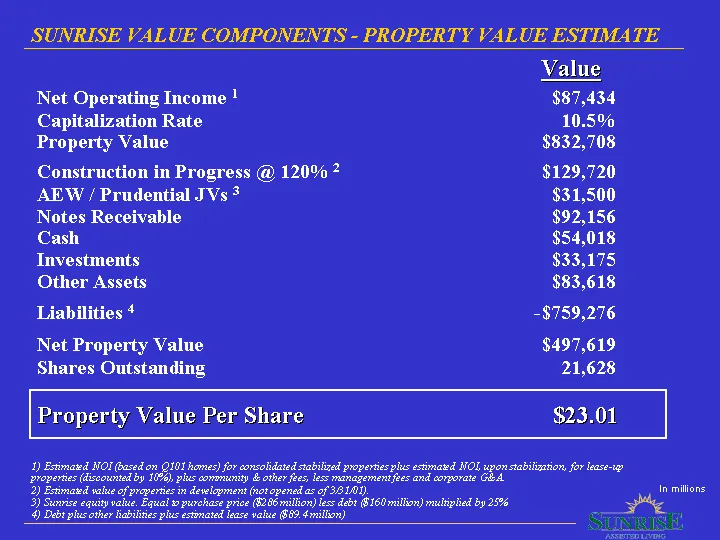
Slide 38: Sunrise Value Components - Property Value Estimate
SUNRISE VALUE COMPONENTS - PROPERTY VALUE ESTIMATE Value Net Operating Income ! $87,434 Capitalization Rate 10.5% Property Value $832,708 Construction in Progress @ 120% 2 $129,720 AEW / Prudential JVs * $31,500 Notes Receivable $92,156 Cash $54,018 Investments $33,175 Other Assets $83,618 Liabiliti
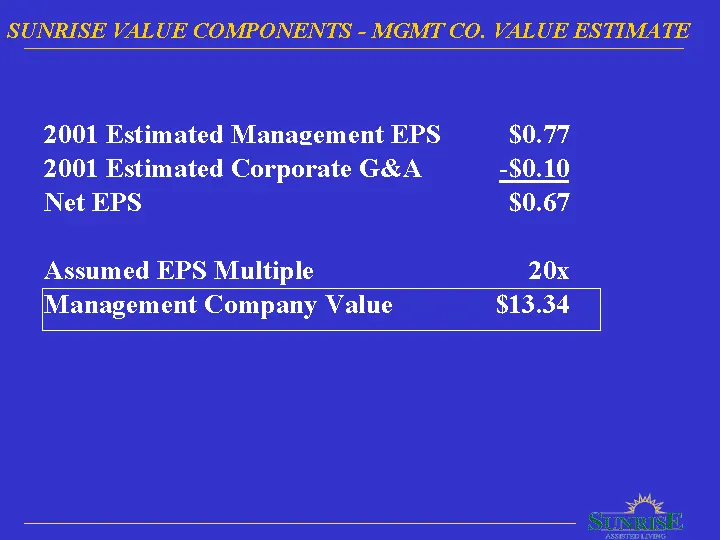
Slide 39: Sunrise Value Components - Management Co. Value Estimate
SUNRISE VALUE COMPONENTS - MGMT CO. VALUE ESTIMATE 2001 Estimated Management EPS $0.77 2001 Estimated Corporate G&A -$0.10 Net EPS $0.67 Assumed EPS Multiple 20x |Management Company Value $13.34
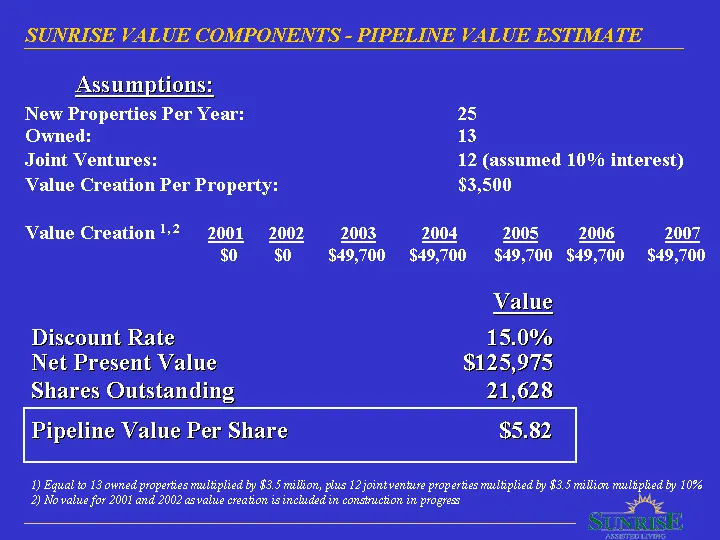
Slide 40: Sunrise Value Components - Pipeline Value Estimate
SUNRISE VALUE COMPONENTS - PIPELINE VALUE ESTIMATE Assumptions: New Properties Per Year: 25 Owned: 13 Joint Ventures: 12 (assumed 10% interest) Value Creation Per Property: $3,500 Value Creation? 2001 2002 -2003-«S 2004. «2005-2006 2007 $0 $0 $49,700 $49,700 $49,700 $49,700 $49,700 Value Discount Ra
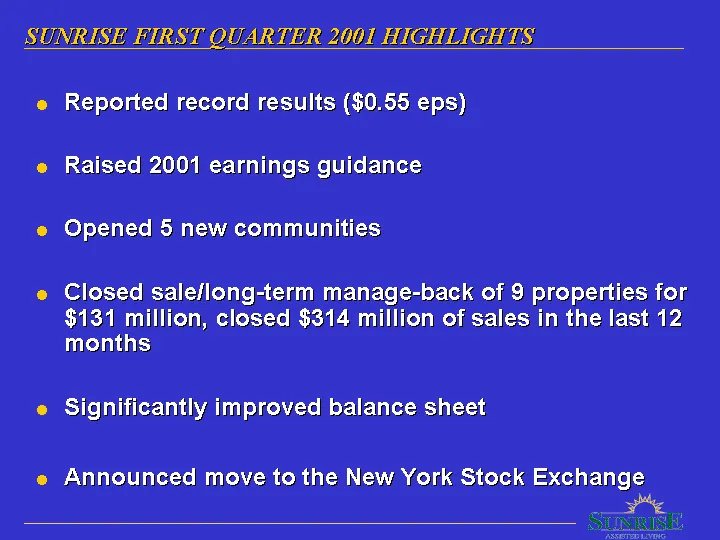
Slide 41: Sunrise First Quarter 2001 Highlights
SUNEISH HIRST QUARTER 2001 HIGHLIGHTS e Reported record results ($0.55 eps) e Raised 2001 earnings guidance e Opened 5 new communities e Closed saleflong-term manage-back of 9 properties for $131 million, closed $314 million of sales in the last 12 months, e Significantly improved balance sheet e An
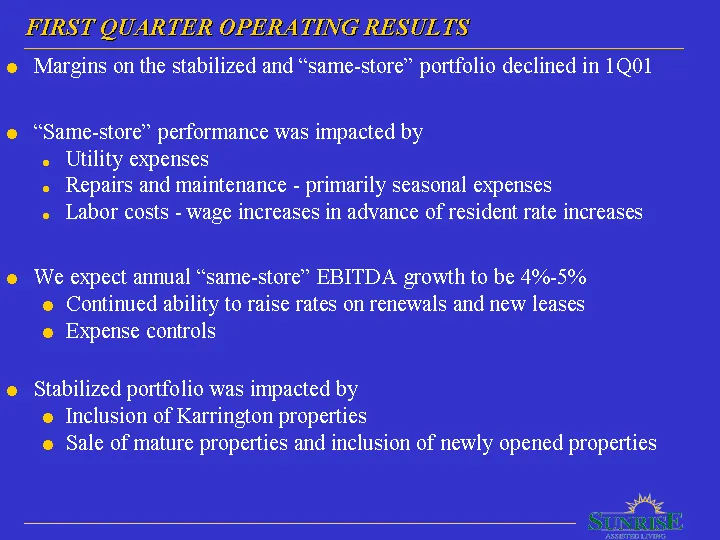
Slide 42: First Quarter Operating Results
FARST QUARTER OPERATING RESULTS, e Margins on the stabilized and “same-store” portfolio declined in 1Q01 e “Same-store” performance was impacted by « Utility expenses e Repairs and maintenance - primarily seasonal expenses « Labor costs - wage increases in advance of resident rate increases e We exp
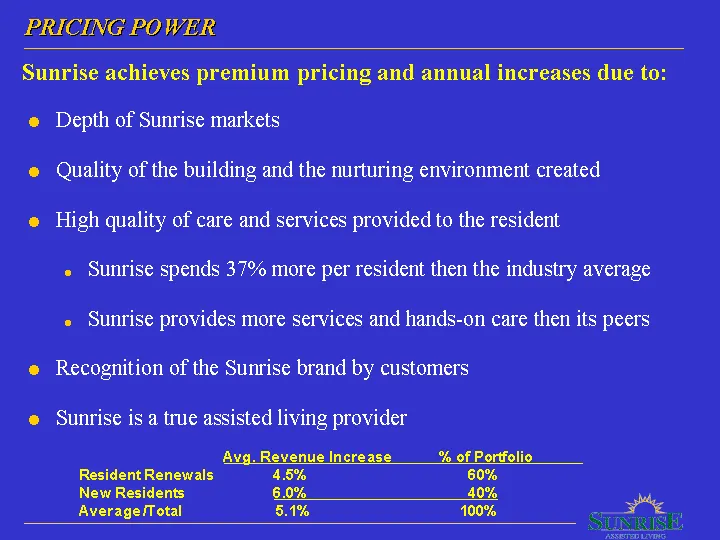
Slide 43: Pricing Power
PRICING POWER Sunrise achieves premium pricing and annual increases due to: e Depth of Sunrise markets e Quality of the building and the nurturing environment created e High quality of care and services provided to the resident « Sunrise spends 37% more per resident then the industry average e Sunri
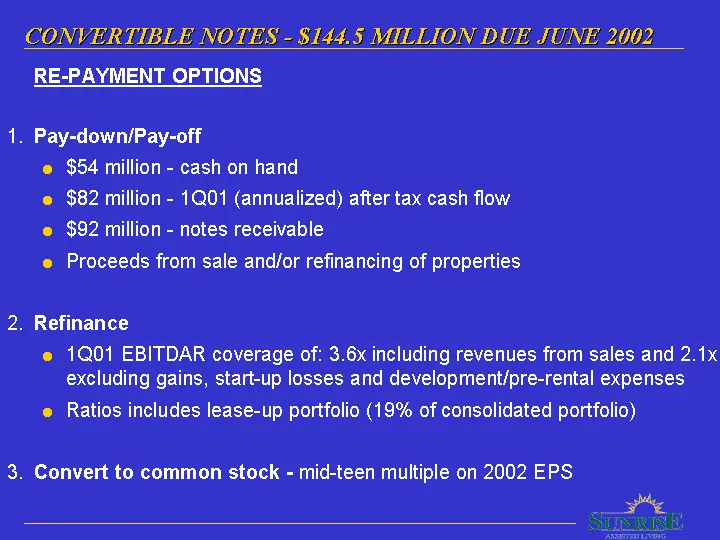
Slide 44: Convertible Notes - $144 Million Due June 2002
CONVERTIBLE NOTES ~ $144 5 VALTLION DUE JUNE 2002 RE-PAYMENT OPTIONS 1. Pay-down/Pay-off e $54 million - cash on hand e $82 million - 1Q01 (annualized) after tax cash flow e $92 million - notes receivable e Proceeds from sale and/or refinancing of properties 2. Refinance e 1Q01 EBITDAR coverage of:
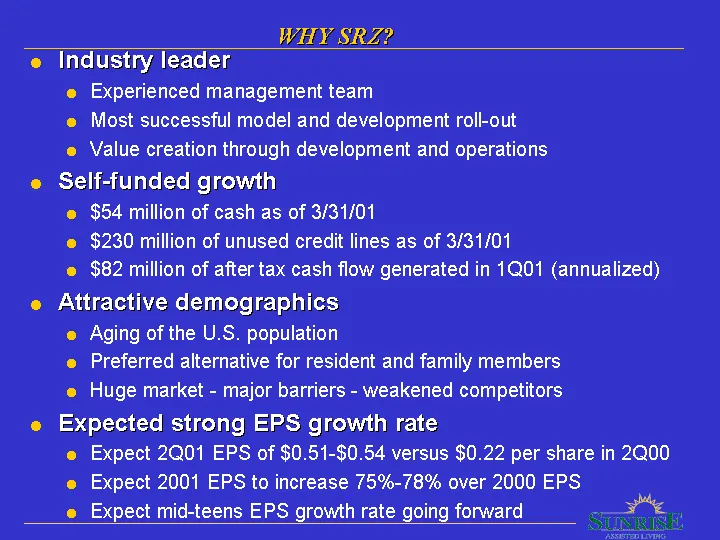
Slide 45: Why SRZ?
WHY SEZ? Industry leader e Experienced management team e Most successful model and development roll-out e Value creation through development and operations Self-funded growth e $54 million of cash as of 3/31/01 e $230 million of unused credit lines as of 3/31/01 e $82 million of after tax cash flow
Slide 46: Sunrise Assisted Living
F 7\ 9: ame SUNRISE ASSISTED LIVING
Source: SEC EDGAR · 8-K filed Jun 14, 2001
More decks from Sunrise Senior Living
 Merger or Acquisition (August 2012)12 slides · Aug 22, 2012
 Investor Presentation (June 2011)27 slides · Jun 14, 2011
 Investor Presentation (May 2008)38 slides · May 21, 2008
 Investor Presentation (May 2008)38 slides · May 14, 2008
 Lehman Brothers Ninth Annual Healthcare Conference 200642 slides · Mar 8, 2006
 Investor Presentation (May 2005)39 slides · May 18, 2005