Raute Oyj Class A · OMXHEX:RAUTE
Raute Oyj Class A — Q3 2023 Earnings Presentation
24 slides from Raute Oyj Class A's earnings presentation, Oct 26, 2023

Slide 1: Q3/2023 Interim report January-September
Q3/2023 Interim report January-September Mika Saariaho, President and CEO Ville Halttunen, CFO October 26, 2023
Slide 2: Content
Content • Highlights and Group performance • Segment performance • Cash flow, financial position and key figures KUVA • Outlook 2023 2 www.raute.com
Slide 3: Where are we now
Where are we now ✓ Profitability improvement continued in Q3/23 • Supported by the profit improvement program ✓ Near record-high order backlog, slowness in net sales development due to the structure of the order book and implementation of the ERP system • Order intake of EUR 19m in Q3/23 and order b
Slide 4: Highlights of 1−9/23 and Q3/23
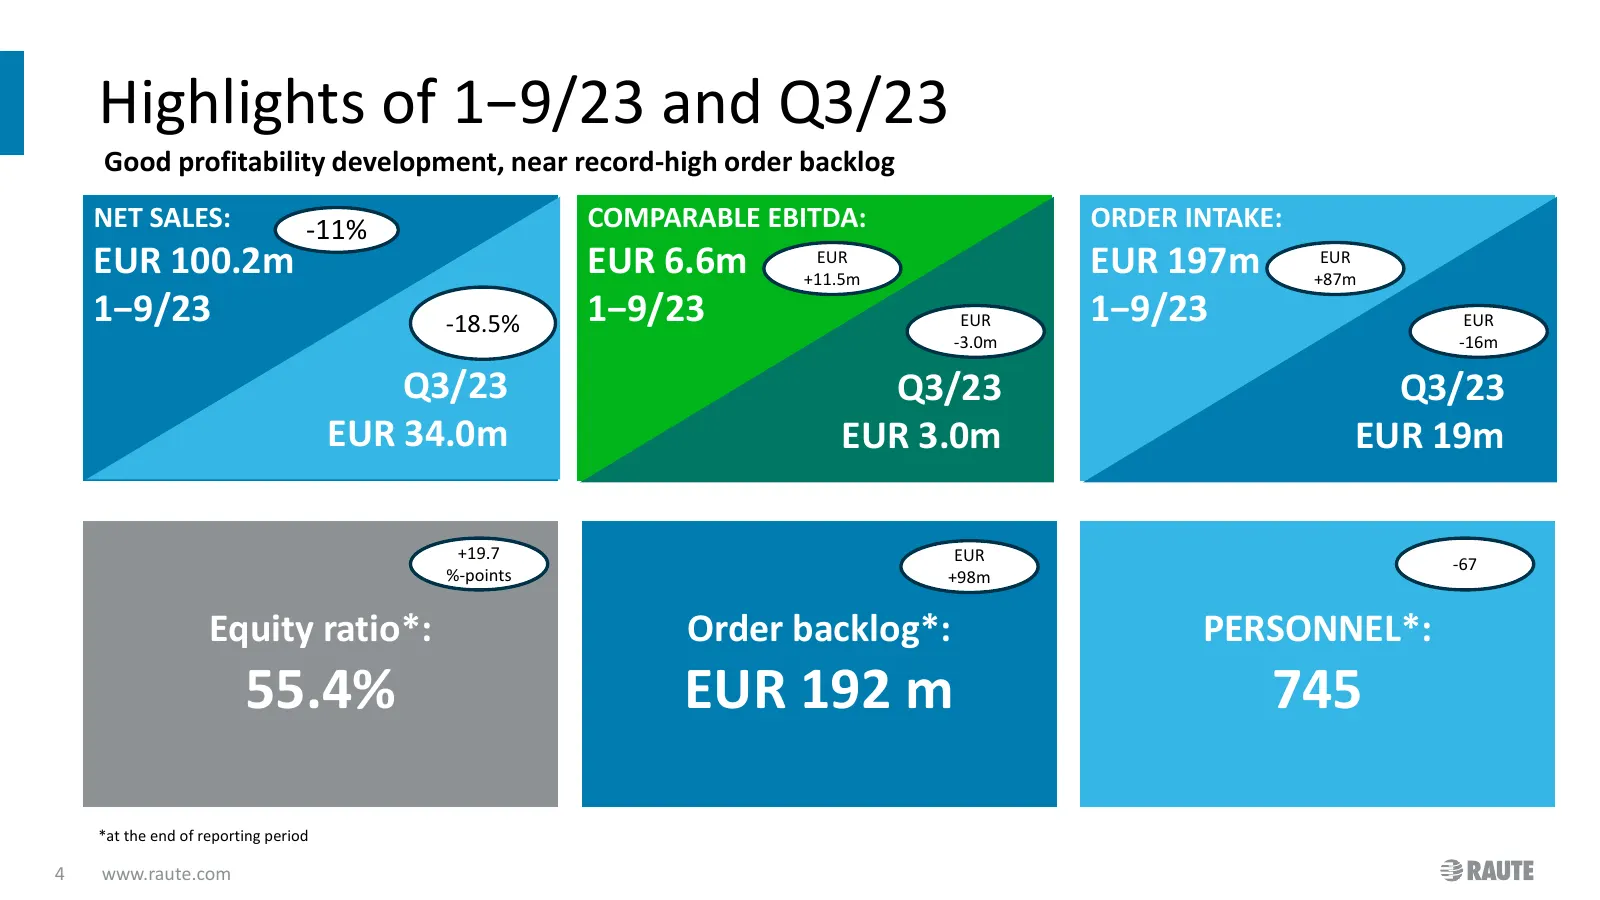
Highlights of 1−9/23 and Q3/23 Good profitability development, near record-high order backlog NET SALES: -11% COMPARABLE EBITDA: ORDER INTAKE: EUR 100.2m EUR 6.6m EUR +11.5m EUR 197m EUR +87m 1−9/23 -18.5% 1−9/23 EUR 1−9/23 EUR -3.0m -16m Q3/23 Q3/23 Q3/23 EUR 34.0m EUR 3.0m EUR 19m +19.7 EUR -67 %-
Slide 5: Order intake
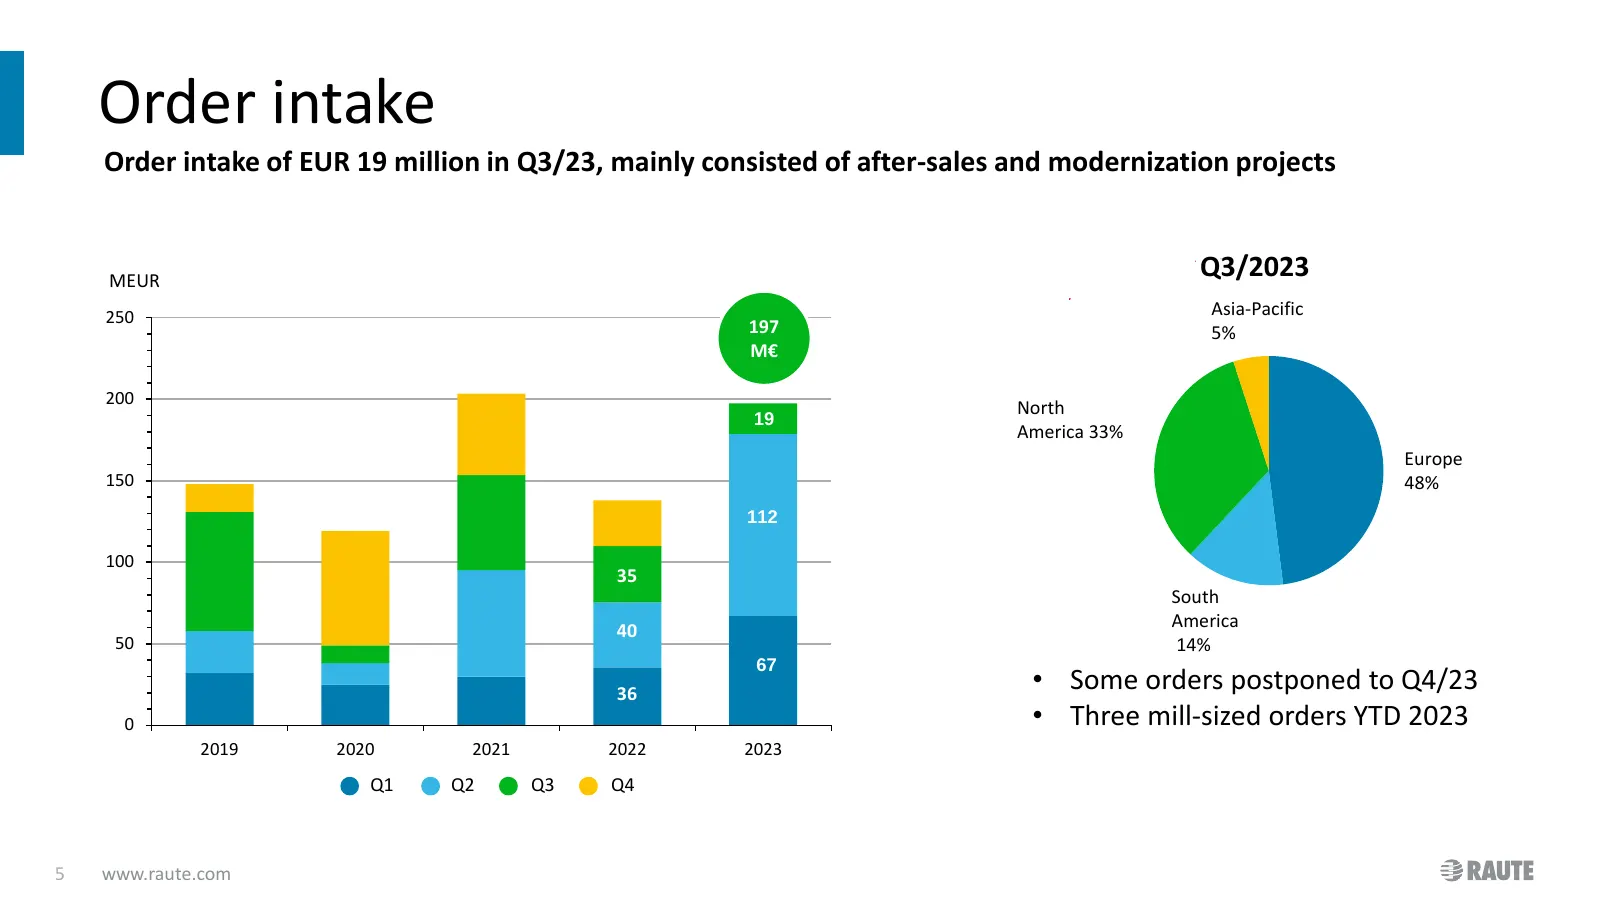
Order intake Order intake of EUR 19 million in Q3/23, mainly consisted of after-sales and modernization projects MEUR Q3/2023 250 Asia-Pacific 197 5% M€ 200 North 19 America 33% Europe 150 48% 112 100 35 South America 40 50 14% 67 36 • Some orders postponed to Q4/23 0 • Three mill-sized orders YTD 2
Slide 6: Order book
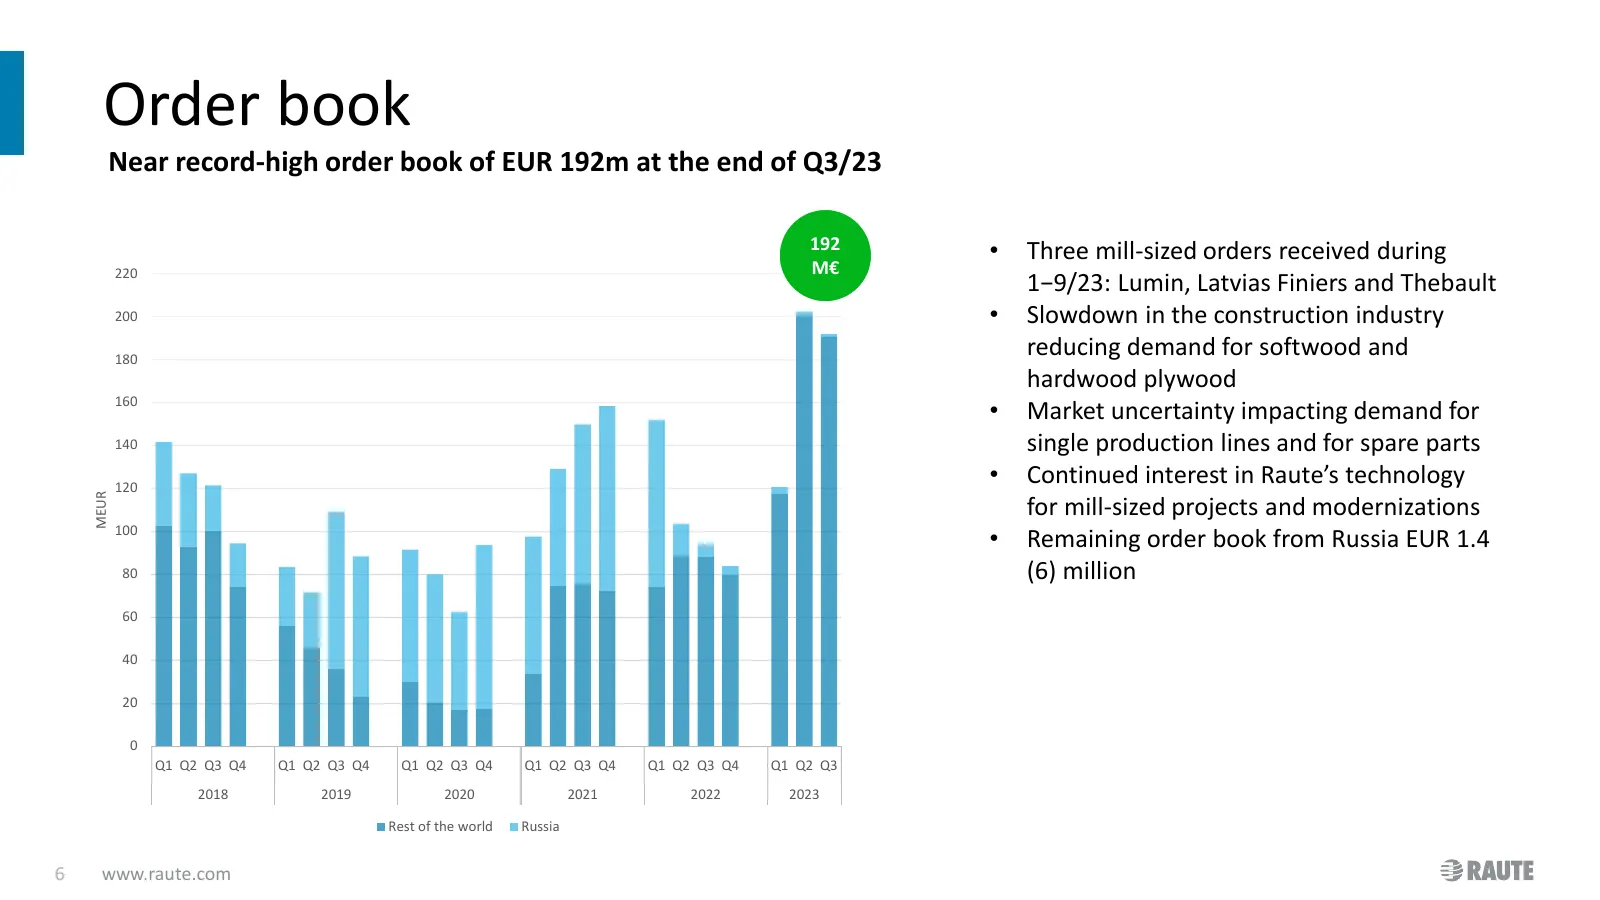
Order book Near record-high order book of EUR 192m at the end of Q3/23 192 • Three mill-sized orders received during 220 M€ 1−9/23: Lumin, Latvias Finiers and Thebault 200 • Slowdown in the construction industry 180 reducing demand for softwood and hardwood plywood 160 • Market uncertainty impacting
Slide 7: Net sales
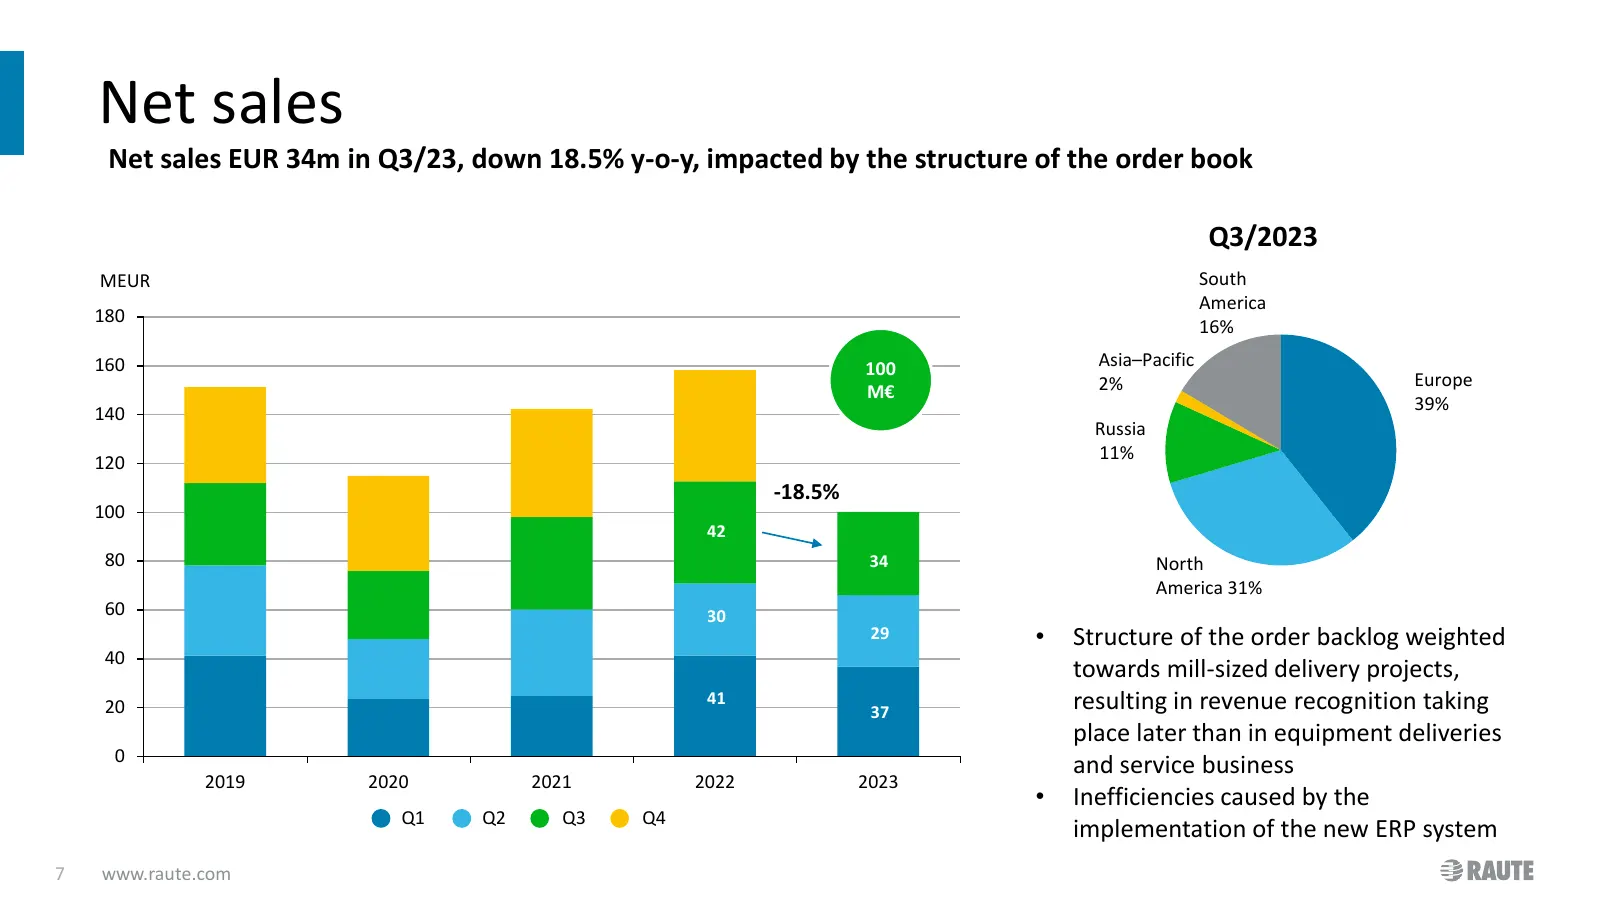
Net sales Net sales EUR 34m in Q3/23, down 18.5% y-o-y, impacted by the structure of the order book Q3/2023 MEUR South America 180 16% 160 100 Asia–Pacific 2% Europe M€ 39% 140 Russia 120 11% -18.5% 34 100 42 80 34 North America 31% 60 30 29 • Structure of the order backlog weighted 40 towards mill-
Slide 8: Comparable EBITDA
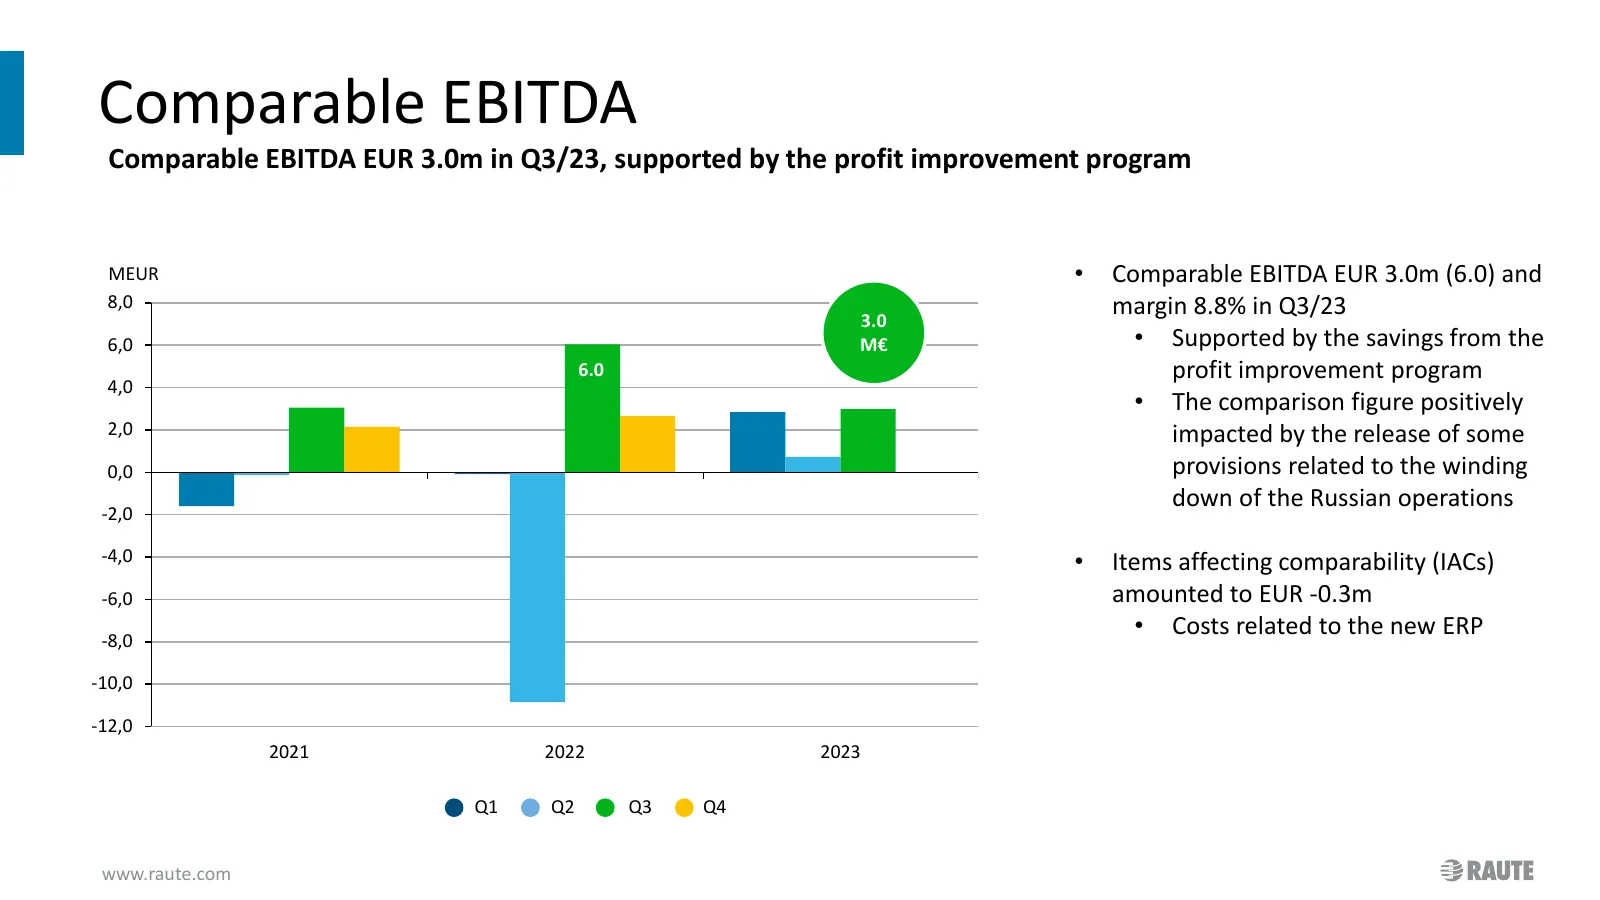
Comparable EBITDA Comparable EBITDA EUR 3.0m in Q3/23, supported by the profit improvement program MEUR • Comparable EBITDA EUR 3.0m (6.0) and 8,0 margin 8.8% in Q3/23 3.0 6,0 M€ • Supported by the savings from the 6.0 profit improvement program 4,0 • The comparison figure positively 2,0 impacted by
Slide 9: Operating profit (YTD)
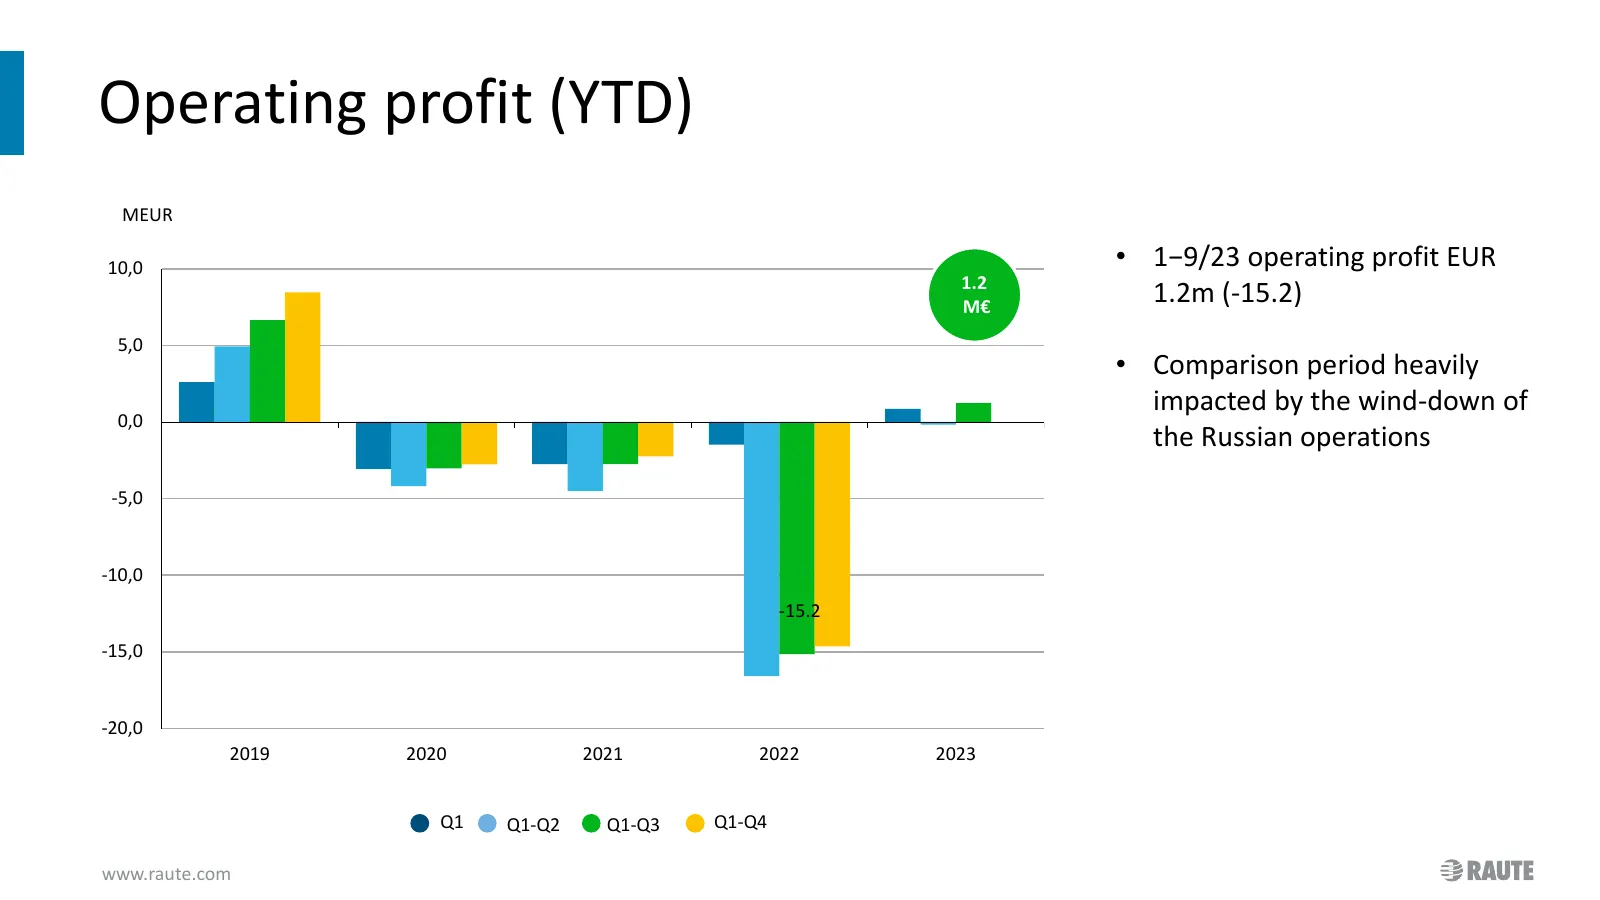
Operating profit (YTD) MEUR 10,0 • 1−9/23 operating profit EUR 1.2 M€ 1.2m (-15.2) 5,0 • Comparison period heavily impacted by the wind-down of 0,0 the Russian operations -5,0 -10,0 -15.2 -15,0 -20,0 2019 2020 2021 2022 2023 Q1 Q1-Q2 Q1-Q3 Q1-Q4 www.raute.com
Slide 10: Personnel
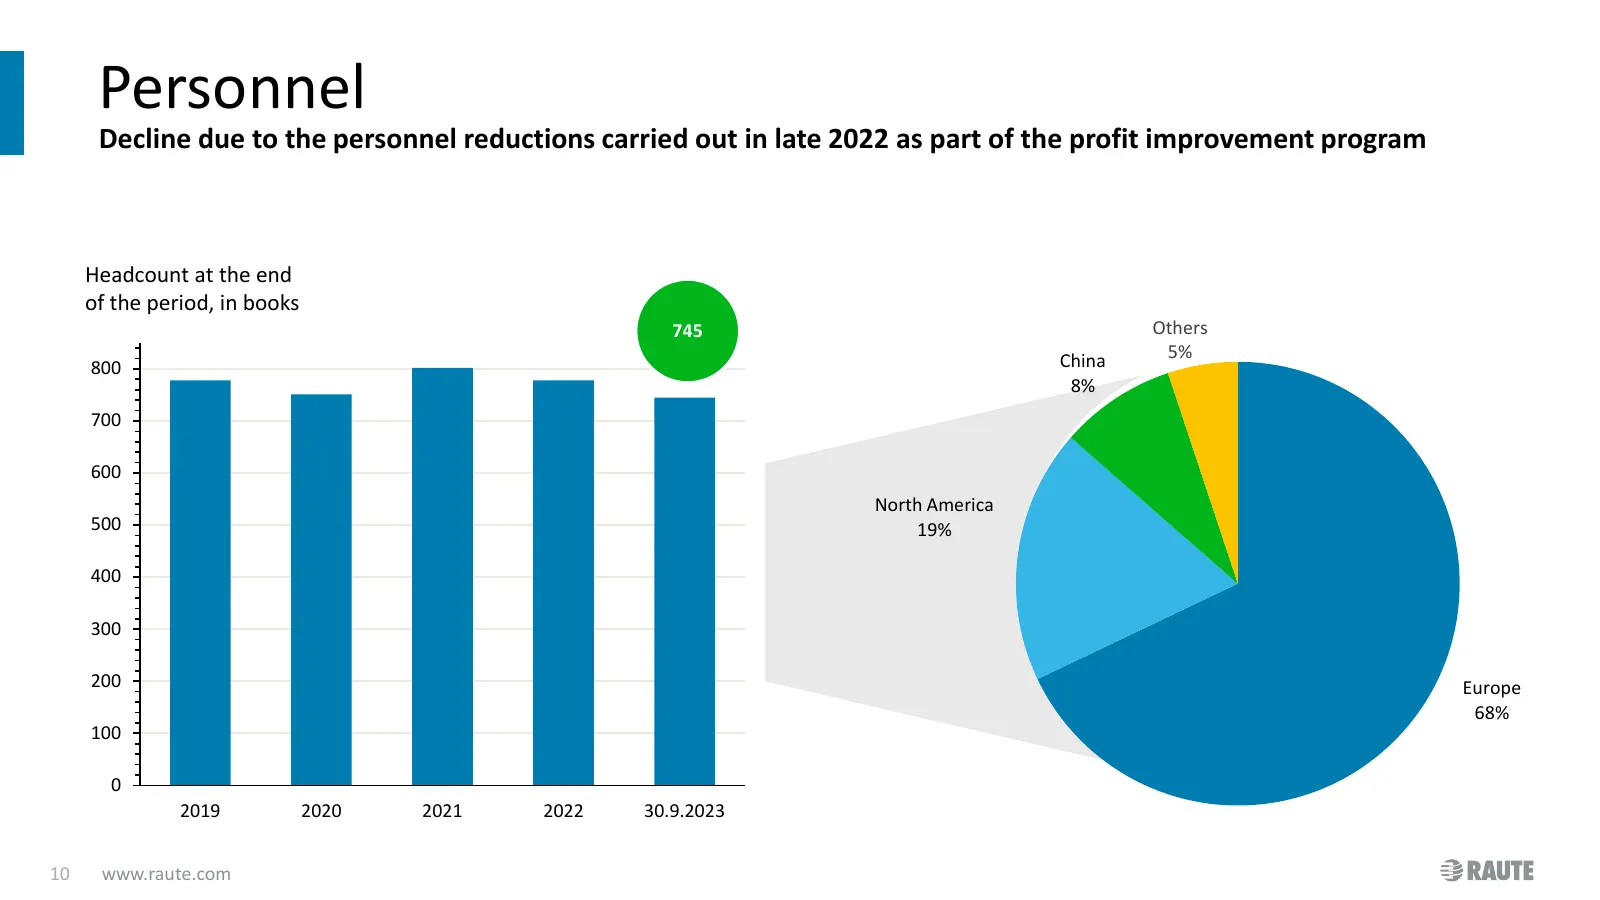
Personnel Decline due to the personnel reductions carried out in late 2022 as part of the profit improvement program Headcount at the end of the period, in books 745 Others China 5% 800 8% 700 600 North America 500 19% 400 300 200 Europe 68% 100 0 2019 2020 2021 2022 30.9.2023 10 www.raute.com
Slide 11: Content
Content • Highlights and Group performance • Segment performance • Cash flow, financial position and key figures • Outlook 2023 11 www.raute.com
Slide 12: Wood processing
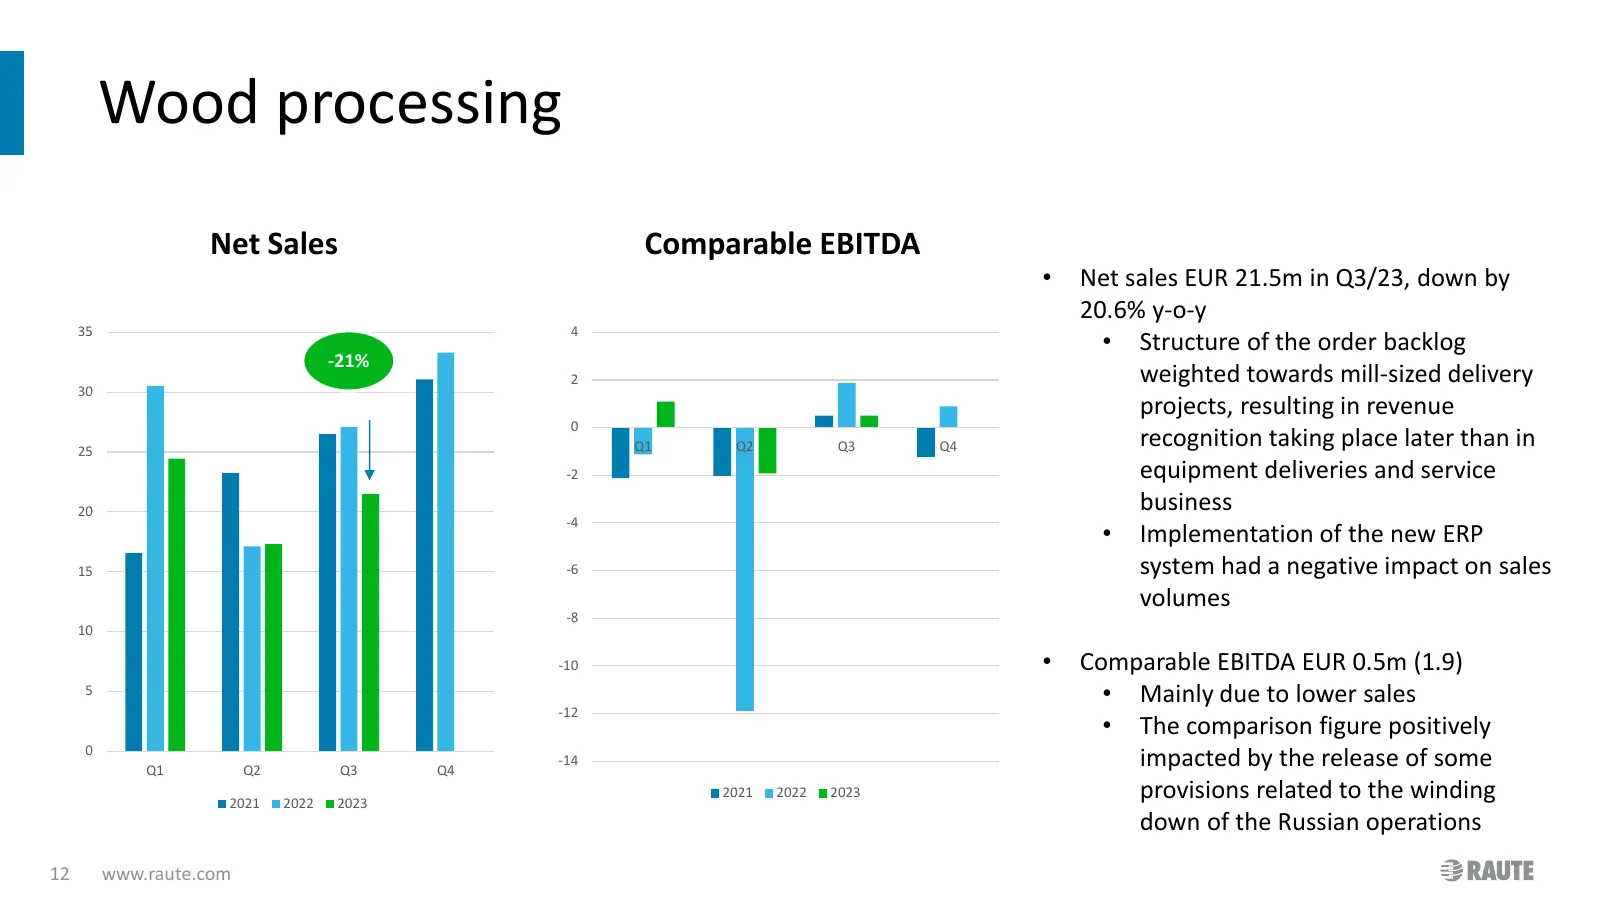
Wood processing Net Sales Comparable EBITDA • Net sales EUR 21.5m in Q3/23, down by 20.6% y-o-y 35 4 • Structure of the order backlog -21% 2 weighted towards mill-sized delivery 30 projects, resulting in revenue 0 25 Q1 Q2 Q3 Q4 recognition taking place later than in -2 equipment deliveries and serv
Slide 13: Services
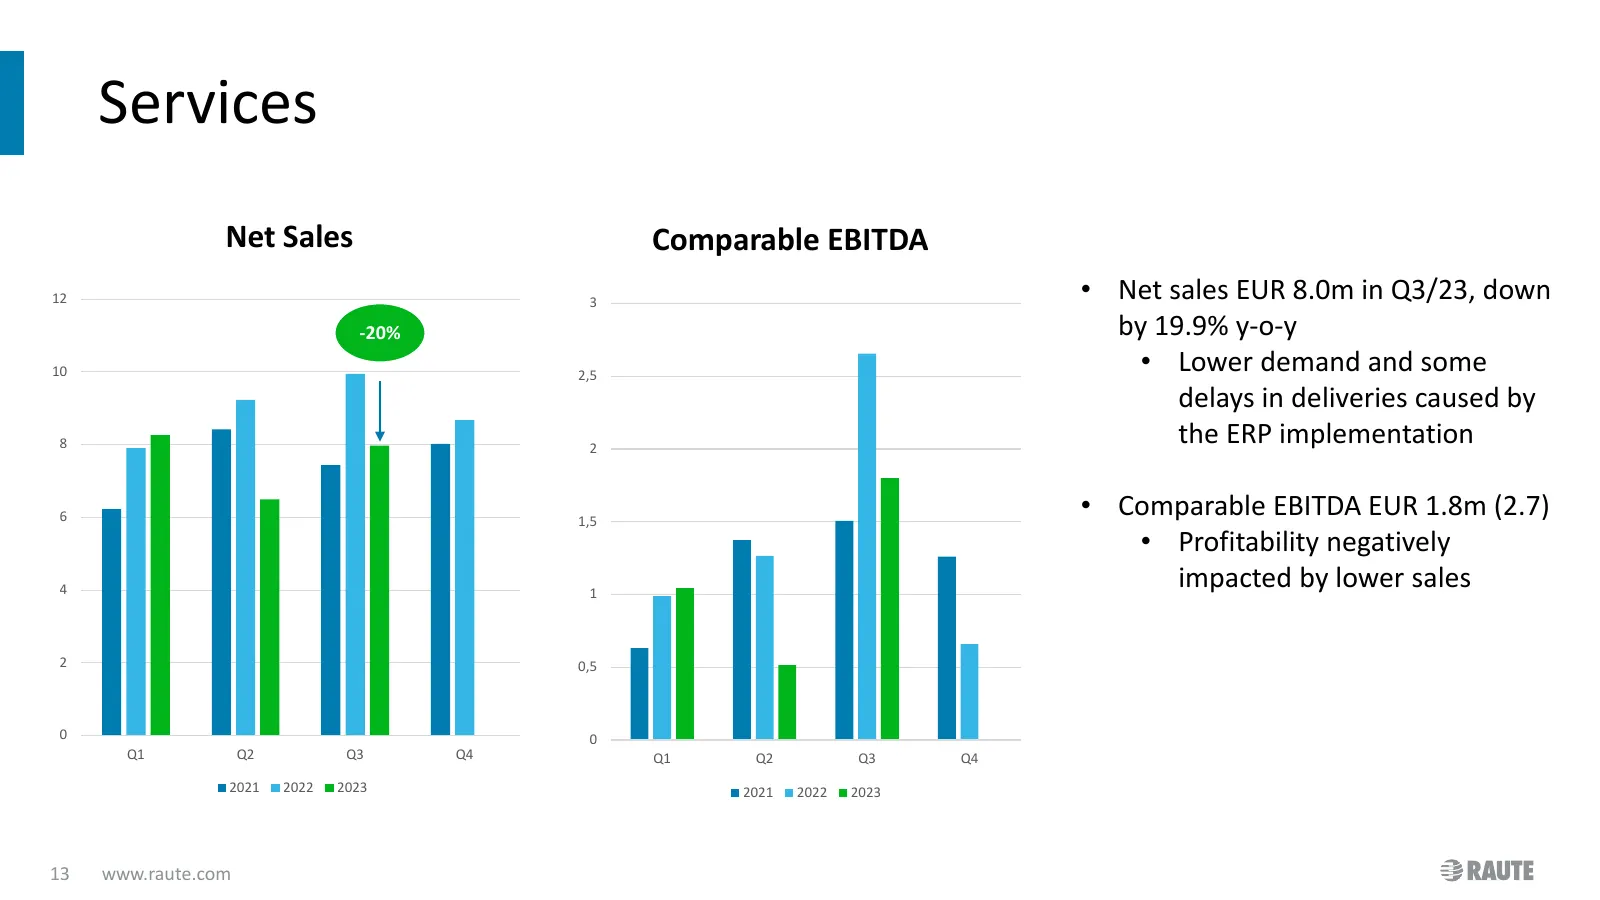
Services Net Sales Comparable EBITDA 12 3 • Net sales EUR 8.0m in Q3/23, down -20% by 19.9% y-o-y 10 2,5 • Lower demand and some delays in deliveries caused by 8 2 the ERP implementation 6 1,5 • Comparable EBITDA EUR 1.8m (2.7) • Profitability negatively 4 1 impacted by lower sales 2 0,5 0 0 Q1 Q2 Q
Slide 14: Analyzers
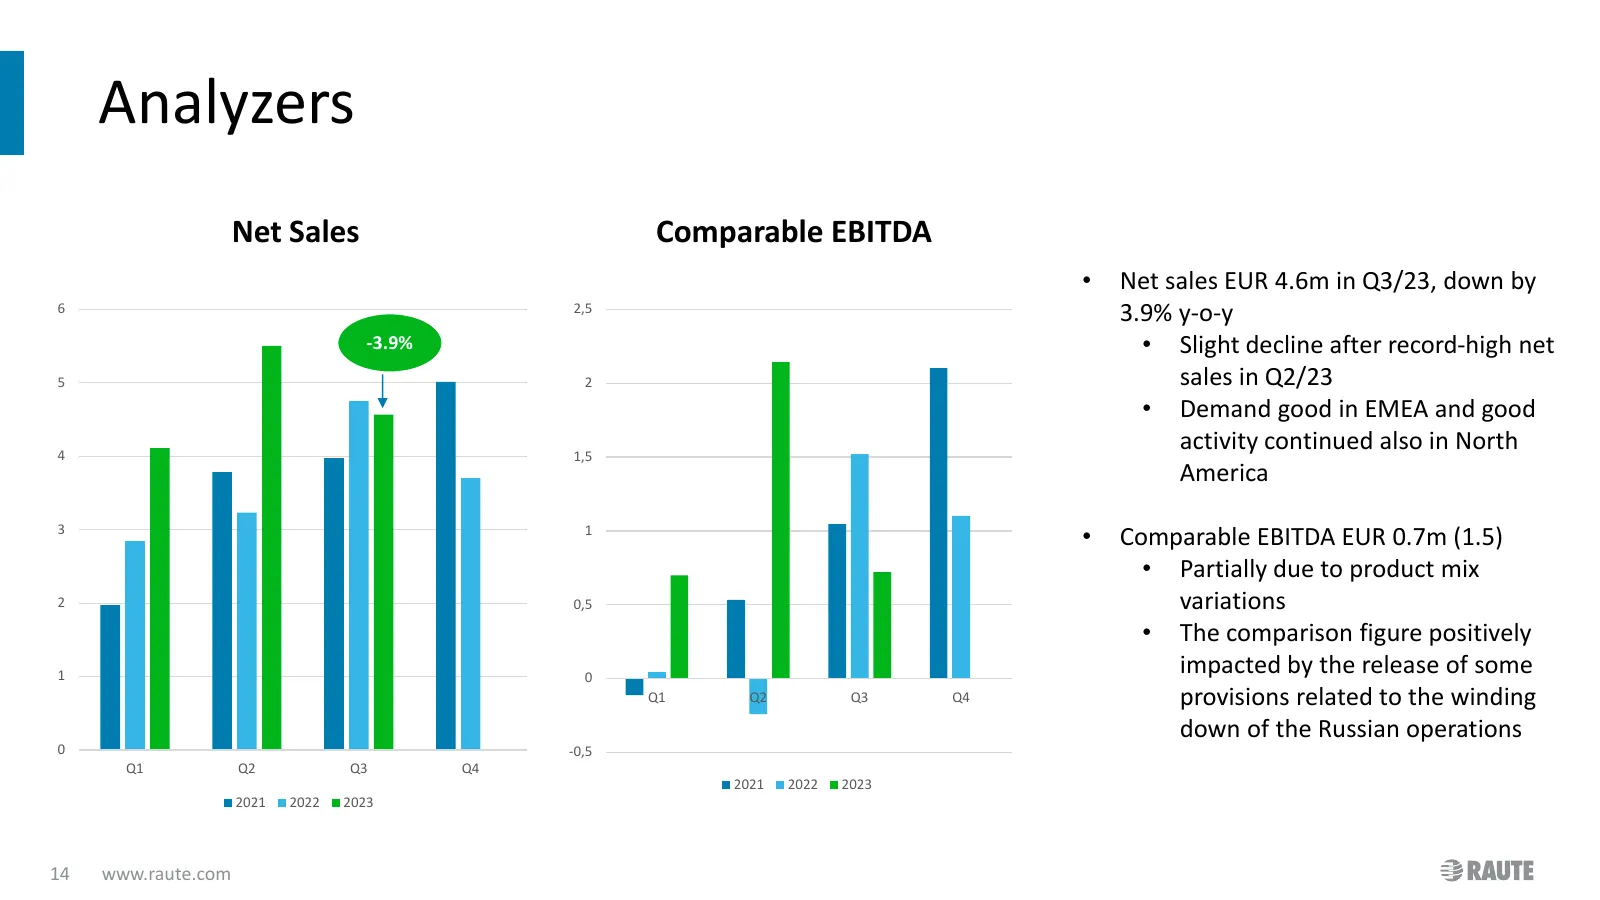
Analyzers Net Sales Comparable EBITDA • Net sales EUR 4.6m in Q3/23, down by 6 2,5 3.9% y-o-y -3.9% • Slight decline after record-high net 5 2 sales in Q2/23 • Demand good in EMEA and good 4 1,5 activity continued also in North America 3 1 • Comparable EBITDA EUR 0.7m (1.5) • Partially due to produc
Slide 15: Content
Content • Highlights and Group performance • Segment performance • Cash flow, financial position and key figures • Outlook 2023 15 www.raute.com
Slide 16: Quarterly cash flow and EBITDA
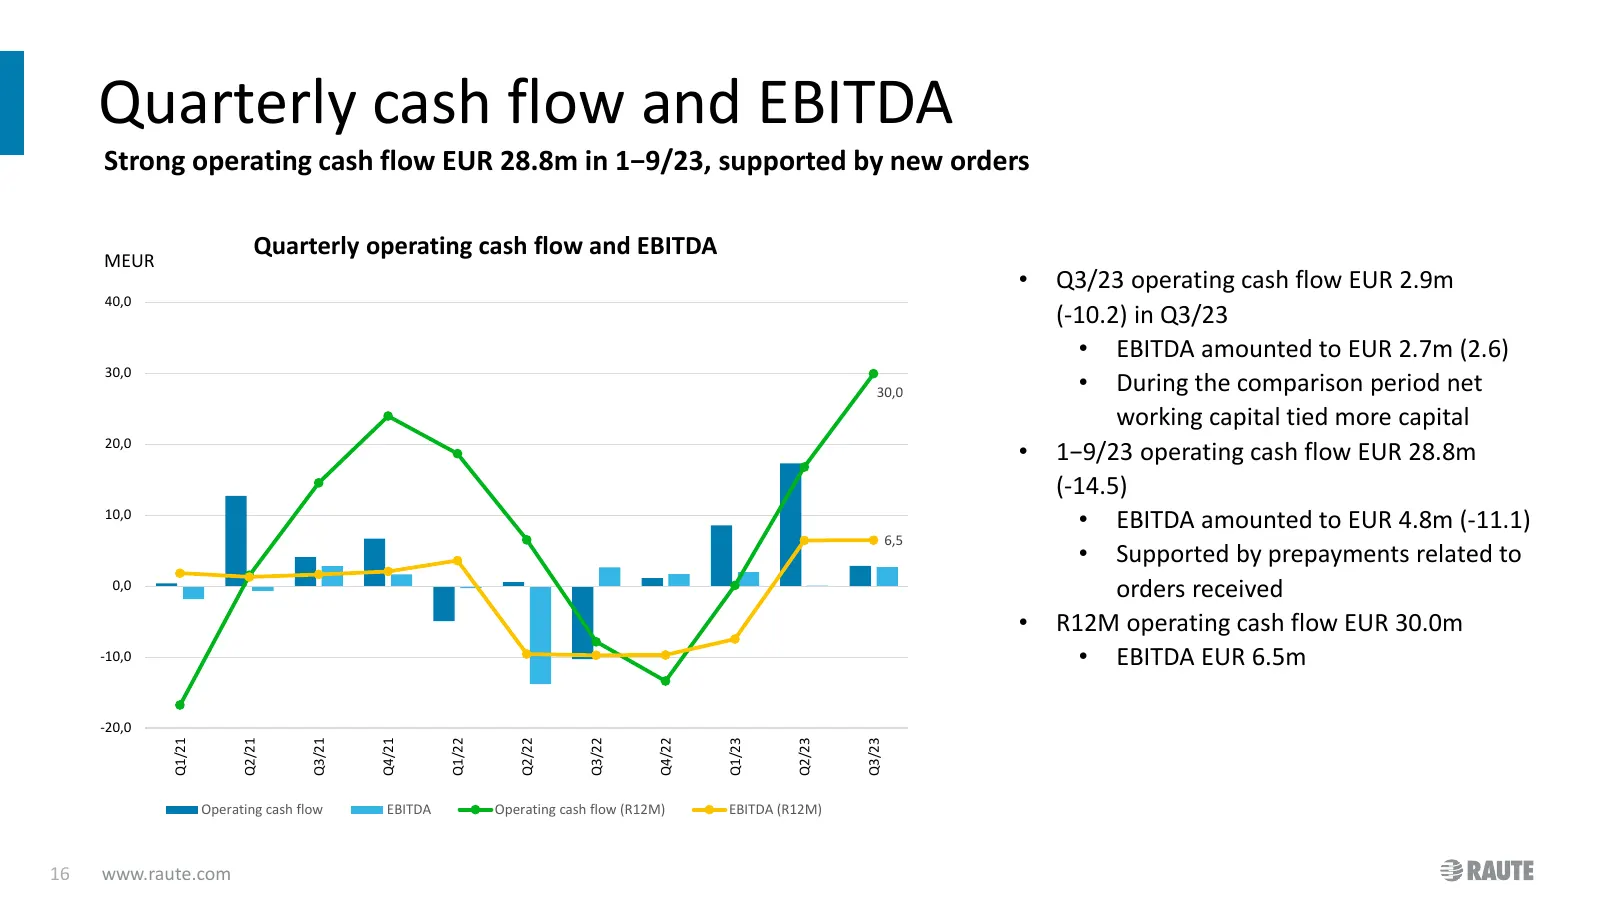
Quarterly cash flow and EBITDA Strong operating cash flow EUR 28.8m in 1−9/23, supported by new orders MEUR Quarterly operating cash flow and EBITDA • Q3/23 operating cash flow EUR 2.9m 40,0 (-10.2) in Q3/23 • EBITDA amounted to EUR 2.7m (2.6) 30,0 30,0 • During the comparison period net working cap
Slide 17: Net working capital
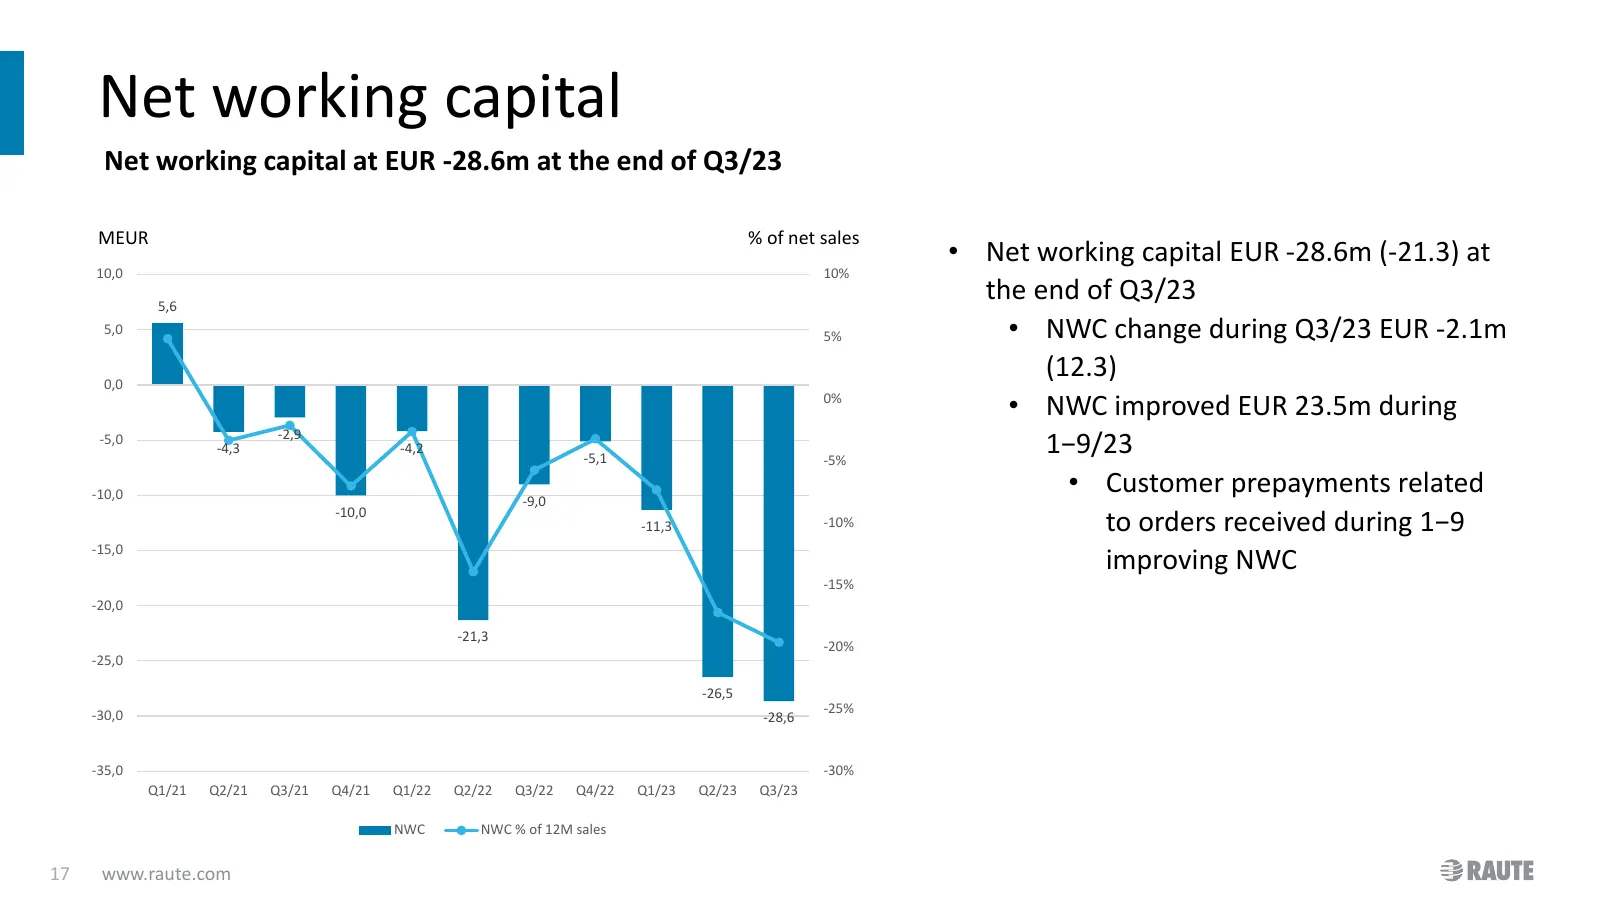
Net working capital Net working capital at EUR -28.6m at the end of Q3/23 MEUR % of net sales • Net working capital EUR -28.6m (-21.3) at 10,0 10% 5,6 the end of Q3/23 5,0 5% • NWC change during Q3/23 EUR -2.1m 0,0 (12.3) 0% • NWC improved EUR 23.5m during -2,9 -5,0 -4,3 -4,2 -5,1 -5% 1−9/23 -10,0 -
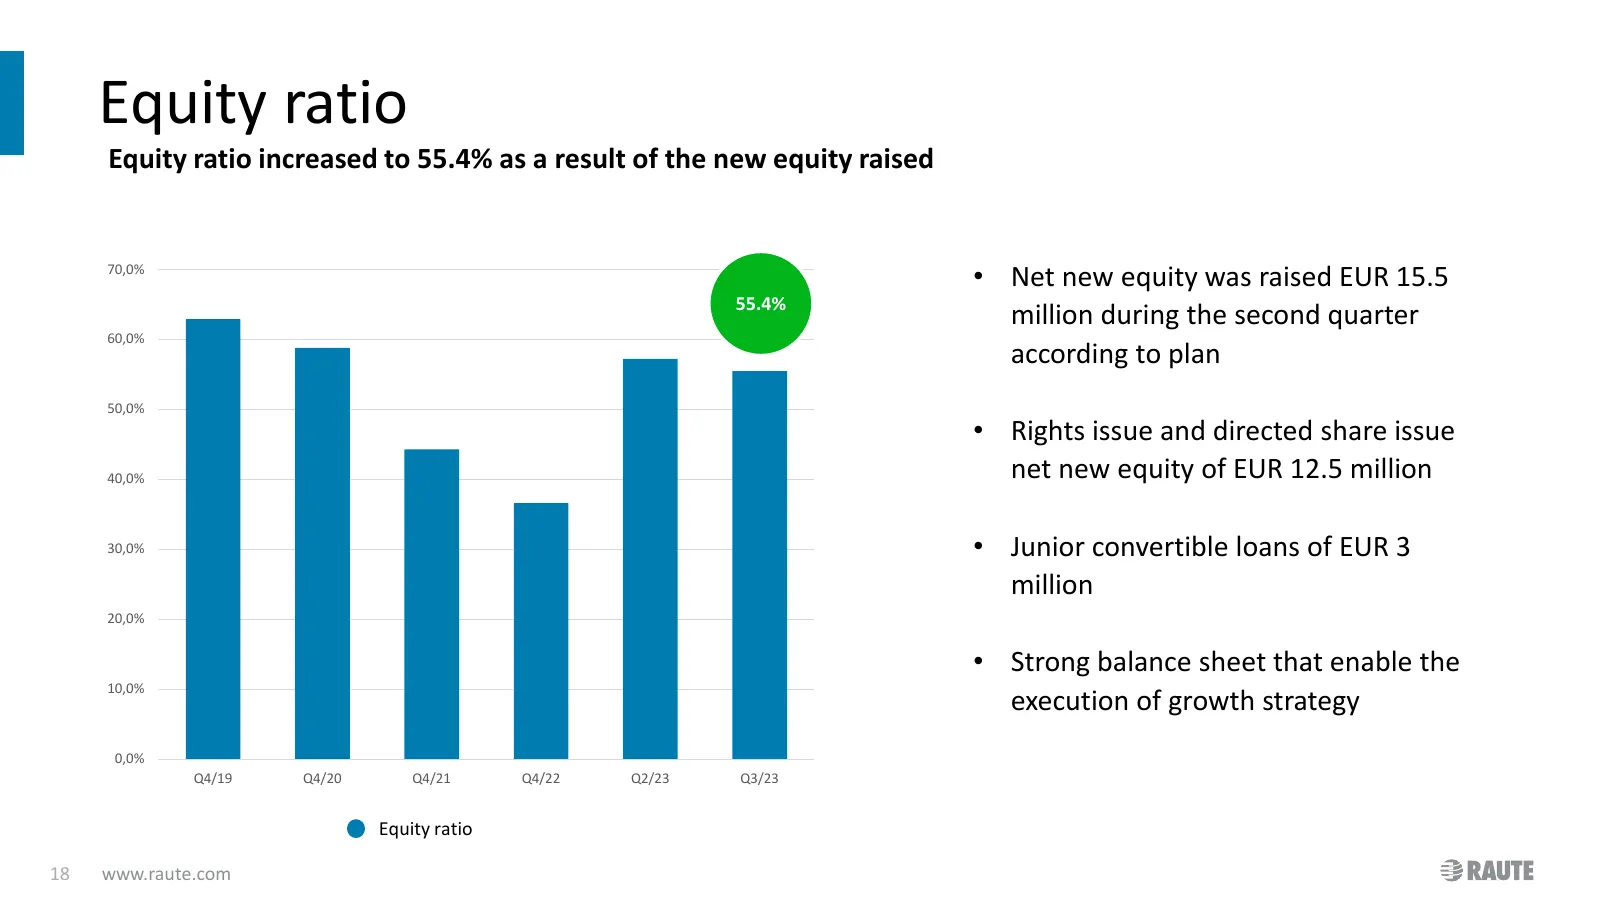
Slide 18: Equity ratio
Equity ratio Equity ratio increased to 55.4% as a result of the new equity raised 70,0% • Net new equity was raised EUR 15.5 55.4% million during the second quarter 60,0% according to plan 50,0% • Rights issue and directed share issue 40,0% net new equity of EUR 12.5 million 30,0% • Junior convertib
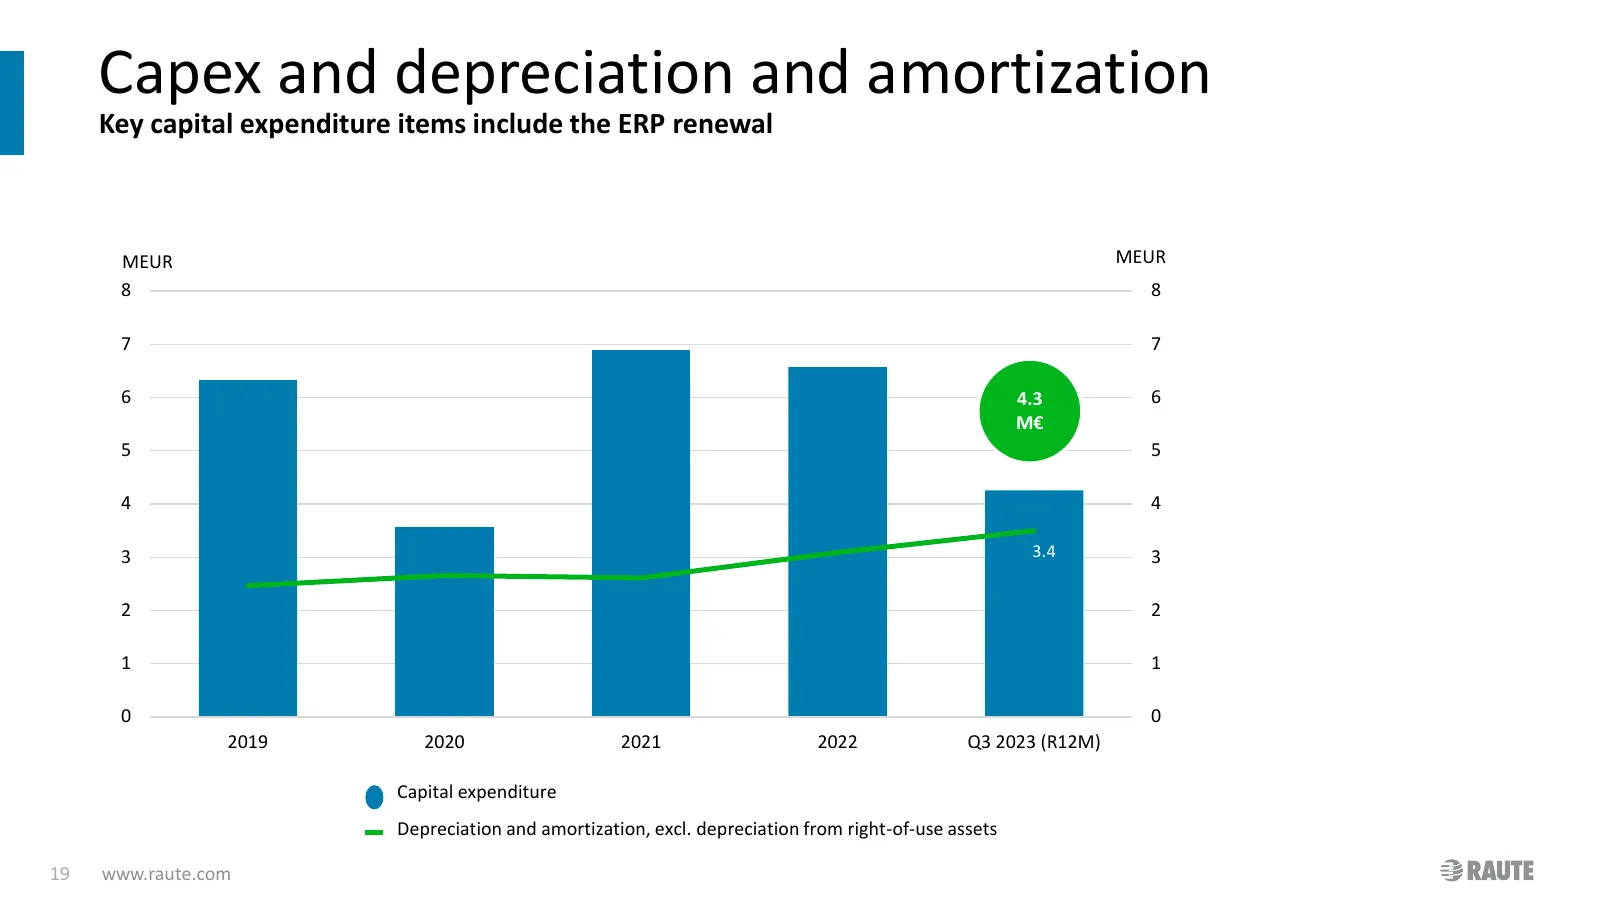
Slide 19: Capex and depreciation and amortization
Capex and depreciation and amortization Key capital expenditure items include the ERP renewal MEUR MEUR 8 8 7 7 6 4.3 6 M€ 5 5 4 4 3 3.4 3 2 2 1 1 0 0 2019 2020 2021 2022 Q3 2023 (R12M) Capital expenditure Depreciation and amortization, excl. depreciation from right-of-use assets 19 www.raute.com
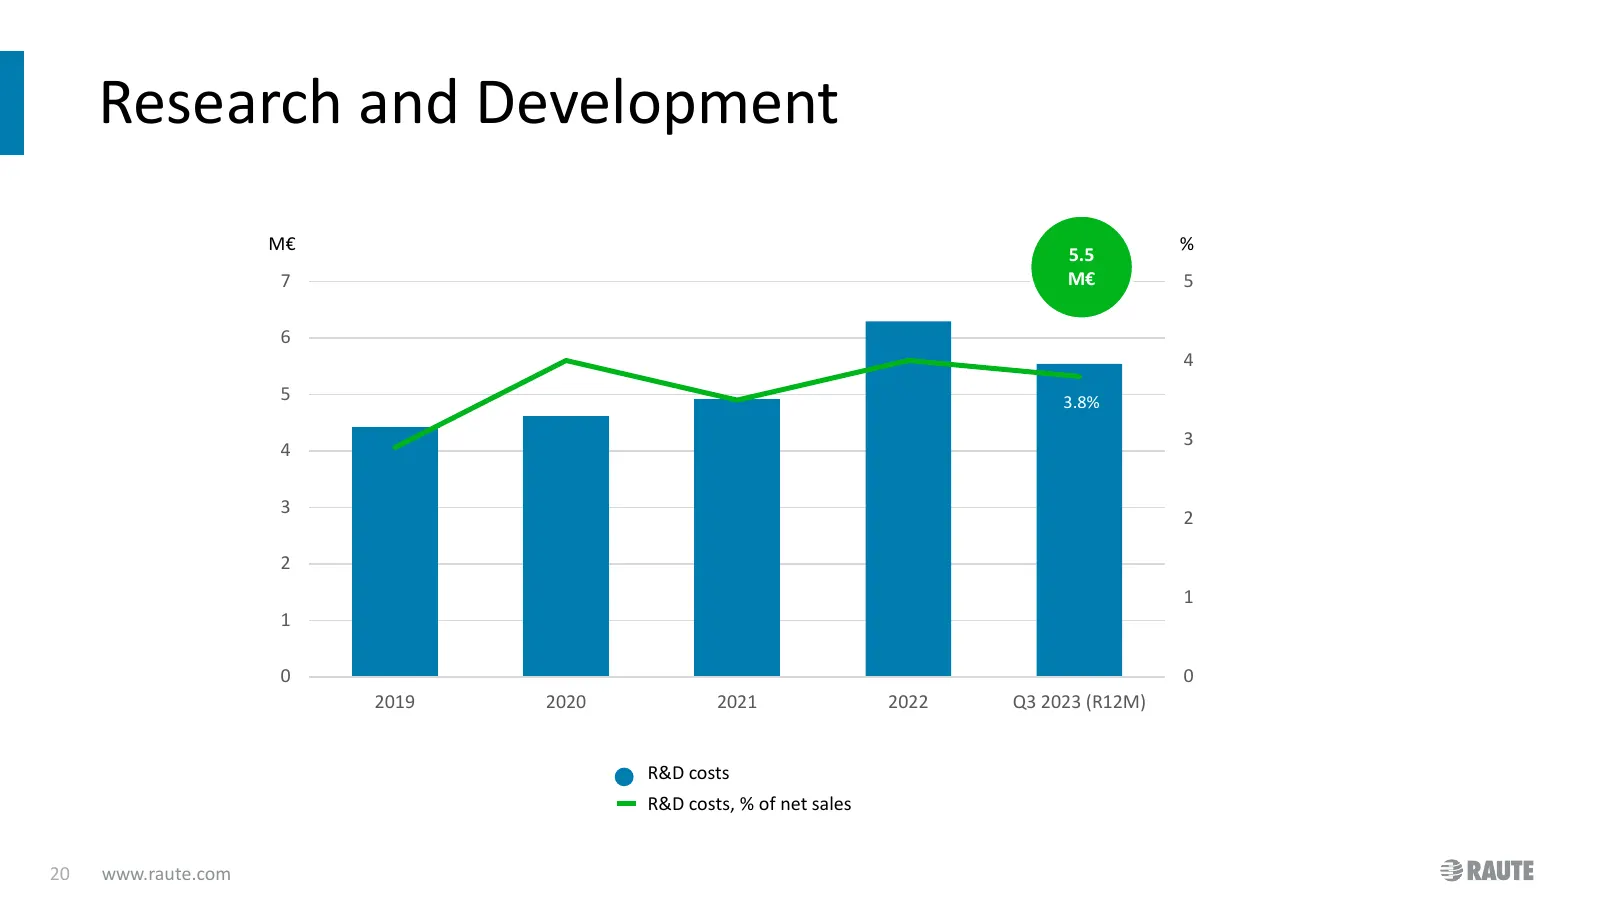
Slide 20: Research and Development
Research and Development M€ % 5.5 7 M€ 5 6 4 5 3.8% 3 4 3 2 2 1 1 0 0 2019 2020 2021 2022 Q3 2023 (R12M) R&D costs R&D costs, % of net sales 20 www.raute.com
Slide 21: Content
Content • Highlights and Group performance • Segment performance • Cash flow, financial position and key figures • Outlook 2023 21 www.raute.com
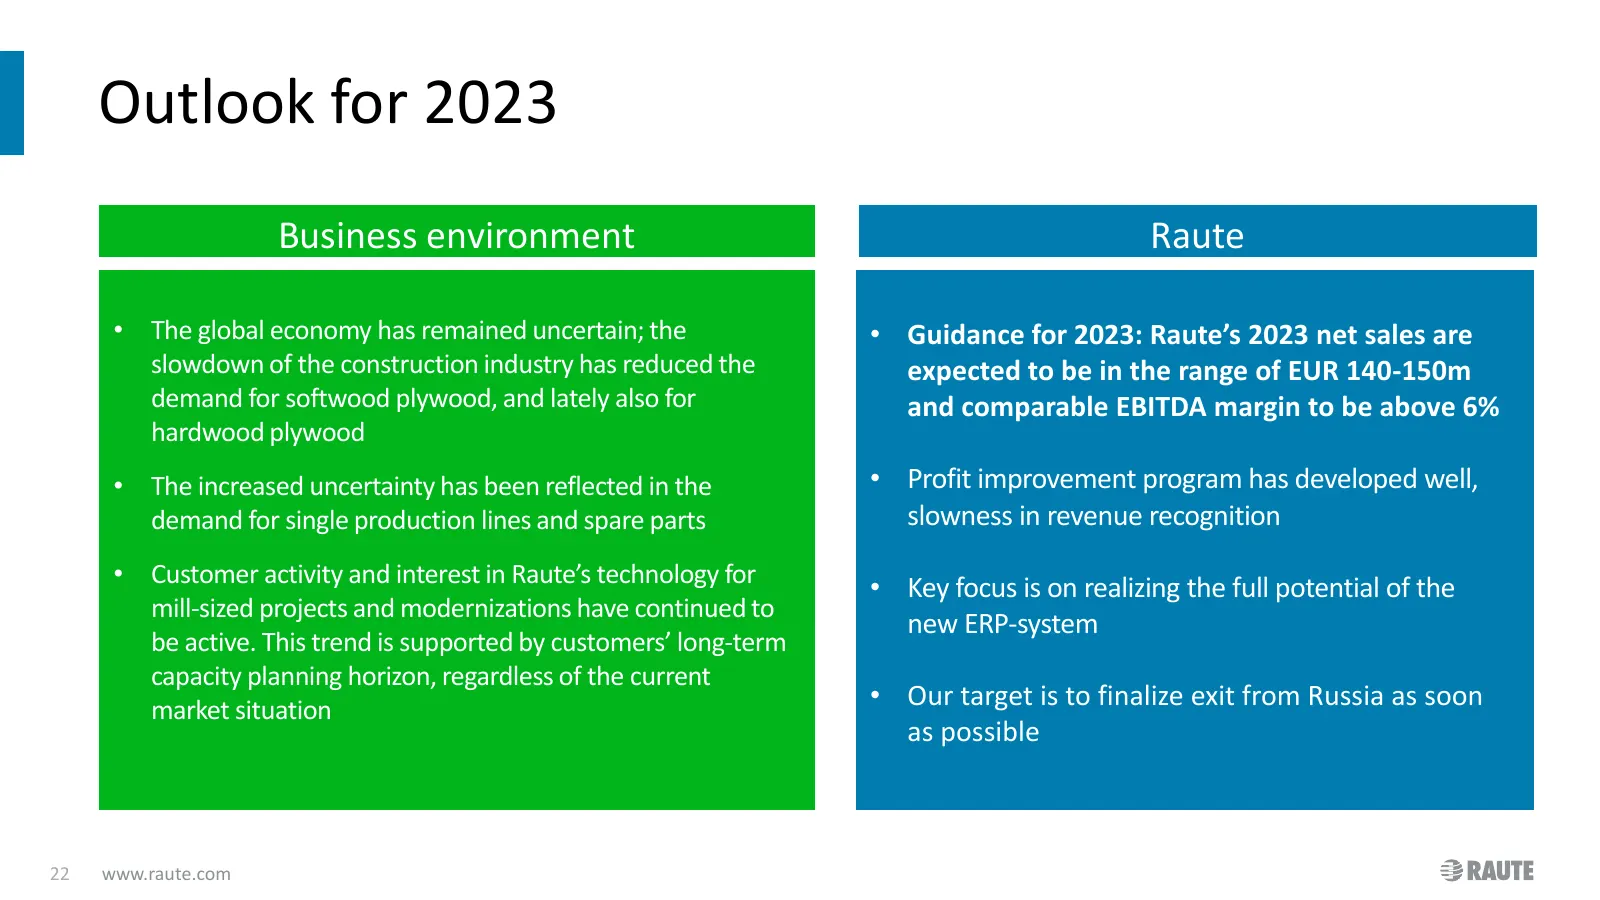
Slide 22: Outlook for 2023
Outlook for 2023 Business environment Raute • The global economy has remained uncertain; the • Guidance for 2023: Raute’s 2023 net sales are slowdown of the construction industry has reduced the expected to be in the range of EUR 140-150m demand for softwood plywood, and lately also for and comparab

Slide 23: Further information
Further information Mika Saariaho President and CEO +358 40 1549393 mika.saariaho@raute.com Ville Halttunen CFO +358 50 3460868 ville.halttunen@raute.com.com 23 www.raute.com

Slide 24: Thank you for your interest!
Thank you for Follow us online: your interest! www.raute.com LinkedIn: Raute Oyj Youtube: www.youtube.com/RauteMachinery Facebook: Raute Corporation Instagram: @rautecorporation
Source: Internet Archive copy of materials.raute.com
More decks from Raute Oyj Class A
 H1 2026 Earnings Presentation29 slides · Aug 12, 2026
 Q1 2026 Earnings Presentation29 slides · May 7, 2026
 FY2025 Earnings Presentation30 slides · Feb 12, 2026
 Q3 2025 Earnings Presentation29 slides · Oct 30, 2025
 H1 2025 Earnings Presentation29 slides · Aug 12, 2025
 Q1 2025 Earnings Presentation29 slides · May 7, 2025