U.S. Concrete — Stephens Inc. Fall Investment Conference 2008
34 slides from U.S. Concrete's conference presentation, Nov 18, 2008

Slide 1: Stephens Inc. Fall Investment Conference November 19, 2008
Stephens Inc. Fall Investment Conference November 19, 2008
Slide 2: Forward-Looking Statement
Forward-Looking Statement Certain statements provided in this presentation, including those that express a belief, expectation or intention and those that are not of historical fact, are “forward-looking statements” within the meaning of Section 27A of the Securities Act of 1933 and Section 21E of t

Slide 3: Company Overview
Company Overview
Slide 4: Company Overview
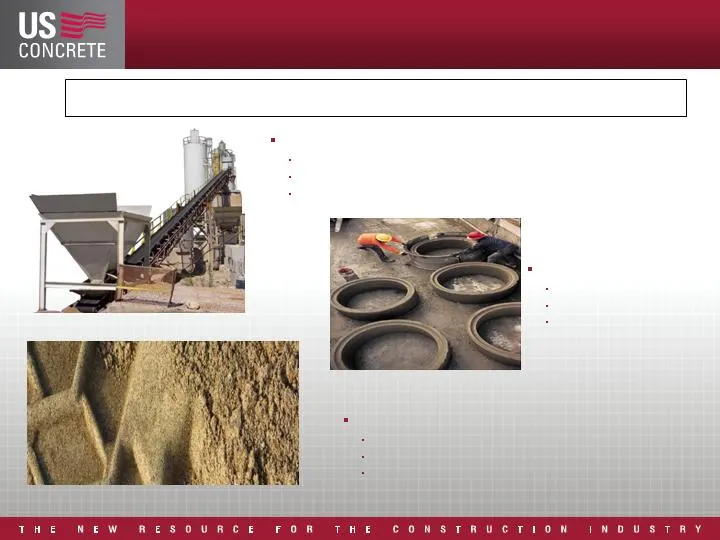
Company Overview Ready mixed concrete 7.2 million cubic yards $745 million in revenue Leading market position in 5 regions Aggregate business 7 producing aggregate facilities 2 aggregate facilities leased to third parties Strategic focus to pursue vertically integrated growth opportunities Precast p
Slide 5: Broad Geographic Footprint
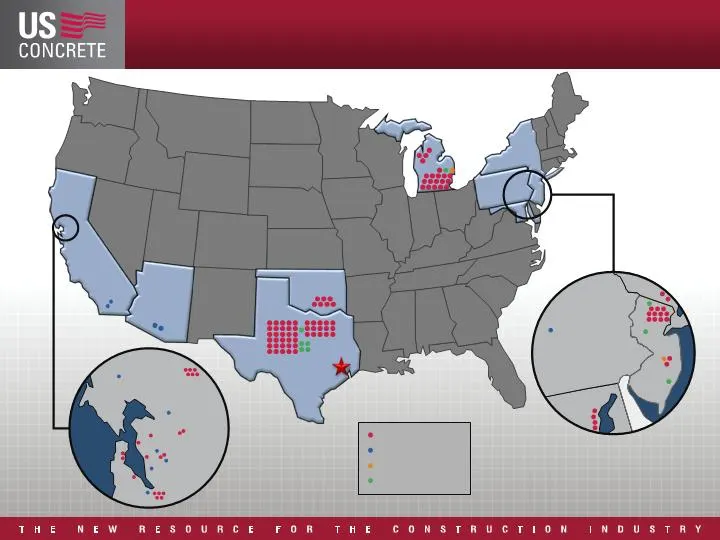
SAN FRANCISCO HEADQUARTERS Broad Geographic footprint SANTA ROSA SACRAMENTO SAN JOSE MD NJ DE NY PA FIXED READY-MIXED PRECAST BLOCK AGGREGATES
Slide 6: Our Strategy Today
Our Strategy Today Aggressively manage through current economic cycle Implement cost controls throughout organization Control capital spending Manage balance sheet and capital structure Maintain maximum liquidity Evaluate existing asset base Ensure assets are delivering appropriate returns Increasin

Slide 7: Industry Overview
Industry Overview
Slide 8: Large, Fragmented Market
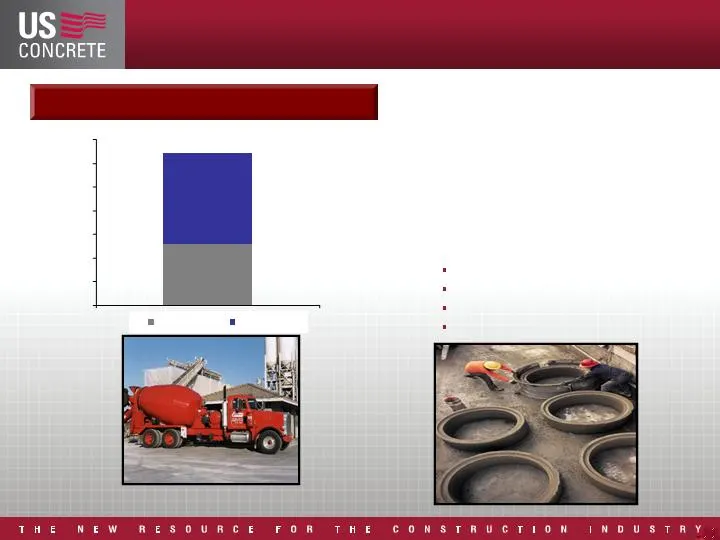
$27 billion $26 billion Large, Fragmented Market Concrete Products Market Size $26.0 $36.0 Over $60 billion in annual revenue More than 2,300 independent ready- mixed concrete producers More than 3,600 precast concrete manufacturers Increasing vertical integration among cement, aggregates and concre
Slide 9: Route to Market
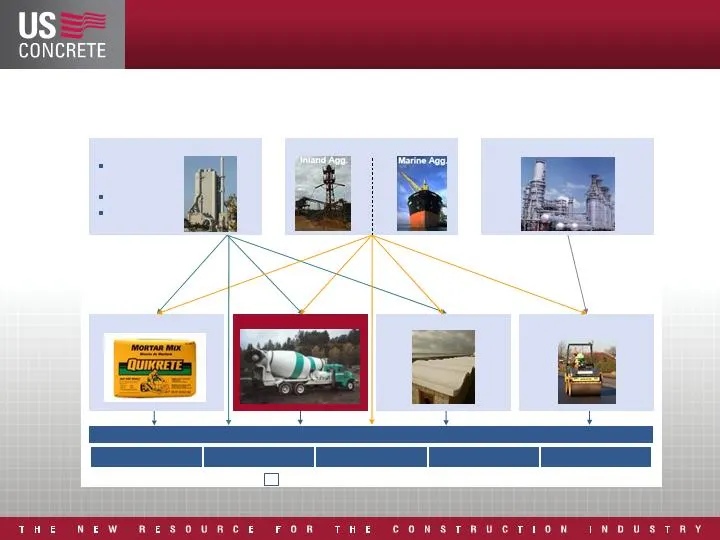
Route to Market READY MIX CUSTOMERS Home Builders General Contractors/ Self Builders Merchants/DIY Civil Engineering Contractors Local Authorities / Highway Agency Ready mix serves as principal route to market for cement, as well as an important channel for aggregates . . . CEMENTITIOUS AGGREGATES B
Slide 10: Concrete Industry Market Share - 2000
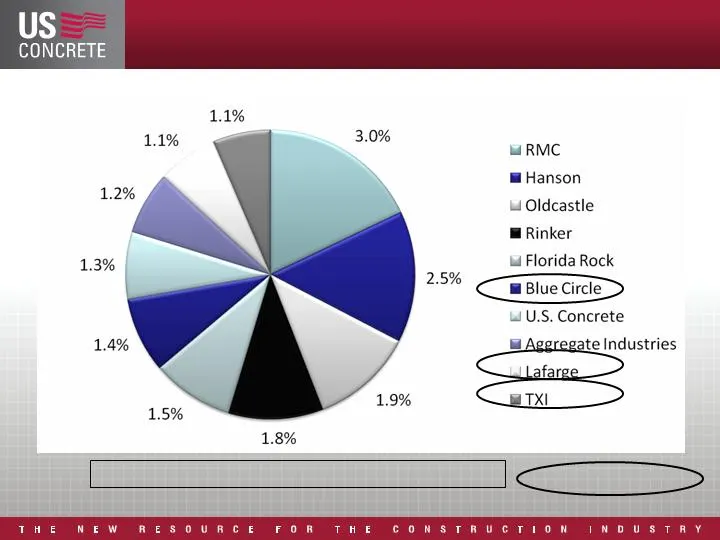
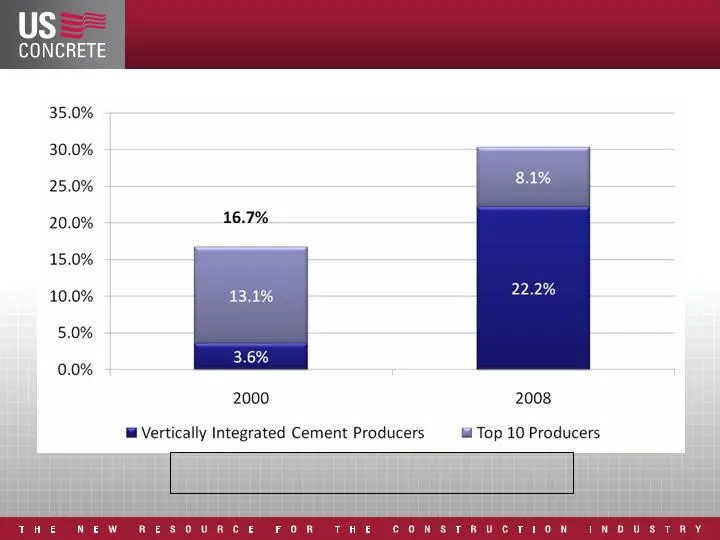
Concrete Industry Market Share - 2000 Source: Company Estimates Vertically integrated cement producers Top 10 Producers Supplied 16.7% of the Market
Slide 11: Concrete Industry Market Share - 2008
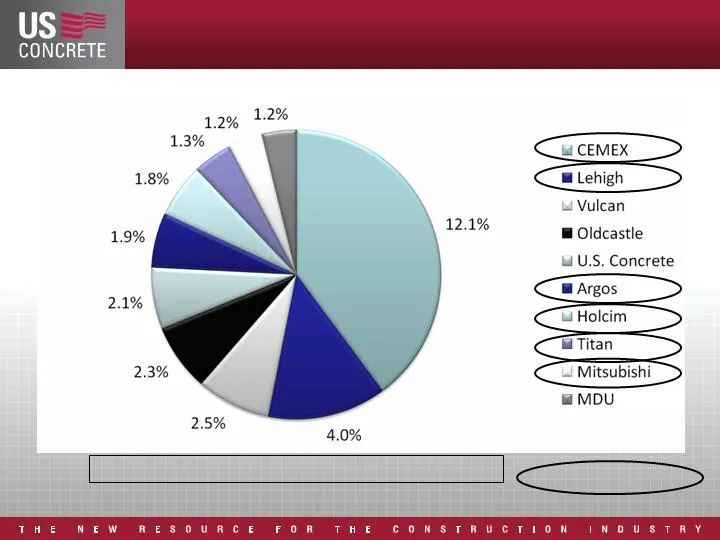
Concrete Industry Market Share - 2008 Source: Company Estimates Vertically integrated cement producers Top 10 Producers Now Supply 30.3% of the Market
Slide 12: Top Producers Market Share Trend
Top 10 Producers Market Share Trend Source: Company Estimates Vertically Integrated Producers have achieved greater concentration in major metropolitan markets 30.3%
Slide 13: Ready-Mixed Concrete End Use Markets
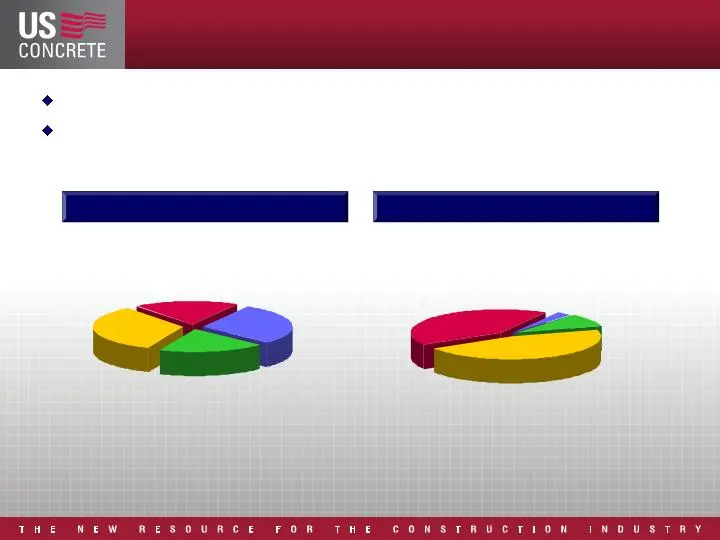
Ready-Mixed Concrete End Use Markets U.S. Concrete Total U.S. Market Source: F.W. Dodge Source: Company filings - 2007 Commercial and industrial sectors generate higher margins Streets and highways often self- performed by construction companies Other Public Works 33% Street & Highway 20% Residentia
Slide 14: McGraw Hill U.S. Construction Starts
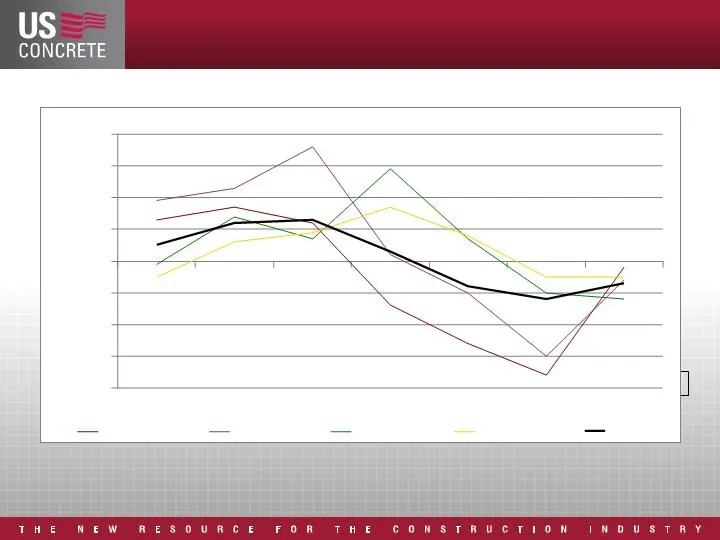
McGraw Hill U.S. Construction Starts Represents annual percent change in construction dollars. 2009 – (7.0%) -40.0% -30.0% -20.0% -10.0% 0.0% 10.0% 20.0% 30.0% 40.0% Single Family Multifamily Commercial Public Works Total
Slide 15: PCA Cement Demand Forecast - % Change
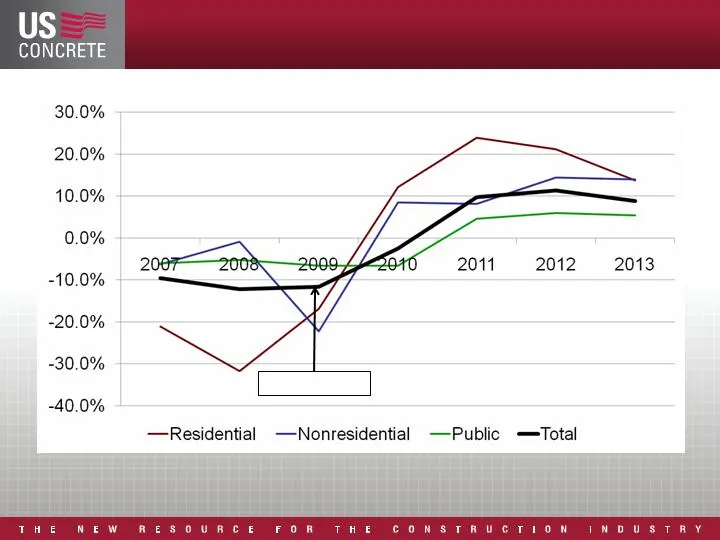
PCA Cement Demand Forecast - % Change Represents annual percent change in tons of cement consumed (Updated October 2008) 2009 – (11.6%)
Slide 16: NAHB New Starts Forecast
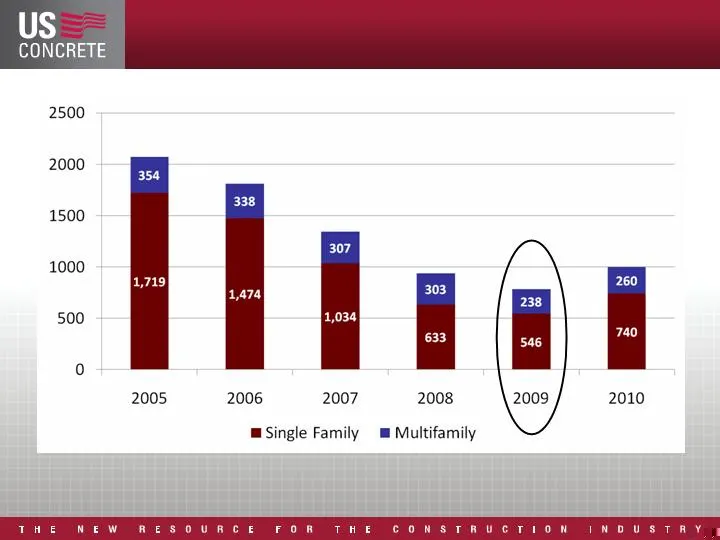
NAHB New Starts Forecast 6.3% (12.6%) (30.2%) (16.2%) 27.6% (26.0%)

Slide 17: Company End Use Markets
Company End Use Markets
Slide 18: Historical Revenue – Consolidated
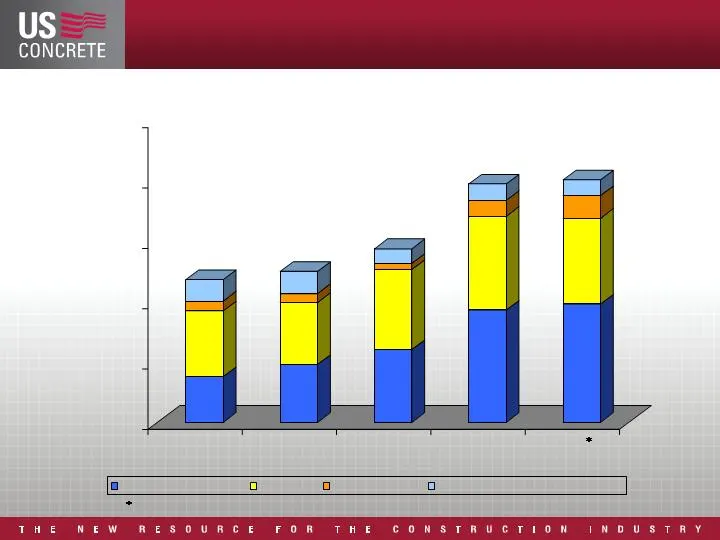
Historical Revenue – Consolidated Continuing operations only 32% 46% 7% 15% 38% 41% 6% 15% 42% 46% 3% 9% 47% 39% 7% 7% 49% 35% 9% 7% $0 $200 $400 $600 $800 $1,000 Millions Commercial & Industrial Residential Street & Highway Other Public Works & Infrastructure
Slide 19: Revenues by Segment - Third Quarter Comparison
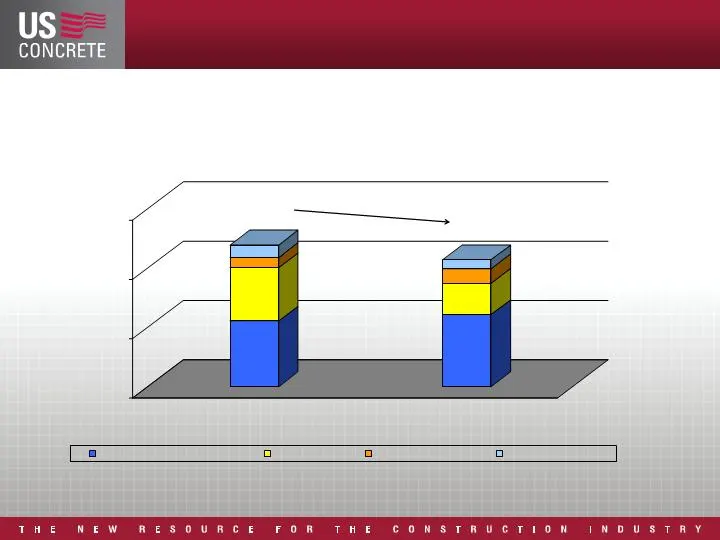
Revenues by Segment -11% Third Quarter Comparison 46% 38% 7% 9% 57% 25% 11% 7% $0 $100 $200 $300 3Q07 3Q08 USC Consolidated ($ in millions) Commercial and industrial Residential Street & highway Other public works
Slide 20: Revenues by Segment - Third Quarter YTD Comparison
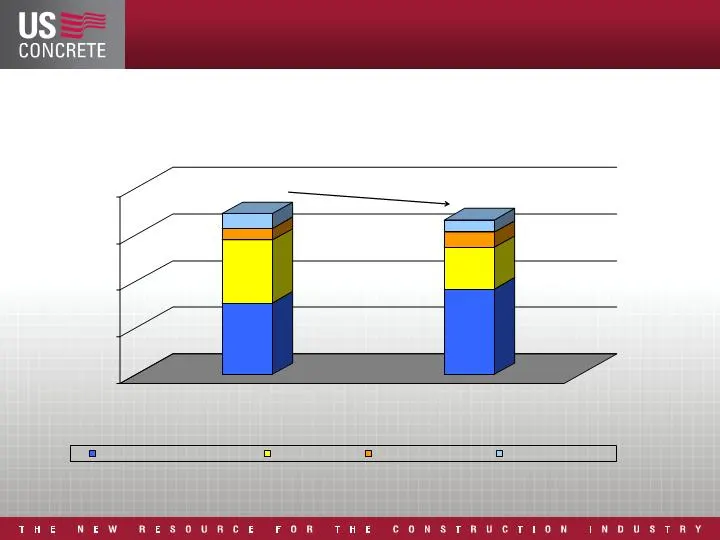
Revenues by Segment -4% Third Quarter YTD Comparison 44% 40% 7% 9% 55% 27% 10% 8% $0 $175 $350 $525 $700 YTD07 YTD08 USC Consolidated ($ in millions) Commercial and industrial Residential Street & highway Other public works

Slide 21: Financial Highlights
Financial Highlights
Slide 22: Historical Financial Review
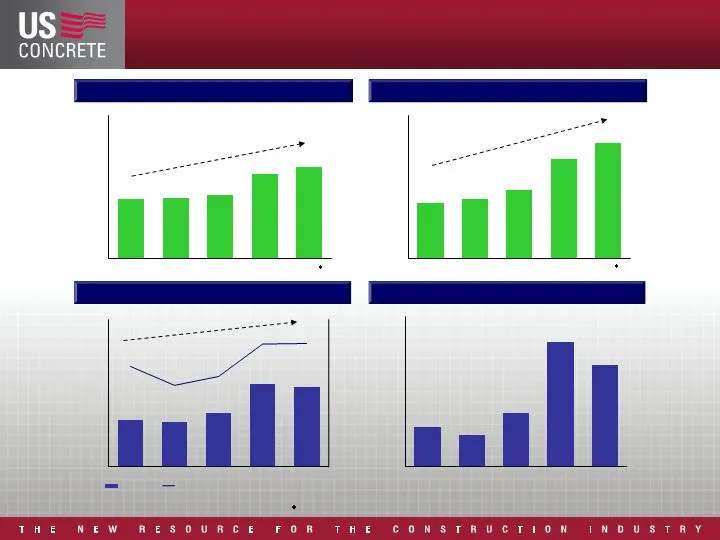
Historical Financial Review RMC Volume Revenue EBITDA Capex (excl. acquisitions) (Dollars in millions) EBITDA EBITDA Margin (Dollars in millions) CAGR = 15.7% (Cubic yards in thousands) CAGR = 13.9% (Dollars in millions) CAGR = 11.0% 5,026 5,053 5,298 7,336 7,624 3,000 6,000 9,000 12,000 2003A 2004A
Slide 23: Third Quarter 2008 Update
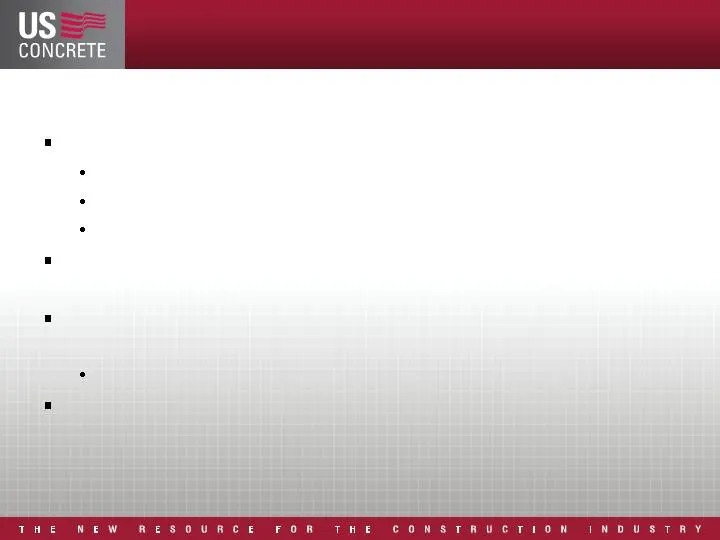
Third Quarter 2008 Update Third quarter revenue was $212.8, down 10.6% from 2007 Average sales price increased 2.2% Volume declined 14.6% and 17.7% on a same-store-sales basis On a year-to-date basis, volume was 10.6% Raw material spread was 43%, slightly down from 43.3% in Precast segment revenue i
Slide 24: Third Quarter 2008 Update
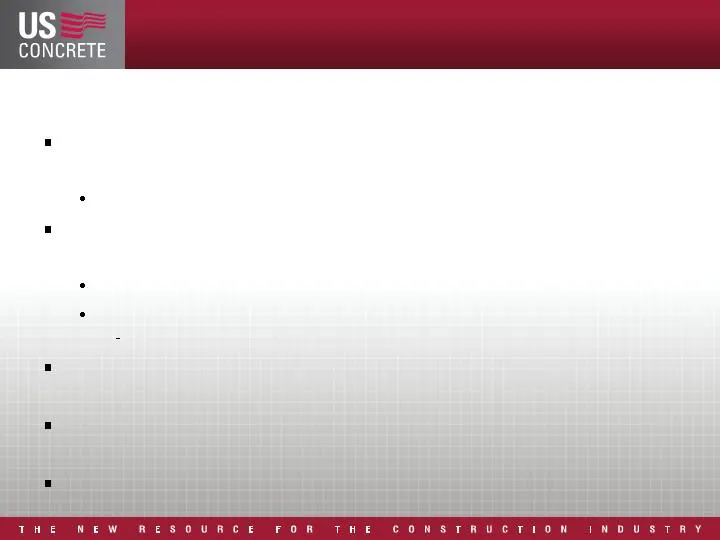
Third Quarter 2008 Update 3 rd quarter adjusted EBITDA includes a $2.0 million additional medical insurance expense accrual Significant increase in large claims in 2008 over prior years Capital expenditures totaled $7.4 million, up $2.4 million over prior year Primarily related to new ERP systems im
Slide 25: Leverage Profile and Liquidity
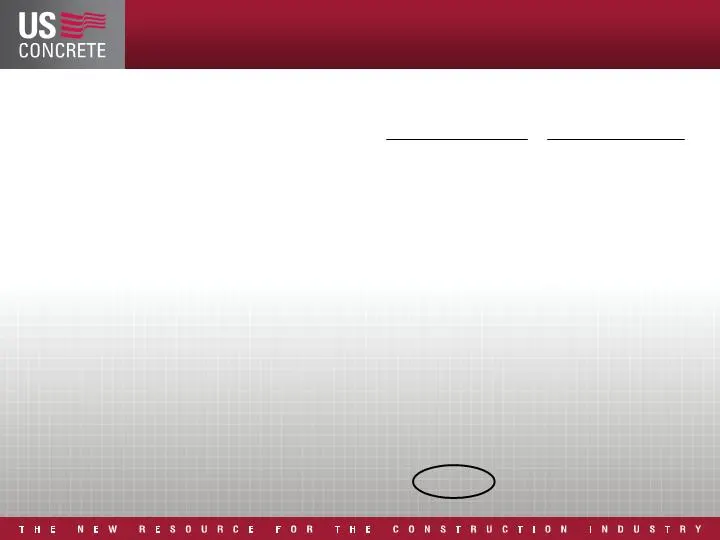
Leverage Profile and Liquidity September 30, December 31, Cash and Cash Equivalents $3,907 $14,850 Total Debt 299,859 298,500 Net Debt 295,952 283,650 Stockholders’ Equity 206,366 205,106 LTM EBITDA 57,184 72,858 LTM Fixed Charges 28,638 29,830 Total Debt to LTM EBITDA 5.2x 4.1x Net Debt to LTM EBIT
Slide 26: Managing Through the Economic Cycle
Managing Through the Economic Cycle Cost control initiatives continue Headcount reductions Reducing discretionary spending Disposing of excess equipment Temporarily idling plants Controlling capital expenditures Limiting external growth initiatives Focusing on value added and engineered sales progra
Slide 27: Key Company Strengths
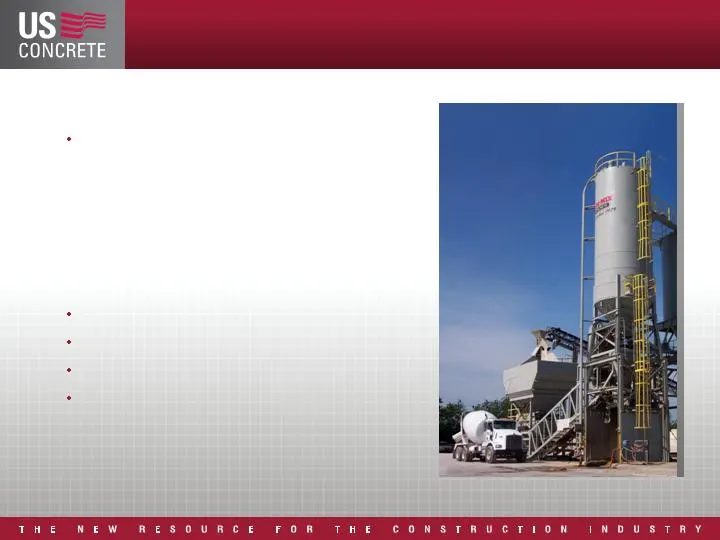
Key Company Strengths Leading market share positions 5 regional markets Effectively managing through economic cycle Exposure to residential sector reduced significantly Strong balance sheet with solid liquidity $3.5 million of cash at June 2008 $97 million of credit available No significant financia

Slide 28: Stephens Inc. Fall Investment Conference November 19, 2008
Stephens Inc. Fall Investment Conference November 19, 2008
Slide 29: Disclosure of Non-GAAP Financial Measures
Disclosure of Non-GAAP Financial Measures U.S. CONCRETE, INC. ADDITIONAL STATISTICS (In thousands, unless otherwise noted; unaudited) We report our financial results in accordance with generally accepted accounting principles in the United States (“GAAP”). However, our management believes that certa
Slide 30: Disclosure of Non-GAAP Financial Measures
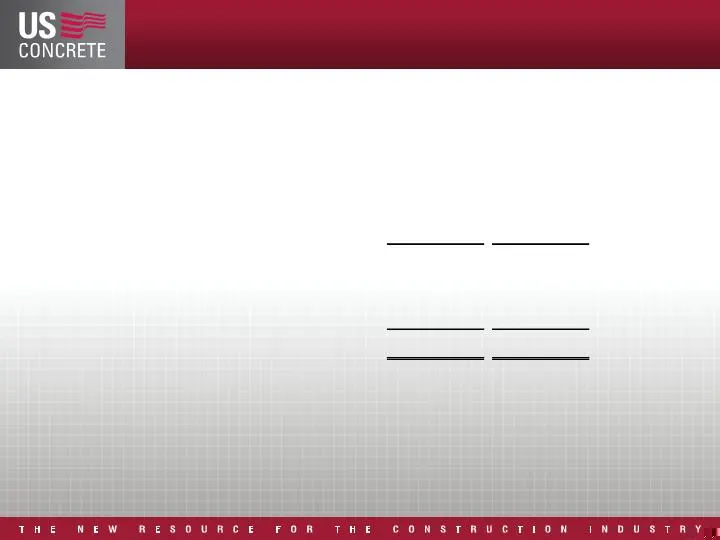
Disclosure of Non-GAAP Financial Measures U.S. Concrete, Inc. and Subsidaries Reconciliation of Net Income from Continuing Operations to Adjusted EBITDA (amounts in thousands) Quarter Ended Quarter Ended September 30, 2008 September 30, 2007 Income from continuing operations 1,722 $ 10,127 $ Addback
Slide 31: Disclosure Non-GAAP Financial Measures
Disclosure Non-GAAP Financial Measures U.S. Concrete, Inc. and Subsidaries Reconciliation of Net Income (Loss) to EBITDA (unaudited) (amounts in thousands) Net Income (Loss) (63,760) $ (8,090) $ 12,612 $ (10,539) $ 10,303 $ Cumulative Effect of Change in Accounting Principle - - - - - Income (Loss)
Slide 32: Disclosure Non-GAAP Financial Measures
Disclosure Non-GAAP Financial Measures U.S. Concrete, Inc. and Subsidaries Reconciliation of Net Cash Provided by Operating Activities to Free Cash Flow (unaudited) (amounts in thousands) Quarter Ended Quarter Ended YTD YTD September 30, 2008 September 30, 2007 September 30, 2008 September 30, 2007
Slide 33: Disclosure Non-GAAP Financial Measures
Disclosure Non-GAAP Financial Measures U.S. Concrete, Inc. and Subsidaries Reconciliation of Net Debt (unaudited) (amounts in thousands) Quarter Ended Quarter Ended September 30, 2008 December 31, 2007 Total Debt, including current maturities and capital lease obligations 299,858 $ 298,500 $ Less ca

Slide 34: Stephens Inc. Fall Investment Conference November 19, 2008
Stephens Inc. Fall Investment Conference November 18 - 19, 2008
Source: SEC EDGAR · 8-K filed Nov 18, 2008
More decks from U.S. Concrete Inc
 ESG Presentation (April 2021)31 slides · Apr 1, 2021
 Investor Presentation (March 2021)36 slides · Mar 23, 2021
 Investor Presentation (November 2020)36 slides · Nov 12, 2020
 Investor Presentation (June 2020)22 slides · Jun 3, 2020
 Investor Presentation (March 2019)16 slides · Mar 22, 2019
 Investor Presentation (November 2018)17 slides · Nov 5, 2018