Radware Ltd. · NASDAQ:RDWR
Radware — Q2 2019 Earnings Presentation
27 slides from Radware's earnings presentation, August 2019
Slide 1: Investor Presentation Q2 2019
Investor Presentation Q2 2019 August 2019
Slide 2: Safe Harbour
Safe Harbour DISCLAIMER This presentation may contain forward-looking information with respect to plans, projections, or future performance of Radware and its subsidiaries, the occurrence of which involves certain risks and uncertainties, including, but not limited to, general business conditions, c
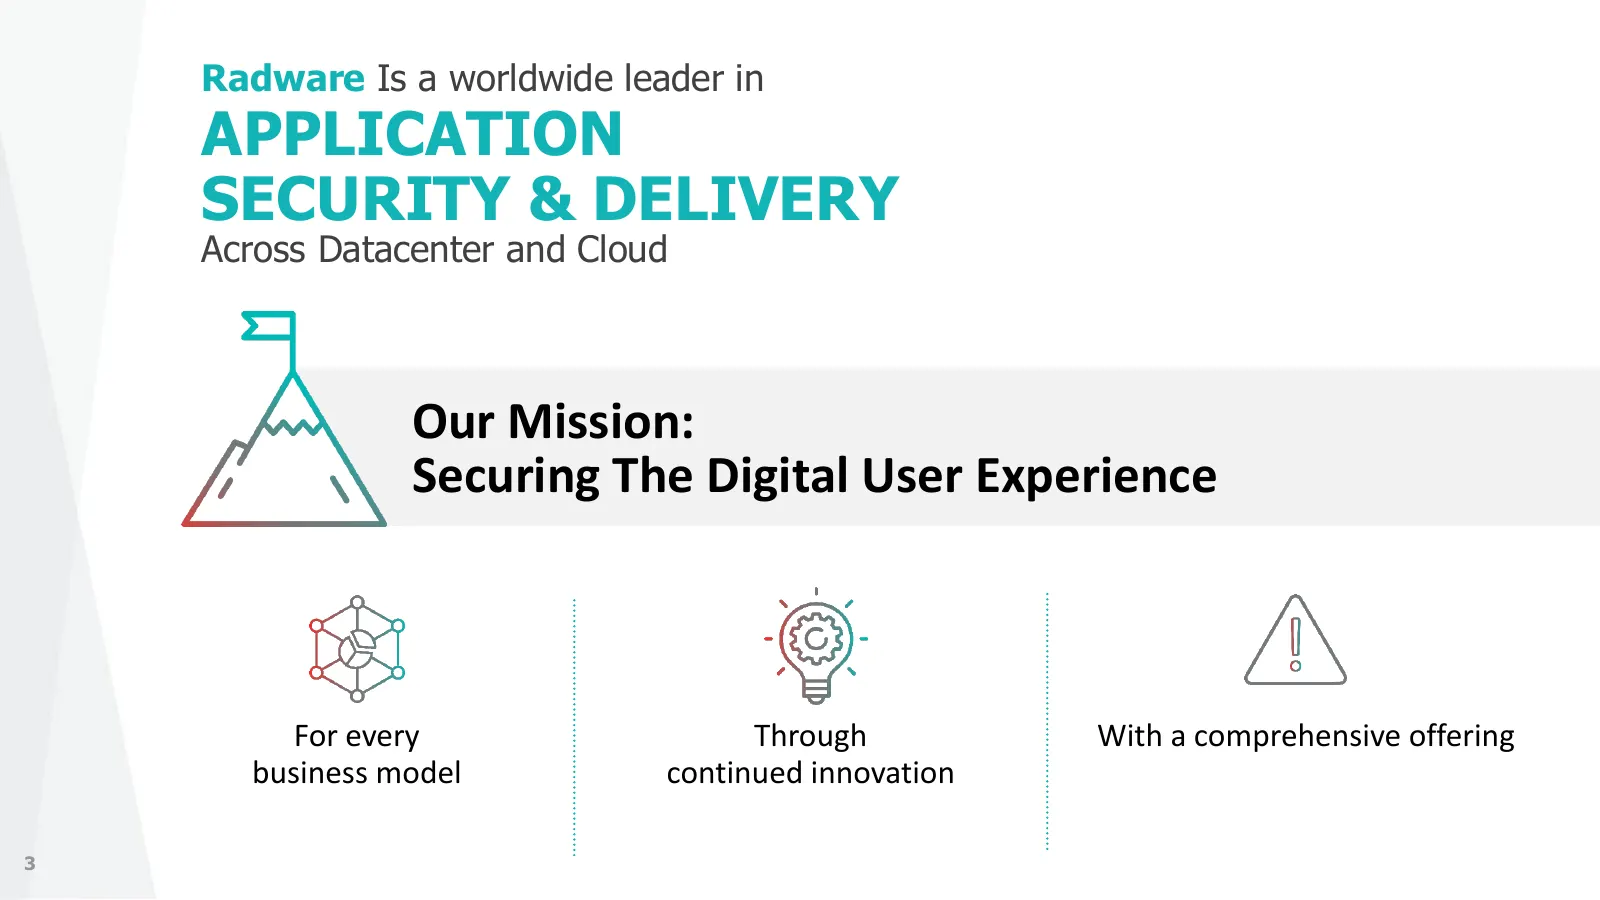
Slide 3: Worldwide leader in Application Security & Delivery
Radware Is a worldwide leader in APPLICATION SECURITY & DELIVERY Across Datacenter and Cloud Our Mission: Securing The Digital User Experience For every Through With a comprehensive offering business model continued innovation 3
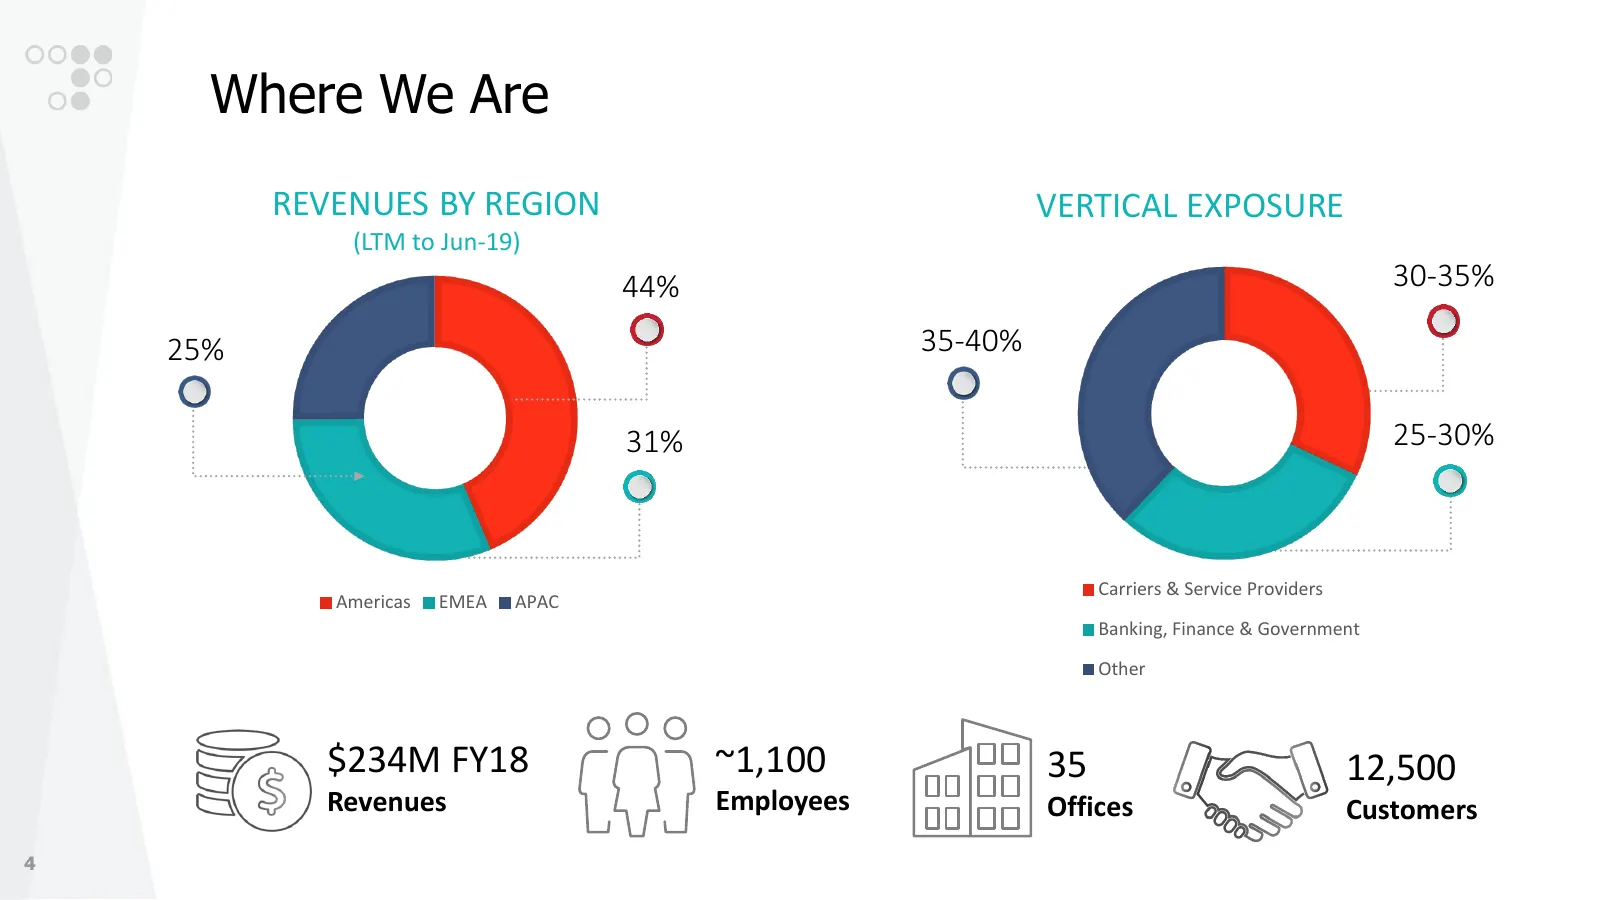
Slide 4: Where We Are
Where We Are REVENUES BY REGION VERTICAL EXPOSURE (LTM to Jun-19) 44% 30-35% 25% 35-40% 31% 25-30% Carriers & Service Providers Americas EMEA APAC Banking, Finance & Government Other $234M FY18 ~1,100 35 12,500 Revenues Employees Offices Customers 4
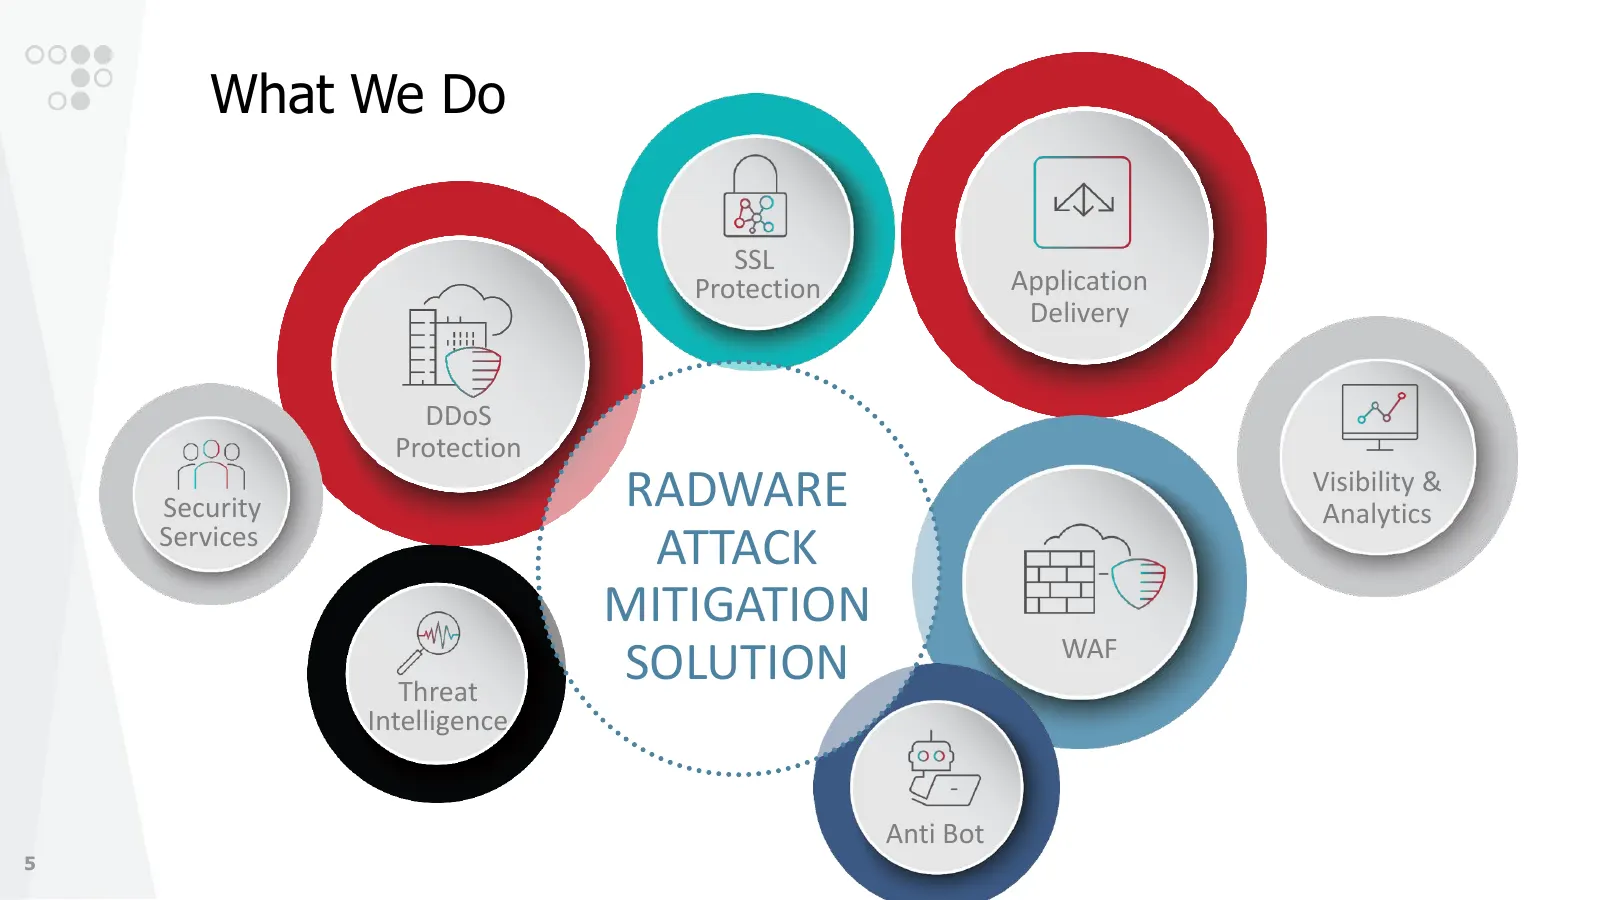
Slide 5: What We Do
What We Do SSL Protection Application Delivery DDoS Protection Security RADWARE Visibility & Analytics Services ATTACK MITIGATION WAF Threat SOLUTION Intelligence Anti Bot 5
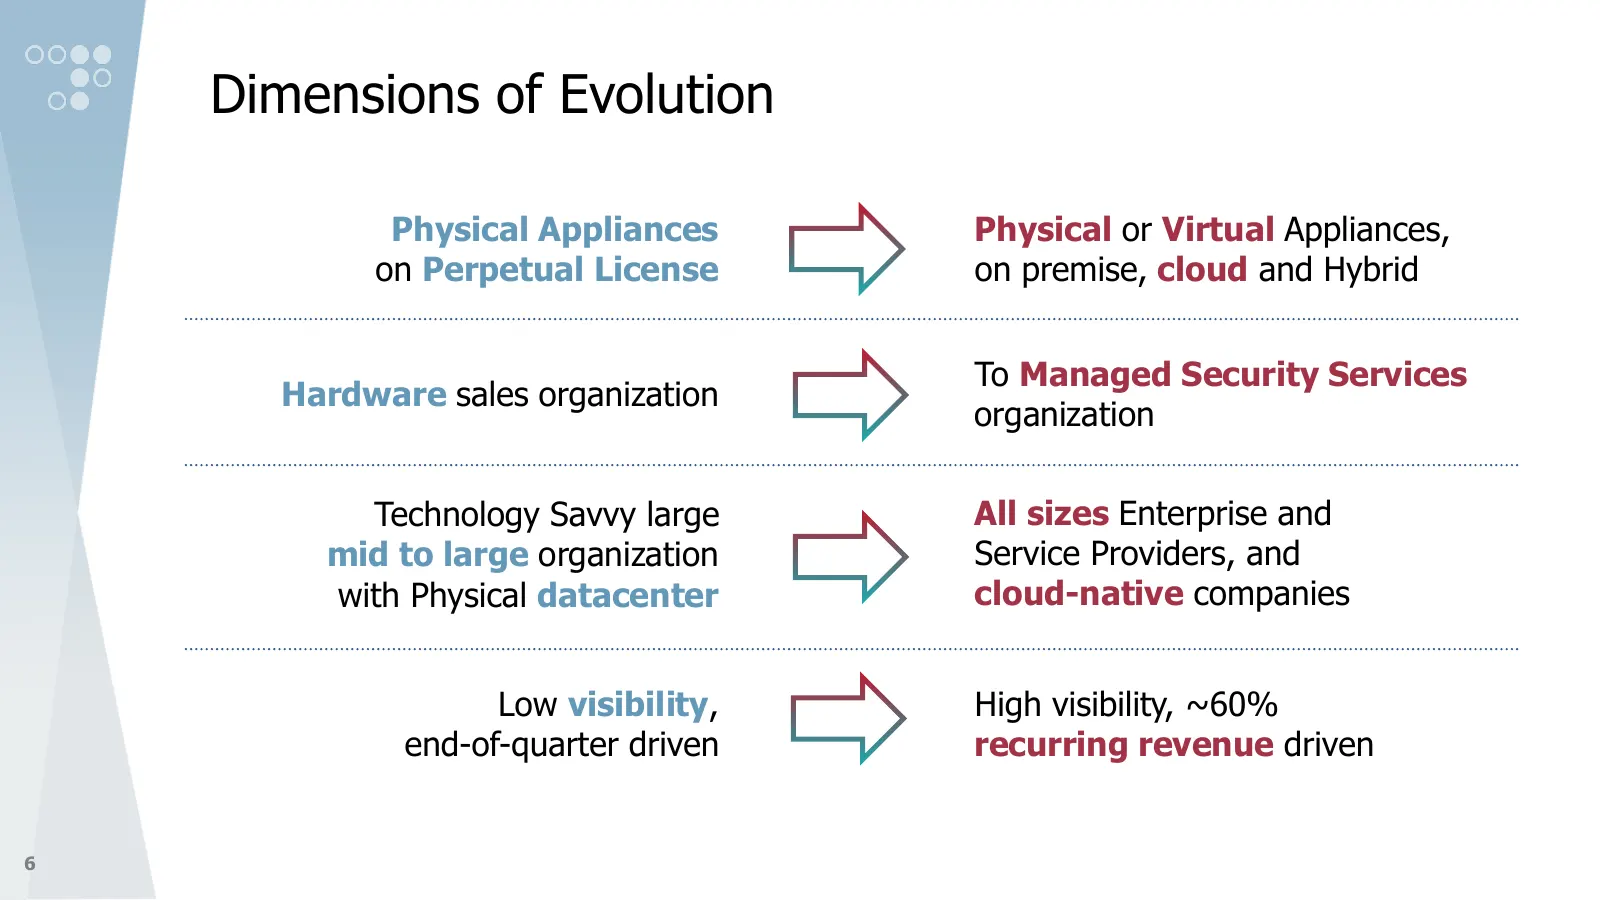
Slide 6: Dimensions of Evolution
Dimensions of Evolution Physical Appliances Physical or Virtual Appliances, on Perpetual License on premise, cloud and Hybrid To Managed Security Services Hardware sales organization organization Technology Savvy large All sizes Enterprise and mid to large organization Service Providers, and with Ph
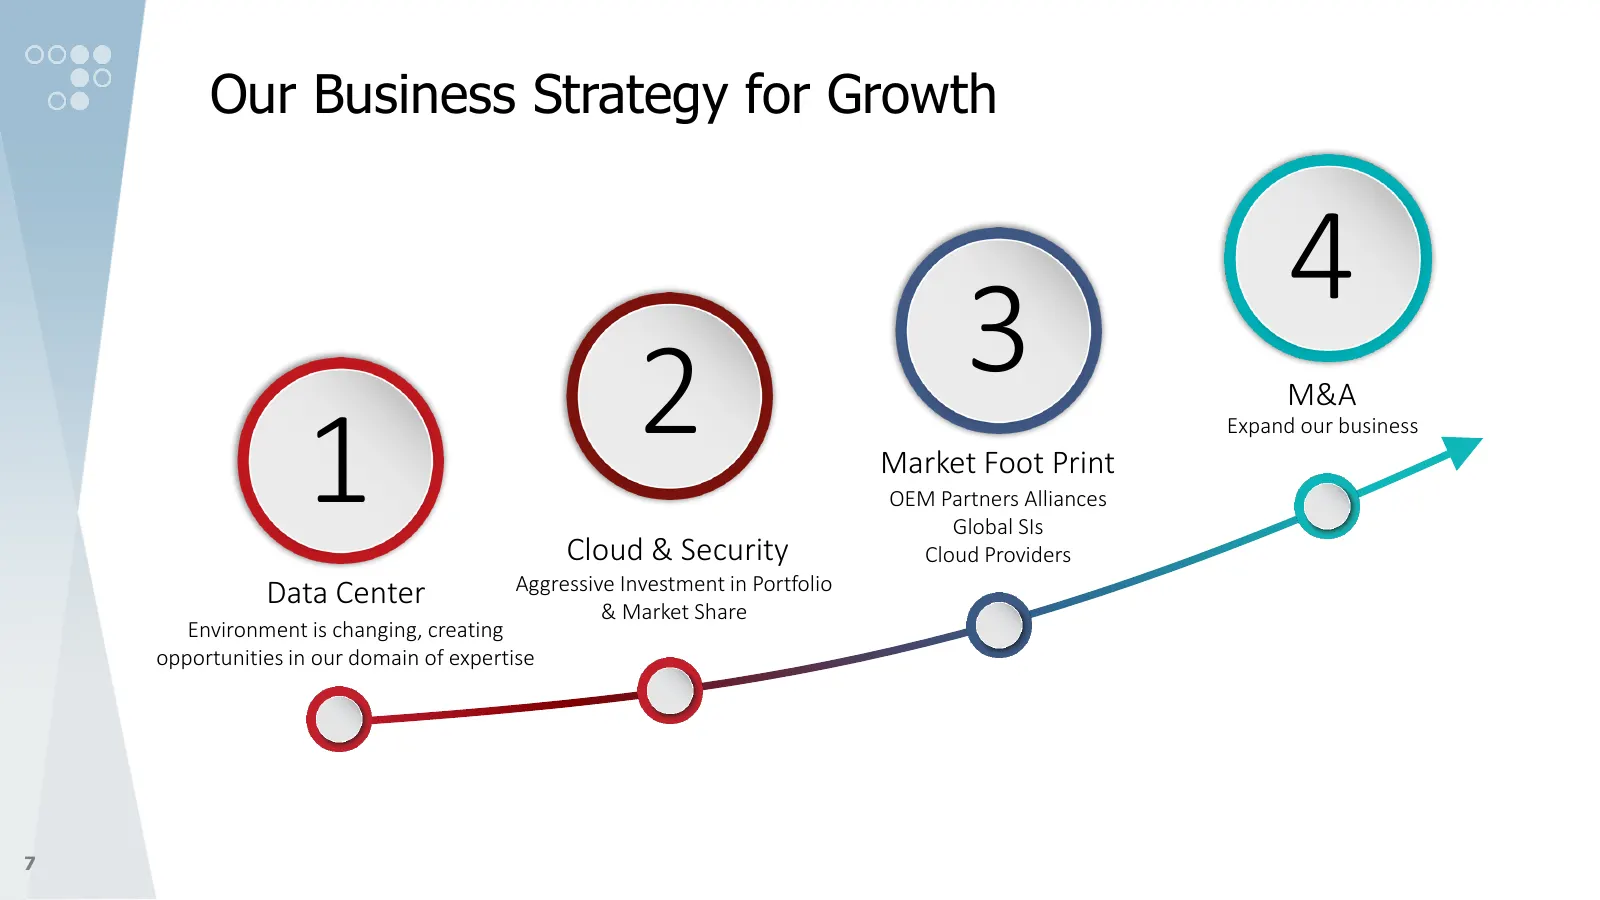
Slide 7: Our Business Strategy for Growth
Our Business Strategy for Growth 4 2 3 M&A 1 Expand our business Market Foot Print OEM Partners Alliances Global SIs Cloud & Security Cloud Providers Data Center Aggressive Investment in Portfolio & Market Share Environment is changing, creating opportunities in our domain of expertise 7
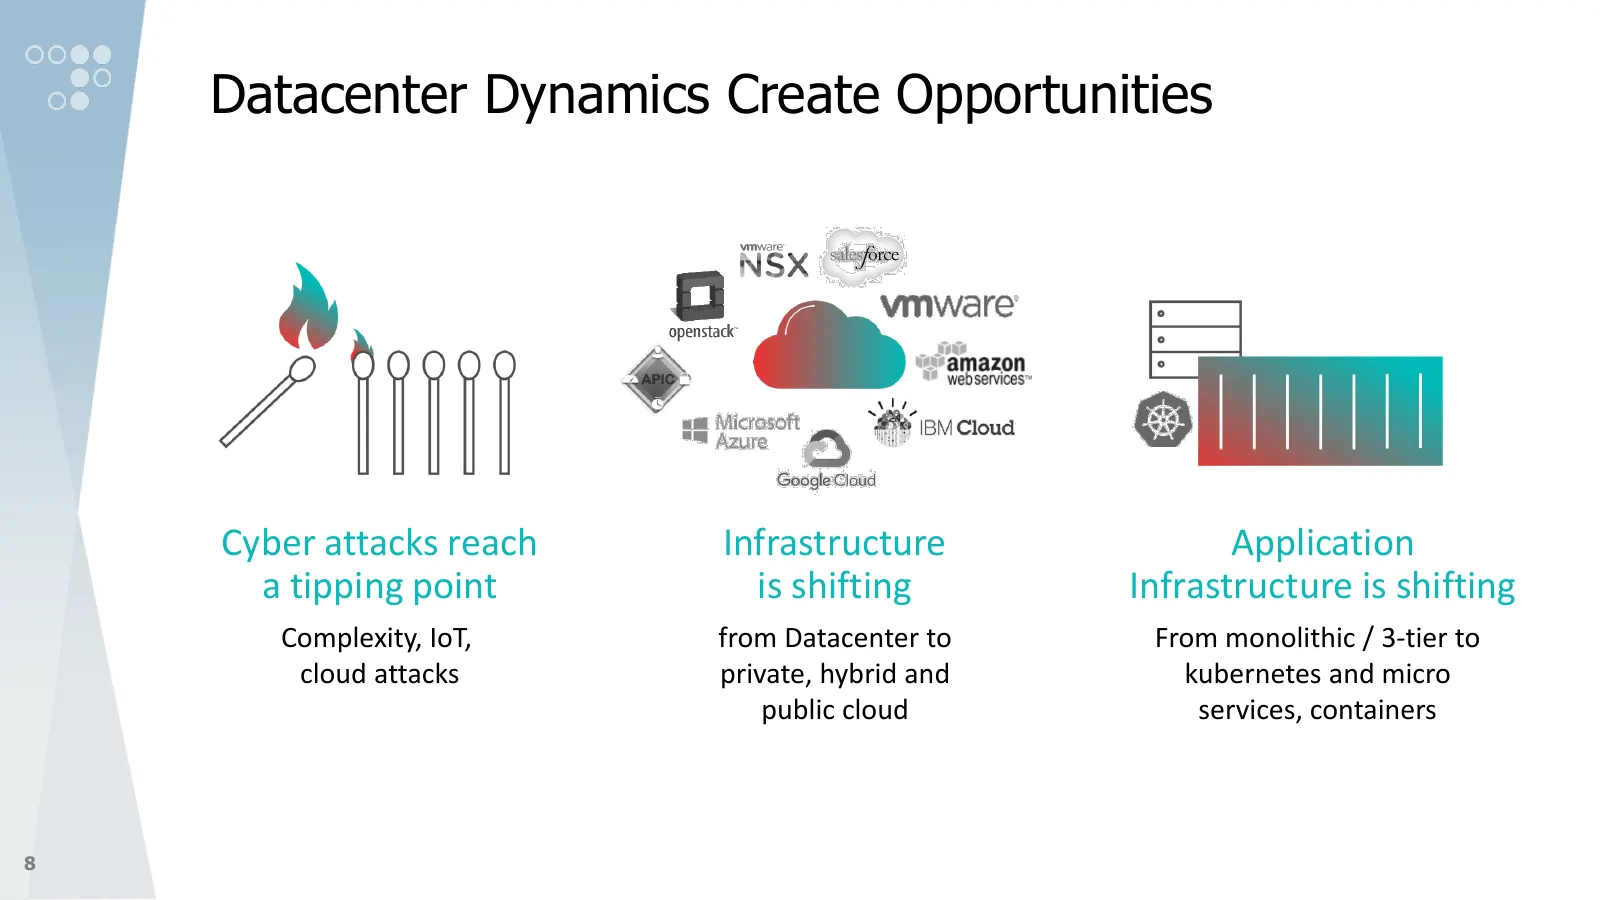
Slide 8: Datacenter Dynamics Create Opportunities
Datacenter Dynamics Create Opportunities Cyber attacks reach Infrastructure Application a tipping point is shifting Infrastructure is shifting Complexity, IoT, from Datacenter to From monolithic / 3-tier to cloud attacks private, hybrid and kubernetes and micro public cloud services, containers 8
Slide 9: Continued Portfolio Evolution
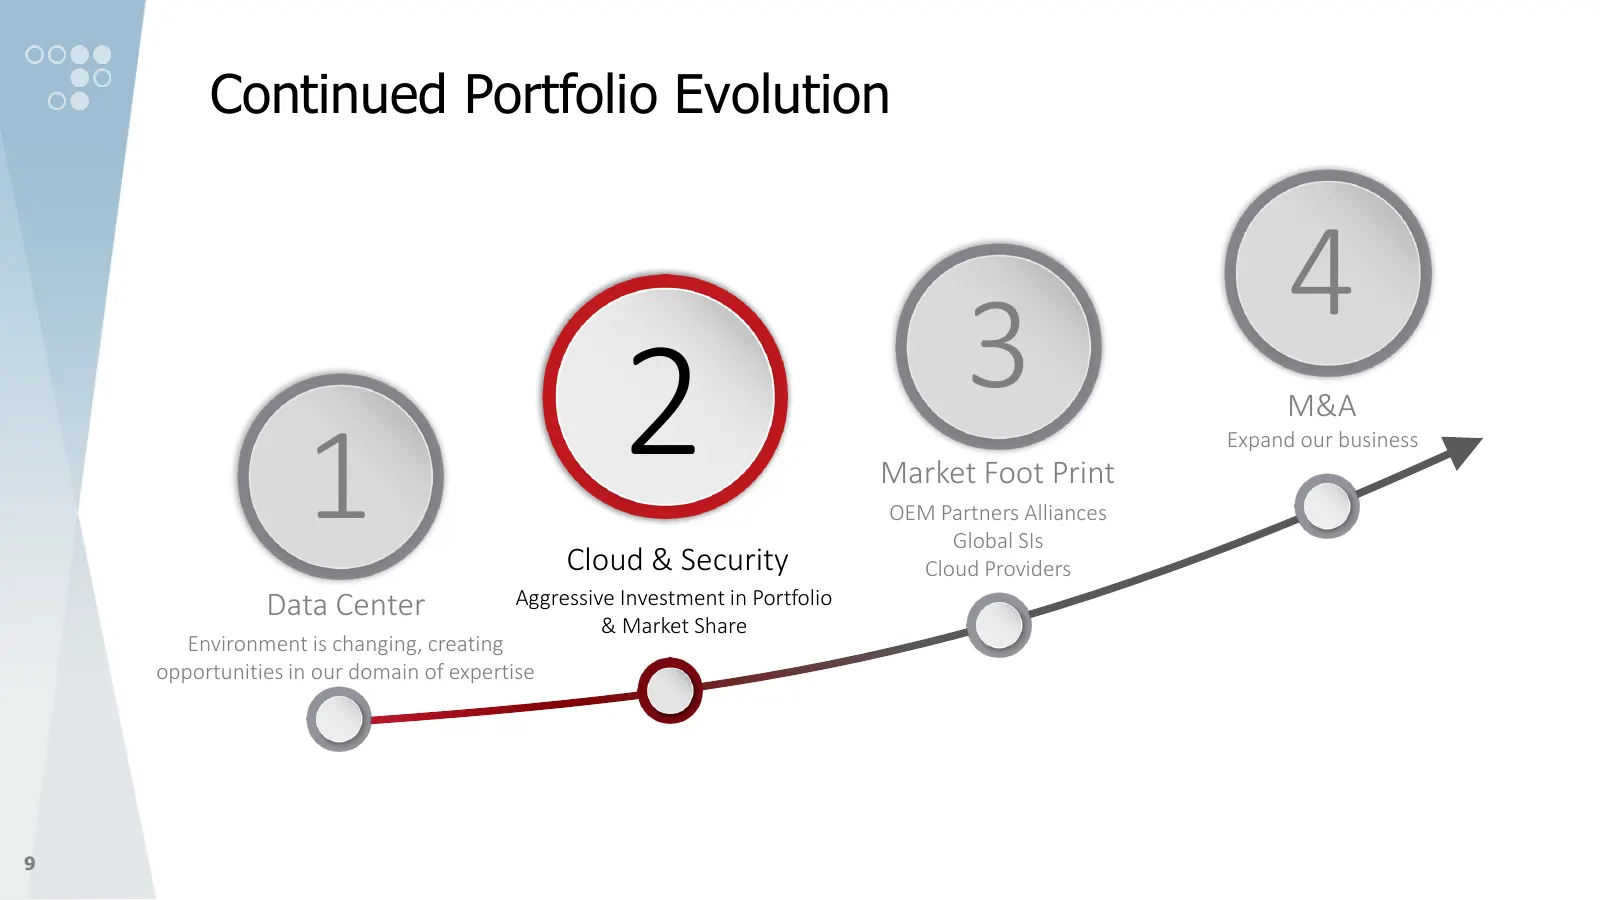
Continued Portfolio Evolution 4 2 3 M&A 1 Expand our business Market Foot Print OEM Partners Alliances Global SIs Cloud & Security Cloud Providers Data Center Aggressive Investment in Portfolio & Market Share Environment is changing, creating opportunities in our domain of expertise 9
Slide 10: Cloud and Security are the Growth Drivers
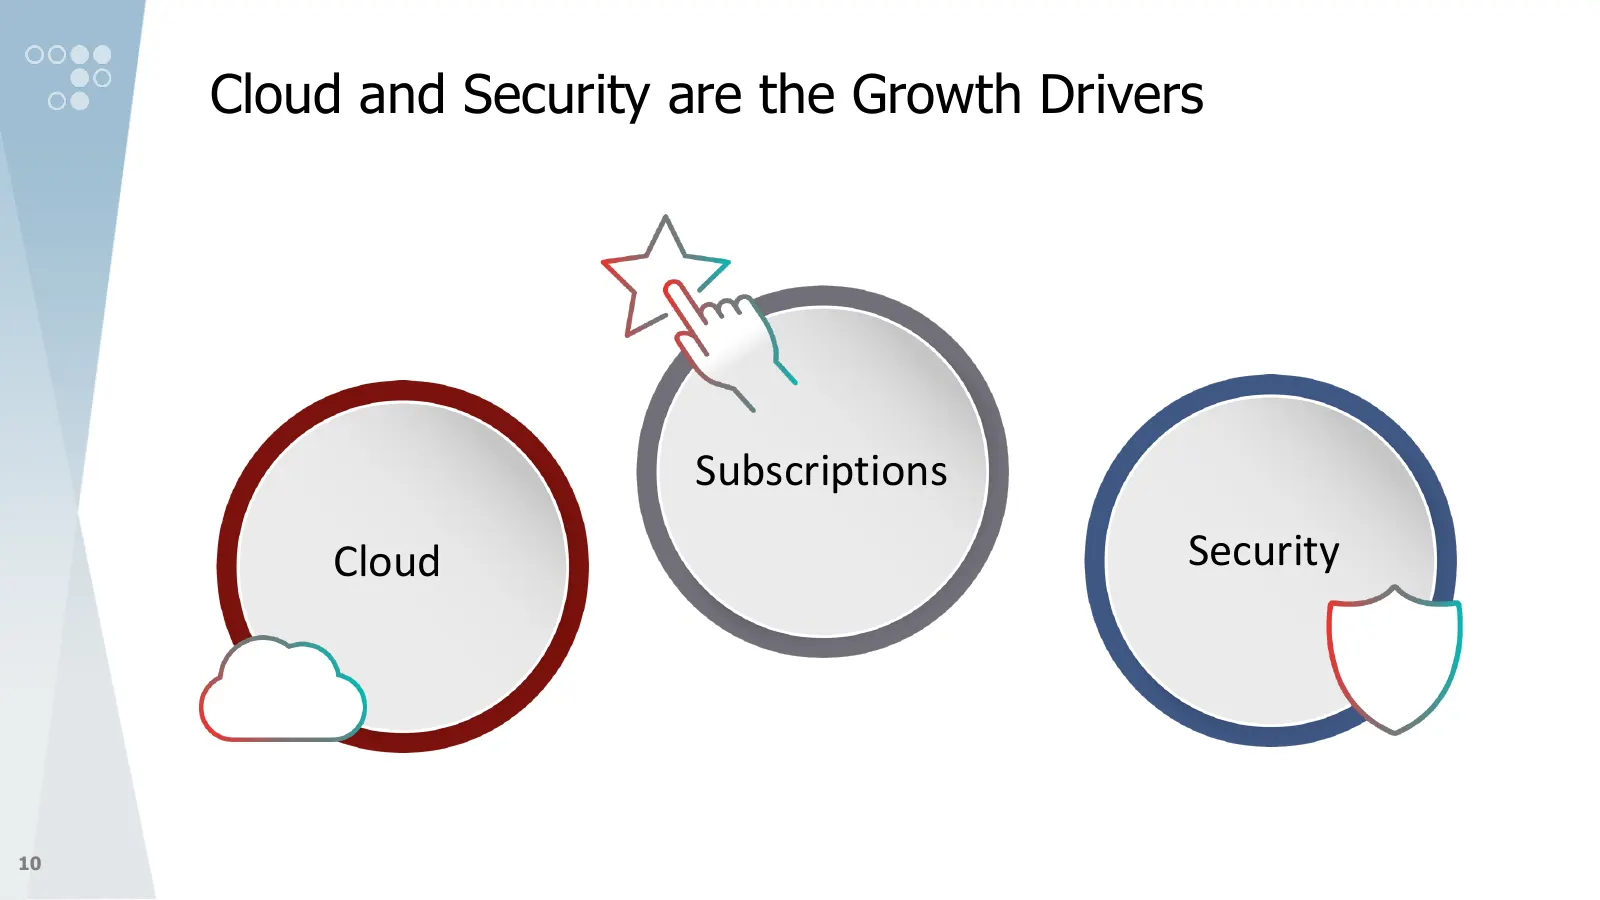
Cloud and Security are the Growth Drivers Subscriptions Cloud Security 10
Slide 11: Cloud and Security are the Growth Drivers
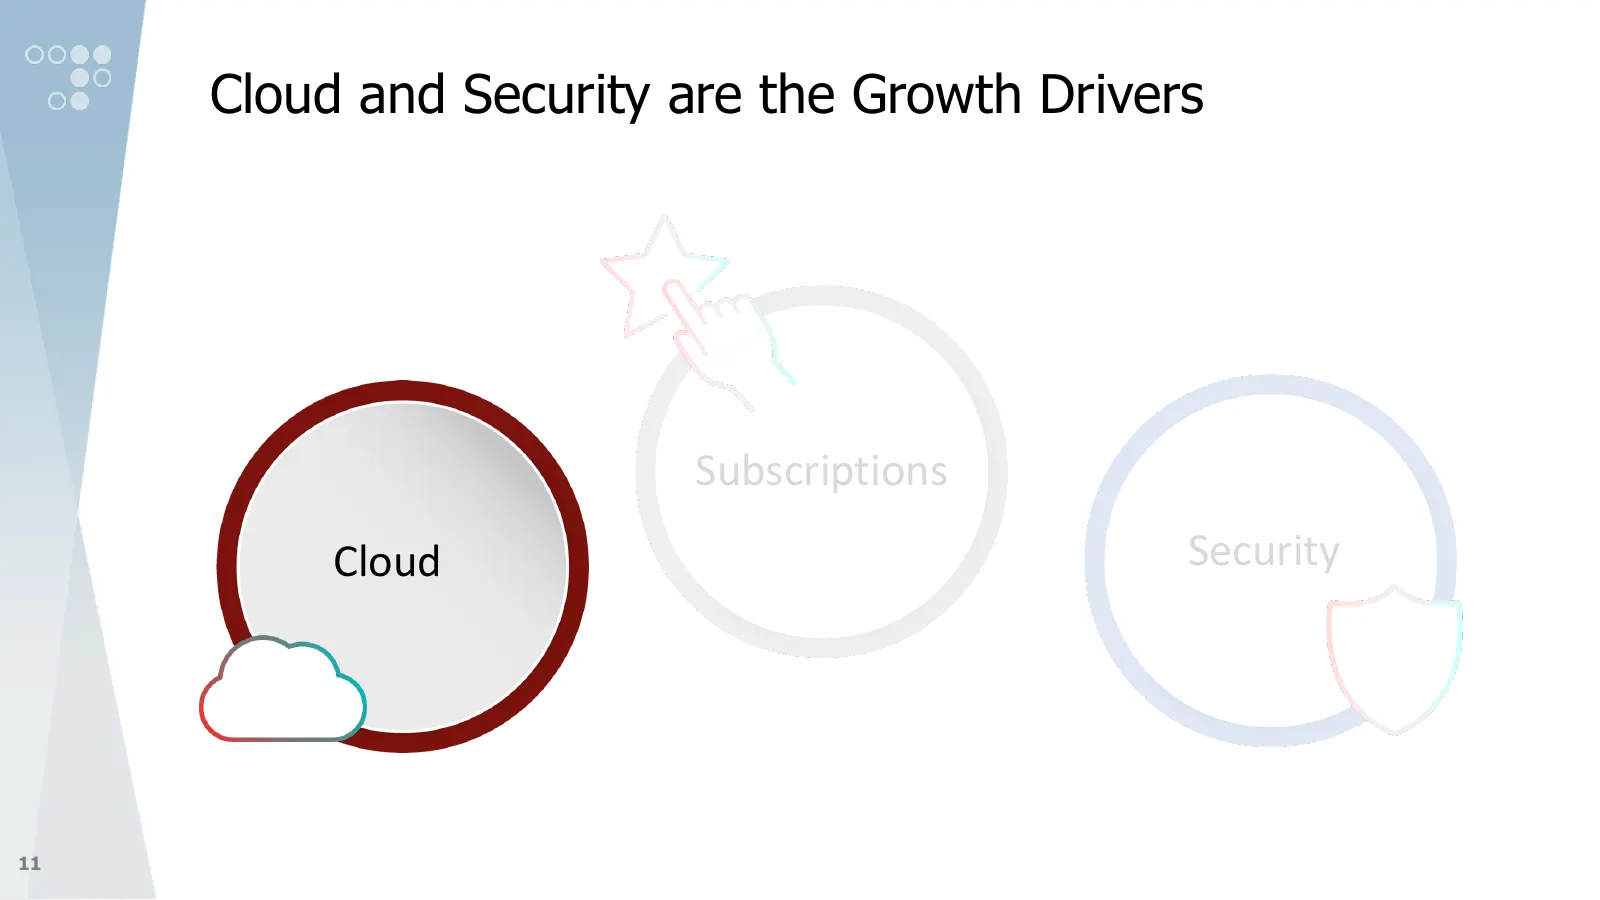
Cloud and Security are the Growth Drivers Subscriptions Cloud Security 11
Slide 12: A Growing Global Cloud Service Infrastructure
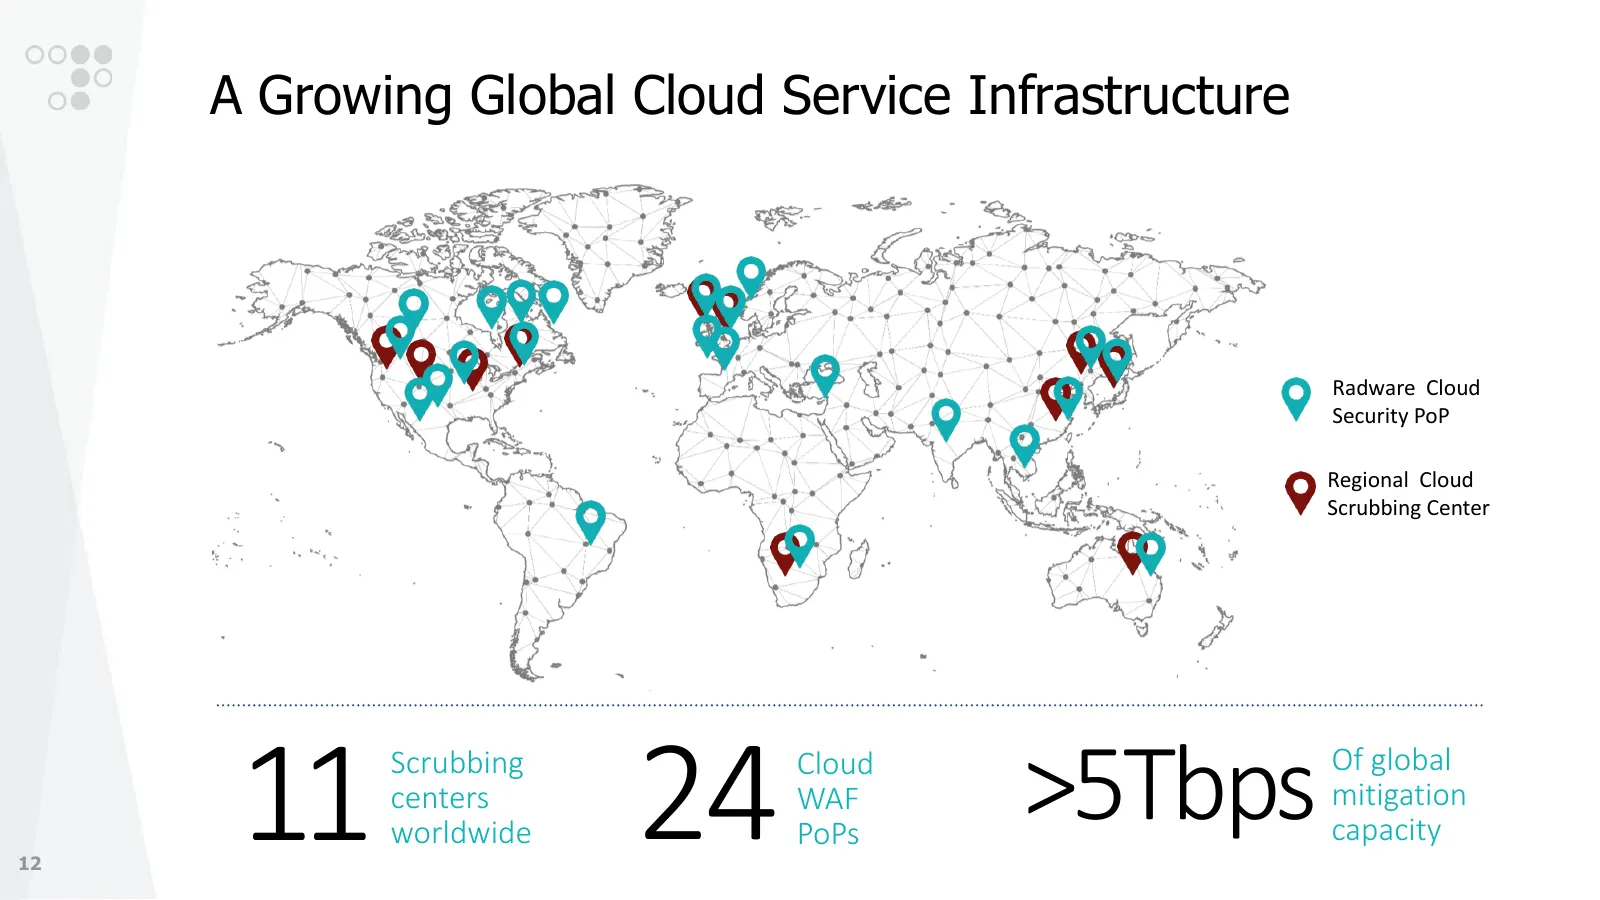
A Growing Global Cloud Service Infrastructure Radware Cloud Security PoP Regional Cloud Scrubbing Center 12 11 Scrubbing centers worldwide 24 Cloud WAF PoPs >5Tbps Of global mitigation capacity
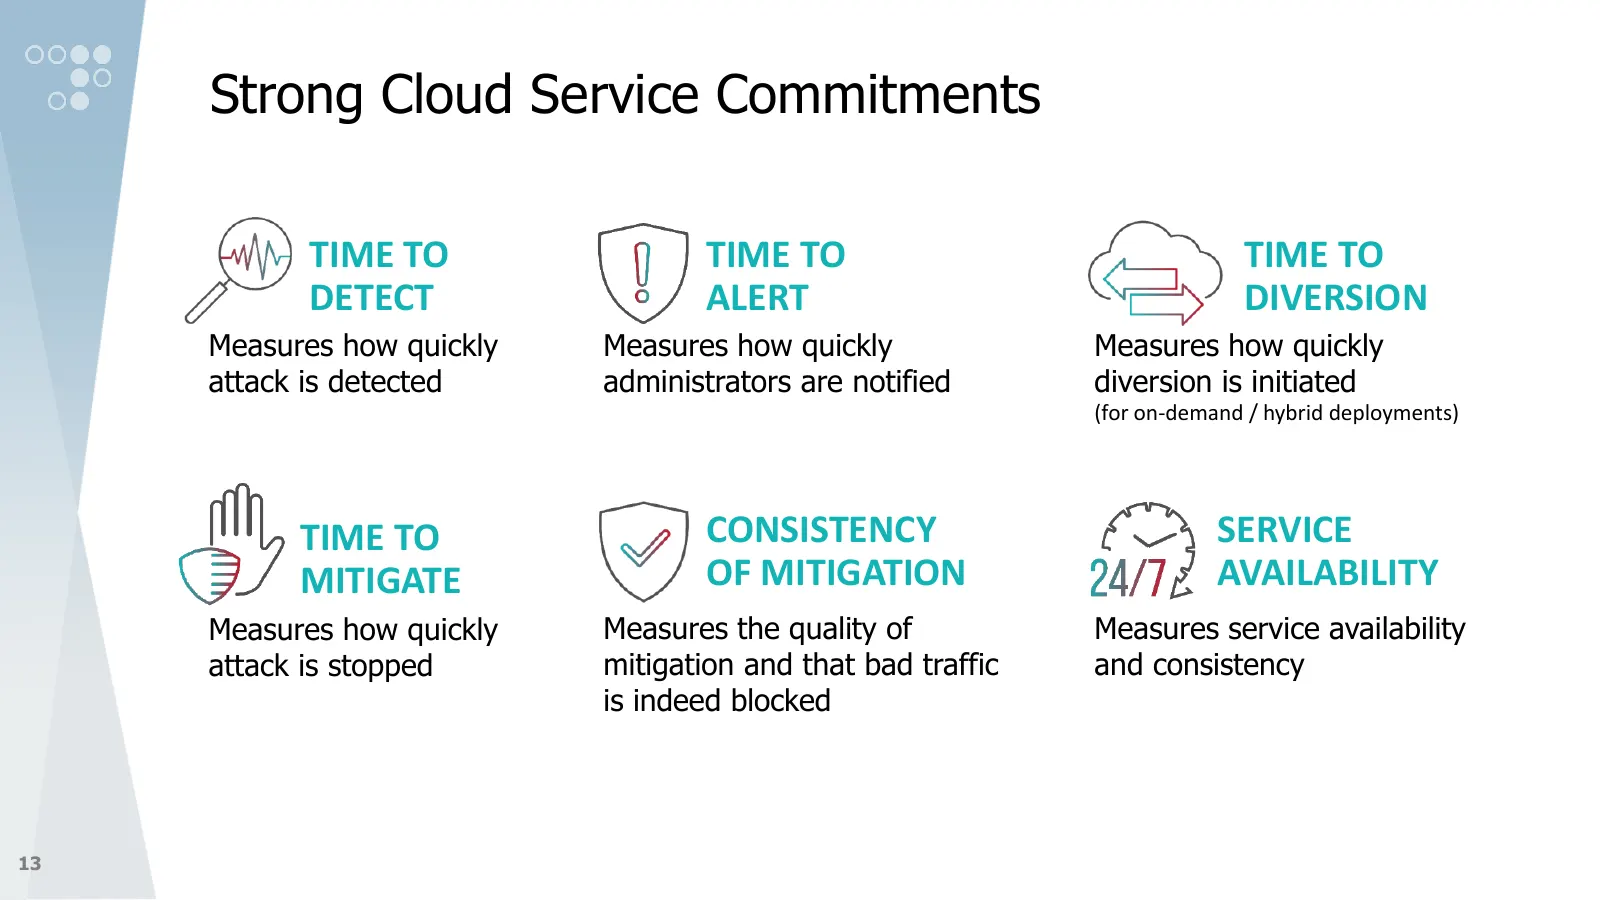
Slide 13: Strong Cloud Service Commitments
Strong Cloud Service Commitments TIME TO TIME TO TIME TO DETECT ALERT DIVERSION Measures how quickly Measures how quickly Measures how quickly attack is detected administrators are notified diversion is initiated (for on-demand / hybrid deployments) TIME TO CONSISTENCY SERVICE MITIGATE OF MITIGATION
Slide 14: Cloud and Security are the Growth Drivers
Cloud and Security are the Growth Drivers Subscriptions Cloud Security 14
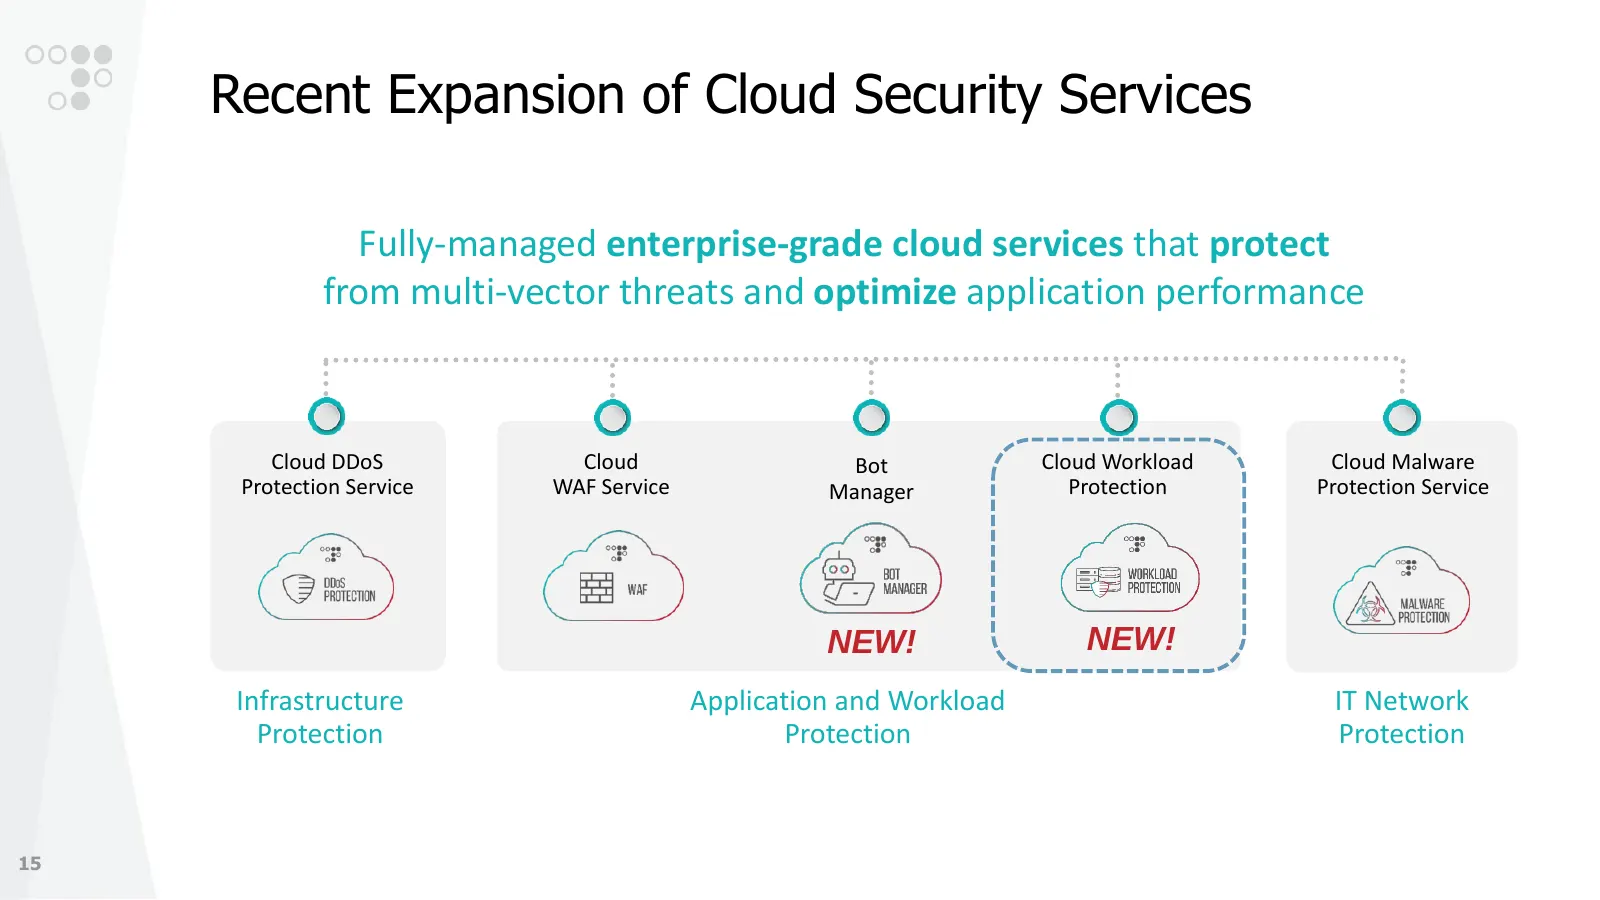
Slide 15: Recent Expansion of Cloud Security Services
Recent Expansion of Cloud Security Services Fully-managed enterprise-grade cloud services that protect from multi-vector threats and optimize application performance Cloud DDoS Cloud Bot Cloud Workload Cloud Malware Protection Service WAF Service Manager Protection Protection Service NEW! NEW! Infra
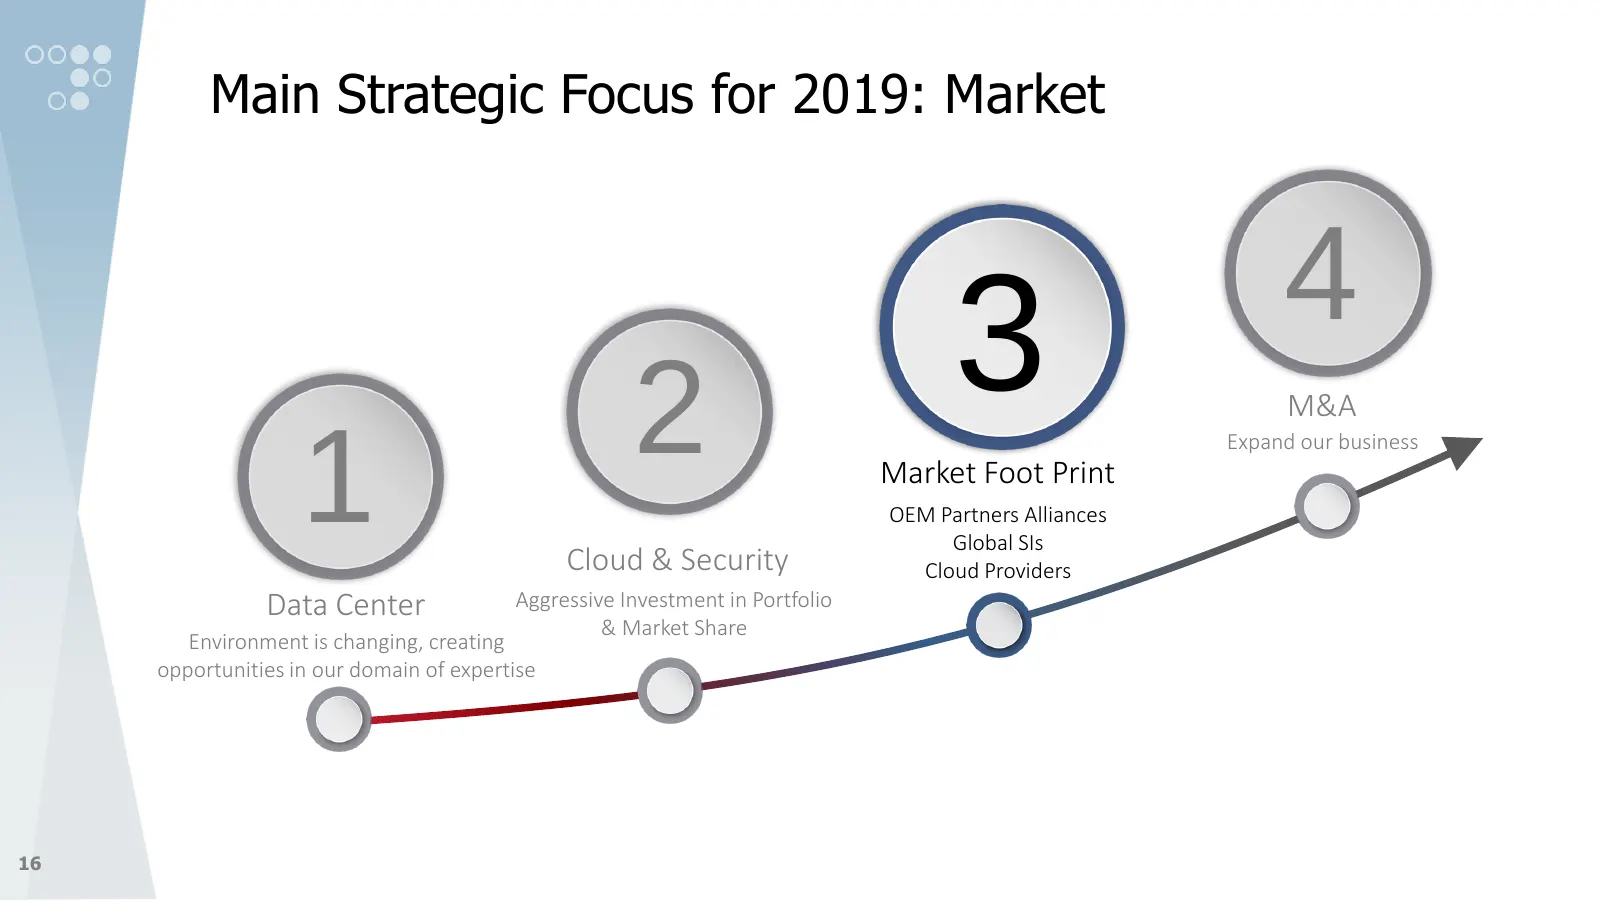
Slide 16: Main Strategic Focus for 2019: Market
Main Strategic Focus for 2019: Market 4 2 3 M&A 1 Expand our business Market Foot Print OEM Partners Alliances Global SIs Cloud & Security Cloud Providers Data Center Aggressive Investment in Portfolio & Market Share Environment is changing, creating opportunities in our domain of expertise 16
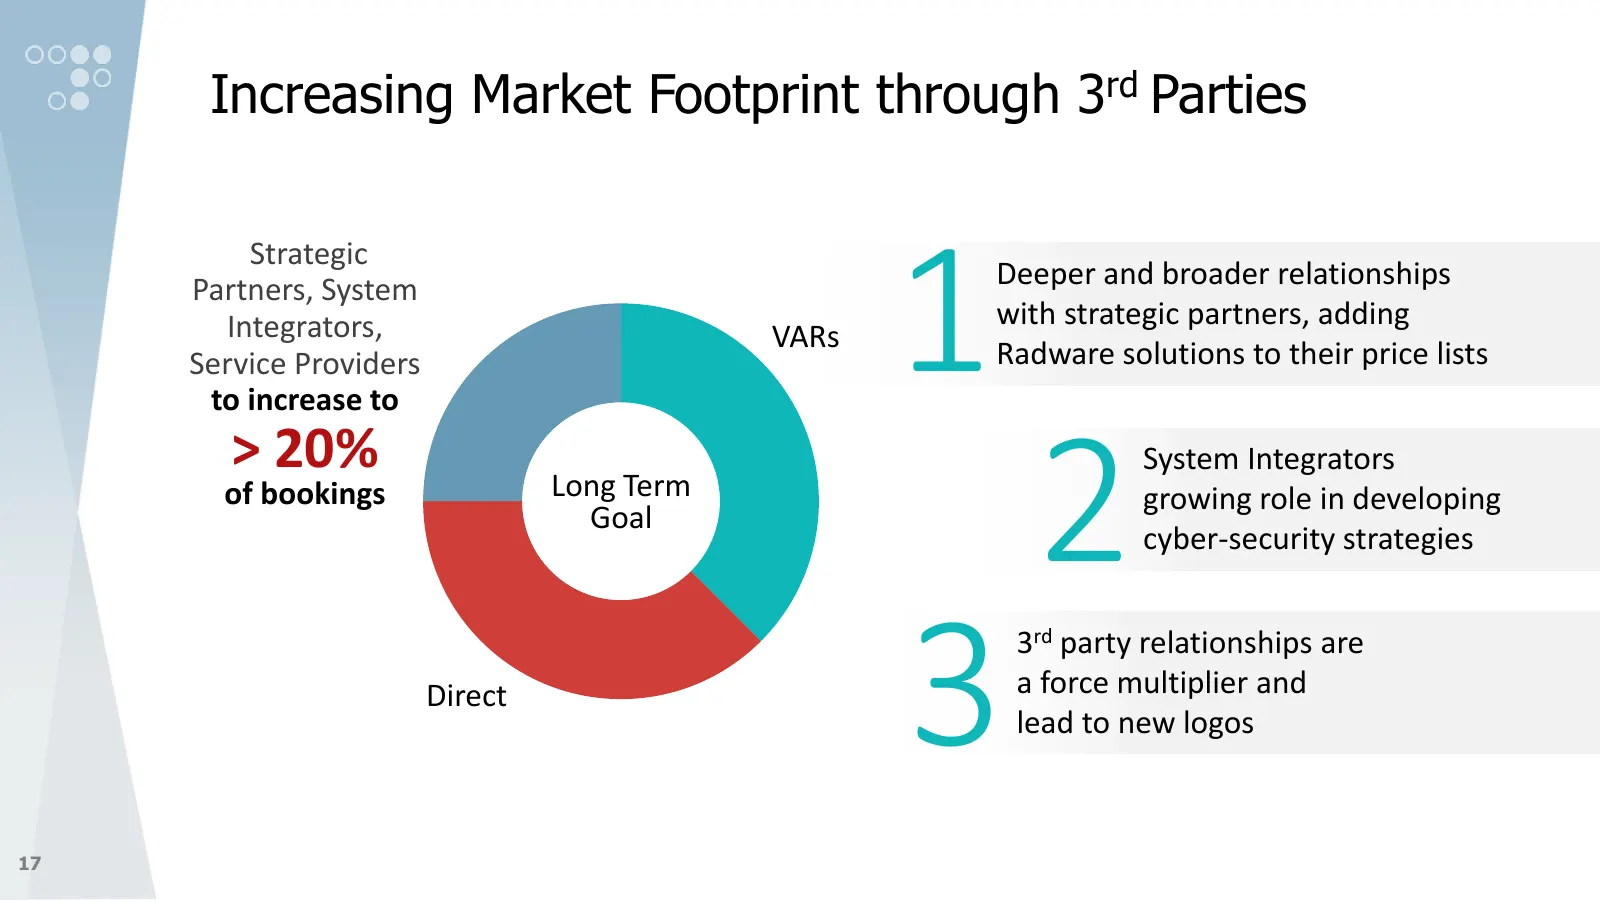
Slide 17: Increasing Market Footprint through 3rd Parties
Increasing Market Footprint through 3rd Parties 1 Strategic Partners, System Deeper and broader relationships Integrators, with strategic partners, adding VARs Service Providers Radware solutions to their price lists to increase to > 20% of bookings Long Term Goal 2 System Integrators growing role i
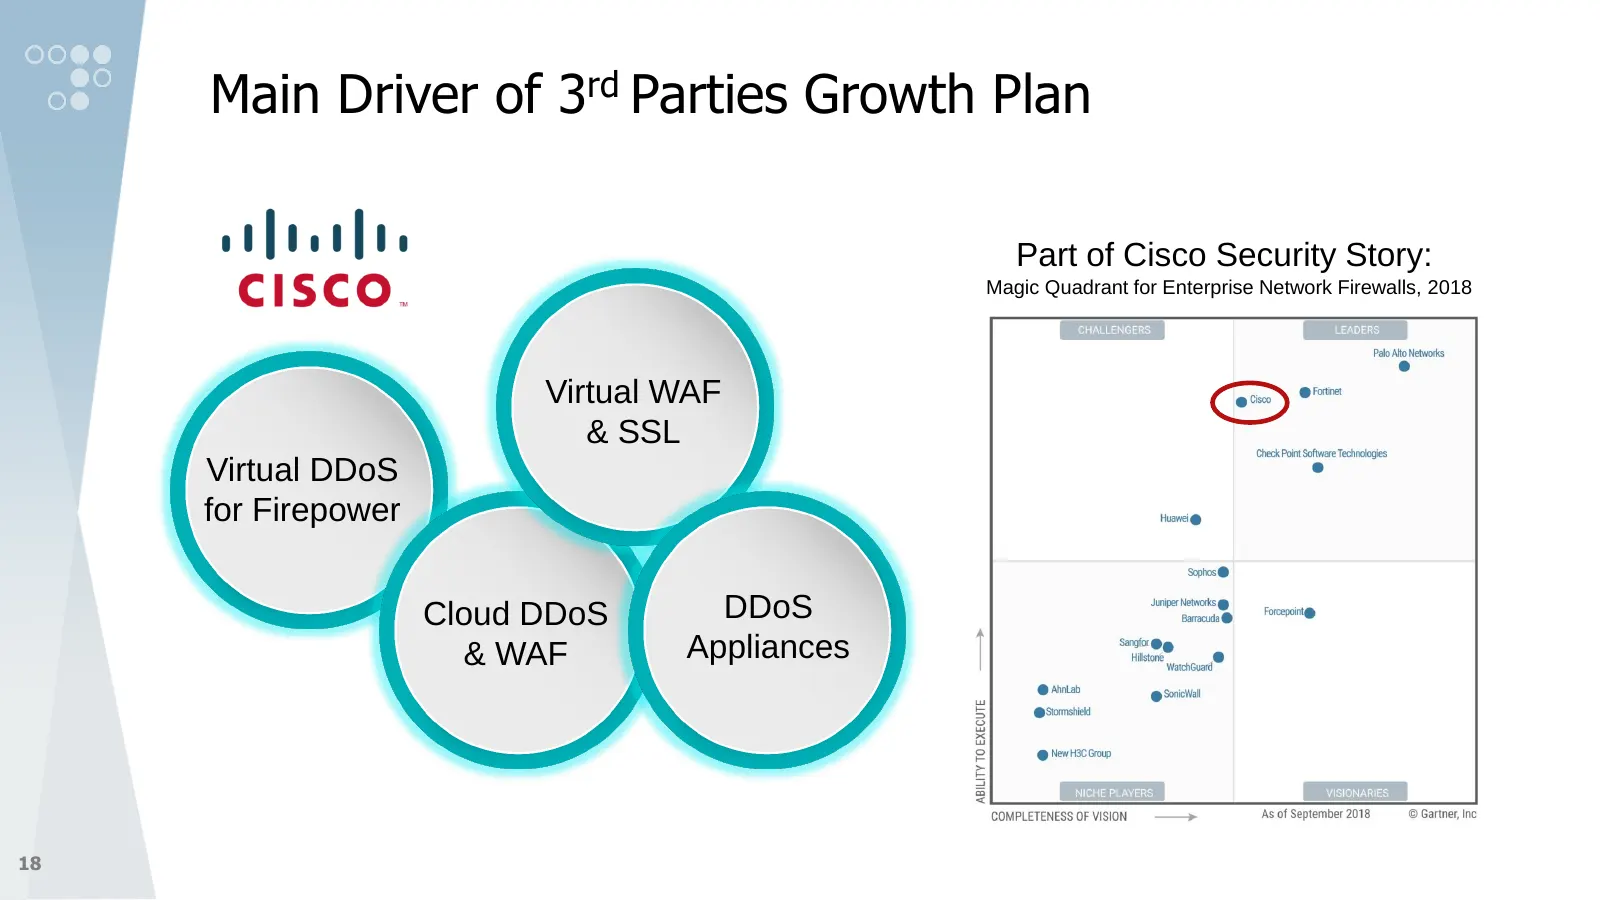
Slide 18: Main Driver of 3rd Parties Growth Plan
Main Driver of 3rd Parties Growth Plan Part of Cisco Security Story: Magic Quadrant for Enterprise Network Firewalls, 2018 Virtual WAF & SSL Virtual DDoS for Firepower Cloud DDoS DDoS & WAF Appliances 18
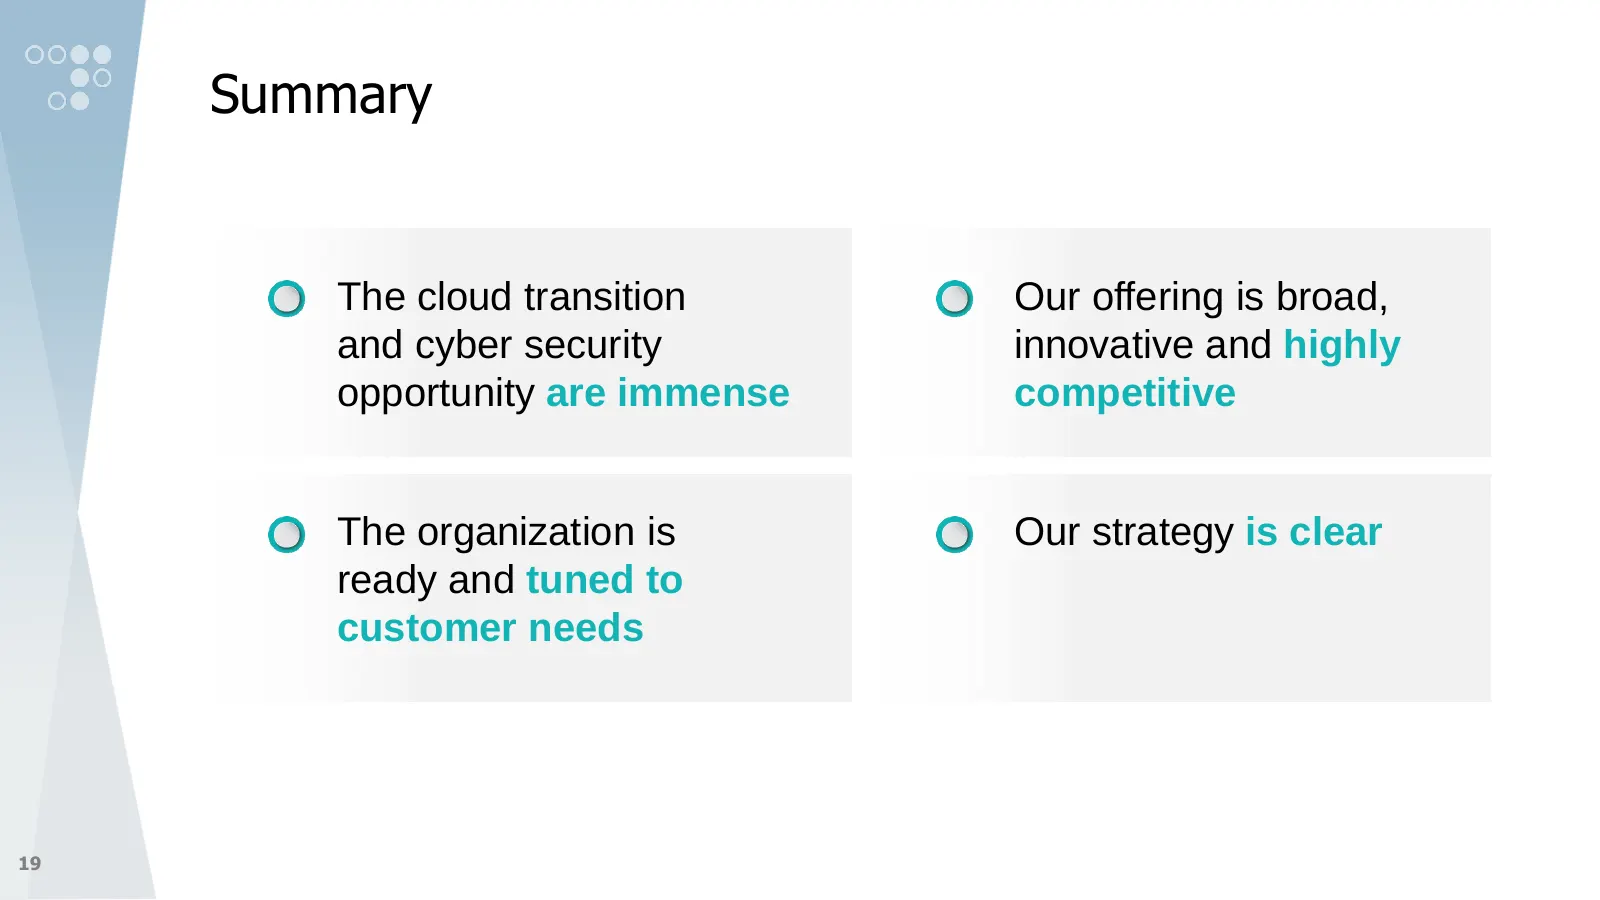
Slide 19: Summary
Summary The cloud transition Our offering is broad, and cyber security innovative and highly opportunity are immense competitive The organization is Our strategy is clear ready and tuned to customer needs 19

Slide 20: Financials
Financials Updated for Q2 2019 20 www.radware.com
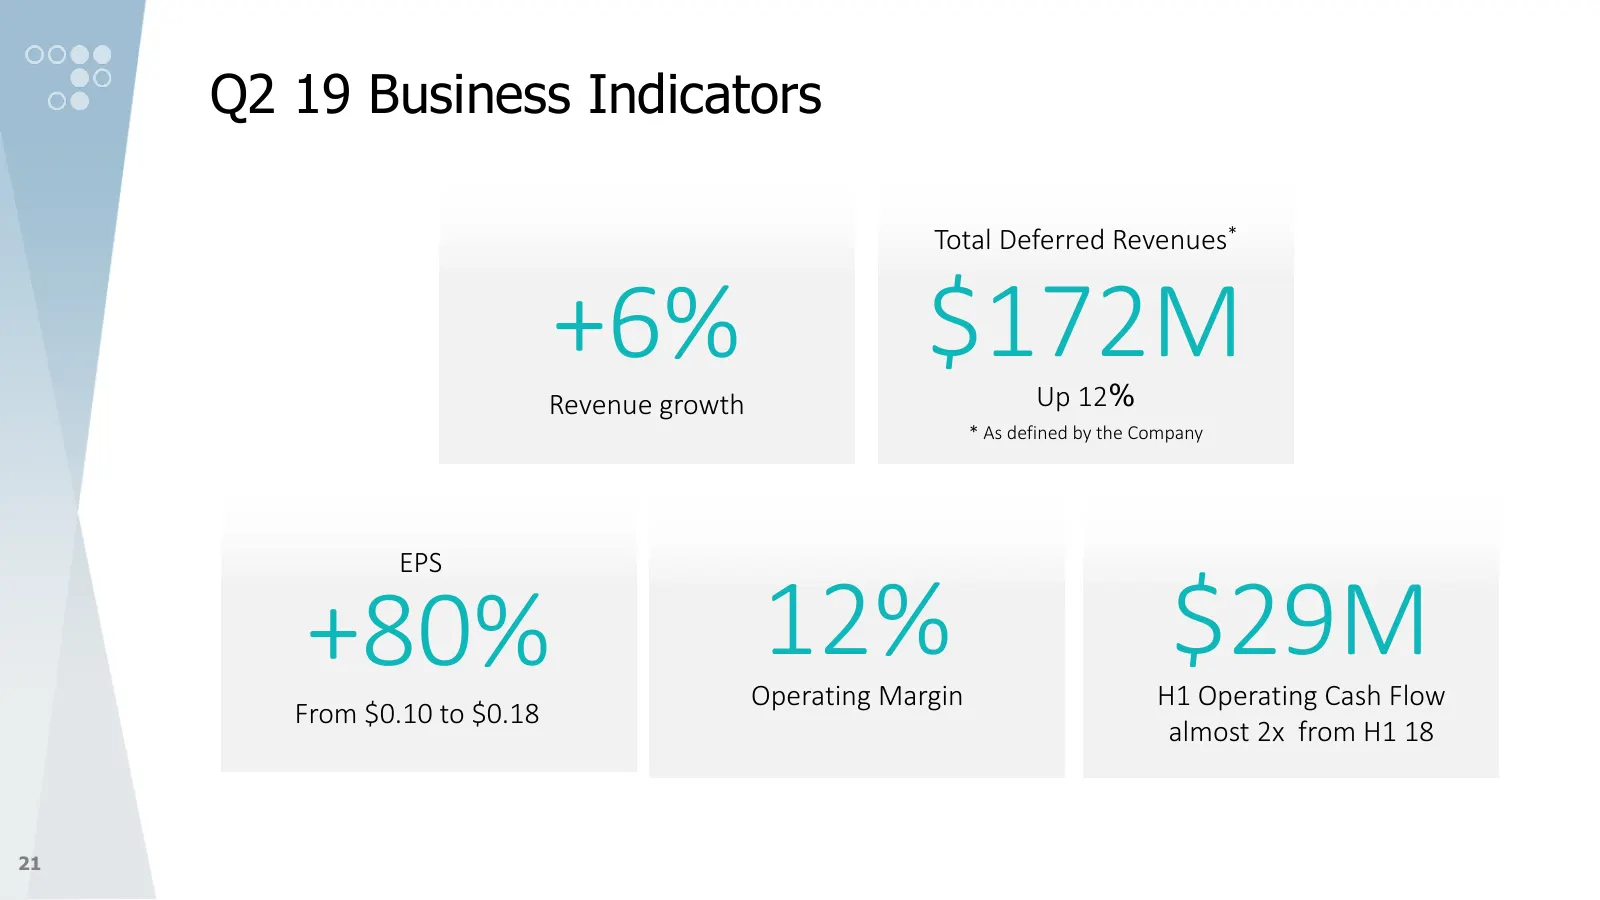
Slide 21: Q2 Business Indicators
Q2 19 Business Indicators Total Deferred Revenues* +6% $172M Up 12% Revenue growth * As defined by the Company EPS +80% 12% Operating Margin $29M H1 Operating Cash Flow From $0.10 to $0.18 almost 2x from H1 18 21
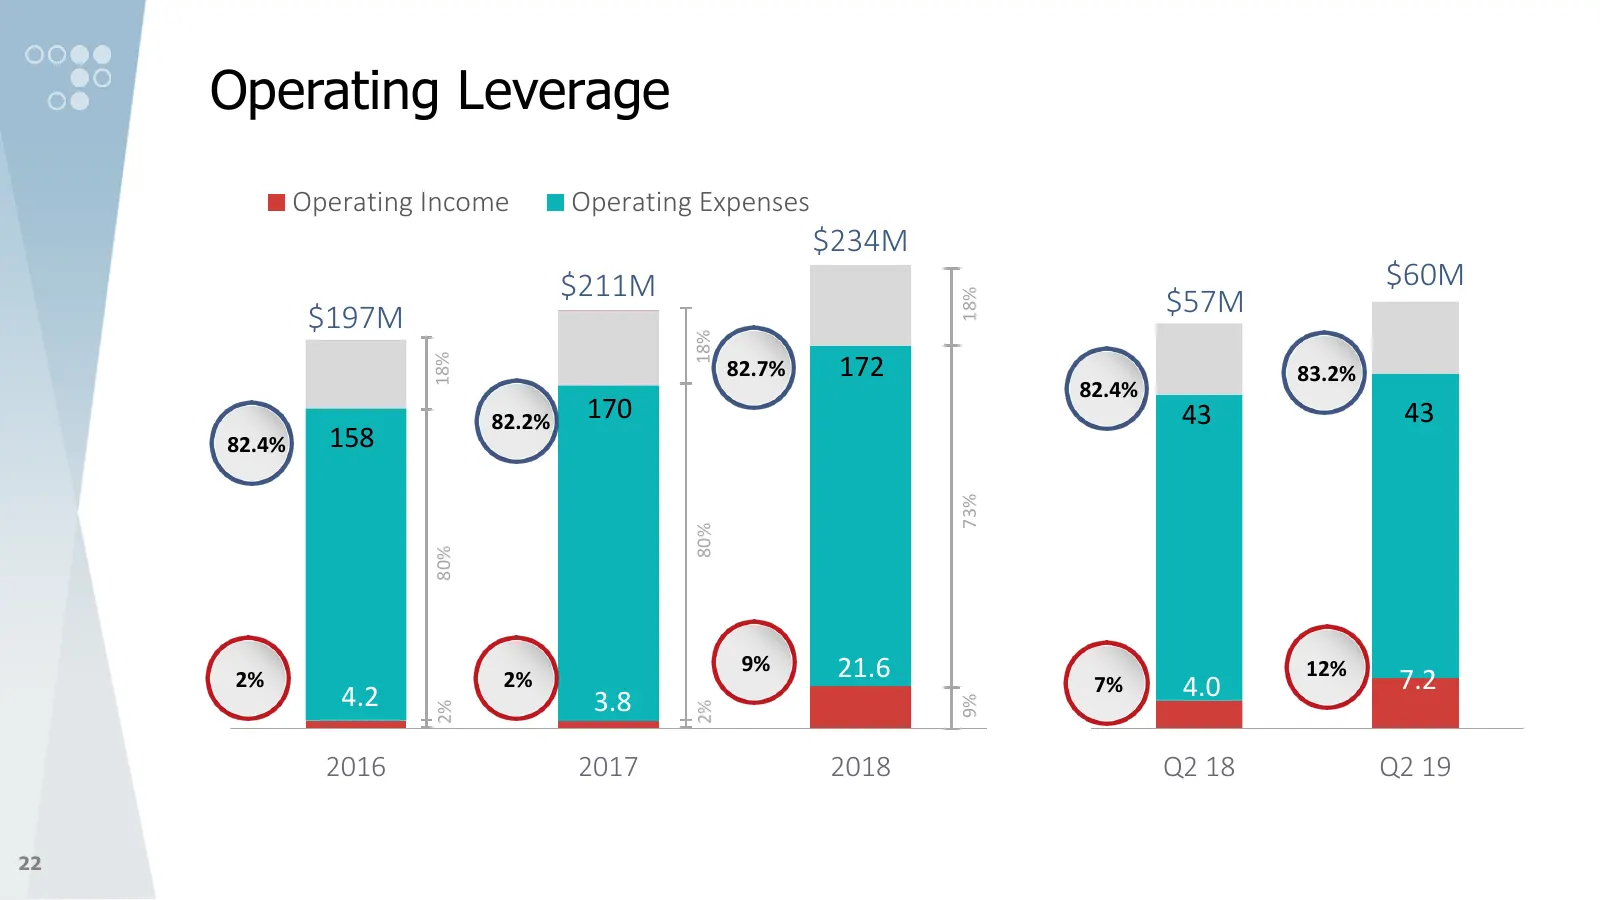
Slide 22: Operating Leverage
Operating Leverage Operating Income Operating Expenses $234M $211M $60M $57M 18% $197M 18% 18% 82.7% 172 83.2% 82.4% 82.2% 170 43 43 82.4% 158 73% 80% 80% 9% 21.6 12% 2% 2% 7% 4.0 7.2 4.2 3.8 9% 2% 2% 2016 2017 2018 Q2 18 Q2 19 22
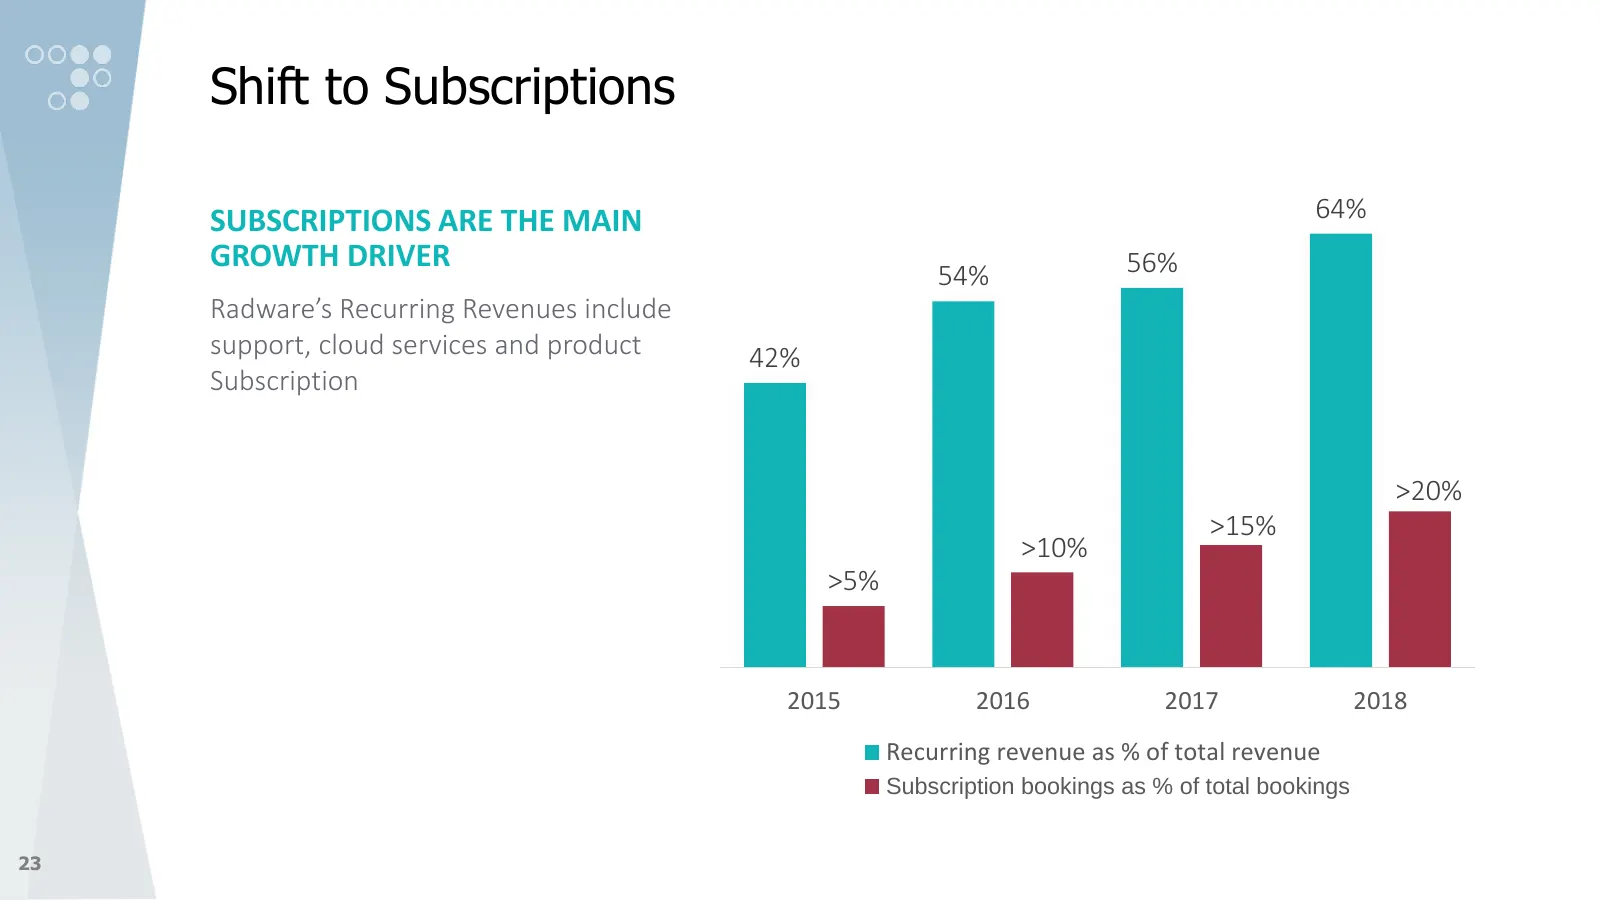
Slide 23: Shift to Subscriptions
Shift to Subscriptions SUBSCRIPTIONS ARE THE MAIN 64% GROWTH DRIVER 56% 54% Radware’s Recurring Revenues include support, cloud services and product 42% Subscription >20% >15% >10% >5% 2015 2016 2017 2018 Recurring revenue as % of total revenue Subscription bookings as % of total bookings 23
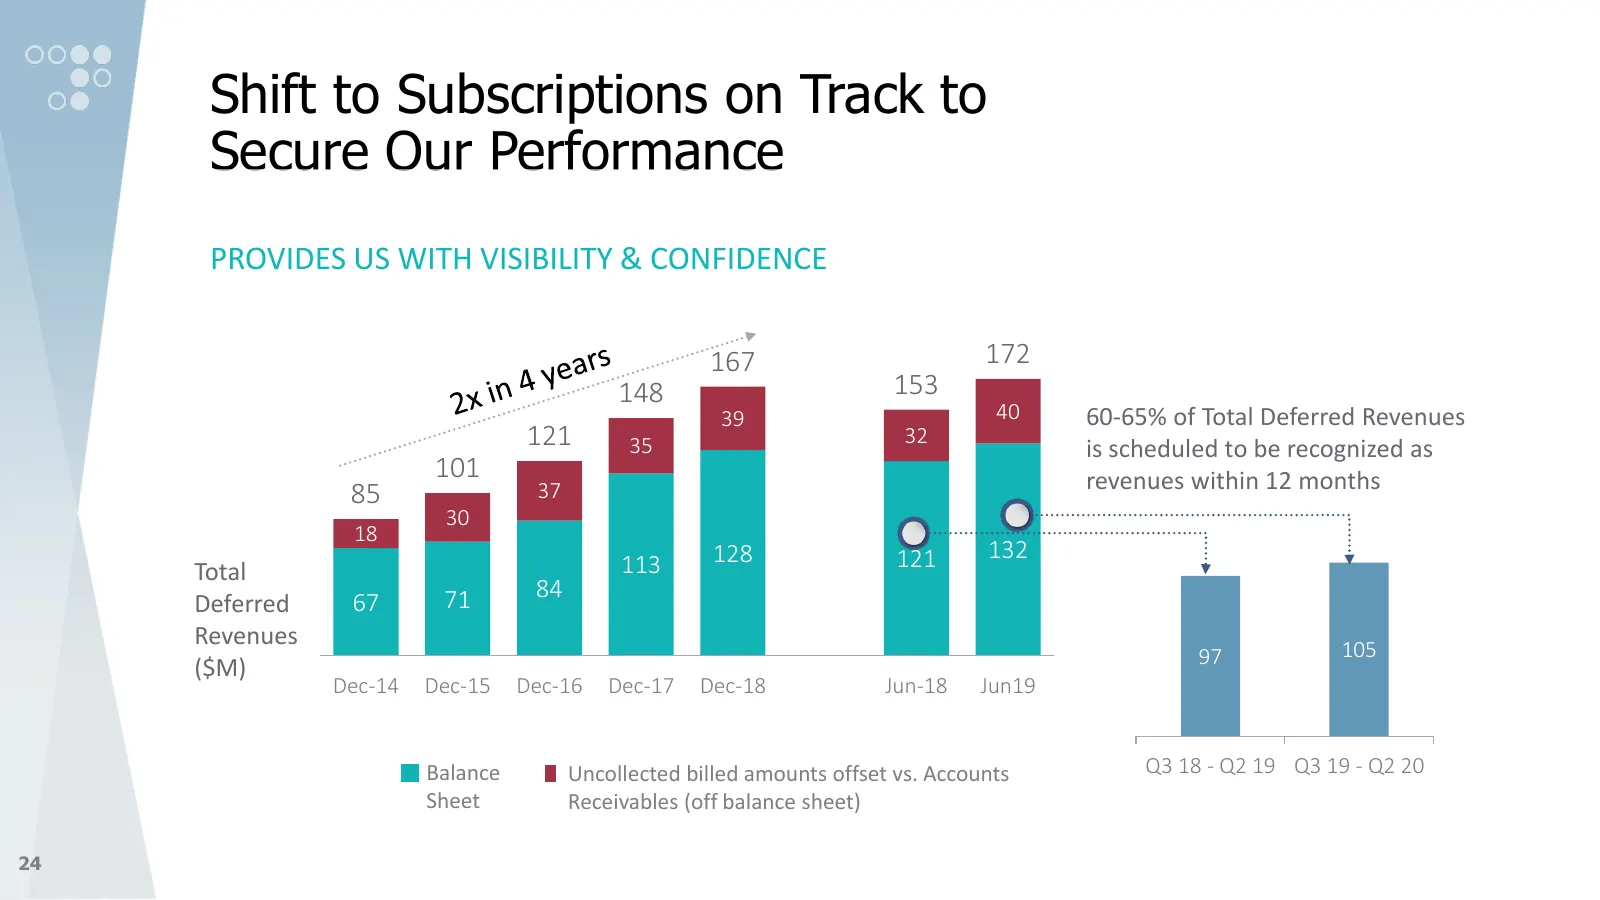
Slide 24: Shift to Subscriptions on Track to Secure Our Performance
Shift to Subscriptions on Track to Secure Our Performance PROVIDES US WITH VISIBILITY & CONFIDENCE 167 172 148 153 39 40 60-65% of Total Deferred Revenues 121 35 32 is scheduled to be recognized as 101 revenues within 12 months 85 37 30 18 128 121 132 Total 113 71 84 Deferred 67 Revenues 105 97 ($M)
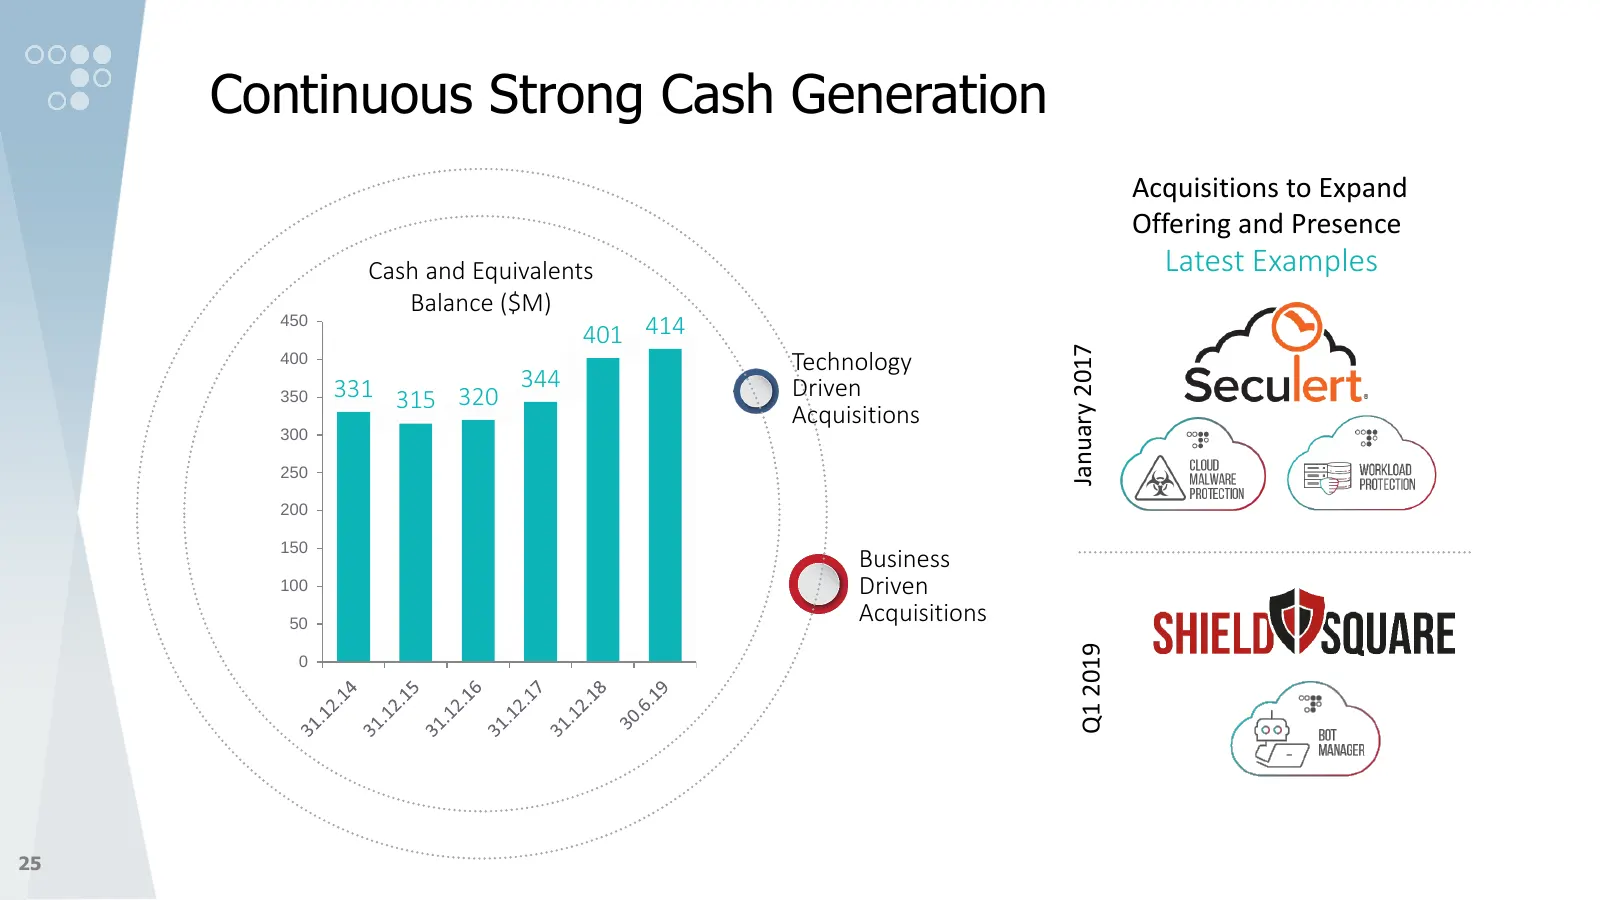
Slide 25: Continuous Strong Cash Generation
Continuous Strong Cash Generation Acquisitions to Expand Offering and Presence Cash and Equivalents Latest Examples Balance ($M) 401 414 450 January 2017 400 Technology 331 315 320 344 Driven 350 Acquisitions 300 250 200 150 Business 100 Driven 50 Acquisitions Q1 2019 0 25
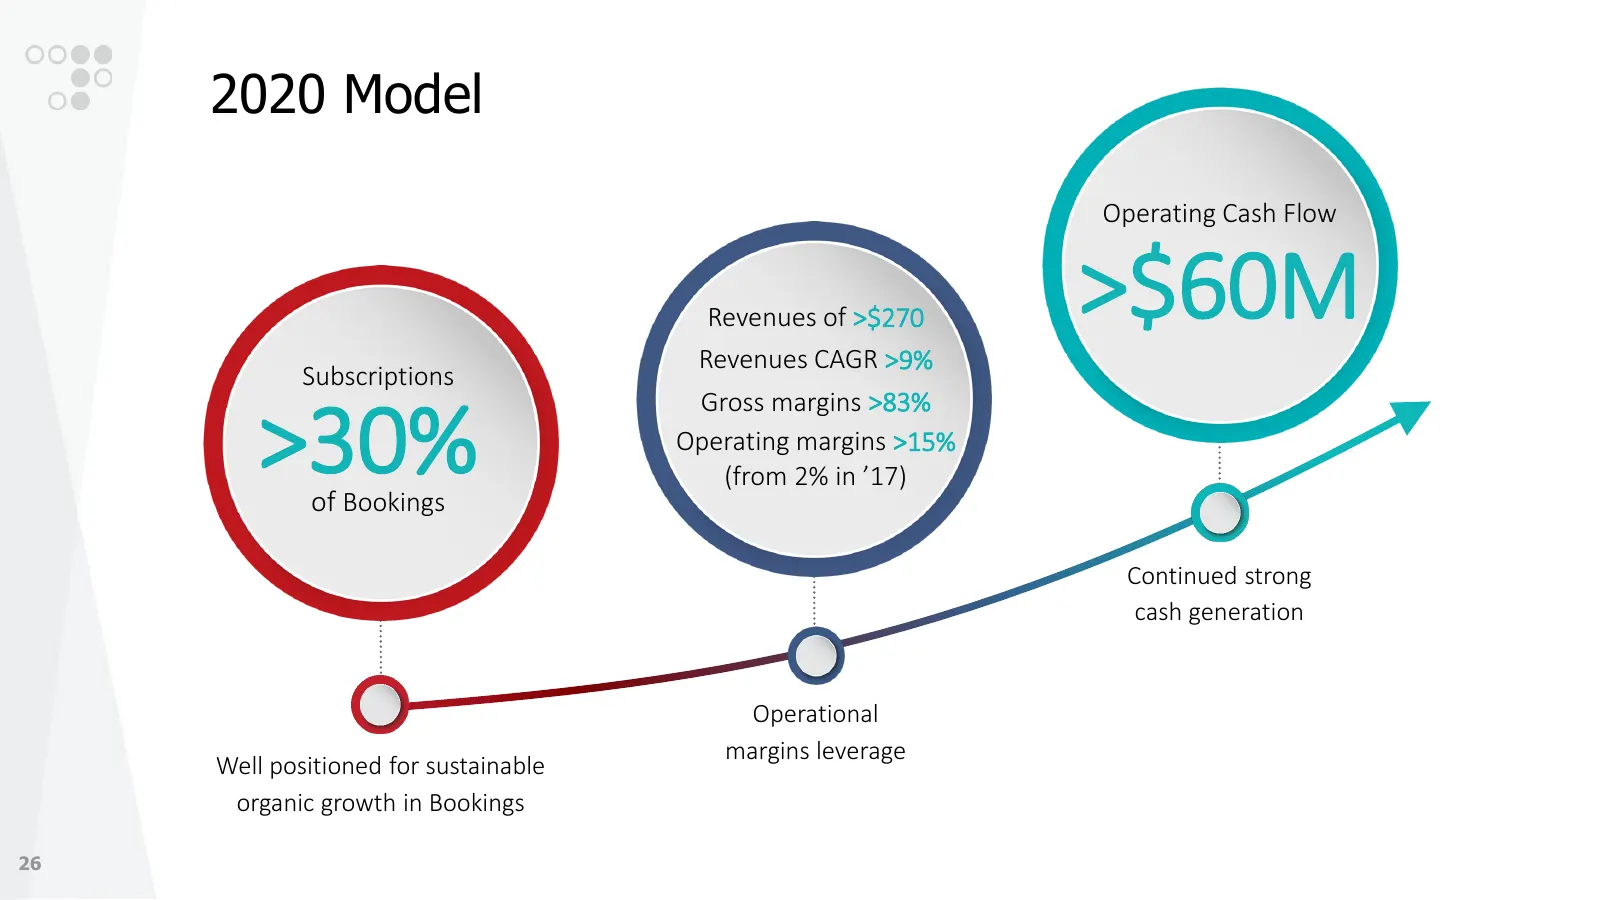
Slide 26: 2020 Model
2020 Model Operating Cash Flow Revenues of >$270 >$60M Revenues CAGR >9% Subscriptions Gross margins >83% >30% of Bookings Operating margins >15% (from 2% in ’17) Continued strong cash generation Operational margins leverage Well positioned for sustainable organic growth in Bookings 26

Slide 27: Thank You
cose os’ fradware Thank You
Source: Internet Archive copy of radware.com
More decks from Radware Ltd.
 Q1 2026 Earnings Presentation35 slides · May 7, 2026
 Q4 2025 Earnings Presentation30 slides · Feb 11, 2026
 Q3 2025 Earnings Presentation35 slides · Oct 29, 2025
 Q2 2025 Earnings Presentation35 slides · Jul 30, 2025
 Q1 2025 Earnings Presentation35 slides · May 7, 2025
 Q4 2024 Earnings Presentation37 slides · Feb 12, 2025