Great Plains Energy Incorporated
Great Plains Energy — Investor Presentation (August 2013)
43 slides from Great Plains Energy's investor presentation, Aug 13, 2013
Slide 1: Investor Presentation August 2013
Investor Presentation August 2013 Exhibit 99.1
Slide 2: Forward-Looking Statement
August 2013 Investor Presentation Forward-Looking Statement Statements made in this presentation that are not based on historical facts are forward-looking, may involve risks and uncertainties, and are intended to be as of the date when made. Forward-looking statements include, but are not limited t
Slide 3: Company Overview
August 2013 Investor Presentation Company Overview 3
Slide 4: Solid Vertically Integrated Midwest Utilities
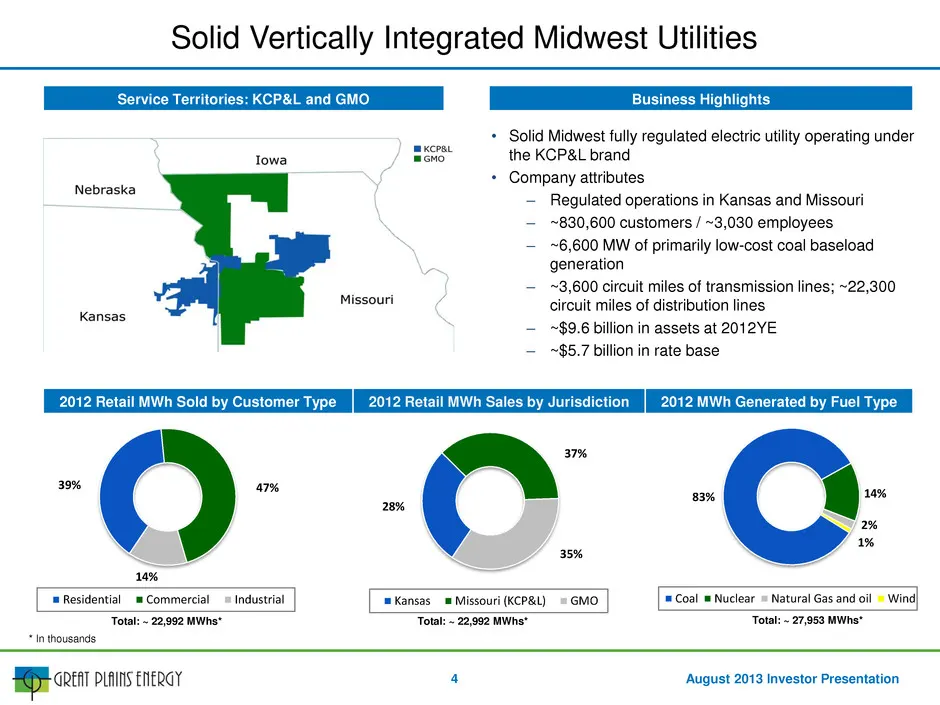
August 2013 Investor Presentation 83% 14% 2% 1% Coal Nuclear Natural Gas and oil Wind 39% 47% 14% Residential Commercial Industrial 28% 37% 35% Kansas Missouri (KCP&L) GMO • Solid Midwest fully regulated electric utility operating under the KCP&L brand • Company attributes – Regulated operations in
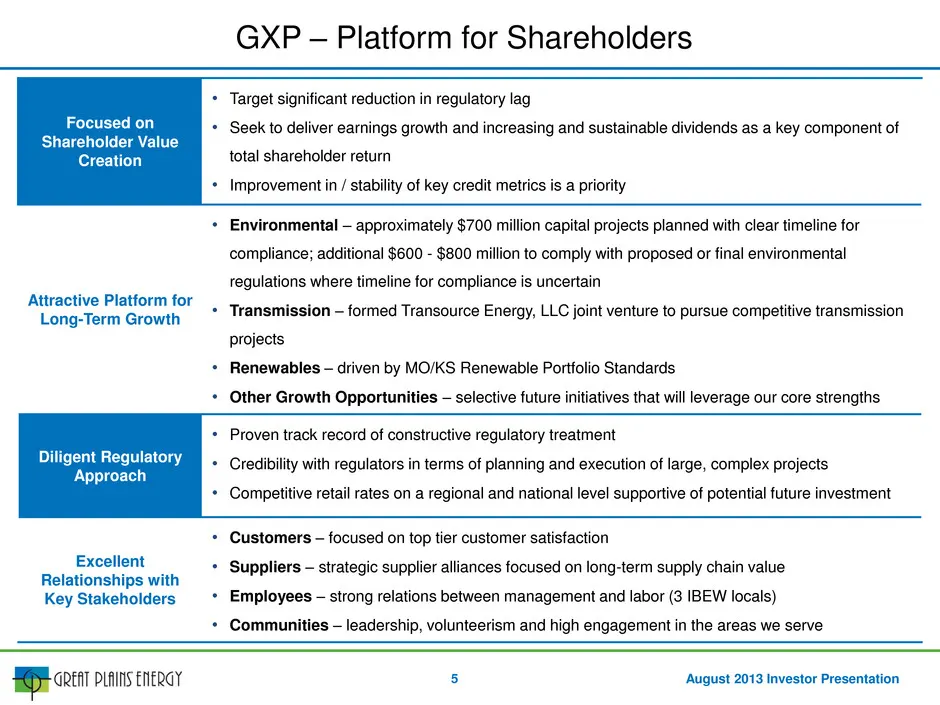
Slide 5: Shareholder Value Creation and Long-Term Growth Platform
August 2013 Investor Presentation Focused on Shareholder Value Creation • Target significant reduction in regulatory lag • Seek to deliver earnings growth and increasing and sustainable dividends as a key component of total shareholder return • Improvement in / stability of key credit metrics is a p
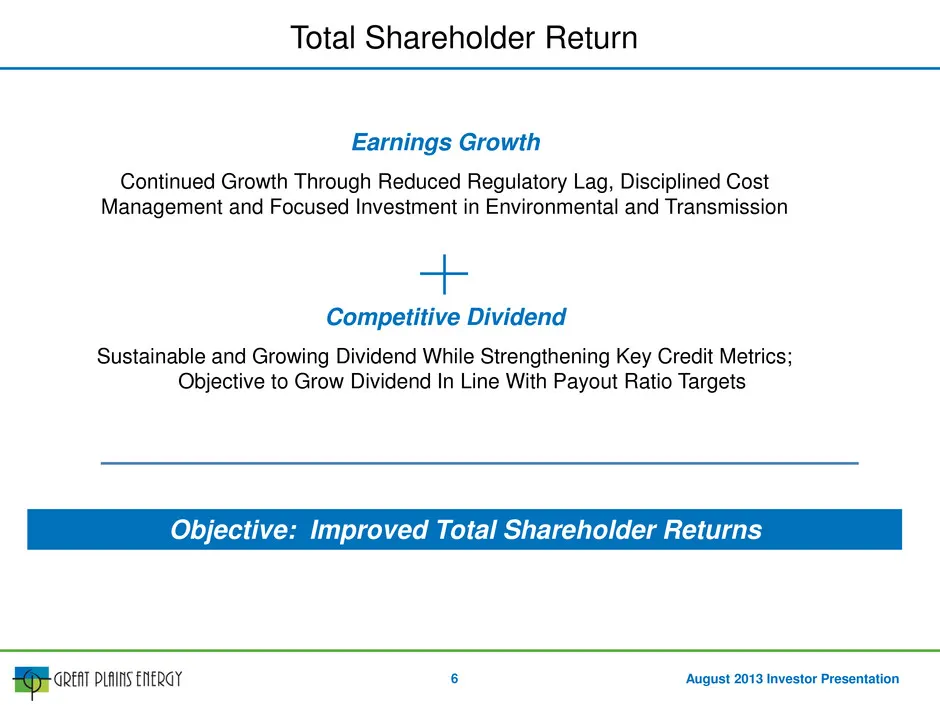
Slide 6: Earnings Growth and Competitive Dividend
August 2013 Investor Presentation Earnings Growth Continued Growth Through Reduced Regulatory Lag, Disciplined Cost Management and Focused Investment in Environmental and Transmission Competitive Dividend Sustainable and Growing Dividend While Strengthening Key Credit Metrics; Objective to Grow Divi
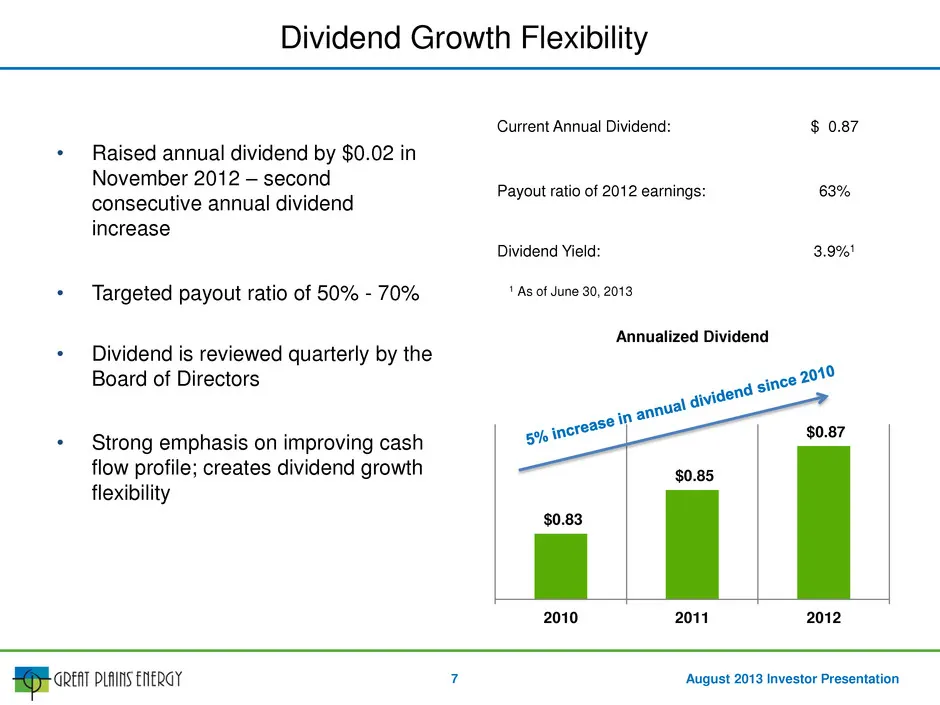
Slide 7: Dividend Growth Flexibility
August 2013 Investor Presentation $0.83 $0.85 $0.87 2010 2011 2012 Annualized Dividend • Raised annual dividend by $0.02 in November 2012 – second consecutive annual dividend increase • Targeted payout ratio of 50% - 70% • Dividend is reviewed quarterly by the Board of Directors • Strong emphasis on
Slide 8: Operations Overview
August 2013 Investor Presentation Operations Overview 8
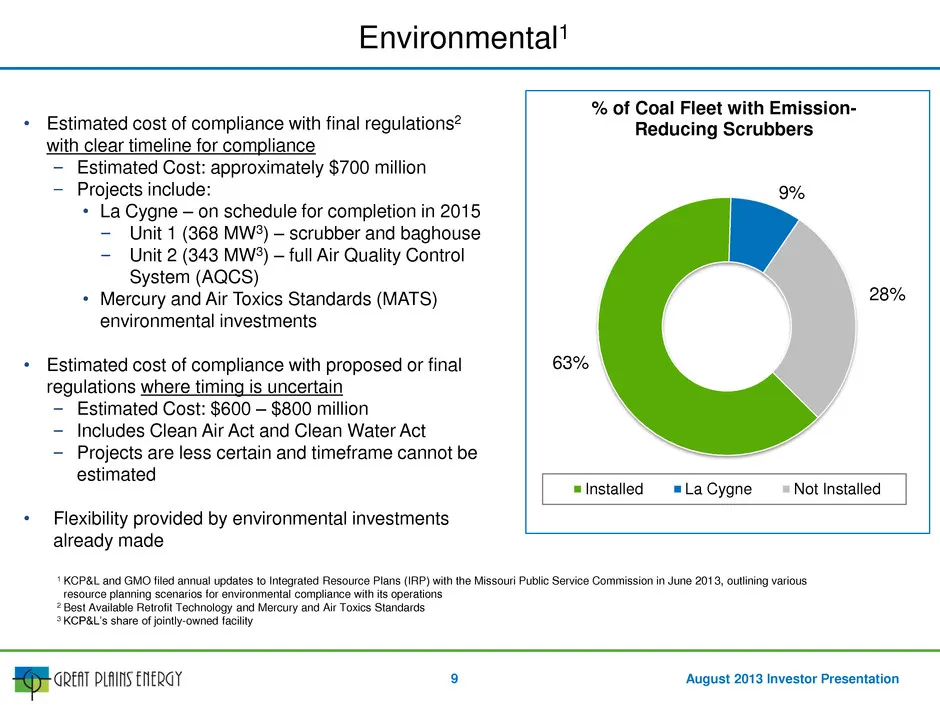
Slide 9: Environmental
August 2013 Investor Presentation Environmental1 63% 9% 28% % of Coal Fleet with Emission- Reducing Scrubbers Installed La Cygne Not Installed 9 • Estimated cost of compliance with final regulations2 with clear timeline for compliance – Estimated Cost: approximately $700 million – Projects include:
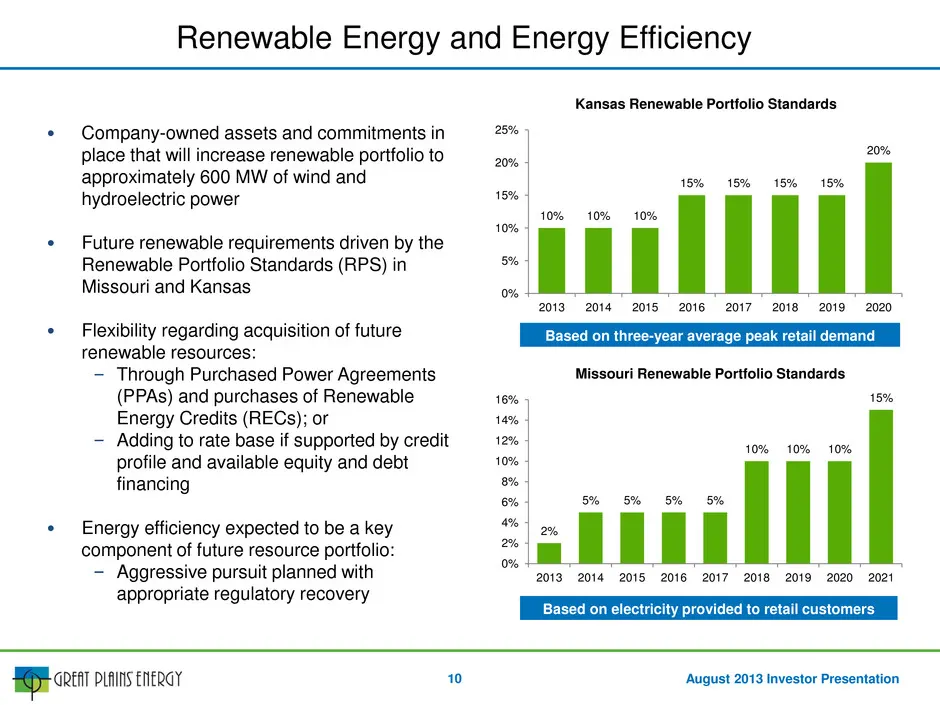
Slide 10: Renewables and Renewable Portfolio Standards
August 2013 Investor Presentation • Company-owned assets and commitments in place that will increase renewable portfolio to approximately 600 MW of wind and hydroelectric power • Future renewable requirements driven by the Renewable Portfolio Standards (RPS) in Missouri and Kansas • Flexibility rega
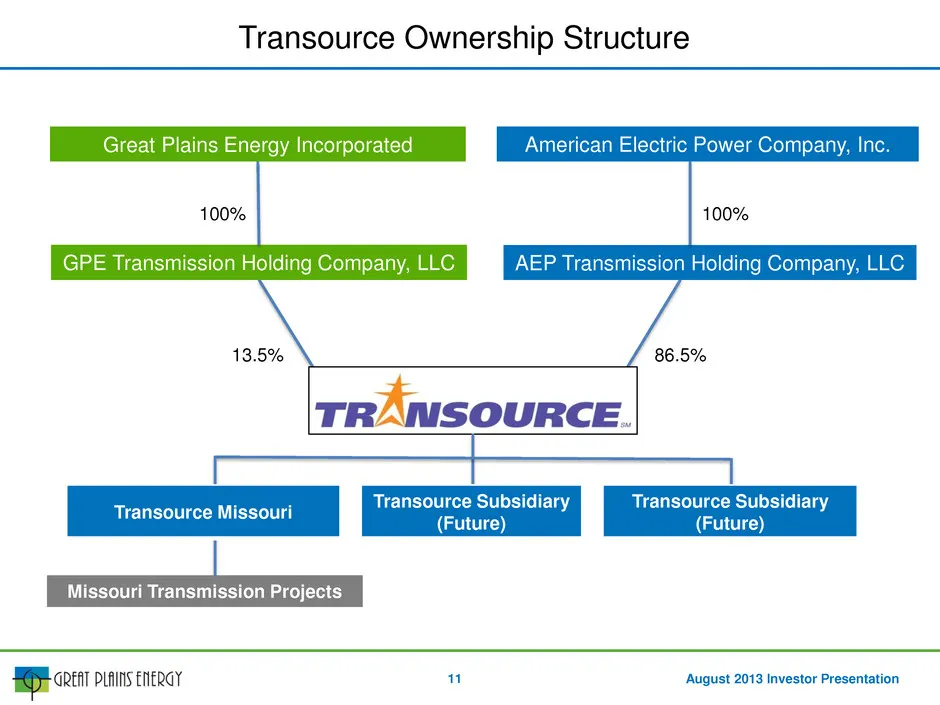
Slide 11: Transource Ownership Structure
August 2013 Investor Presentation GPE Transmission Holding Company, LLC AEP Transmission Holding Company, LLC 86.5% 13.5% Great Plains Energy Incorporated American Electric Power Company, Inc. 100% 100% Missouri Transmission Projects Transource Ownership Structure Transource Missouri Transource Subs
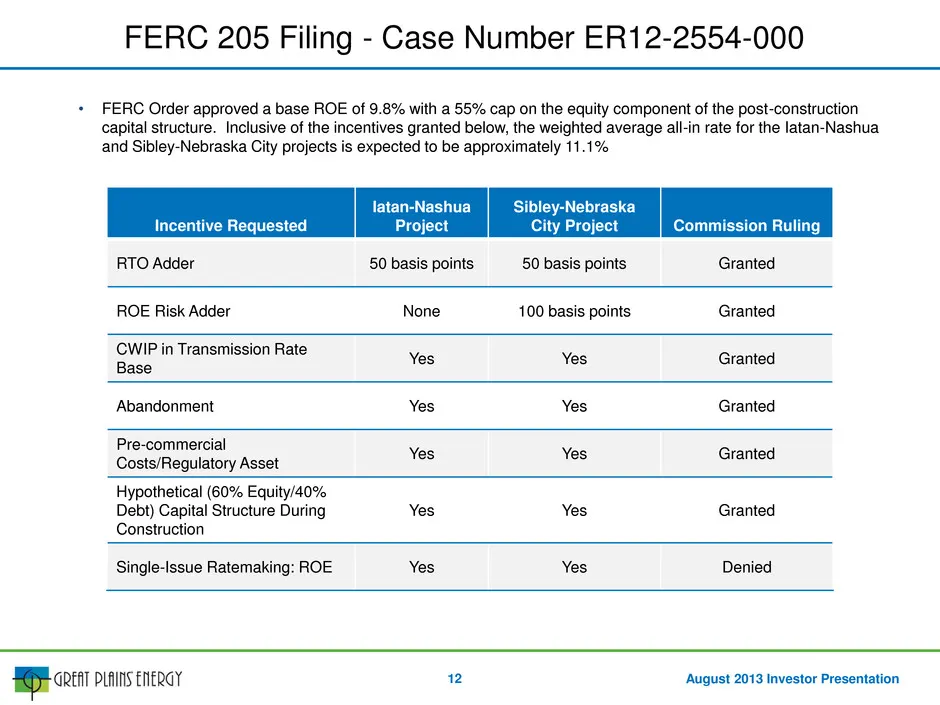
Slide 12: FERC Incentives for Missouri Transmission Projects
August 2013 Investor Presentation Incentive Requested Iatan-Nashua Project Sibley-Nebraska City Project Commission Ruling RTO Adder 50 basis points 50 basis points Granted ROE Risk Adder None 100 basis points Granted CWIP in Transmission Rate Base Yes Yes Granted Abandonment Yes Yes Granted Pre-comm
Slide 13: Plant Operations
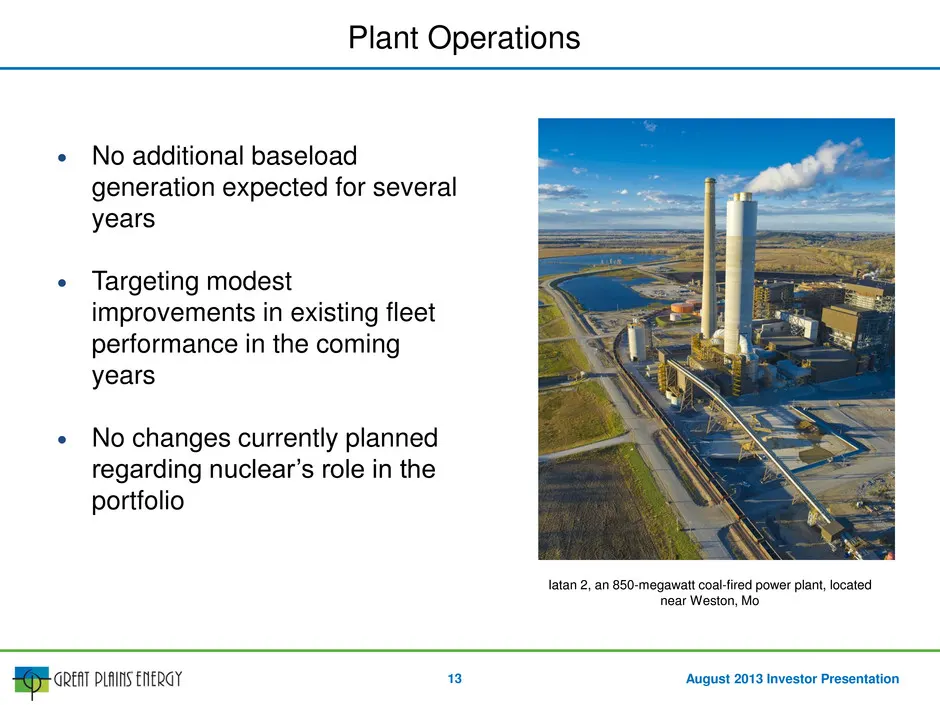
August 2013 Investor Presentation • No additional baseload generation expected for several years • Targeting modest improvements in existing fleet performance in the coming years • No changes currently planned regarding nuclear’s role in the portfolio Iatan 2, an 850-megawatt coal-fired power plant,
Slide 14: Local Economy
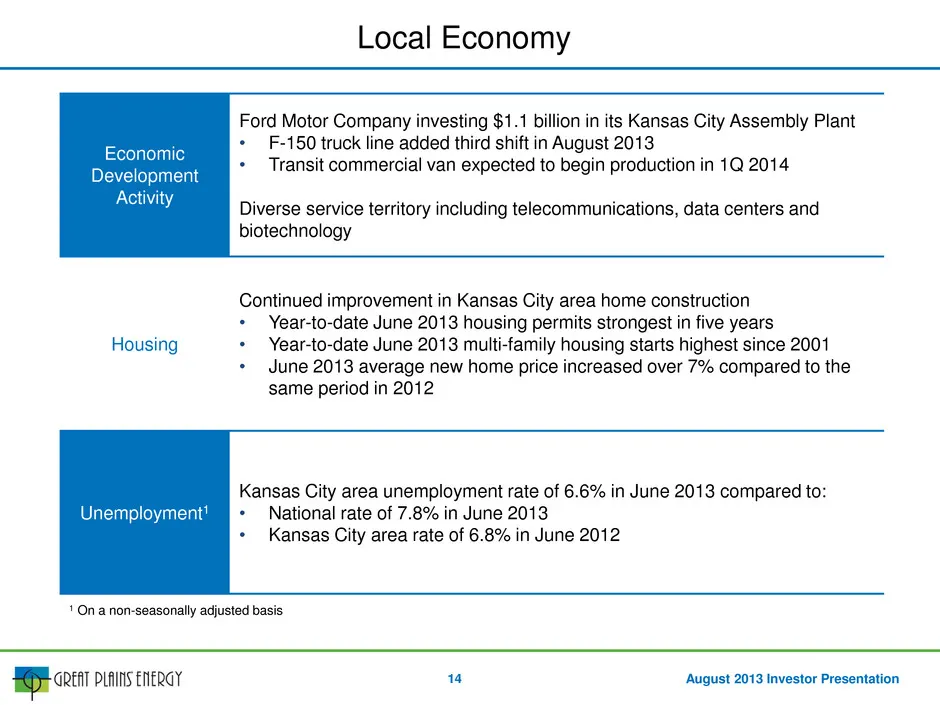
August 2013 Investor Presentation Economic Development Activity Ford Motor Company investing $1.1 billion in its Kansas City Assembly Plant • F-150 truck line added third shift in August 2013 • Transit commercial van expected to begin production in 1Q 2014 Diverse service territory including telecom
Slide 15: 2012 Rate Case Summary
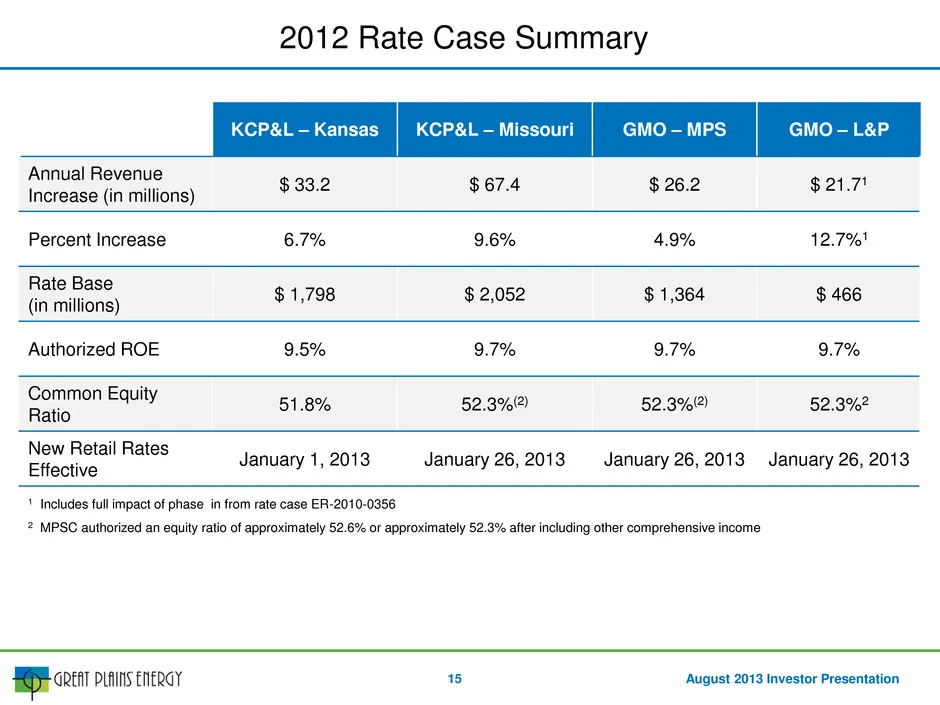
August 2013 Investor Presentation KCP&L – Kansas KCP&L – Missouri GMO – MPS GMO – L&P Annual Revenue Increase (in millions) $ 33.2 $ 67.4 $ 26.2 $ 21.71 Percent Increase 6.7% 9.6% 4.9% 12.7%1 Rate Base (in millions) $ 1,798 $ 2,052 $ 1,364 $ 466 Authorized ROE 9.5% 9.7% 9.7% 9.7% Common Equity Ratio
Slide 16: Recovery Mechanisms and Regulatory Commissions
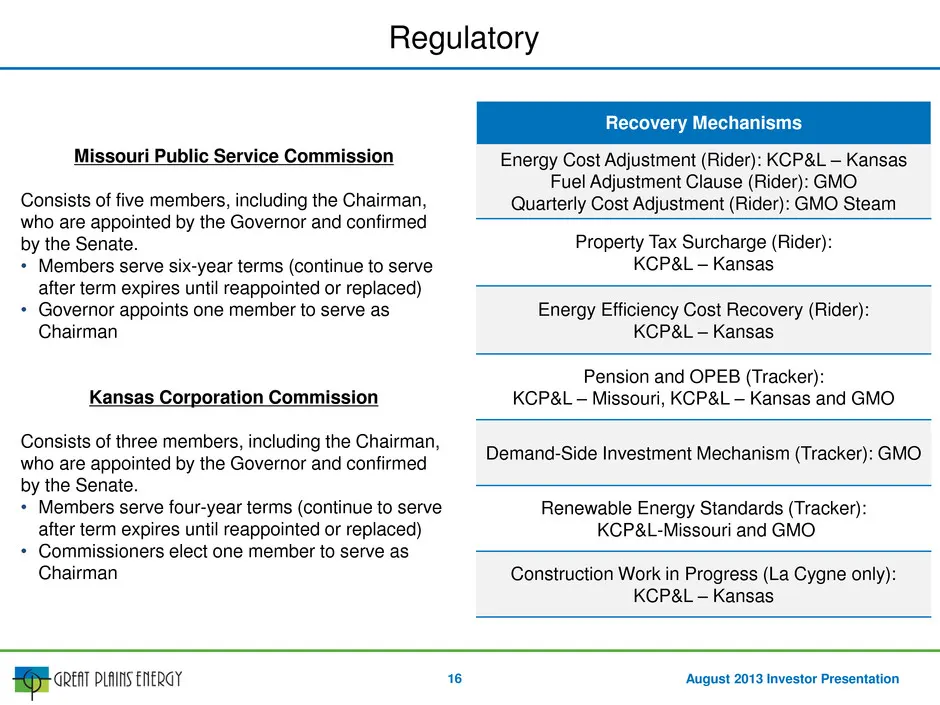
August 2013 Investor Presentation Recovery Mechanisms Energy Cost Adjustment (Rider): KCP&L – Kansas Fuel Adjustment Clause (Rider): GMO Quarterly Cost Adjustment (Rider): GMO Steam Property Tax Surcharge (Rider): KCP&L – Kansas Energy Efficiency Cost Recovery (Rider): KCP&L – Kansas Pension and OPE
Slide 17: Second Quarter and Year to Date 2013 Update
August 2013 Investor Presentation Second Quarter and Year to Date 2013 Update 17
Slide 18: Second Quarter Financial Review
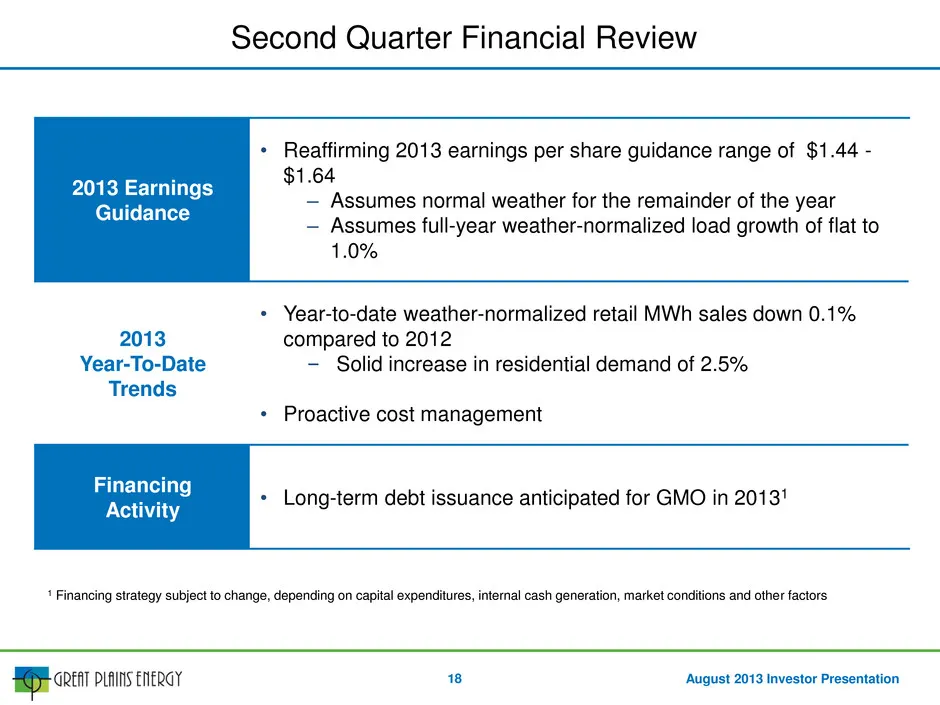
August 2013 Investor Presentation Second Quarter Financial Review 18 1 Financing strategy subject to change, depending on capital expenditures, internal cash generation, market conditions and other factors 2013 Earnings Guidance • Reaffirming 2013 earnings per share guidance range of $1.44 - $1.64 –
Slide 19: 2013 Second Quarter EPS Reconciliation Versus 2012
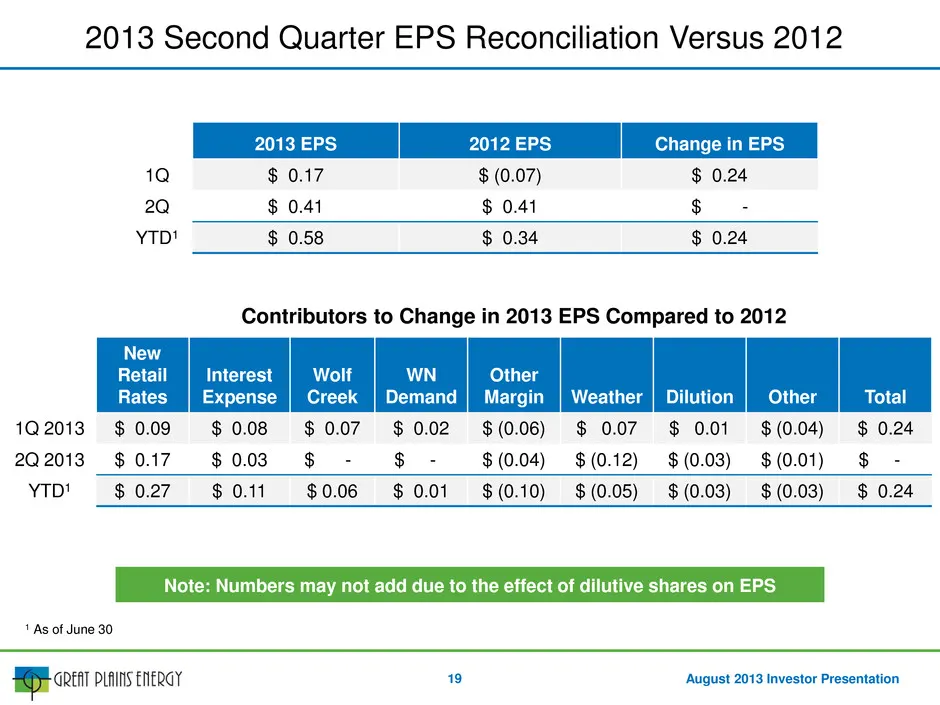
August 2013 Investor Presentation 2013 Second Quarter EPS Reconciliation Versus 2012 19 2013 EPS 2012 EPS Change in EPS 1Q $ 0.17 $ (0.07) $ 0.24 2Q $ 0.41 $ 0.41 $ - YTD1 $ 0.58 $ 0.34 $ 0.24 Contributors to Change in 2013 EPS Compared to 2012 New Retail Rates Interest Expense Wolf Creek WN Demand
Slide 20: Customer Consumption
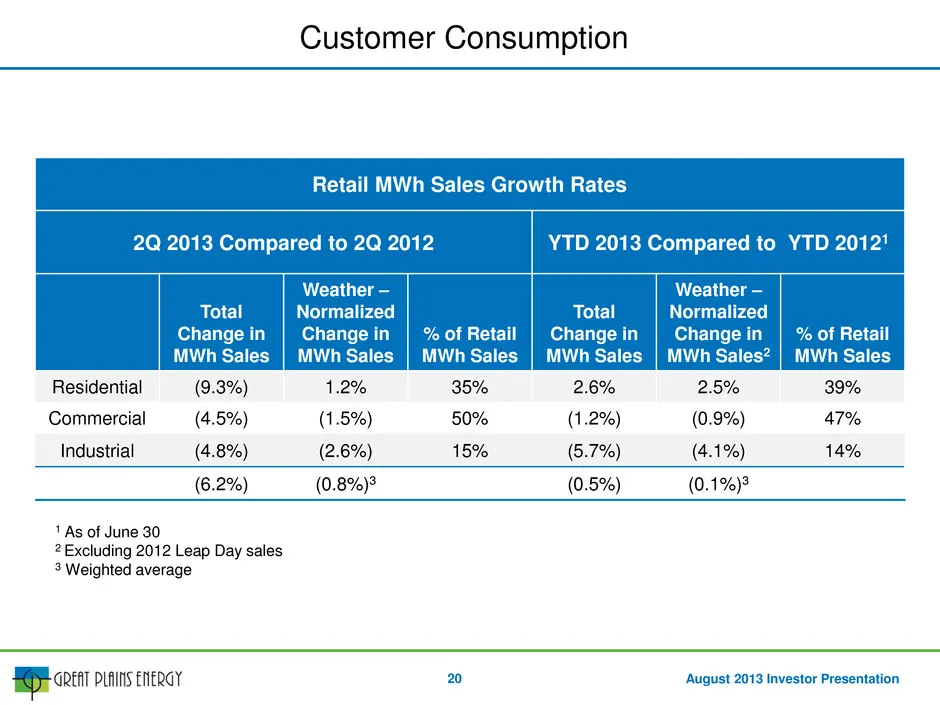
August 2013 Investor Presentation Customer Consumption 20 Retail MWh Sales Growth Rates 2Q 2013 Compared to 2Q 2012 YTD 2013 Compared to YTD 20121 Total Change in MWh Sales Weather – Normalized Change in MWh Sales % of Retail MWh Sales Total Change in MWh Sales Weather – Normalized Change in MWh Sal
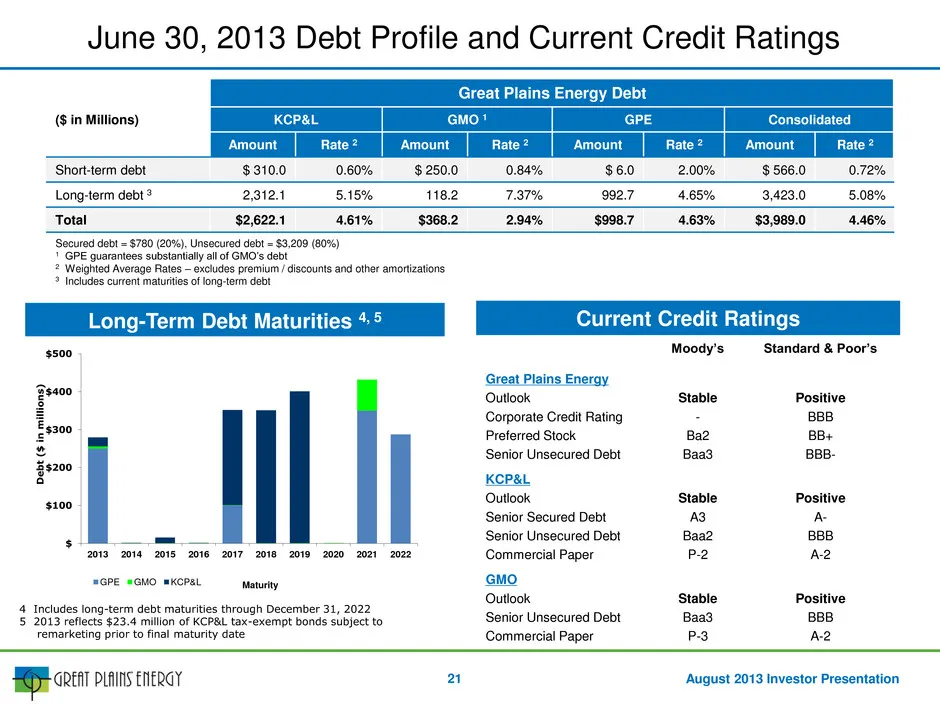
Slide 21: Debt Profile and Current Credit Ratings
August 2013 Investor Presentation Long-Term Debt Maturities 4, 5 Current Credit Ratings Moody’s Standard & Poor’s Great Plains Energy Outlook Corporate Credit Rating Preferred Stock Senior Unsecured Debt Stable - Ba2 Baa3 Positive BBB BB+ BBB- KCP&L Outlook Senior Secured Debt Senior Unsecured Debt
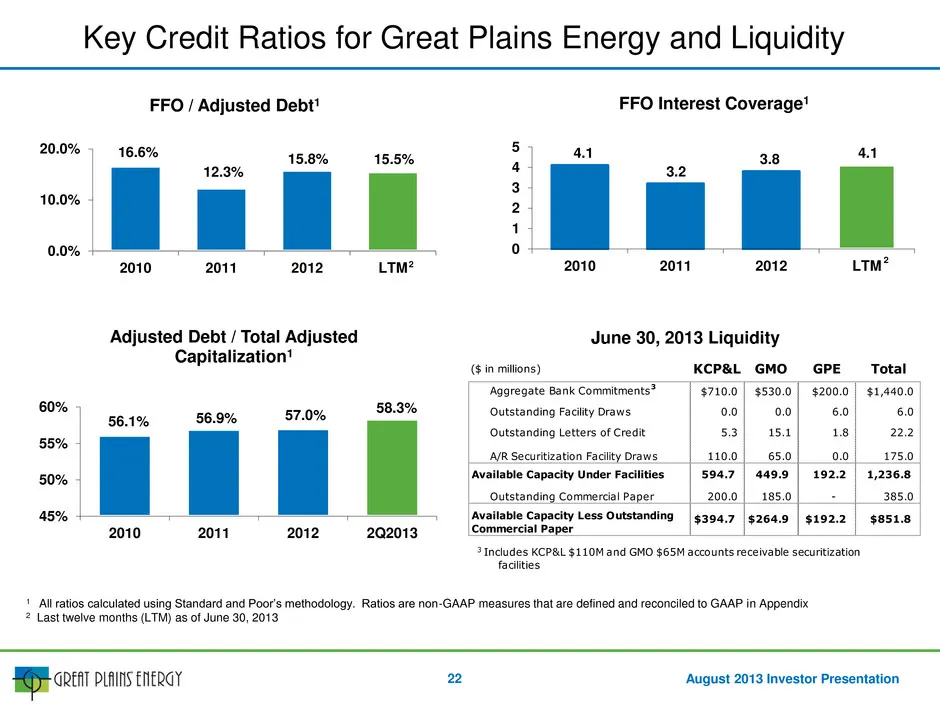
Slide 22: Liquidity and Key Credit Ratios
August 2013 Investor Presentation June 30, 2013 Liquidity Key Credit Ratios for Great Plains Energy and Liquidity 22 56.1% 56.9% 57.0% 58.3% 45% 50% 55% 60% 2010 2011 2012 2Q2013 Adjusted Debt / Total Adjusted Capitalization1 ($ in millions) KCP&L GMO GPE Total Aggregate Bank Commitments3 $710.0 $53
Slide 23: 2013 Earnings Guidance and Projected Drivers
August 2013 Investor Presentation 2013 Earnings Guidance and Projected Drivers 23
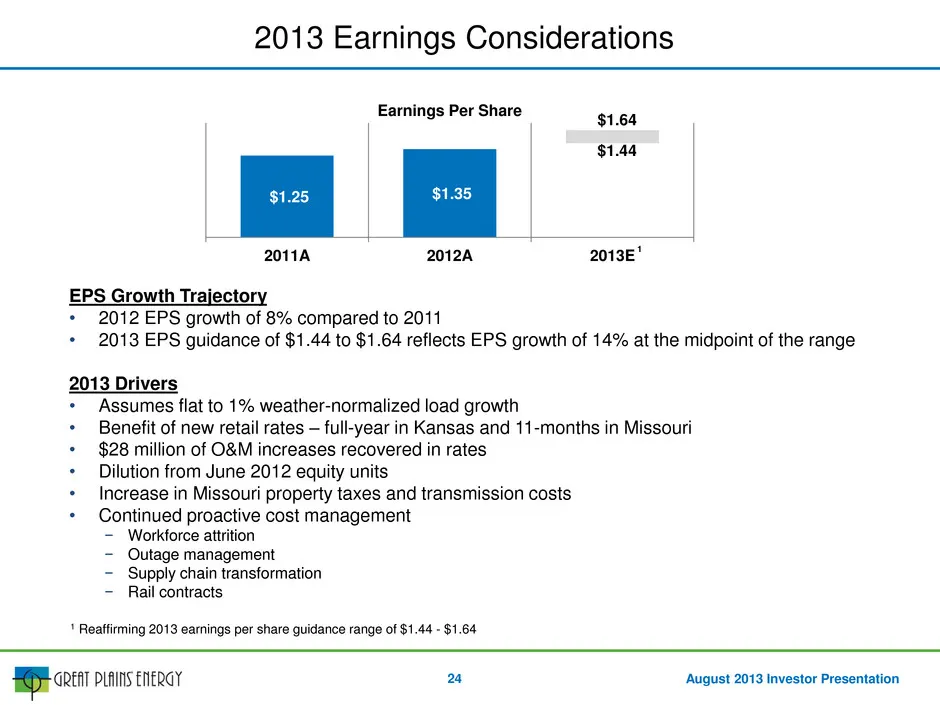
Slide 24: 2013 Earnings Considerations
August 2013 Investor Presentation EPS Growth Trajectory • 2012 EPS growth of 8% compared to 2011 • 2013 EPS guidance of $1.44 to $1.64 reflects EPS growth of 14% at the midpoint of the range 2013 Drivers • Assumes flat to 1% weather-normalized load growth • Benefit of new retail rates – full-year in
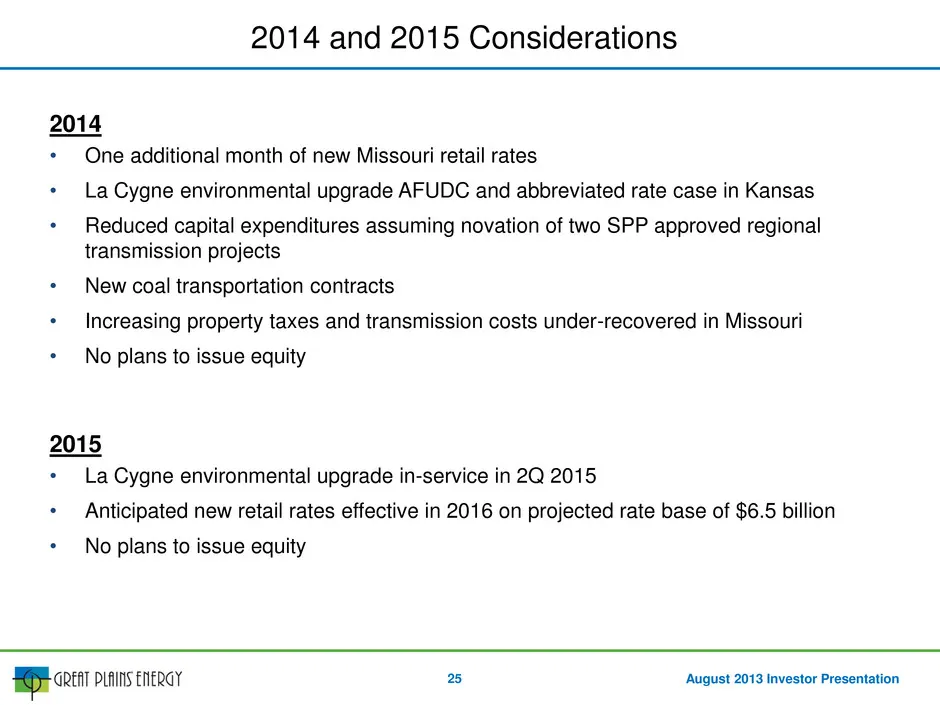
Slide 25: 2014 and 2015 Considerations
August 2013 Investor Presentation 2014 • One additional month of new Missouri retail rates • La Cygne environmental upgrade AFUDC and abbreviated rate case in Kansas • Reduced capital expenditures assuming novation of two SPP approved regional transmission projects • New coal transportation contract
Slide 26: Investor Relations Information
August 2013 Investor Presentation • NYSE: GXP • www.greatplainsenergy.com • Company Contacts Kevin Bryant VP, Investor Relations and Strategic Planning and Treasurer Great Plains Energy (816) 556-2782 kevin.bryant@kcpl.com Tony Carreño Director, Investor Relations Great Plains Energy (816) 654-1763
Slide 27: Appendix
August 2013 Investor Presentation Appendix 27
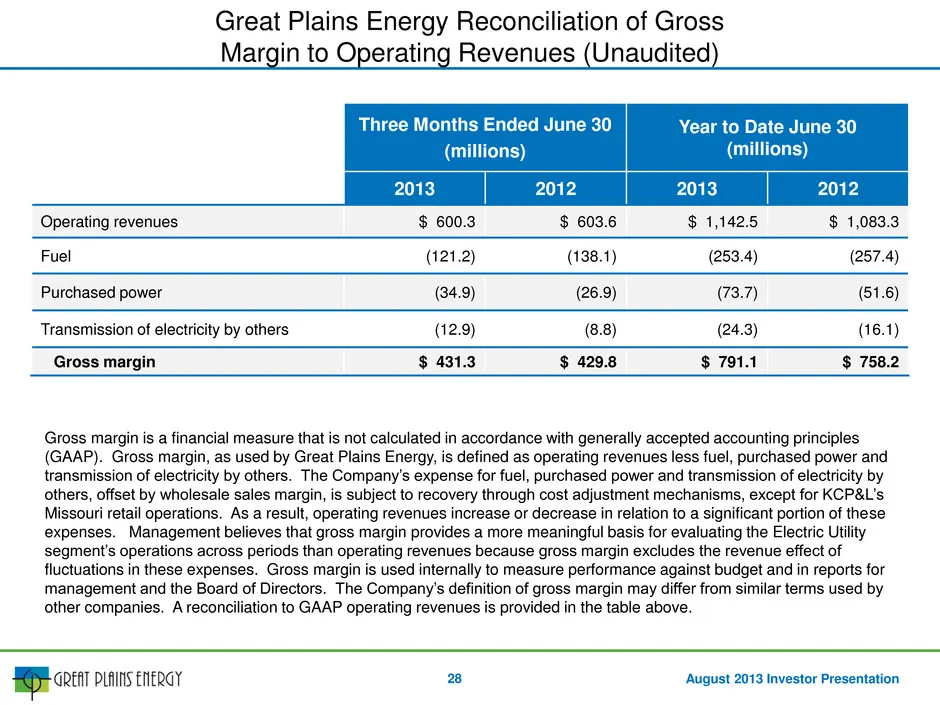
Slide 28: Gross Margin Definition
August 2013 Investor Presentation Gross margin is a financial measure that is not calculated in accordance with generally accepted accounting principles (GAAP). Gross margin, as used by Great Plains Energy, is defined as operating revenues less fuel, purchased power and transmission of electricity b
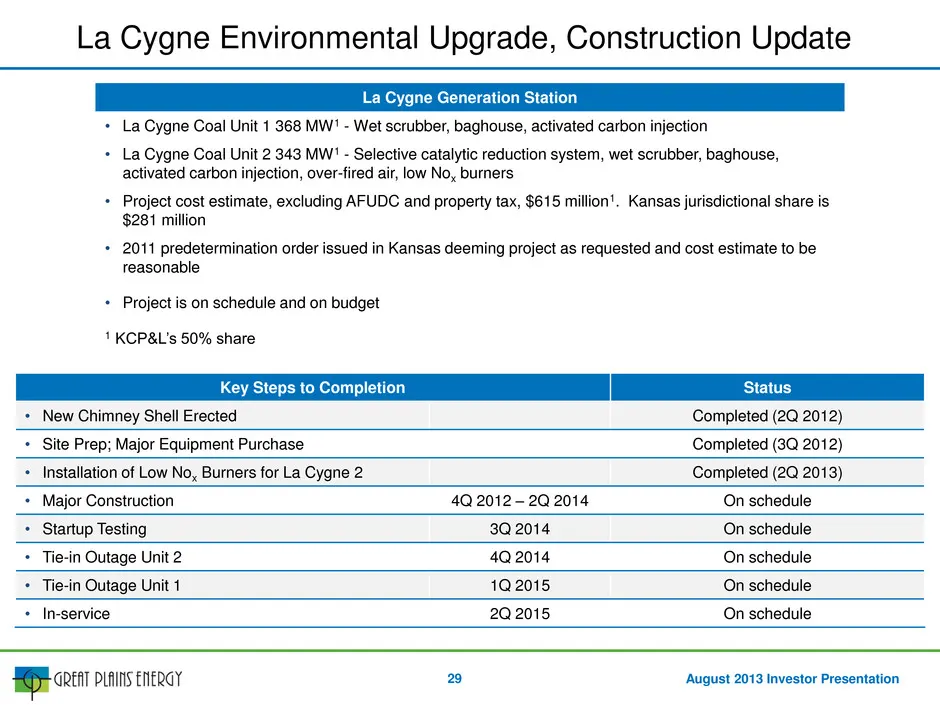
Slide 29: La Cygne Generation Station
August 2013 Investor Presentation Key Steps to Completion Status • New Chimney Shell Erected Completed (2Q 2012) • Site Prep; Major Equipment Purchase Completed (3Q 2012) • Installation of Low Nox Burners for La Cygne 2 Completed (2Q 2013) • Major Construction 4Q 2012 – 2Q 2014 On schedule • Startup
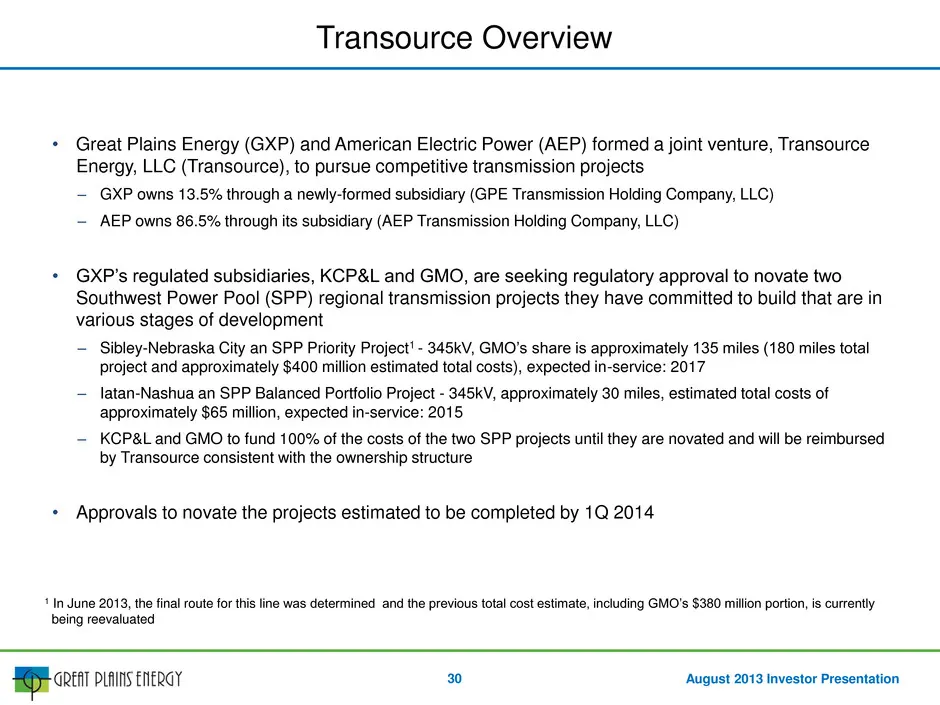
Slide 30: Transource Energy Joint Venture
August 2013 Investor Presentation • Great Plains Energy (GXP) and American Electric Power (AEP) formed a joint venture, Transource Energy, LLC (Transource), to pursue competitive transmission projects – GXP owns 13.5% through a newly-formed subsidiary (GPE Transmission Holding Company, LLC) – AEP ow
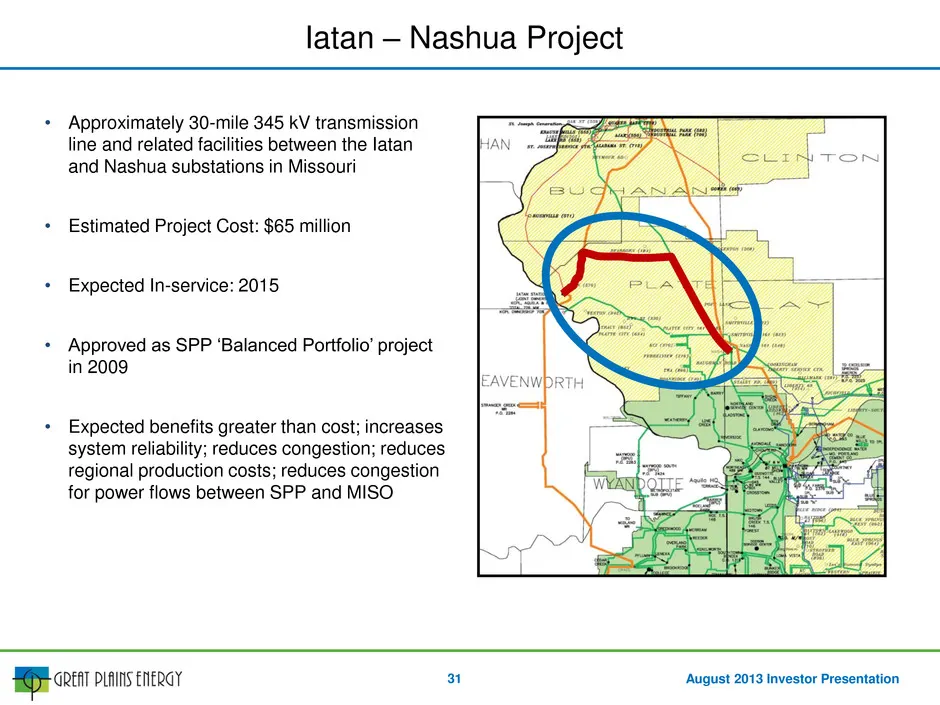
Slide 31: Iatan – Nashua Project
August 2013 Investor Presentation • Approximately 30-mile 345 kV transmission line and related facilities between the Iatan and Nashua substations in Missouri • Estimated Project Cost: $65 million • Expected In-service: 2015 • Approved as SPP ‘Balanced Portfolio’ project in 2009 • Expected benefits
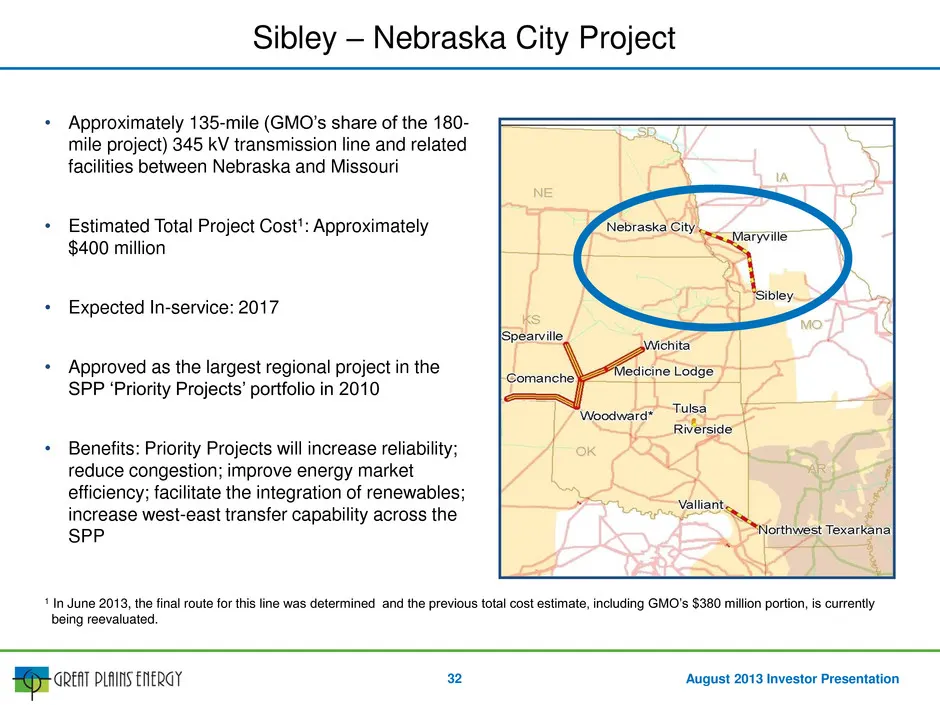
Slide 32: Sibley – Nebraska City Project
August 2013 Investor Presentation • Approximately 135-mile (GMO’s share of the 180- mile project) 345 kV transmission line and related facilities between Nebraska and Missouri • Estimated Total Project Cost1: Approximately $400 million • Expected In-service: 2017 • Approved as the largest regional p
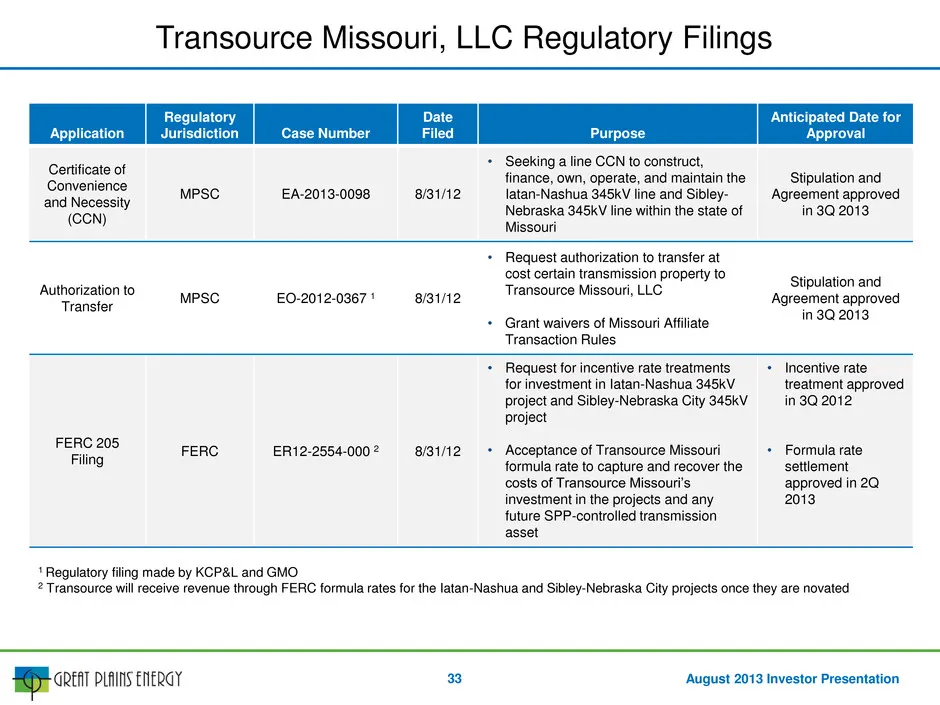
Slide 33: Transmission Regulatory Applications
August 2013 Investor Presentation Application Regulatory Jurisdiction Case Number Date Filed Purpose Anticipated Date for Approval Certificate of Convenience and Necessity (CCN) MPSC EA-2013-0098 8/31/12 • Seeking a line CCN to construct, finance, own, operate, and maintain the Iatan-Nashua 345kV li
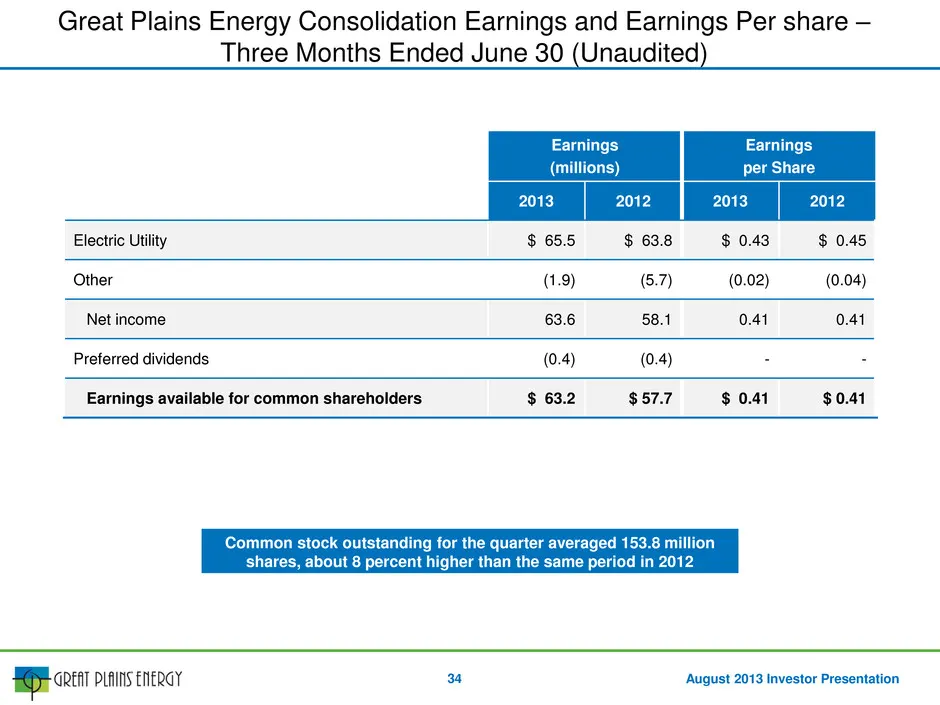
Slide 34: Earnings and EPS – Three Months Ended June 30
August 2013 Investor Presentation Earnings (millions) Earnings per Share 2013 2012 2013 2012 Electric Utility $ 65.5 $ 63.8 $ 0.43 $ 0.45 Other (1.9) (5.7) (0.02) (0.04) Net income 63.6 58.1 0.41 0.41 Preferred dividends (0.4) (0.4) - - Earnings available for common shareholders $ 63.2 $ 57.7 $ 0.41
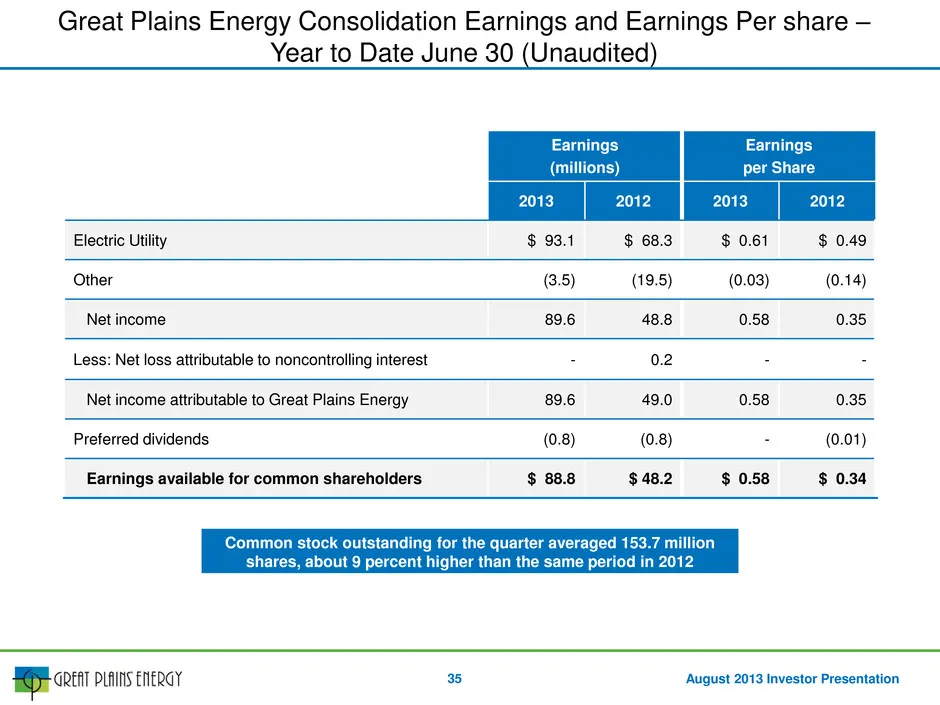
Slide 35: Earnings and EPS – Year to Date June 30
August 2013 Investor Presentation Earnings (millions) Earnings per Share 2013 2012 2013 2012 Electric Utility $ 93.1 $ 68.3 $ 0.61 $ 0.49 Other (3.5) (19.5) (0.03) (0.14) Net income 89.6 48.8 0.58 0.35 Less: Net loss attributable to noncontrolling interest - 0.2 - - Net income attributable to Great
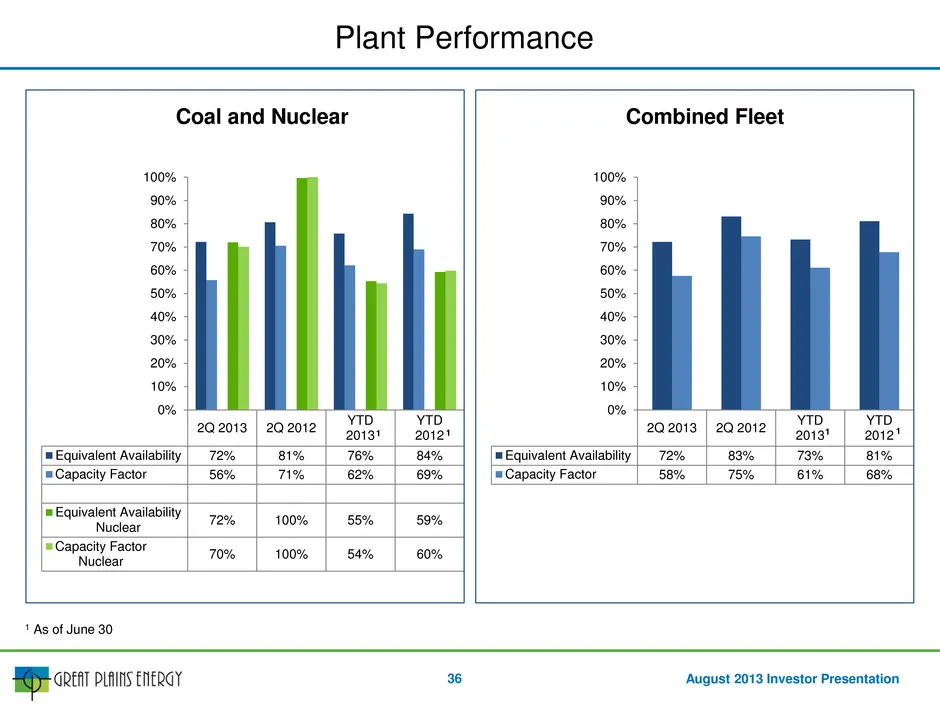
Slide 36: Plant Performance
August 2013 Investor Presentation Plant Performance 1 As of June 30 1 1 1 1 2Q 2013 2Q 2012 YTD 2013 YTD 2012 Equivalent Availability 72% 83% 73% 81% Capacity Factor 58% 75% 61% 68% 0% 10% 20% 30% 40% 50% 60% 70% 80% 90% 100% Combined Fleet 2Q 2013 2Q 2012 YTD 2013 YTD 2012 Equivalent Availability 7
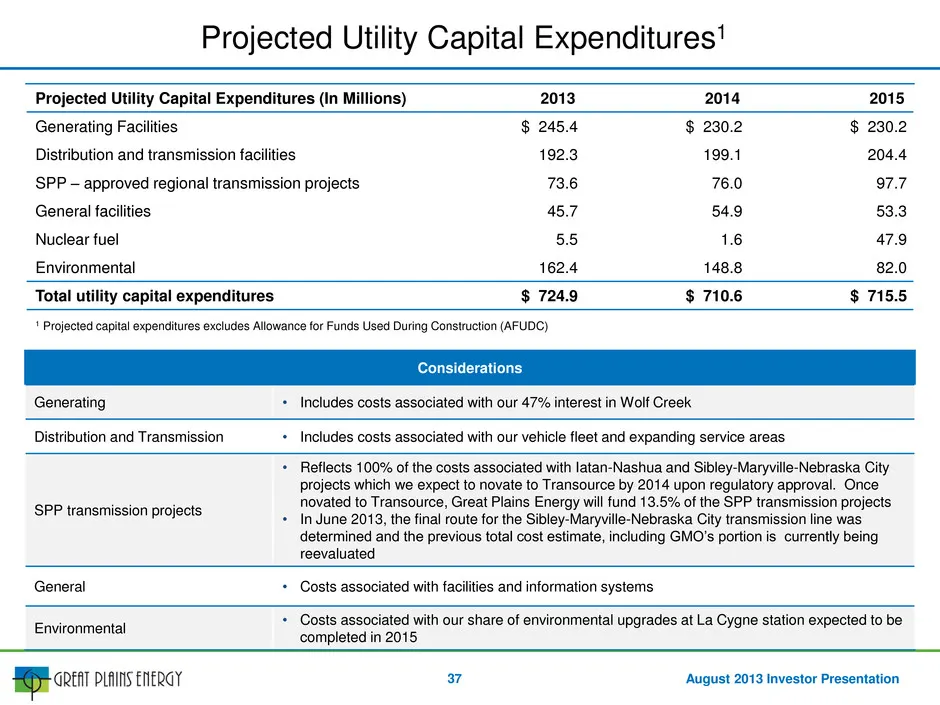
Slide 37: Projected Utility Capital Expenditures Considerations
August 2013 Investor Presentation Considerations Generating • Includes costs associated with our 47% interest in Wolf Creek Distribution and Transmission • Includes costs associated with our vehicle fleet and expanding service areas SPP transmission projects • Reflects 100% of the costs associated w
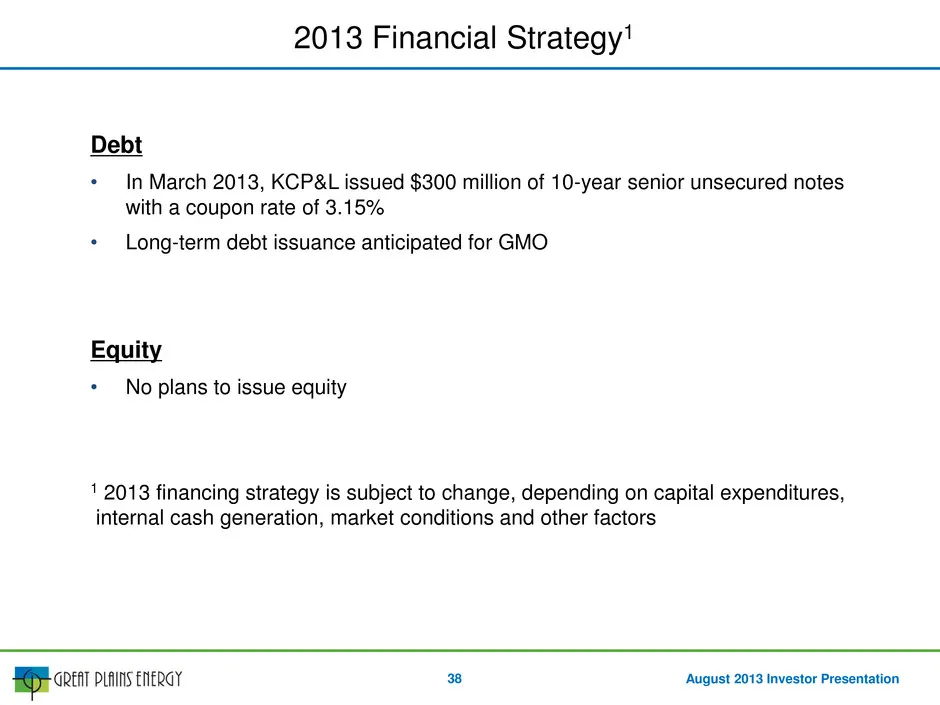
Slide 38: 2013 Financial Strategy
August 2013 Investor Presentation Debt • In March 2013, KCP&L issued $300 million of 10-year senior unsecured notes with a coupon rate of 3.15% • Long-term debt issuance anticipated for GMO Equity • No plans to issue equity 1 2013 financing strategy is subject to change, depending on capital expendi
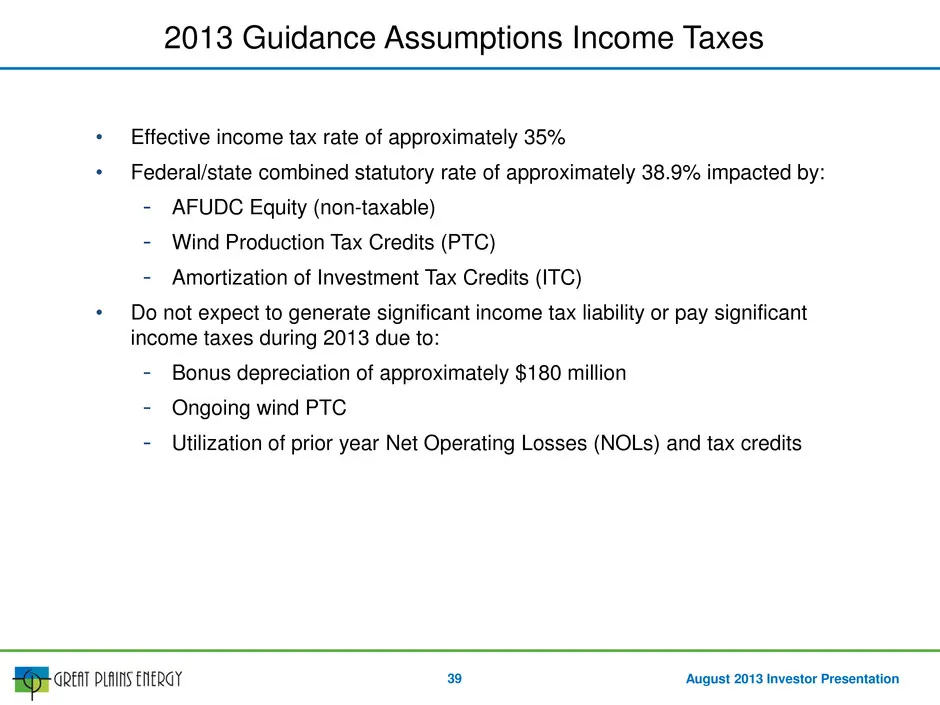
Slide 39: 2013 Guidance Assumptions – Income Taxes
August 2013 Investor Presentation • Effective income tax rate of approximately 35% • Federal/state combined statutory rate of approximately 38.9% impacted by: - AFUDC Equity (non-taxable) - Wind Production Tax Credits (PTC) - Amortization of Investment Tax Credits (ITC) • Do not expect to generate s
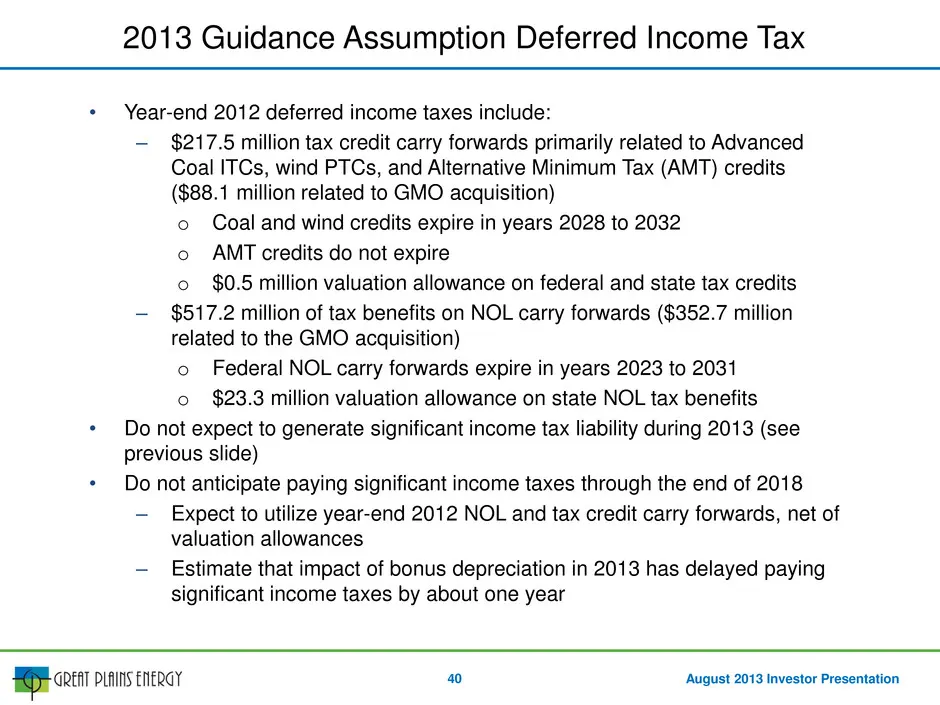
Slide 40: Deferred Income Taxes and Carry Forwards
August 2013 Investor Presentation • Year-end 2012 deferred income taxes include: – $217.5 million tax credit carry forwards primarily related to Advanced Coal ITCs, wind PTCs, and Alternative Minimum Tax (AMT) credits ($88.1 million related to GMO acquisition) o Coal and wind credits expire in years
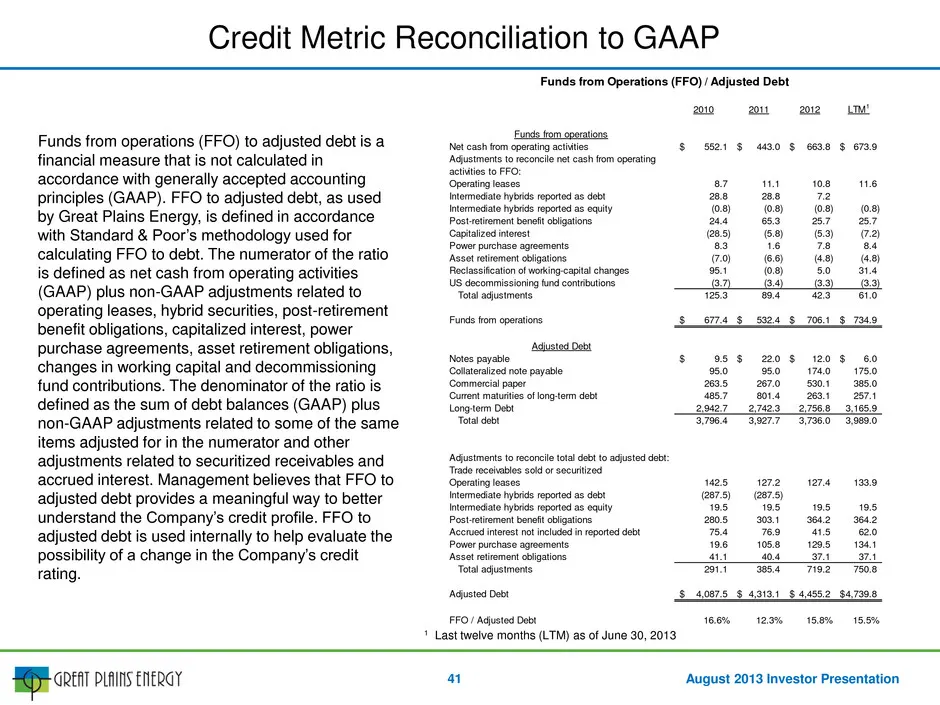
Slide 41: Credit Metric Reconciliation to GAAP
August 2013 Investor Presentation Credit Metric Reconciliation to GAAP 1 Last twelve months (LTM) as of June 30, 2013 41 Funds from operations (FFO) to adjusted debt is a financial measure that is not calculated in accordance with generally accepted accounting principles (GAAP). FFO to adjusted debt
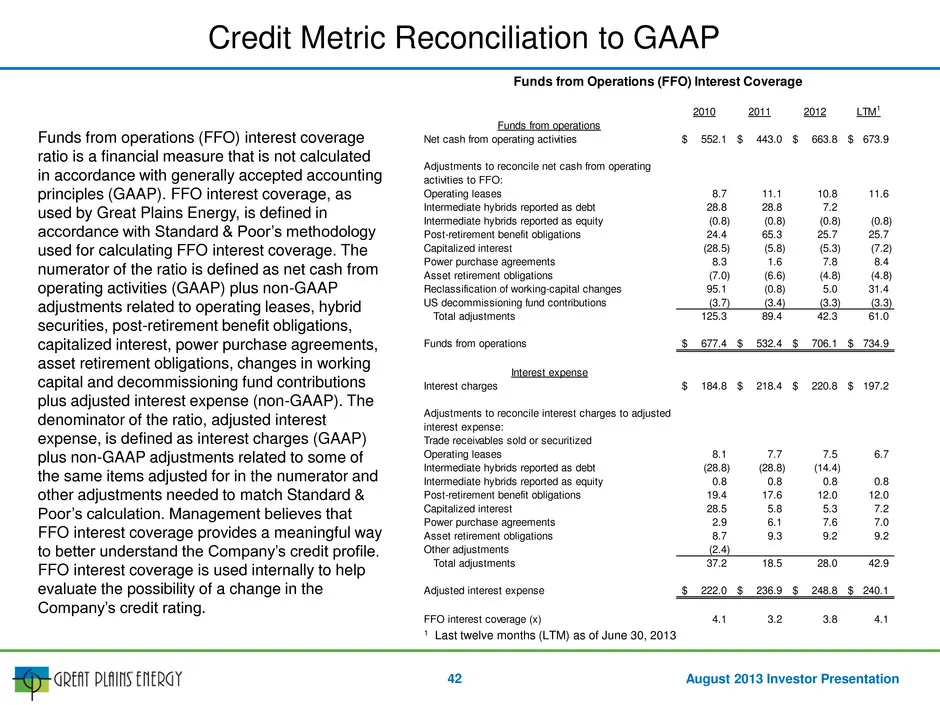
Slide 42: Credit Metric Reconciliation to GAAP
August 2013 Investor Presentation Credit Metric Reconciliation to GAAP 1 Last twelve months (LTM) as of June 30, 2013 42 Funds from operations (FFO) interest coverage ratio is a financial measure that is not calculated in accordance with generally accepted accounting principles (GAAP). FFO interest
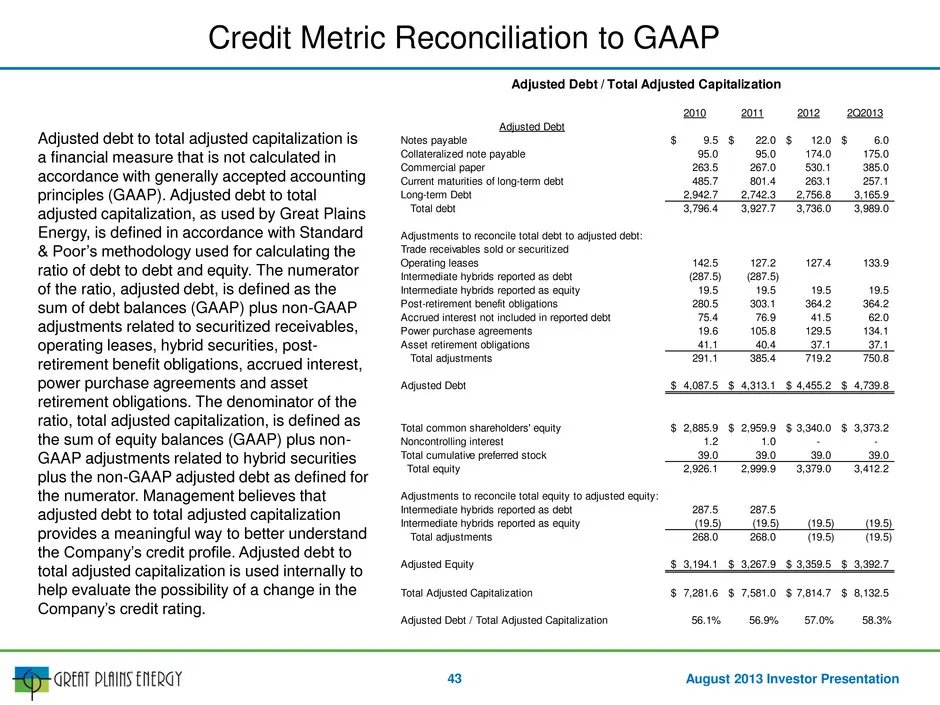
Slide 43: Credit Metric Reconciliation to GAAP
August 2013 Investor Presentation Credit Metric Reconciliation to GAAP 43 Adjusted debt to total adjusted capitalization is a financial measure that is not calculated in accordance with generally accepted accounting principles (GAAP). Adjusted debt to total adjusted capitalization, as used by Great
Source: SEC EDGAR · 8-K filed Aug 13, 2013
More decks from Great Plains Energy Incorporated
 Merger or Acquisition (January 2018)27 slides · Jan 10, 2018
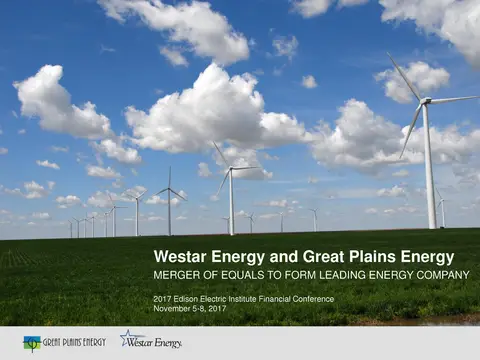 2017 Edison Electric Institute Financial Conference25 slides · Nov 3, 2017
 Merger or Acquisition (October 2017)14 slides · Oct 31, 2017
 Merger or Acquisition (October 2017)9 slides · Oct 31, 2017
 Merger or Acquisition (August 2017)18 slides · Aug 8, 2017
 Merger or Acquisition (August 2017)9 slides · Aug 8, 2017