The Phoenix Companies — Phoenix Companies — Merger or Acquisition (December 2008)
24 slides from The Phoenix Companies's merger presentation, Dec 4, 2008
Slide 1: Presentation Regarding Virtus Investment Partners, Inc.
Exhibit 99.1 Presentation Regarding Virtus Investment Partners, Inc. December 4, 2008
Slide 2: Important Disclosures
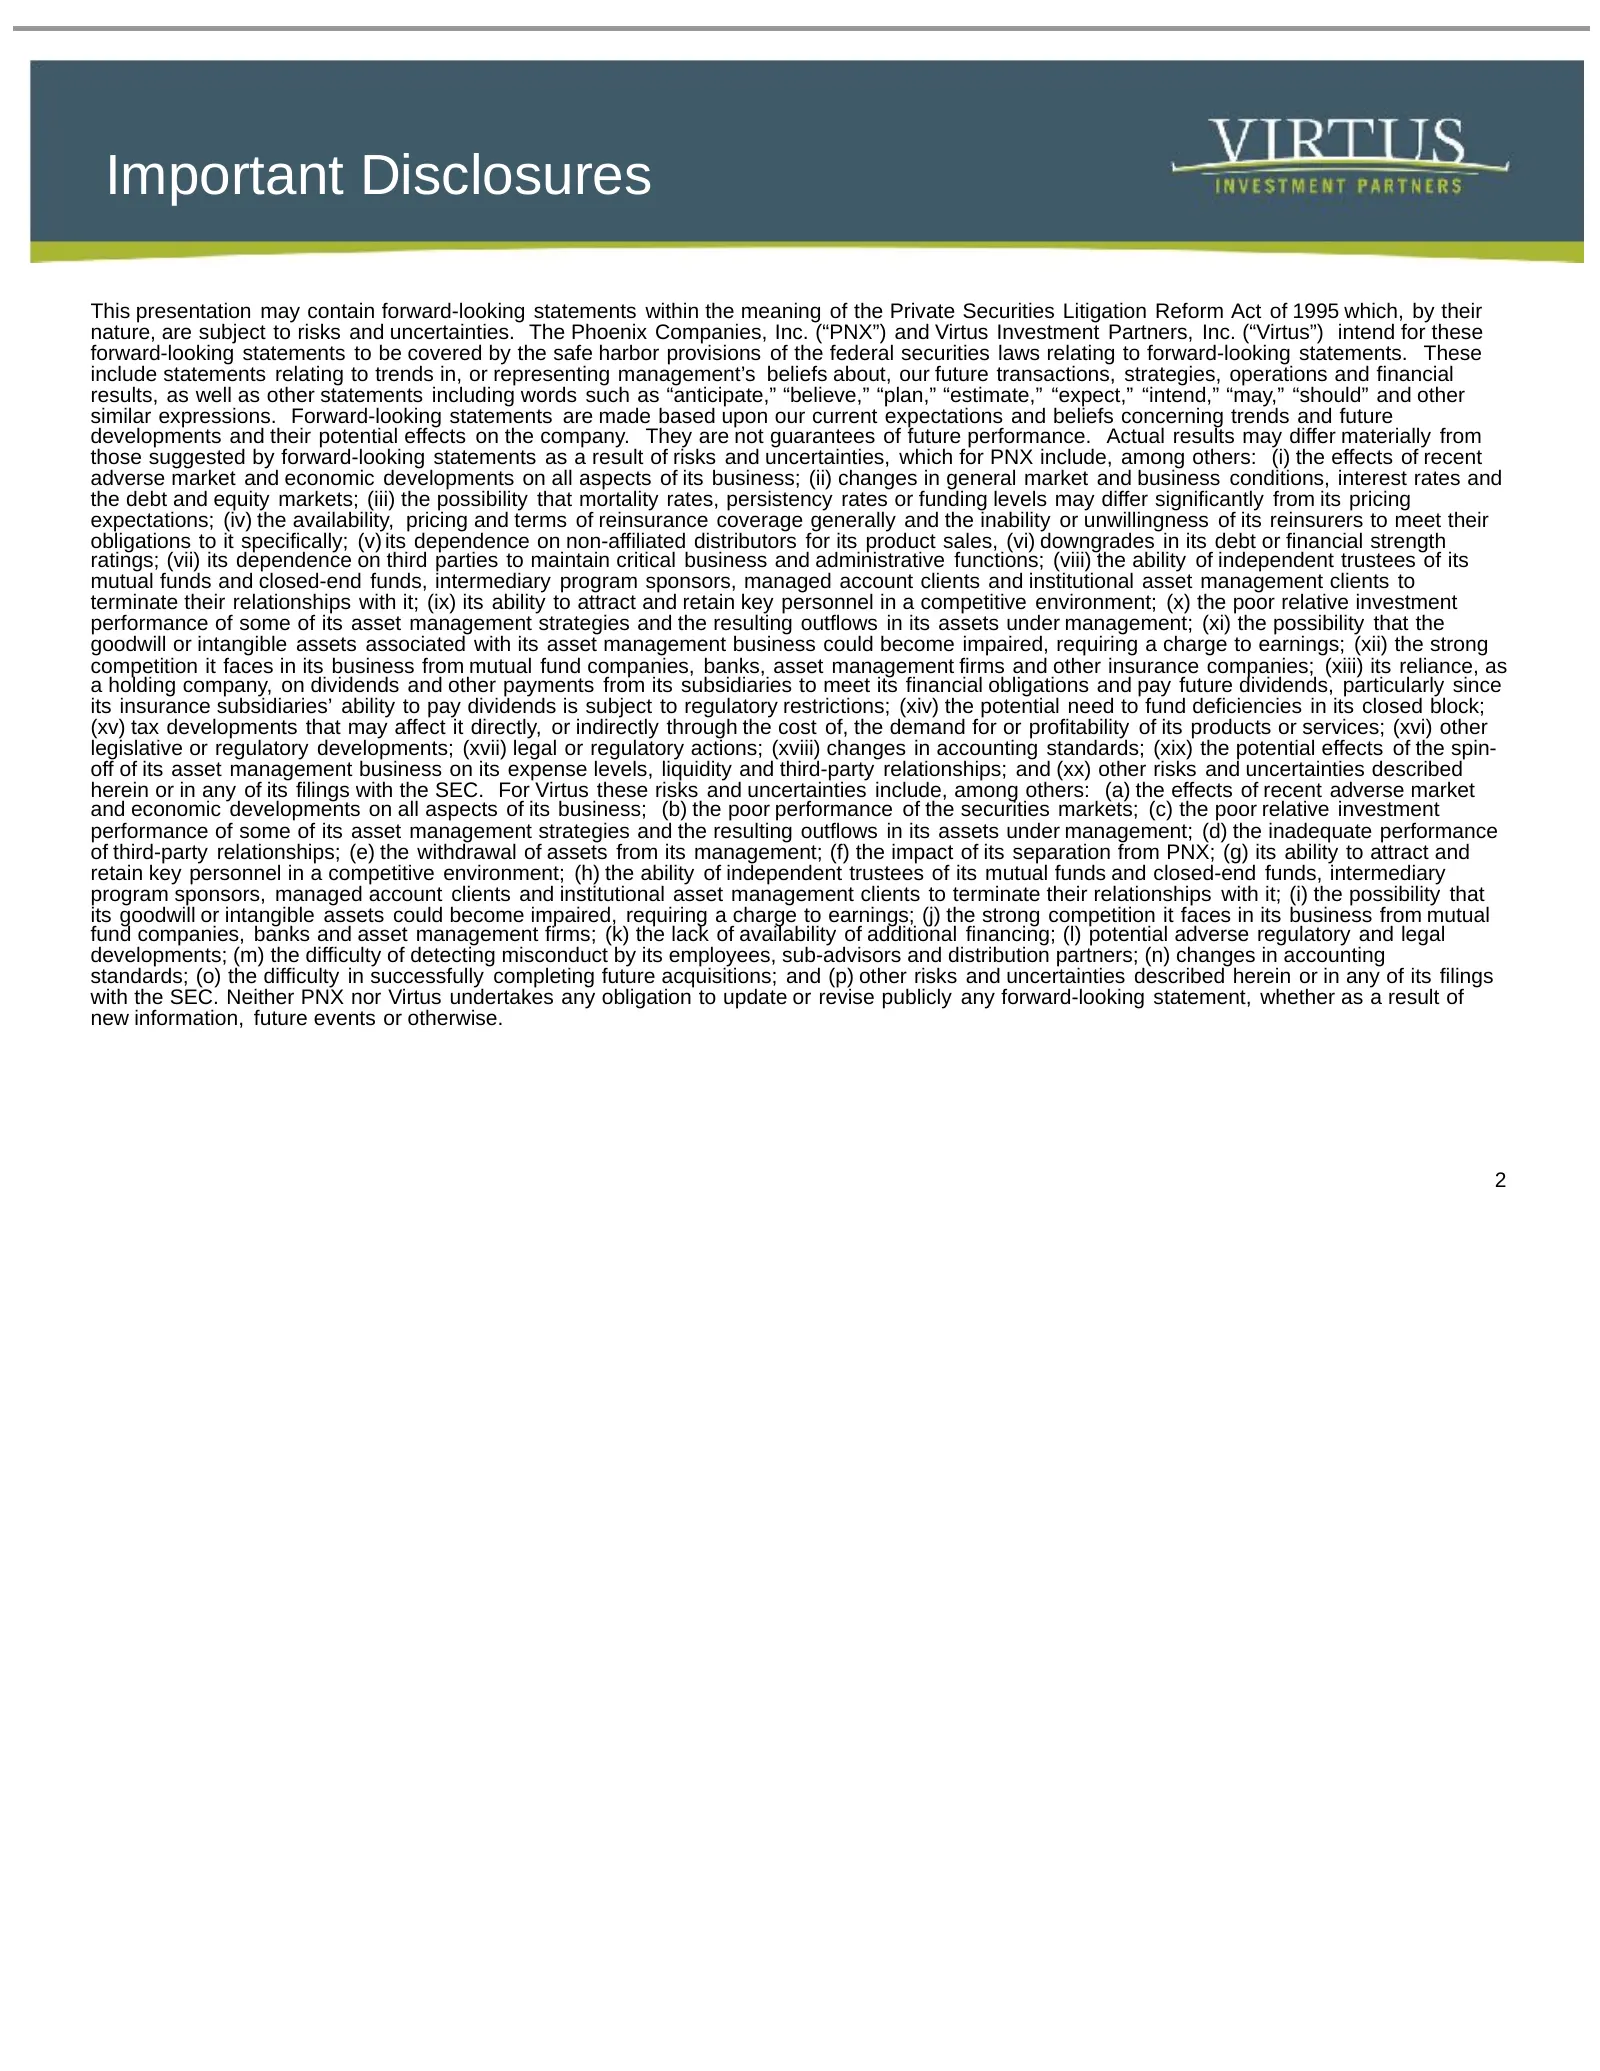
Important Disclosures This presentation may contain forward-looking statements within the meaning of the Private Securities Litigation Reform Act of 1995 which, by their nature, are subject to risks and uncertainties. The Phoenix Companies, Inc. (“PNX”) and Virtus Investment Partners, Inc. (“Virtus”
Slide 3: Important Disclosures (Cont'd)
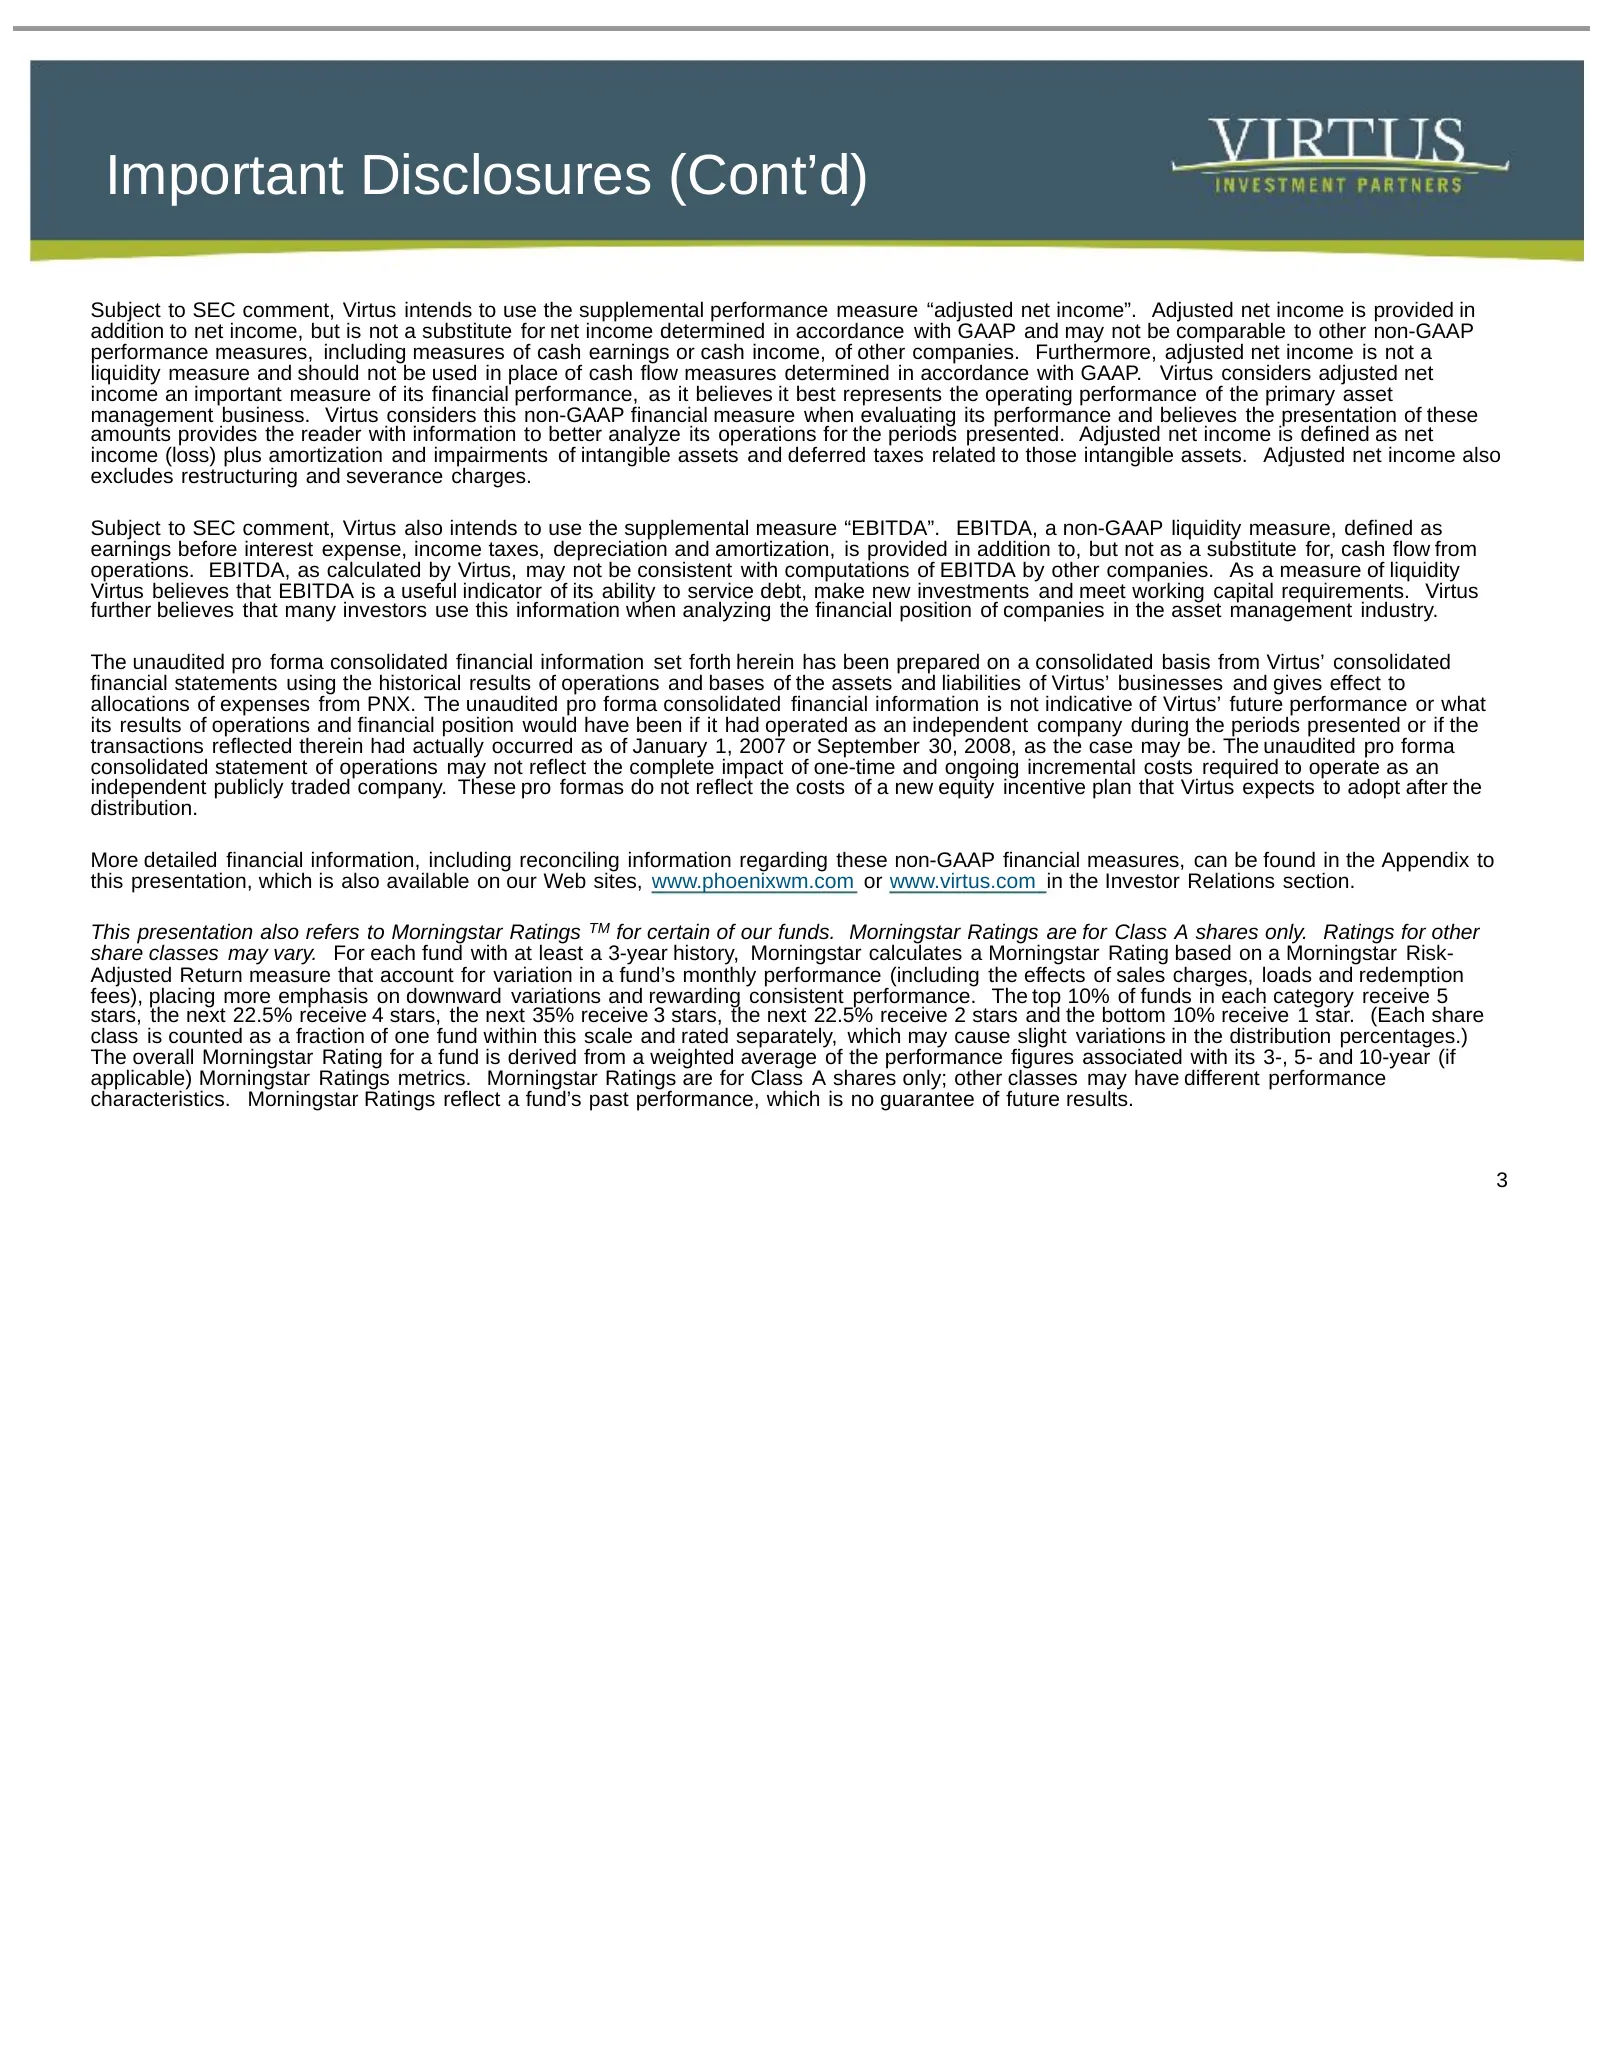
Important Disclosures (Cont’d) Subject to SEC comment, Virtus intends to use the supplemental performance measure “adjusted net income”. Adjusted net income is provided in addition to net income, but is not a substitute for net income determined in accordance with GAAP and may not be comparable to o
Slide 4: Call Participants
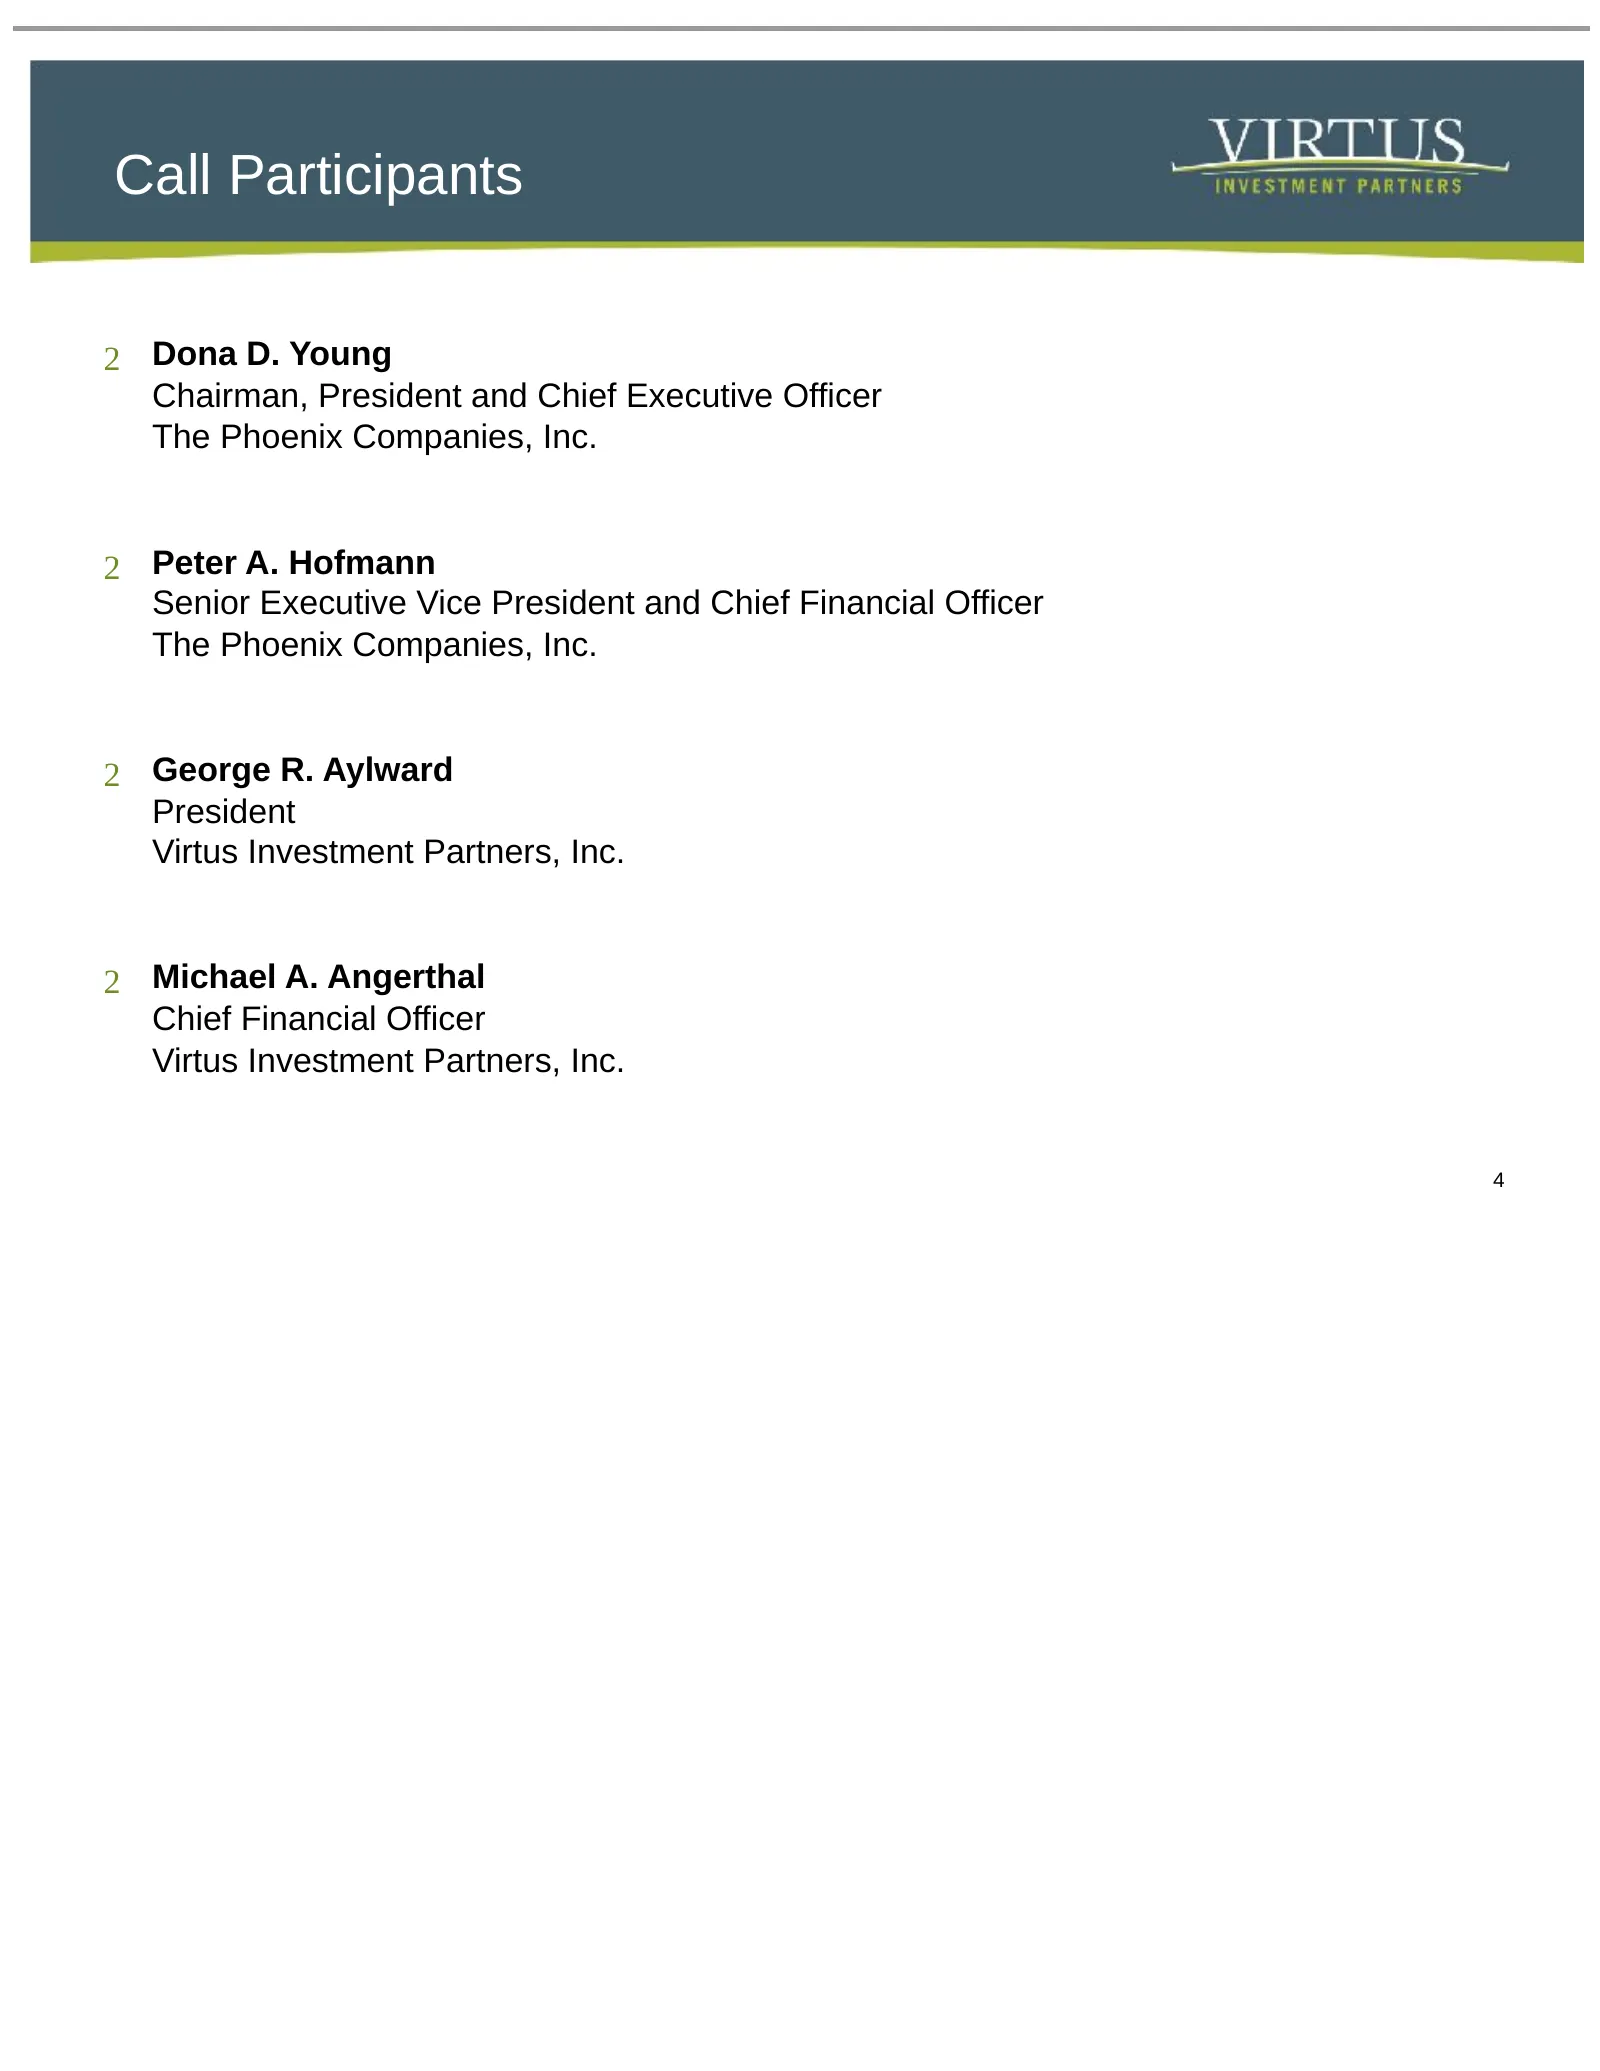
Call Participants 2 Dona D. Young Chairman, President and Chief Executive Officer The Phoenix Companies, Inc. 2 Peter A. Hofmann Senior Executive Vice President and Chief Financial Officer The Phoenix Companies, Inc. 2 George R. Aylward President Virtus Investment Partners, Inc. 2 Michael A. Angerth
Slide 5: Transaction Description
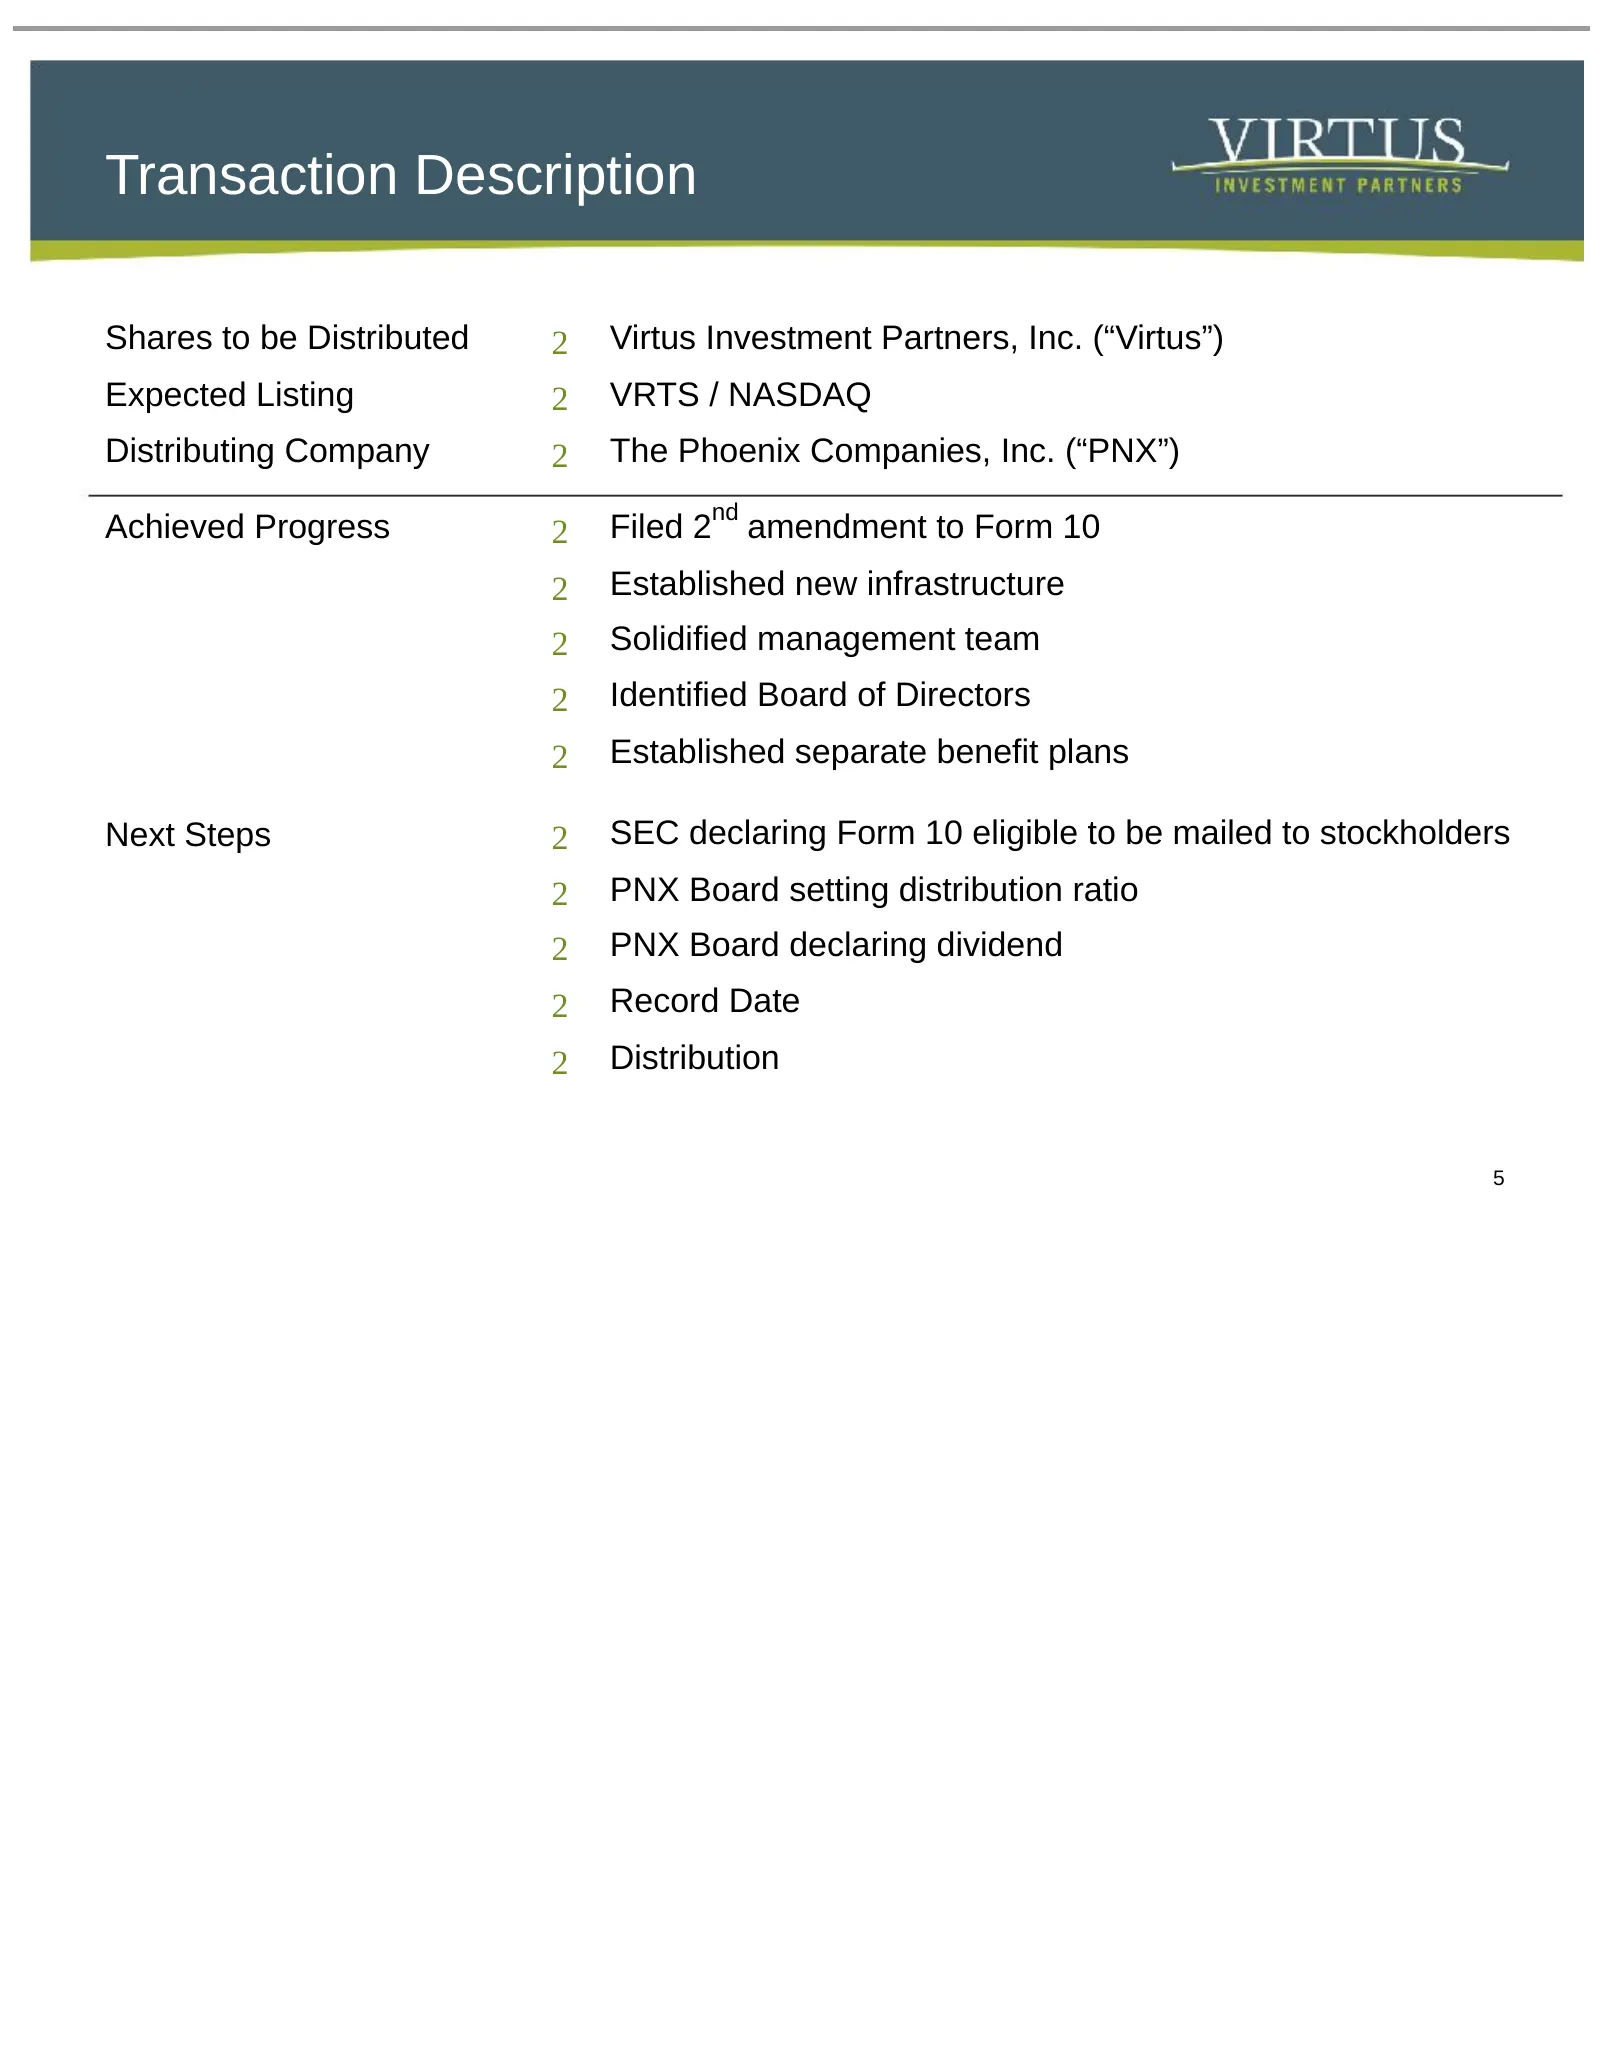
Transaction Description Shares to be Distributed 2 Virtus Investment Partners, Inc. (“Virtus”) Expected Listing 2 VRTS / NASDAQ Distributing Company 2 The Phoenix Companies, Inc. (“PNX”) nd Achieved Progress 2 Filed 2 amendment to Form 10 2 Established new infrastructure 2 Solidified management team
Slide 6: Key Investment Highlights
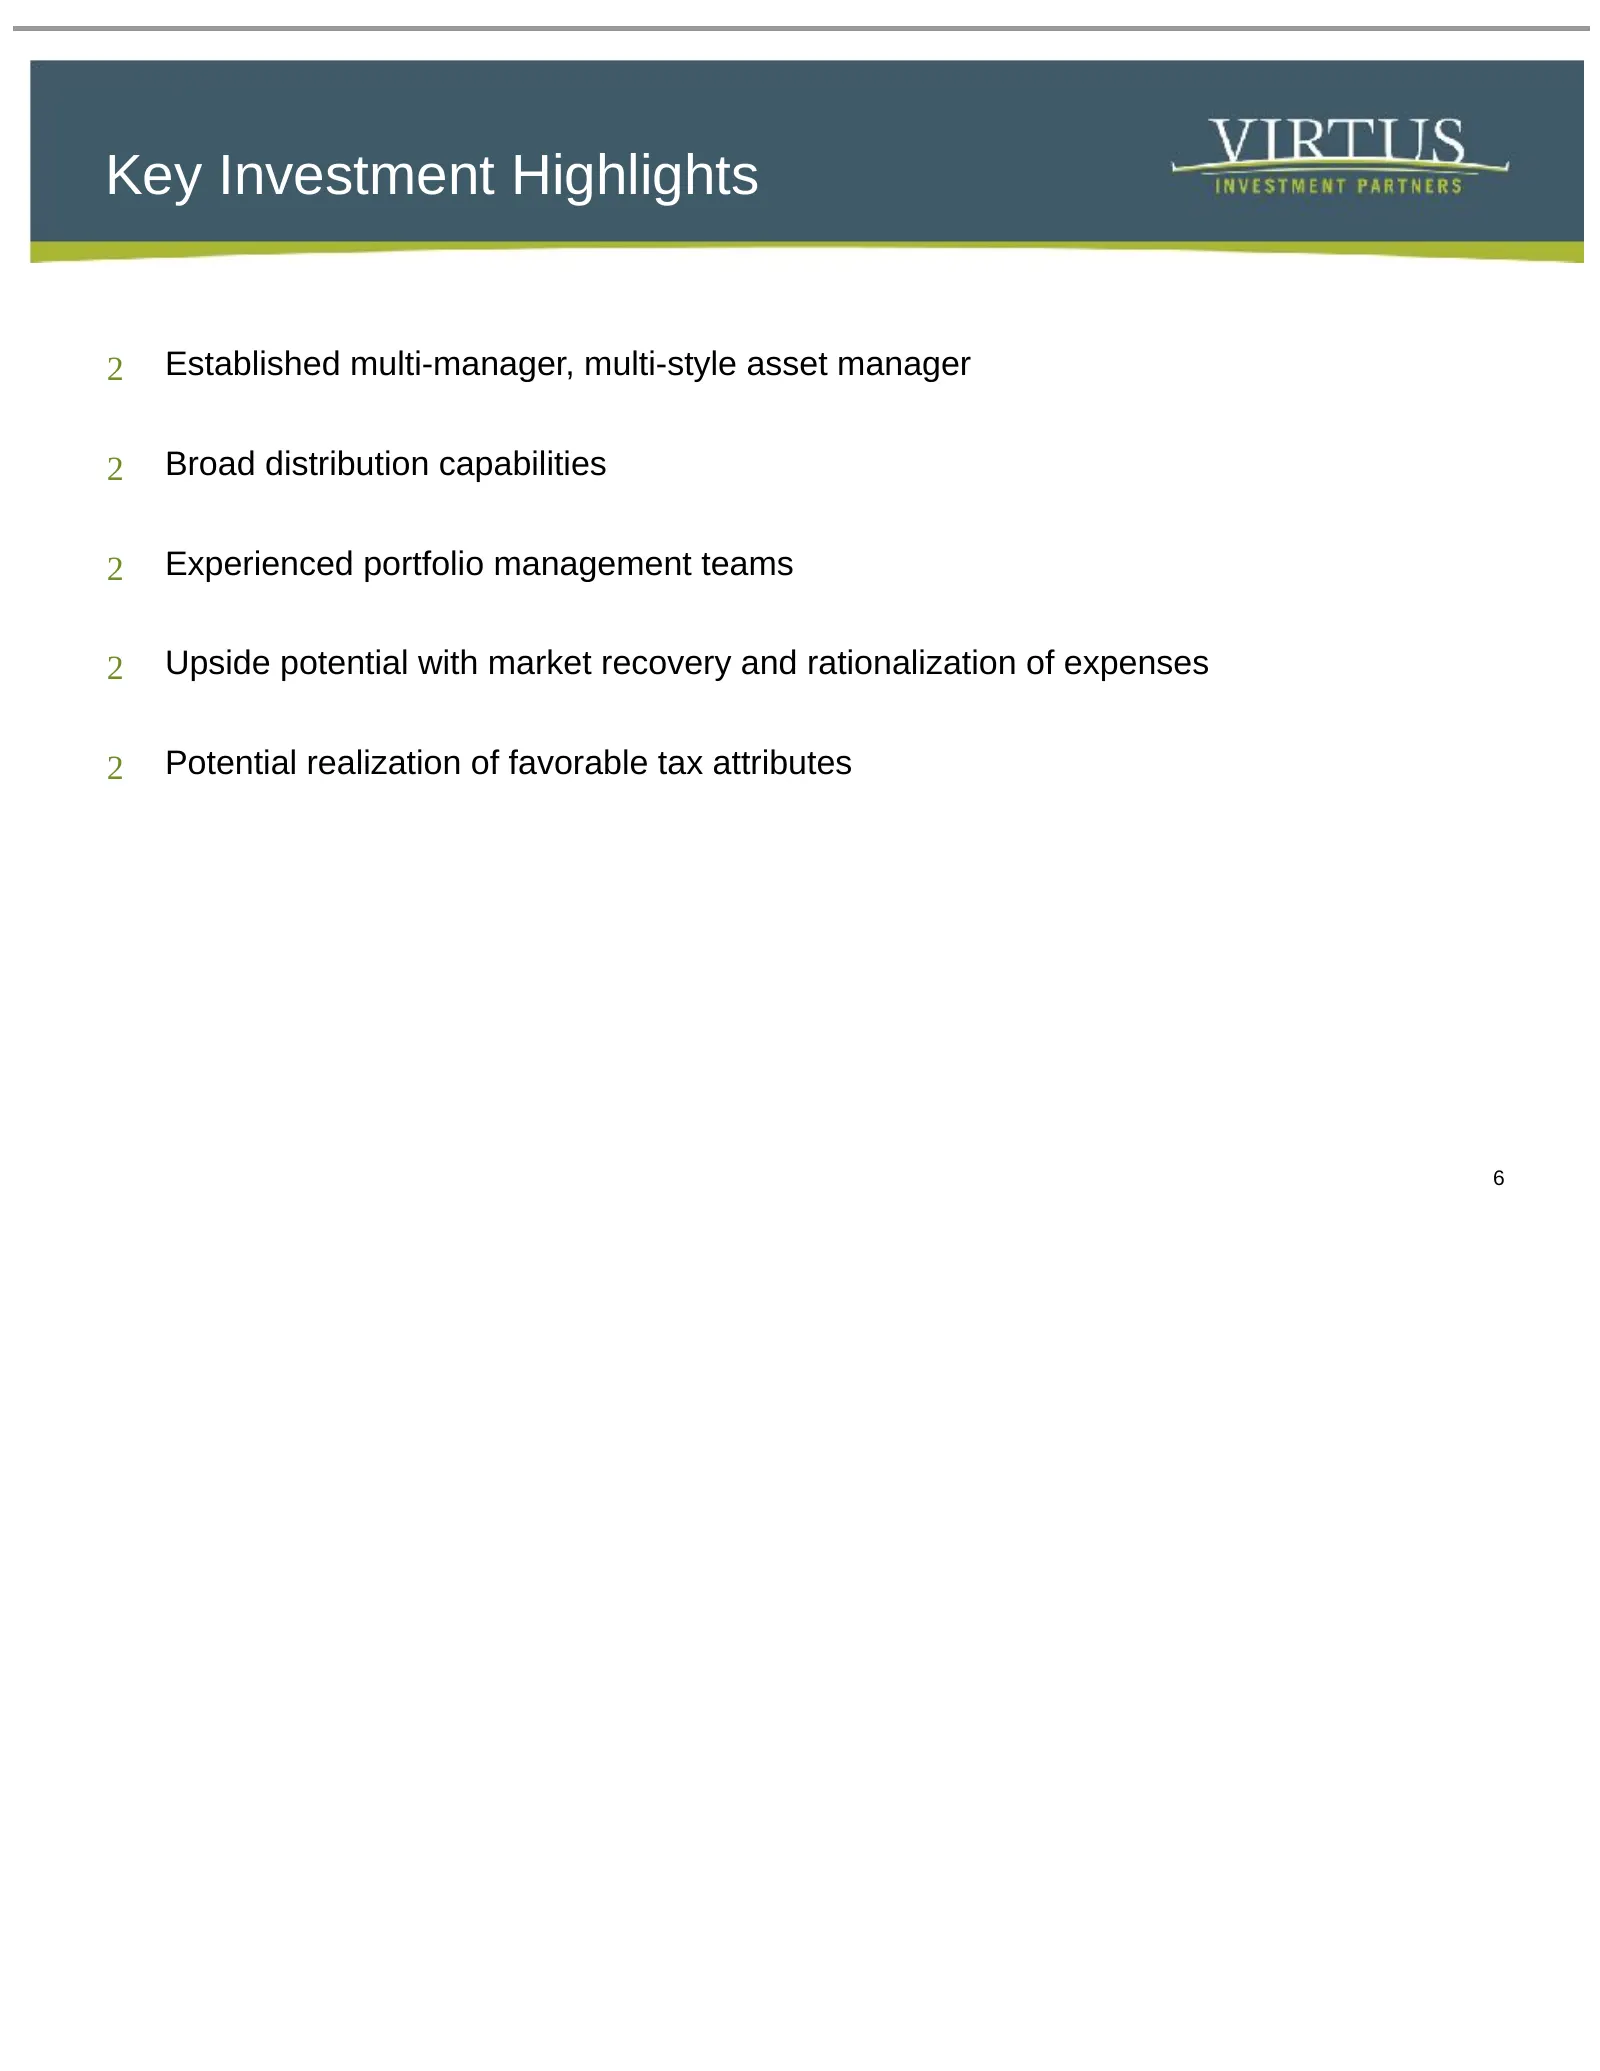
Key Investment Highlights 2 Established multi-manager, multi-style asset manager 2 Broad distribution capabilities 2 Experienced portfolio management teams 2 Upside potential with market recovery and rationalization of expenses 2 Potential realization of favorable tax attributes 6
Slide 7: Transaction Rationale
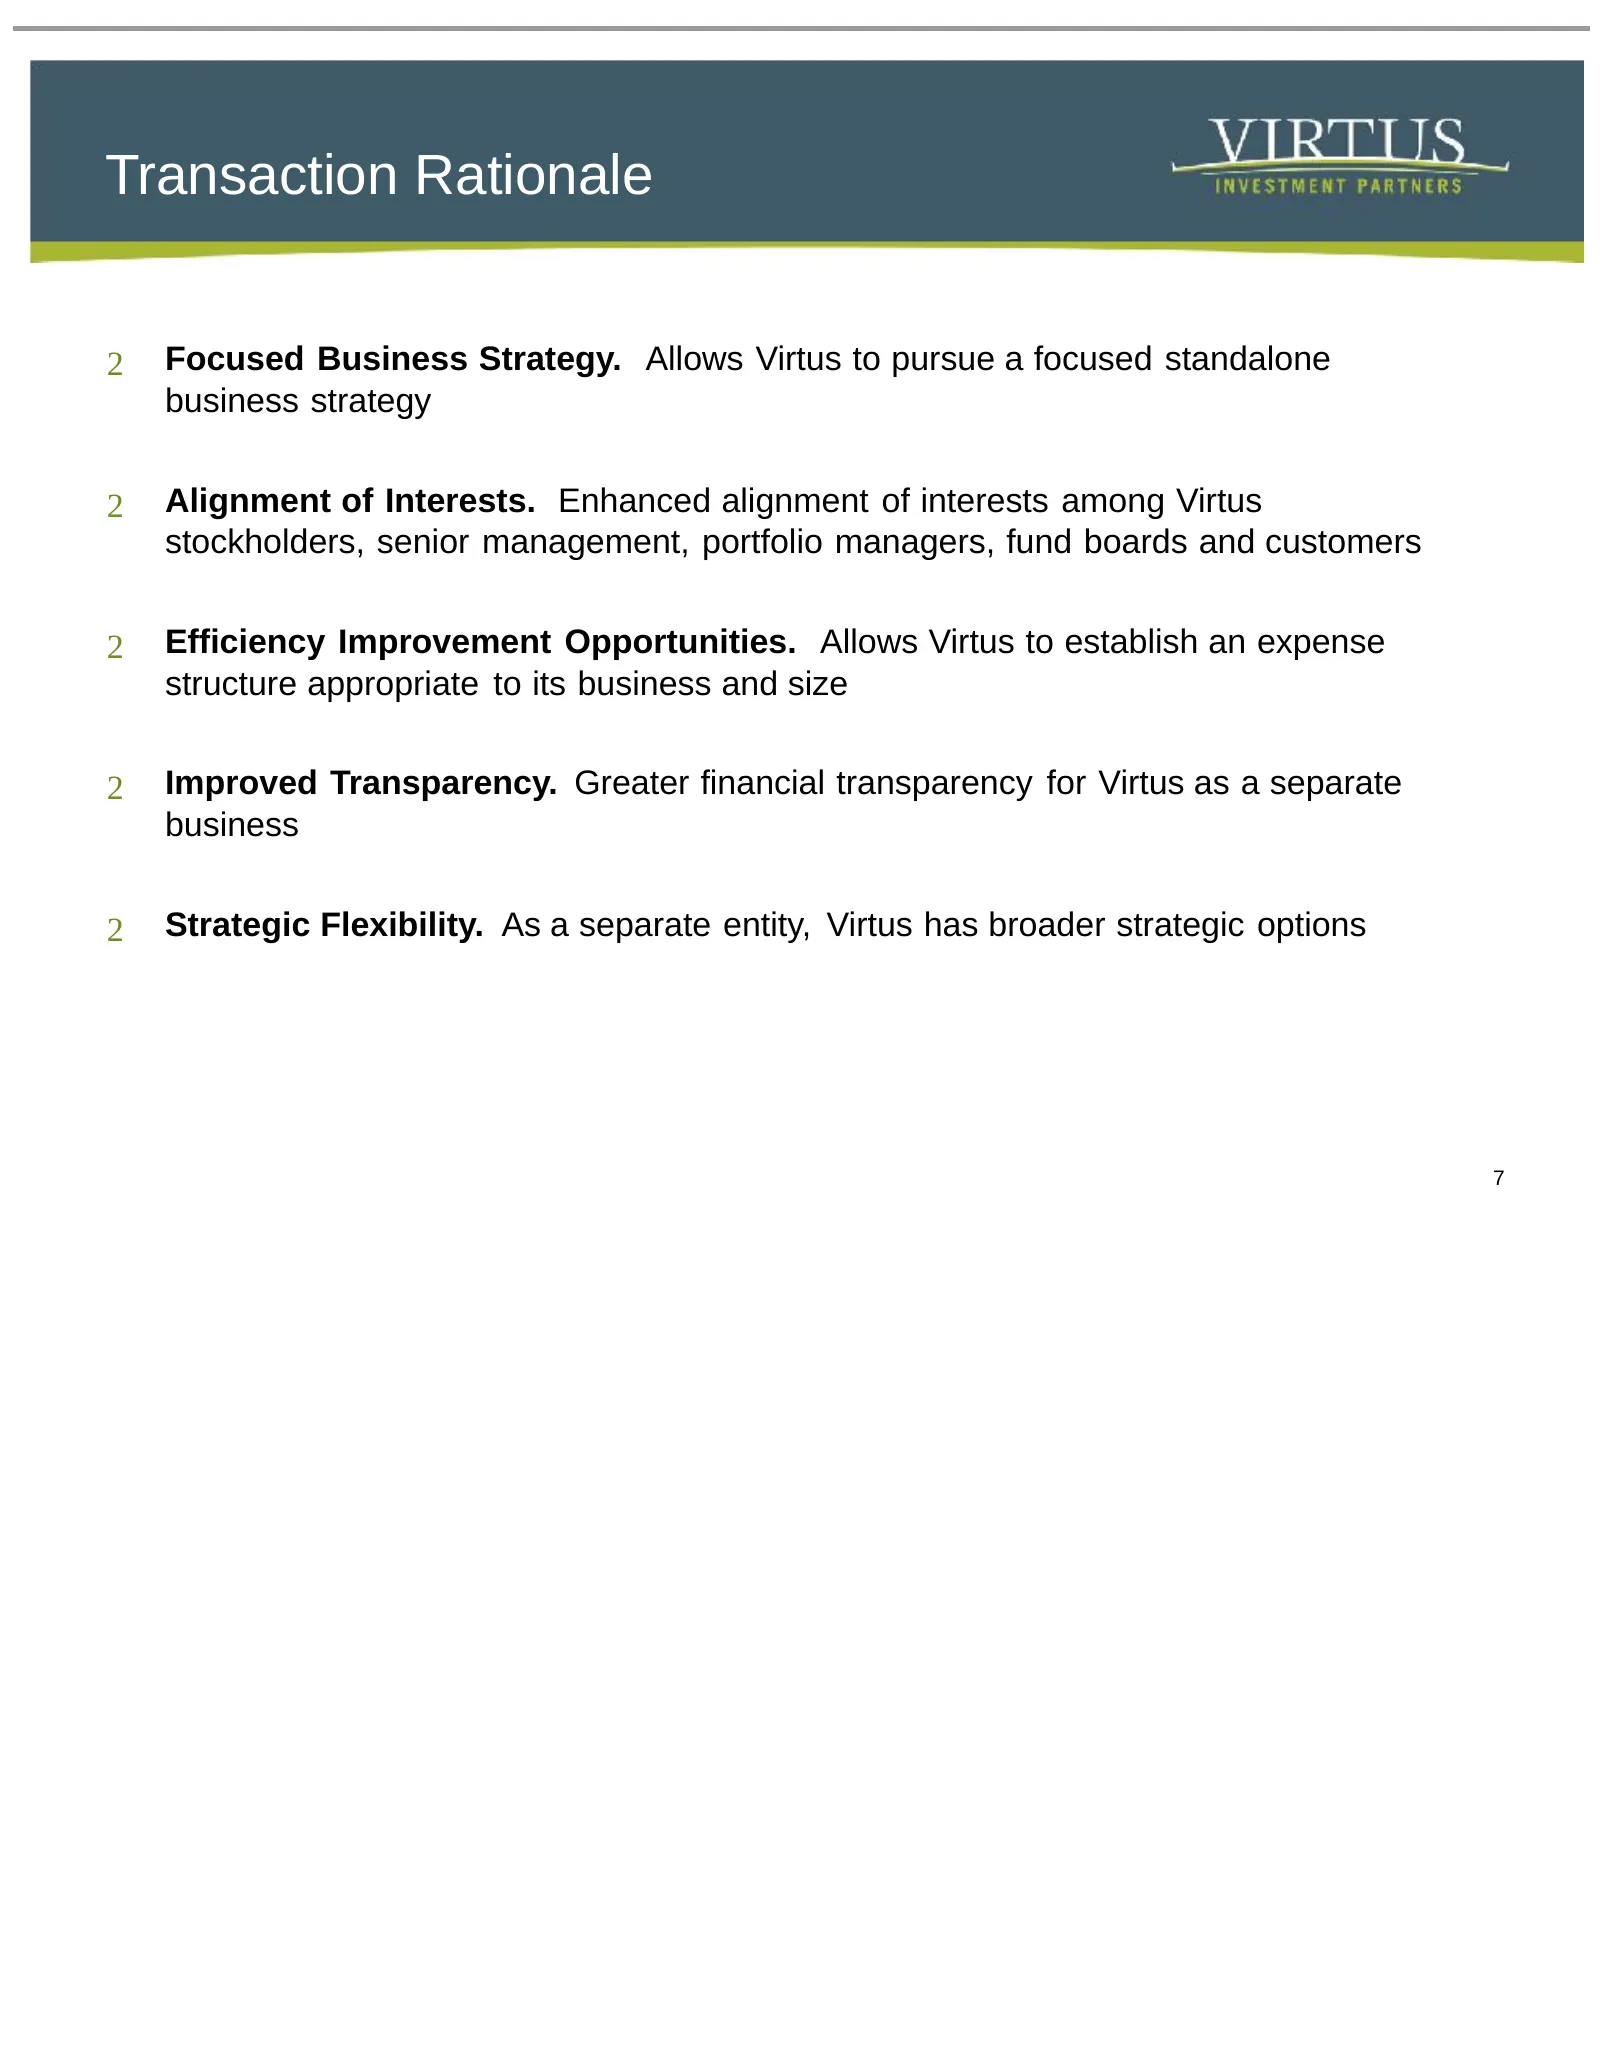
Transaction Rationale 2 Focused Business Strategy. Allows Virtus to pursue a focused standalone business strategy 2 Alignment of Interests. Enhanced alignment of interests among Virtus stockholders, senior management, portfolio managers, fund boards and customers 2 Efficiency Improvement Opportuniti
Slide 8: BMO / Harris Minority Investment
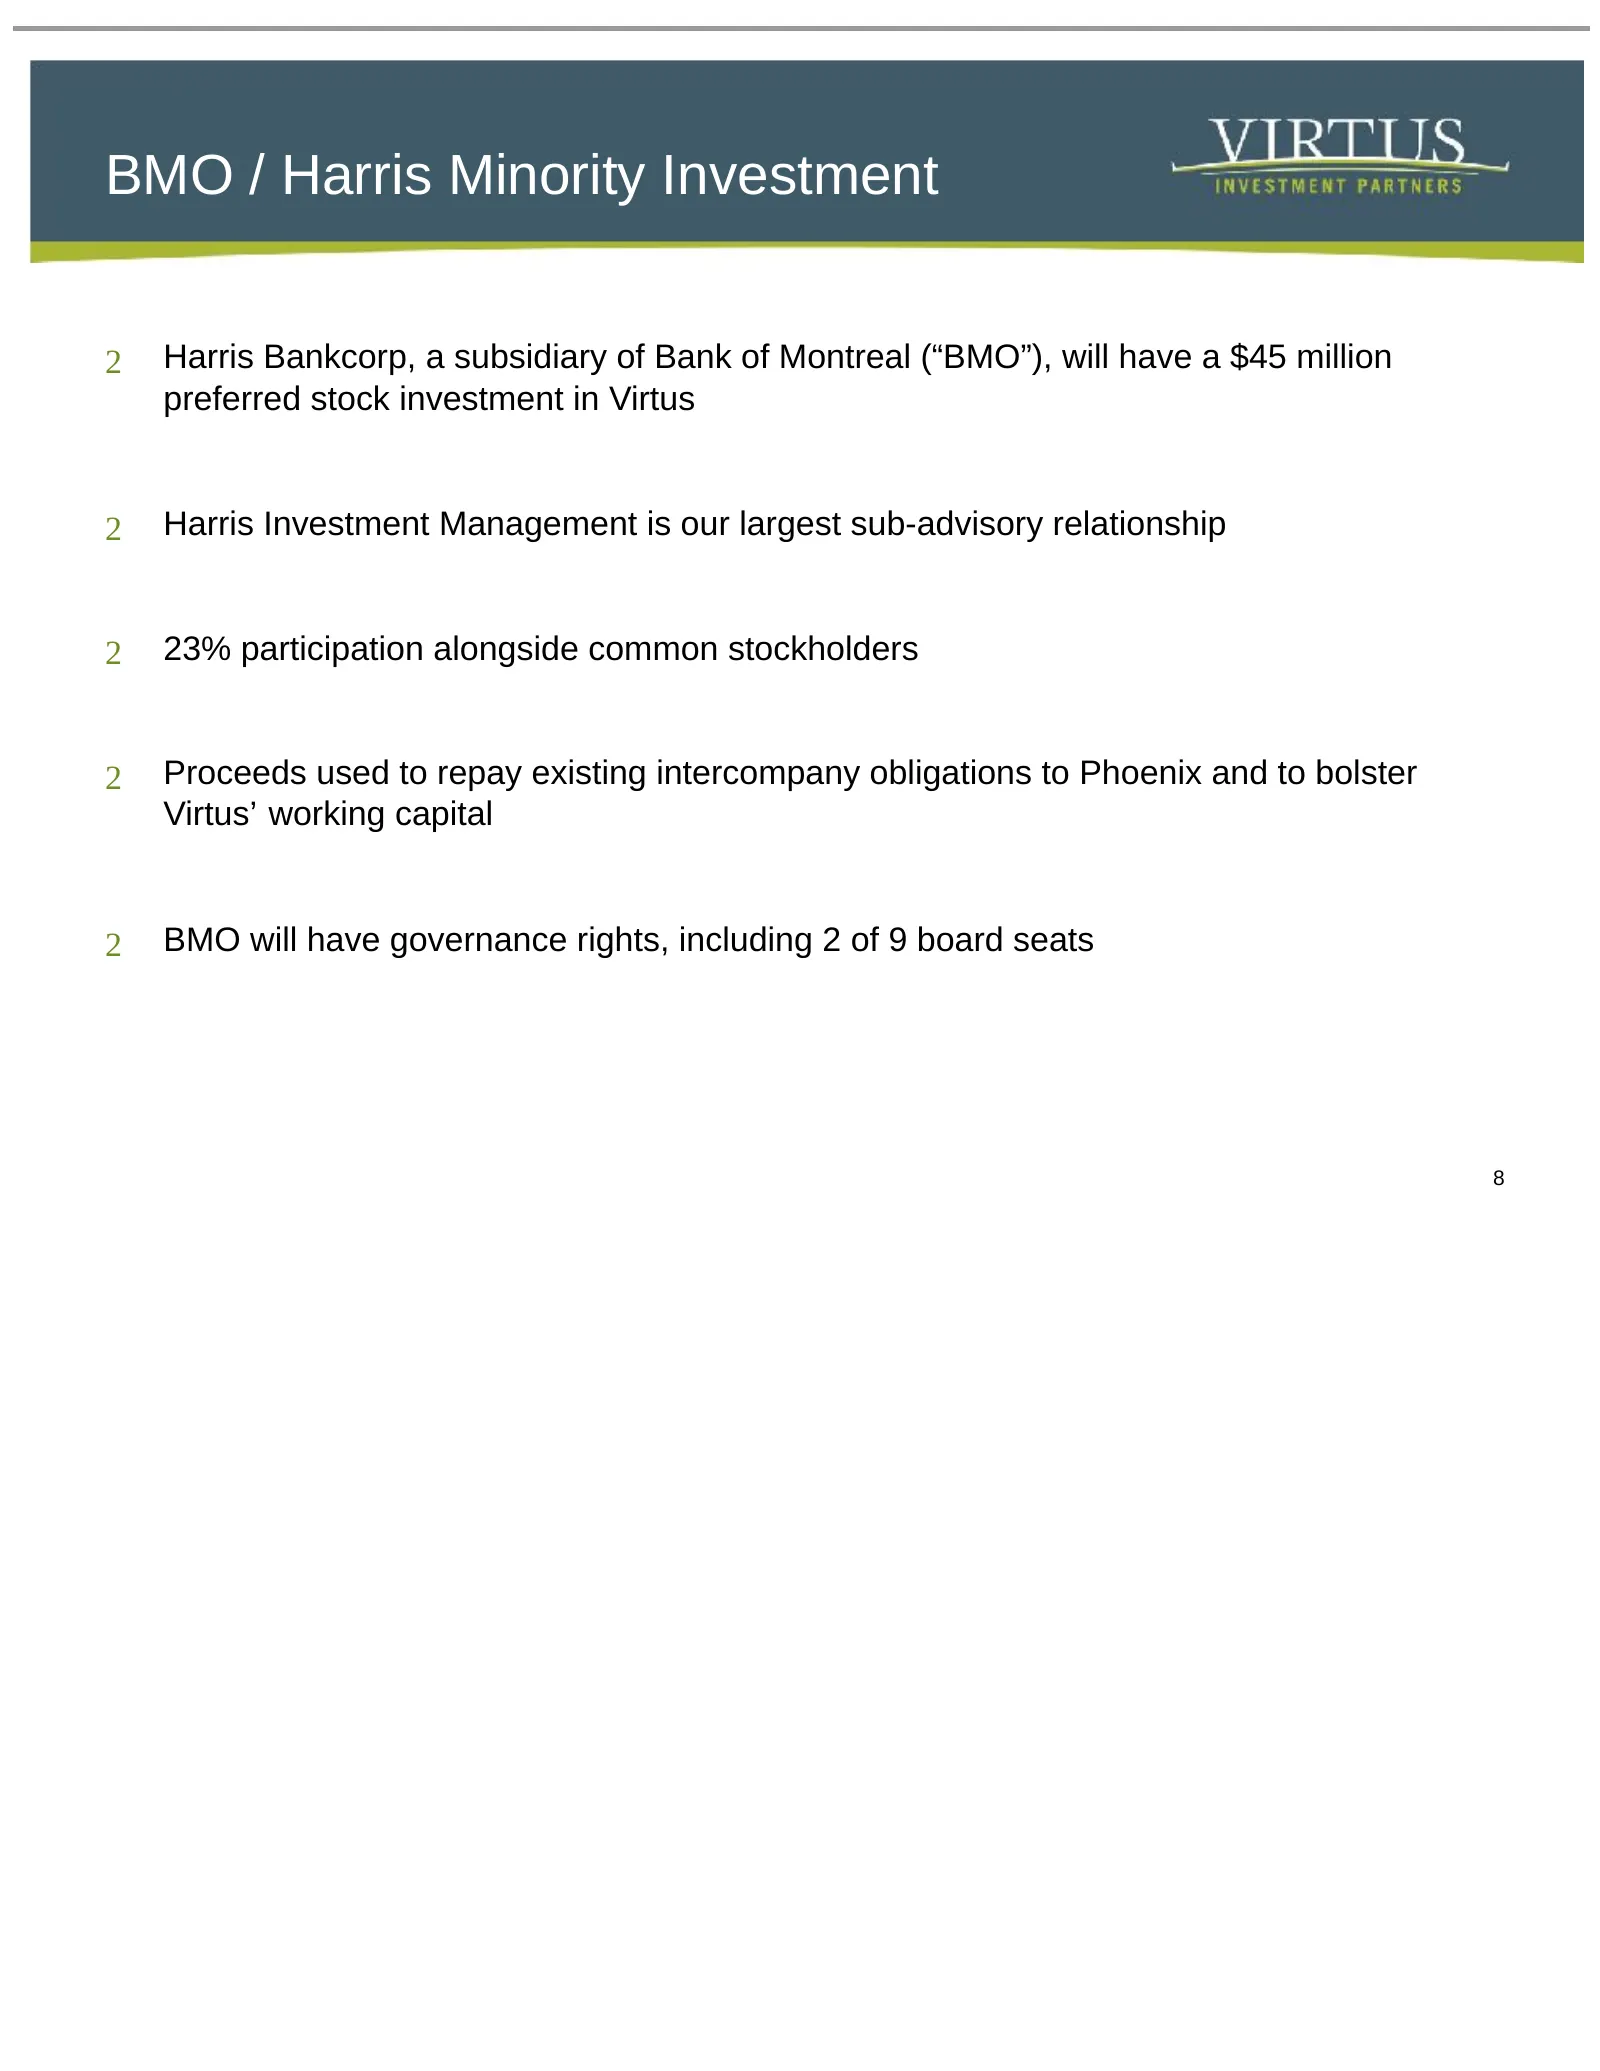
BMO / Harris Minority Investment 2 Harris Bankcorp, a subsidiary of Bank of Montreal (“BMO”), will have a $45 million preferred stock investment in Virtus 2 Harris Investment Management is our largest sub-advisory relationship 2 23% participation alongside common stockholders 2 Proceeds used to repa
Slide 9: Overview of Affiliated Managers
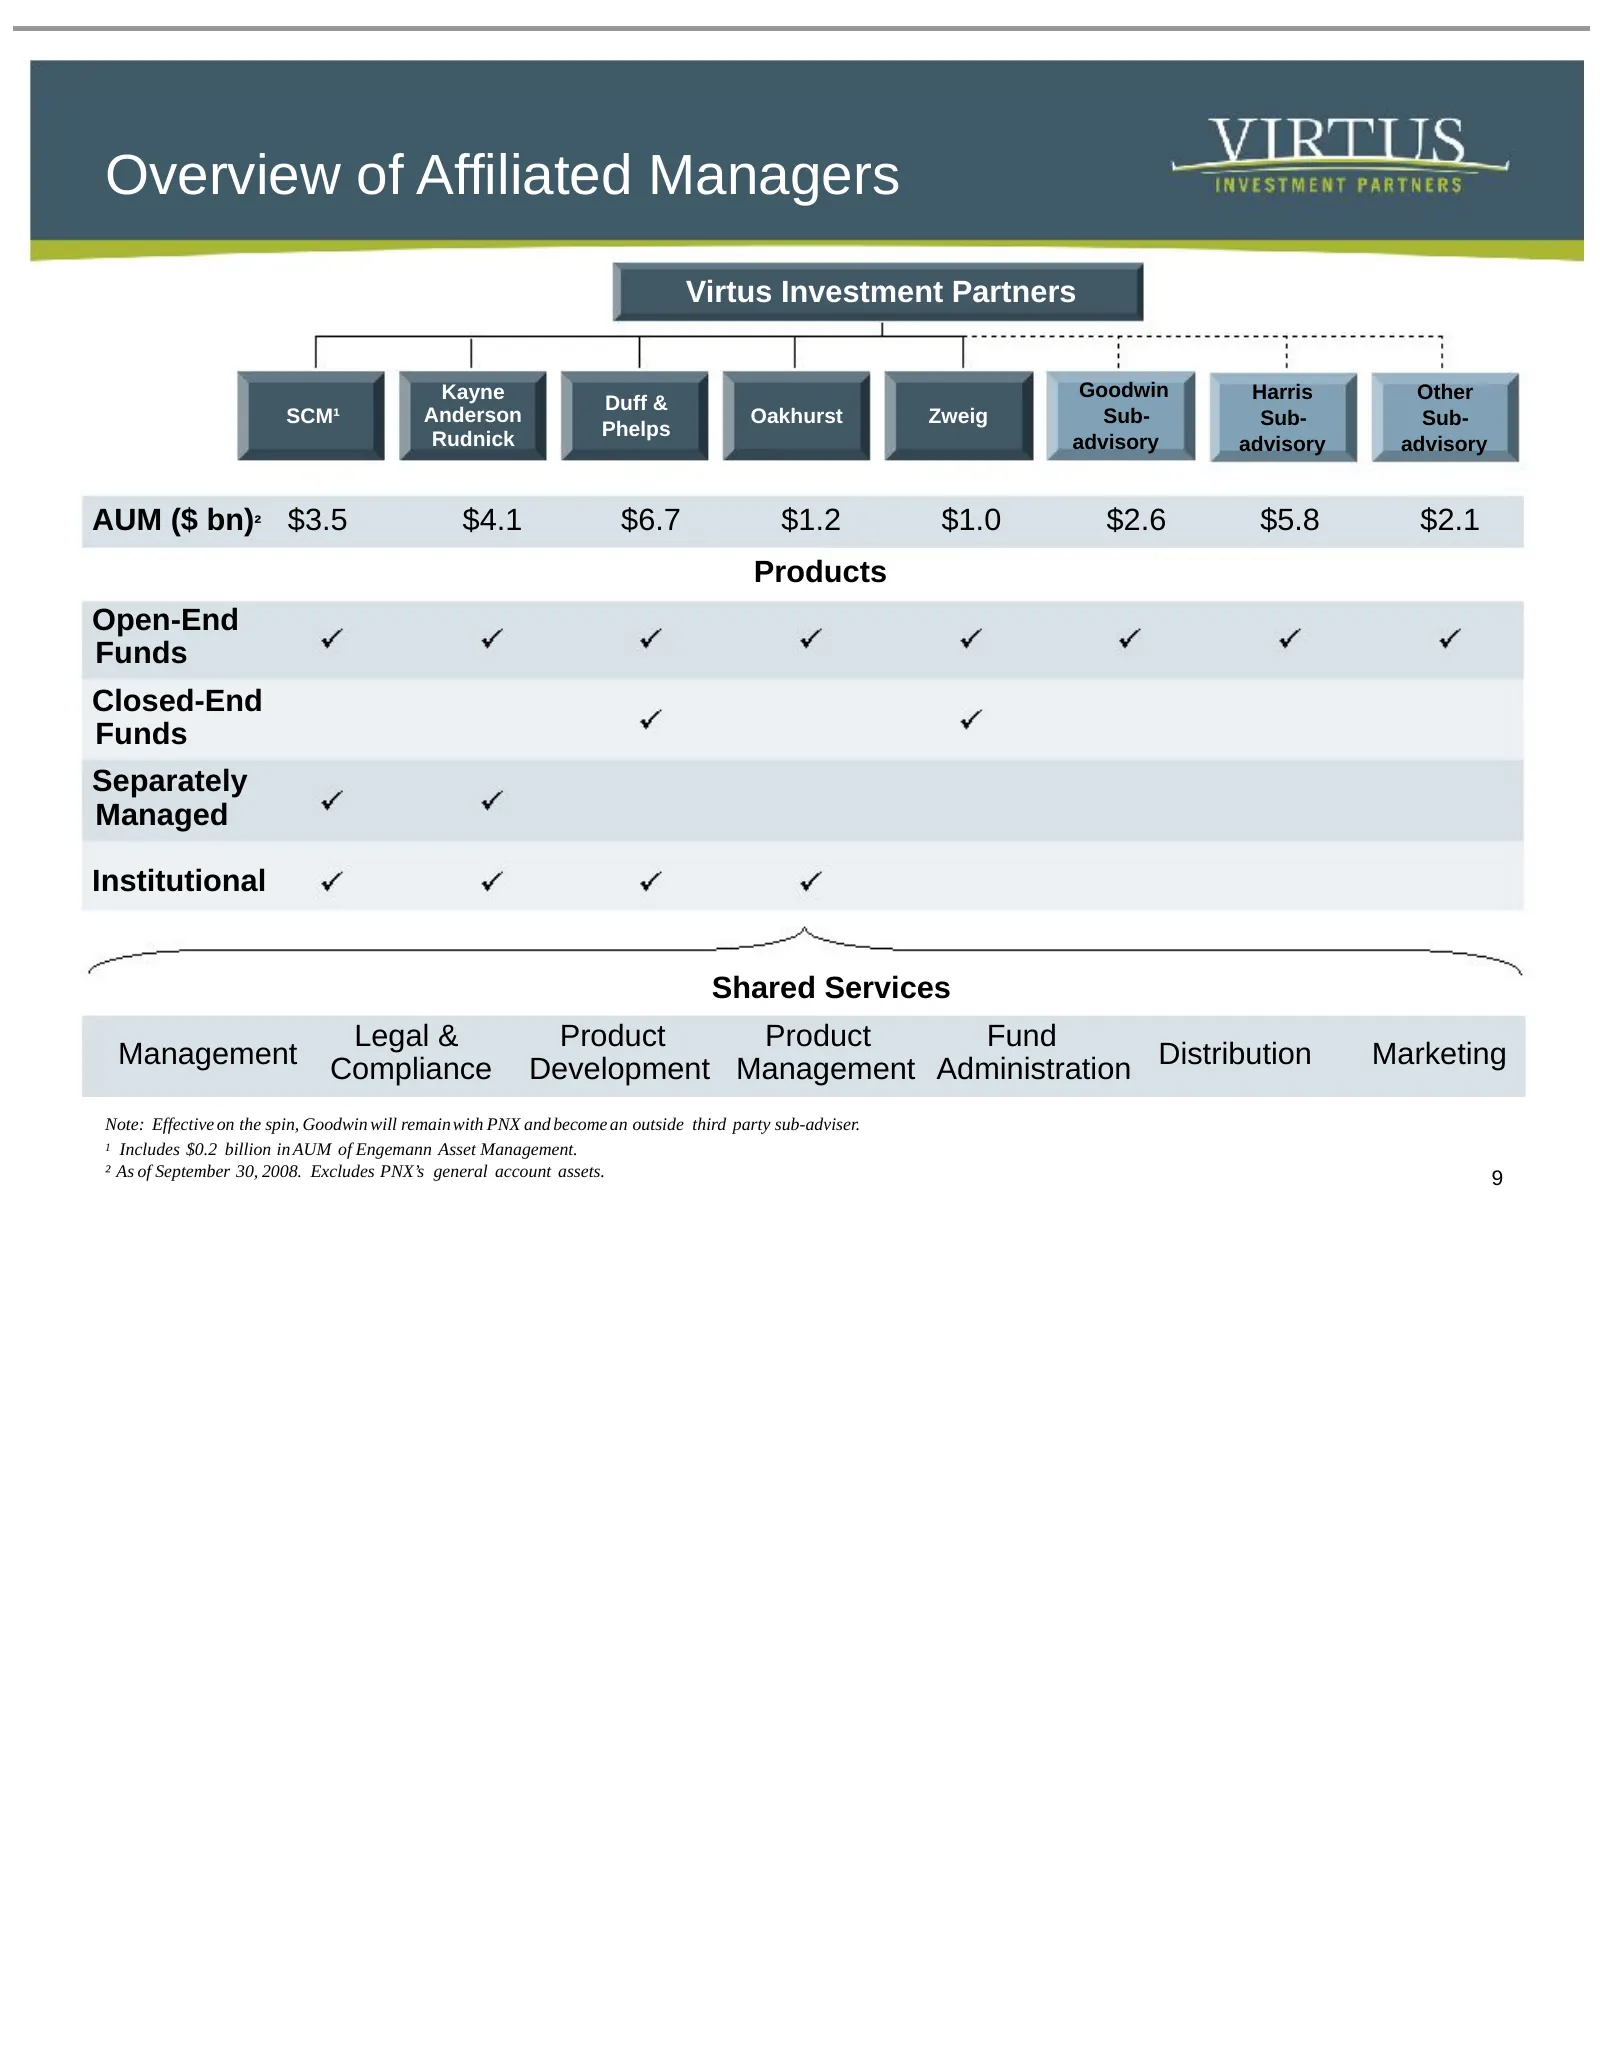
Overview of Affiliated Managers Virtus Investment Partners Kayne Goodwin Harris Other Duff & SCM¹ Anderson Oakhurst Zweig Sub- Sub- Sub- Rudnick Phelps advisory advisory advisory AUM ($ bn)² $3.5 $4.1 $6.7 $1.2 $1.0 $2.6 $5.8 $2.1 Products Open-End Funds Closed-End Funds Separately Managed Instituti
Slide 10: Virtus Strategy
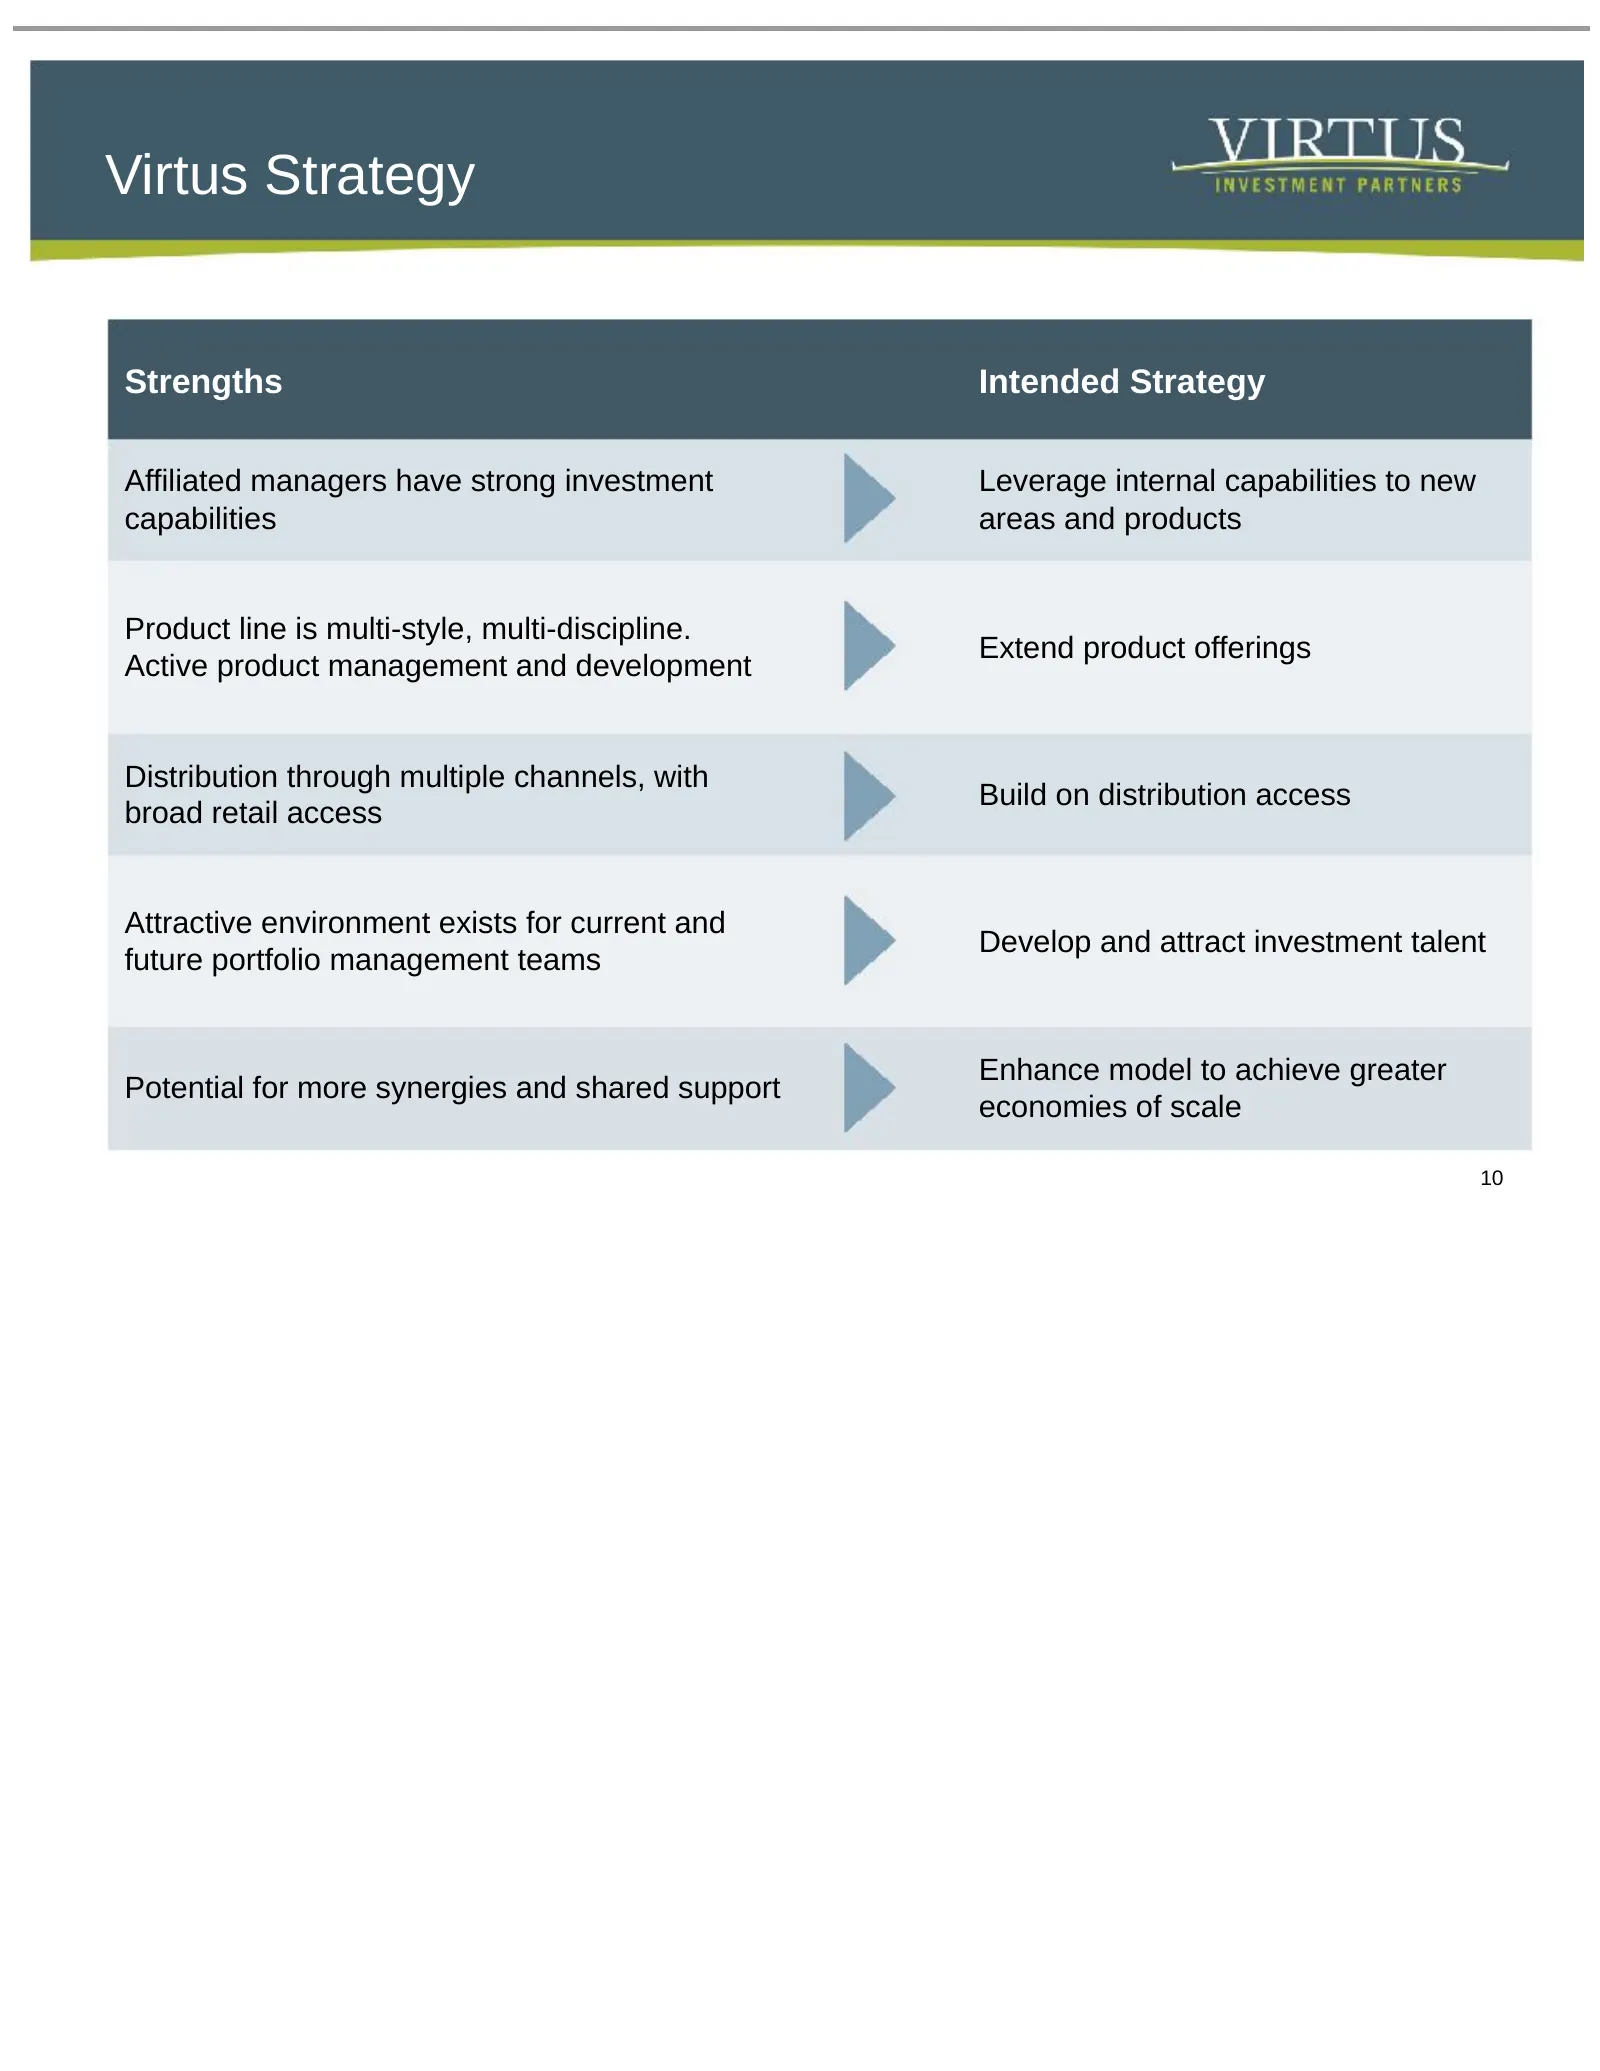
Virtus Strategy Strengths Intended Strategy Affiliated managers have strong investment Leverage internal capabilities to new capabilities areas and products Product line is multi-style, multi-discipline. Extend product offerings Active product management and development Distribution through multiple
Slide 11: Strong Investment Performance
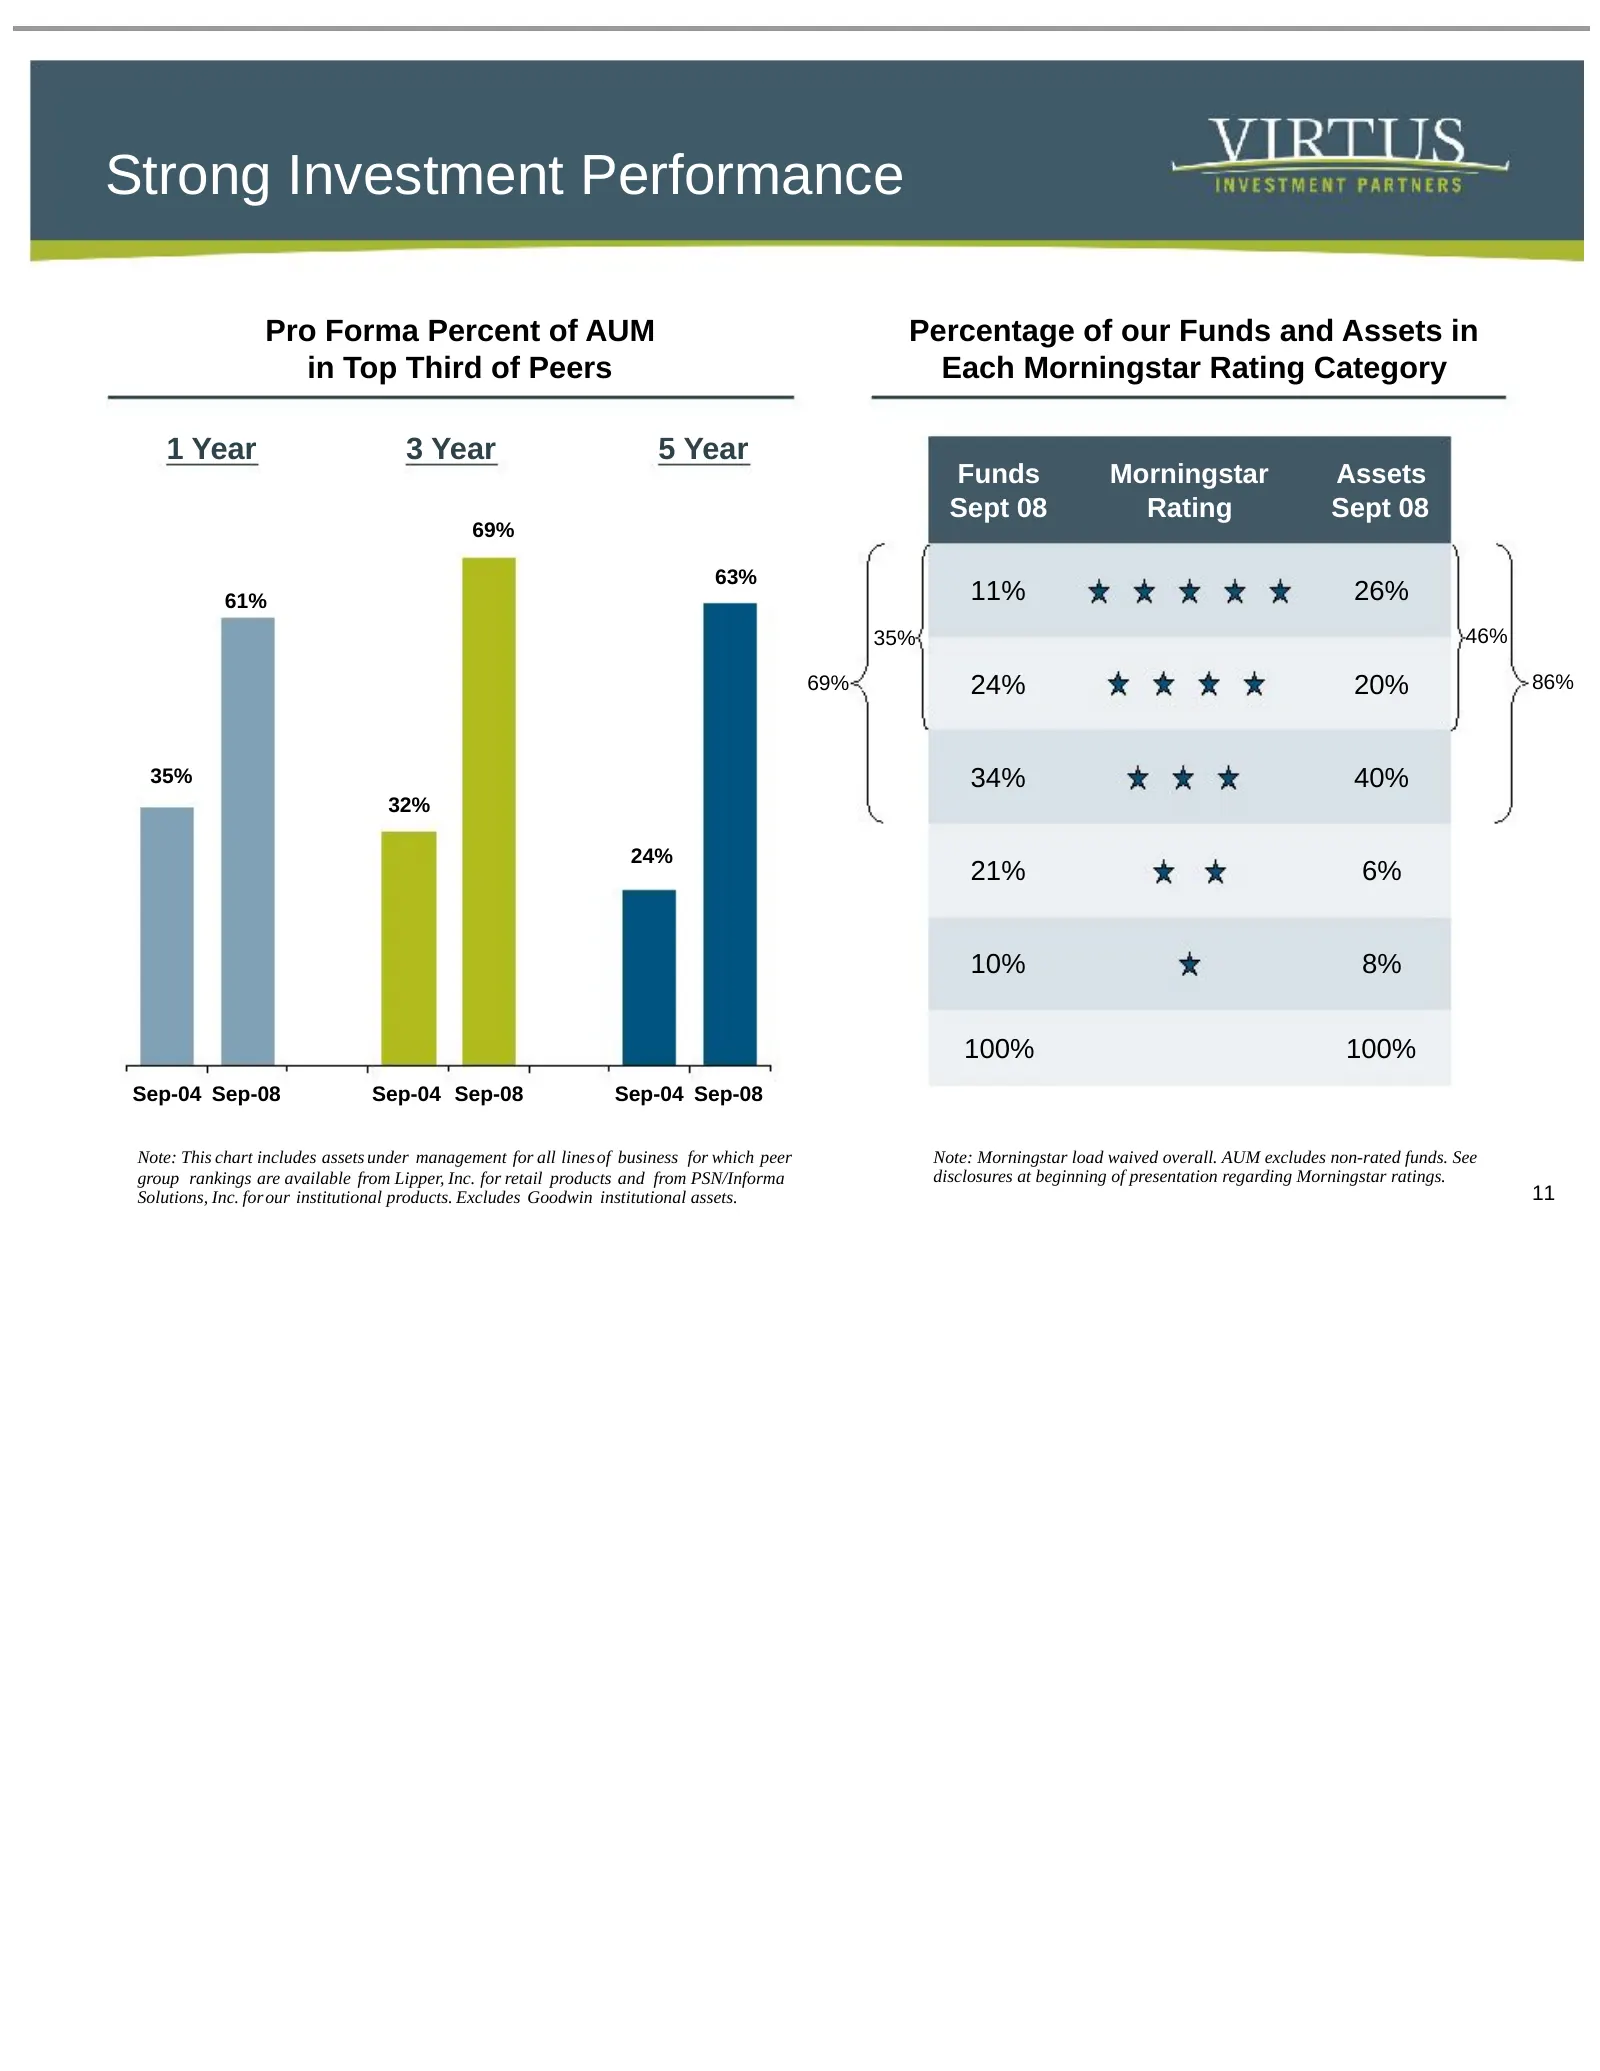
Strong Investment Performance Pro Forma Percent of AUM Percentage of our Funds and Assets in in Top Third of Peers Each Morningstar Rating Category 1 Year 3 Year 5 Year Funds Morningstar Assets Sept 08 Rating Sept 08 69% 63% 61% 11% 26% 35% 46% 69% 24% 20% 86% 35% 34% 40% 32% 24% 21% 6% 10% 8% 100%
Slide 12: Leveraging Performance into Sales
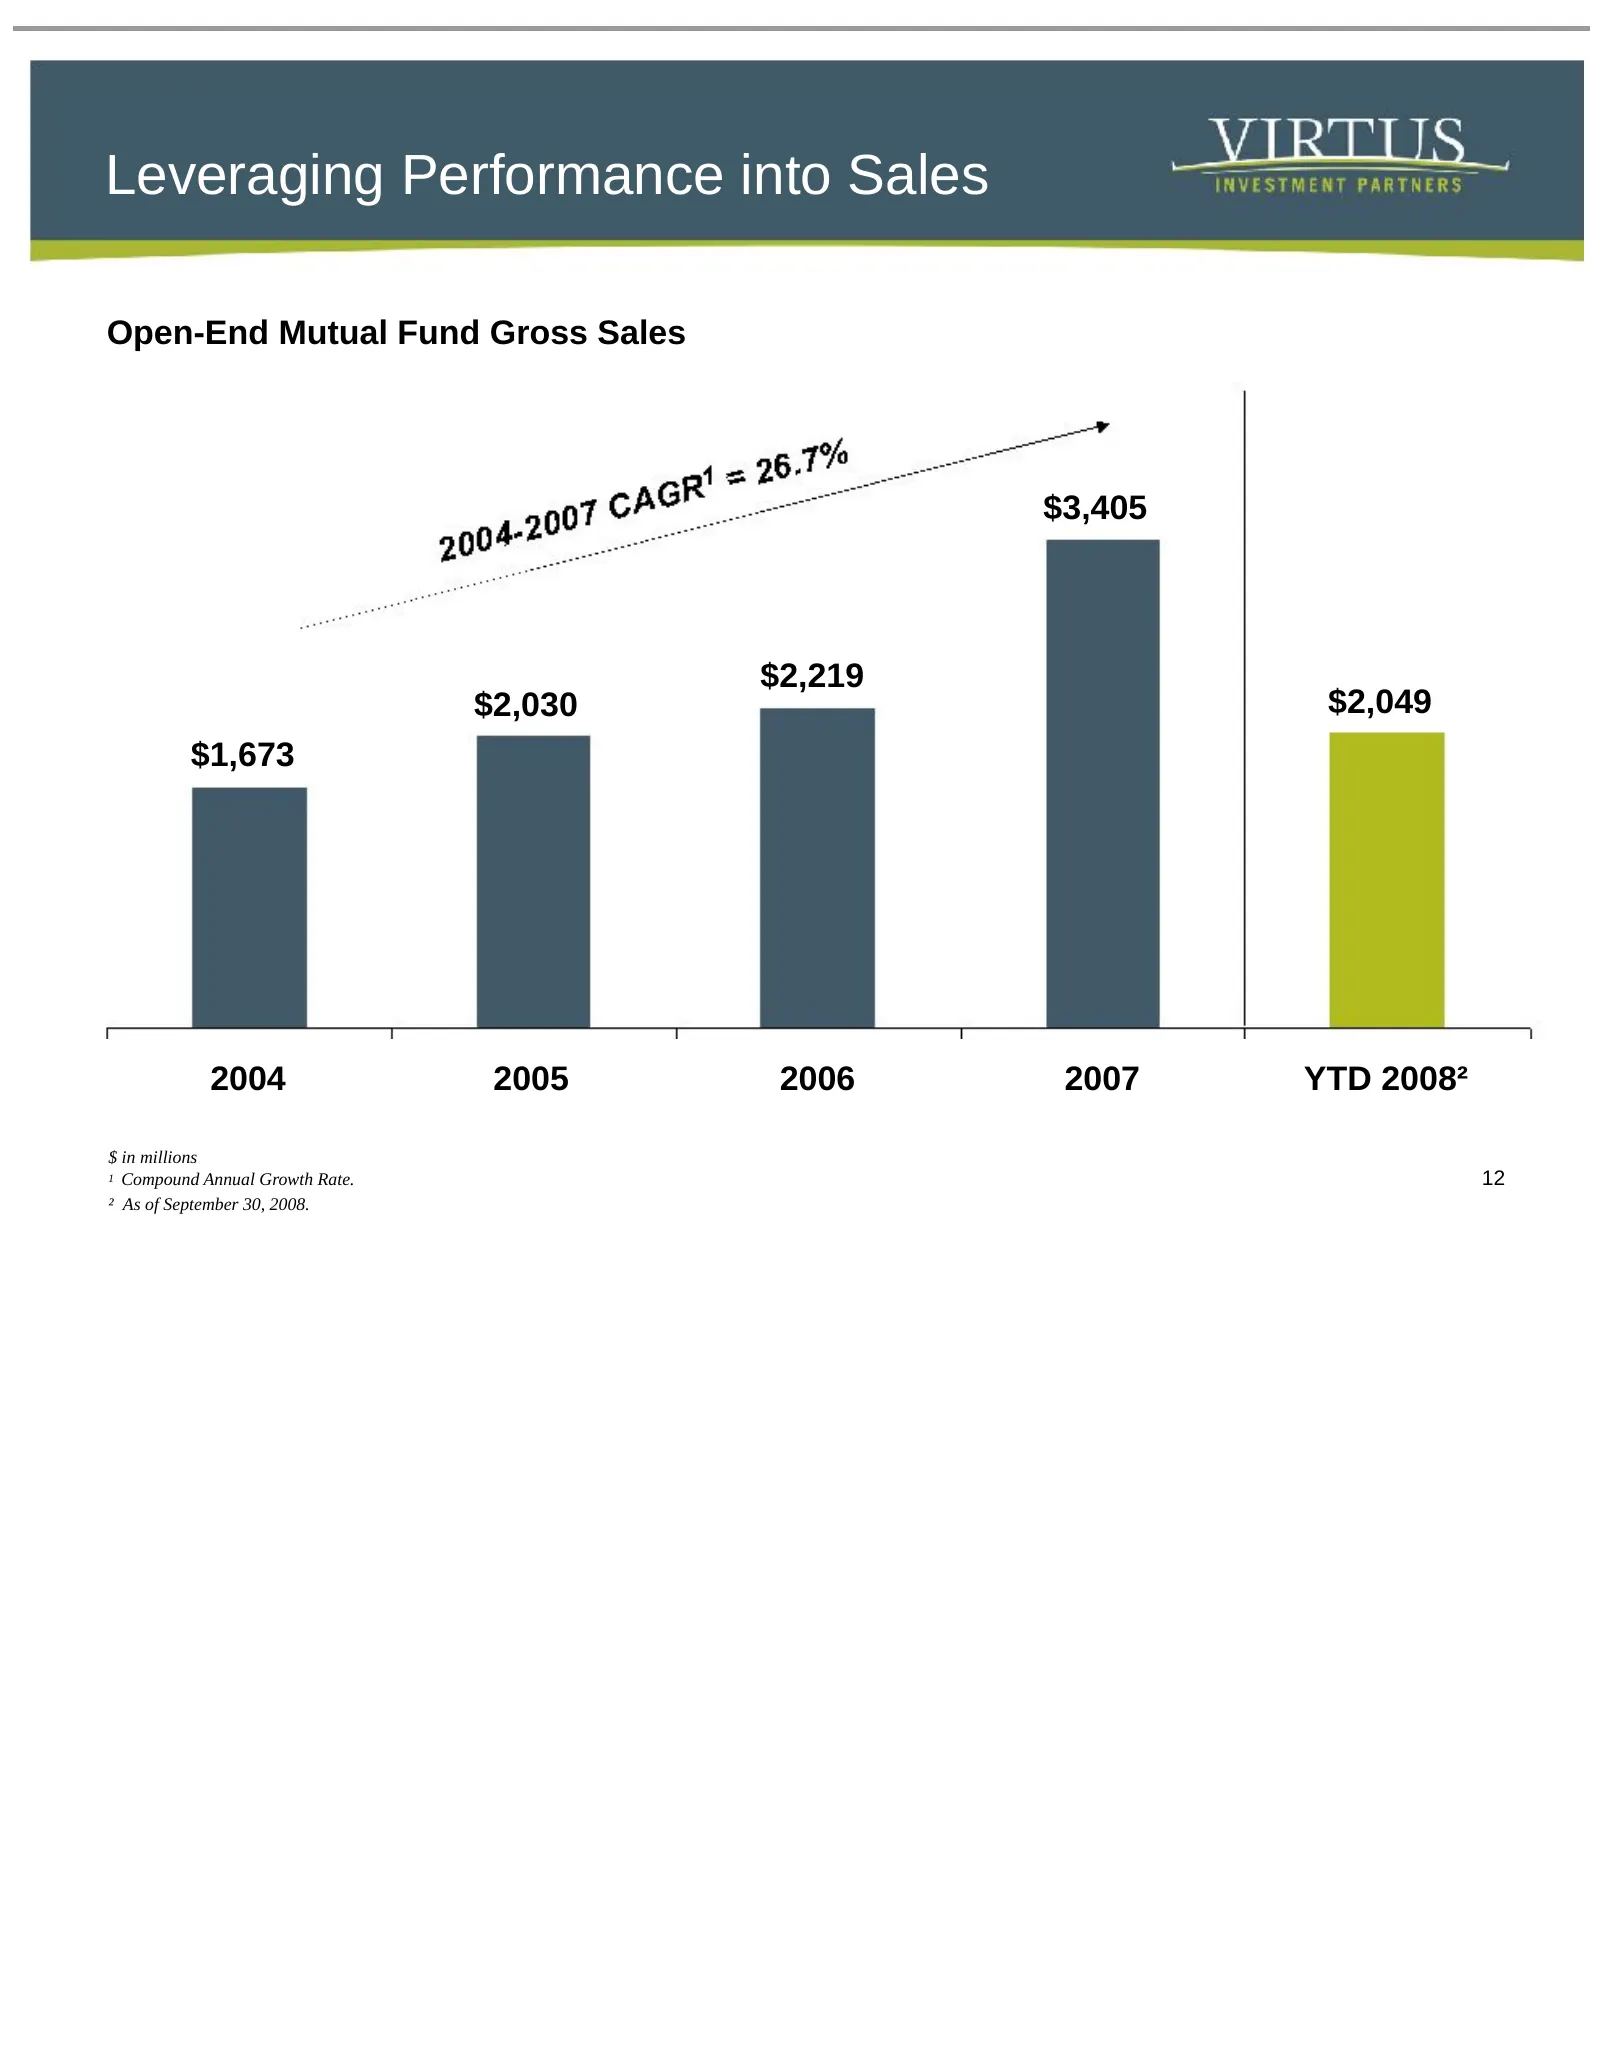
Leveraging Performance into Sales Open-End Mutual Fund Gross Sales $3,405 $2,219 $2,030 $2,049 $1,673 2004 2005 2006 2007 YTD 2008² $ in millions 1 Compound Annual Growth Rate. 12 ² As of September 30, 2008.
Slide 13: Diversified Distribution Platform
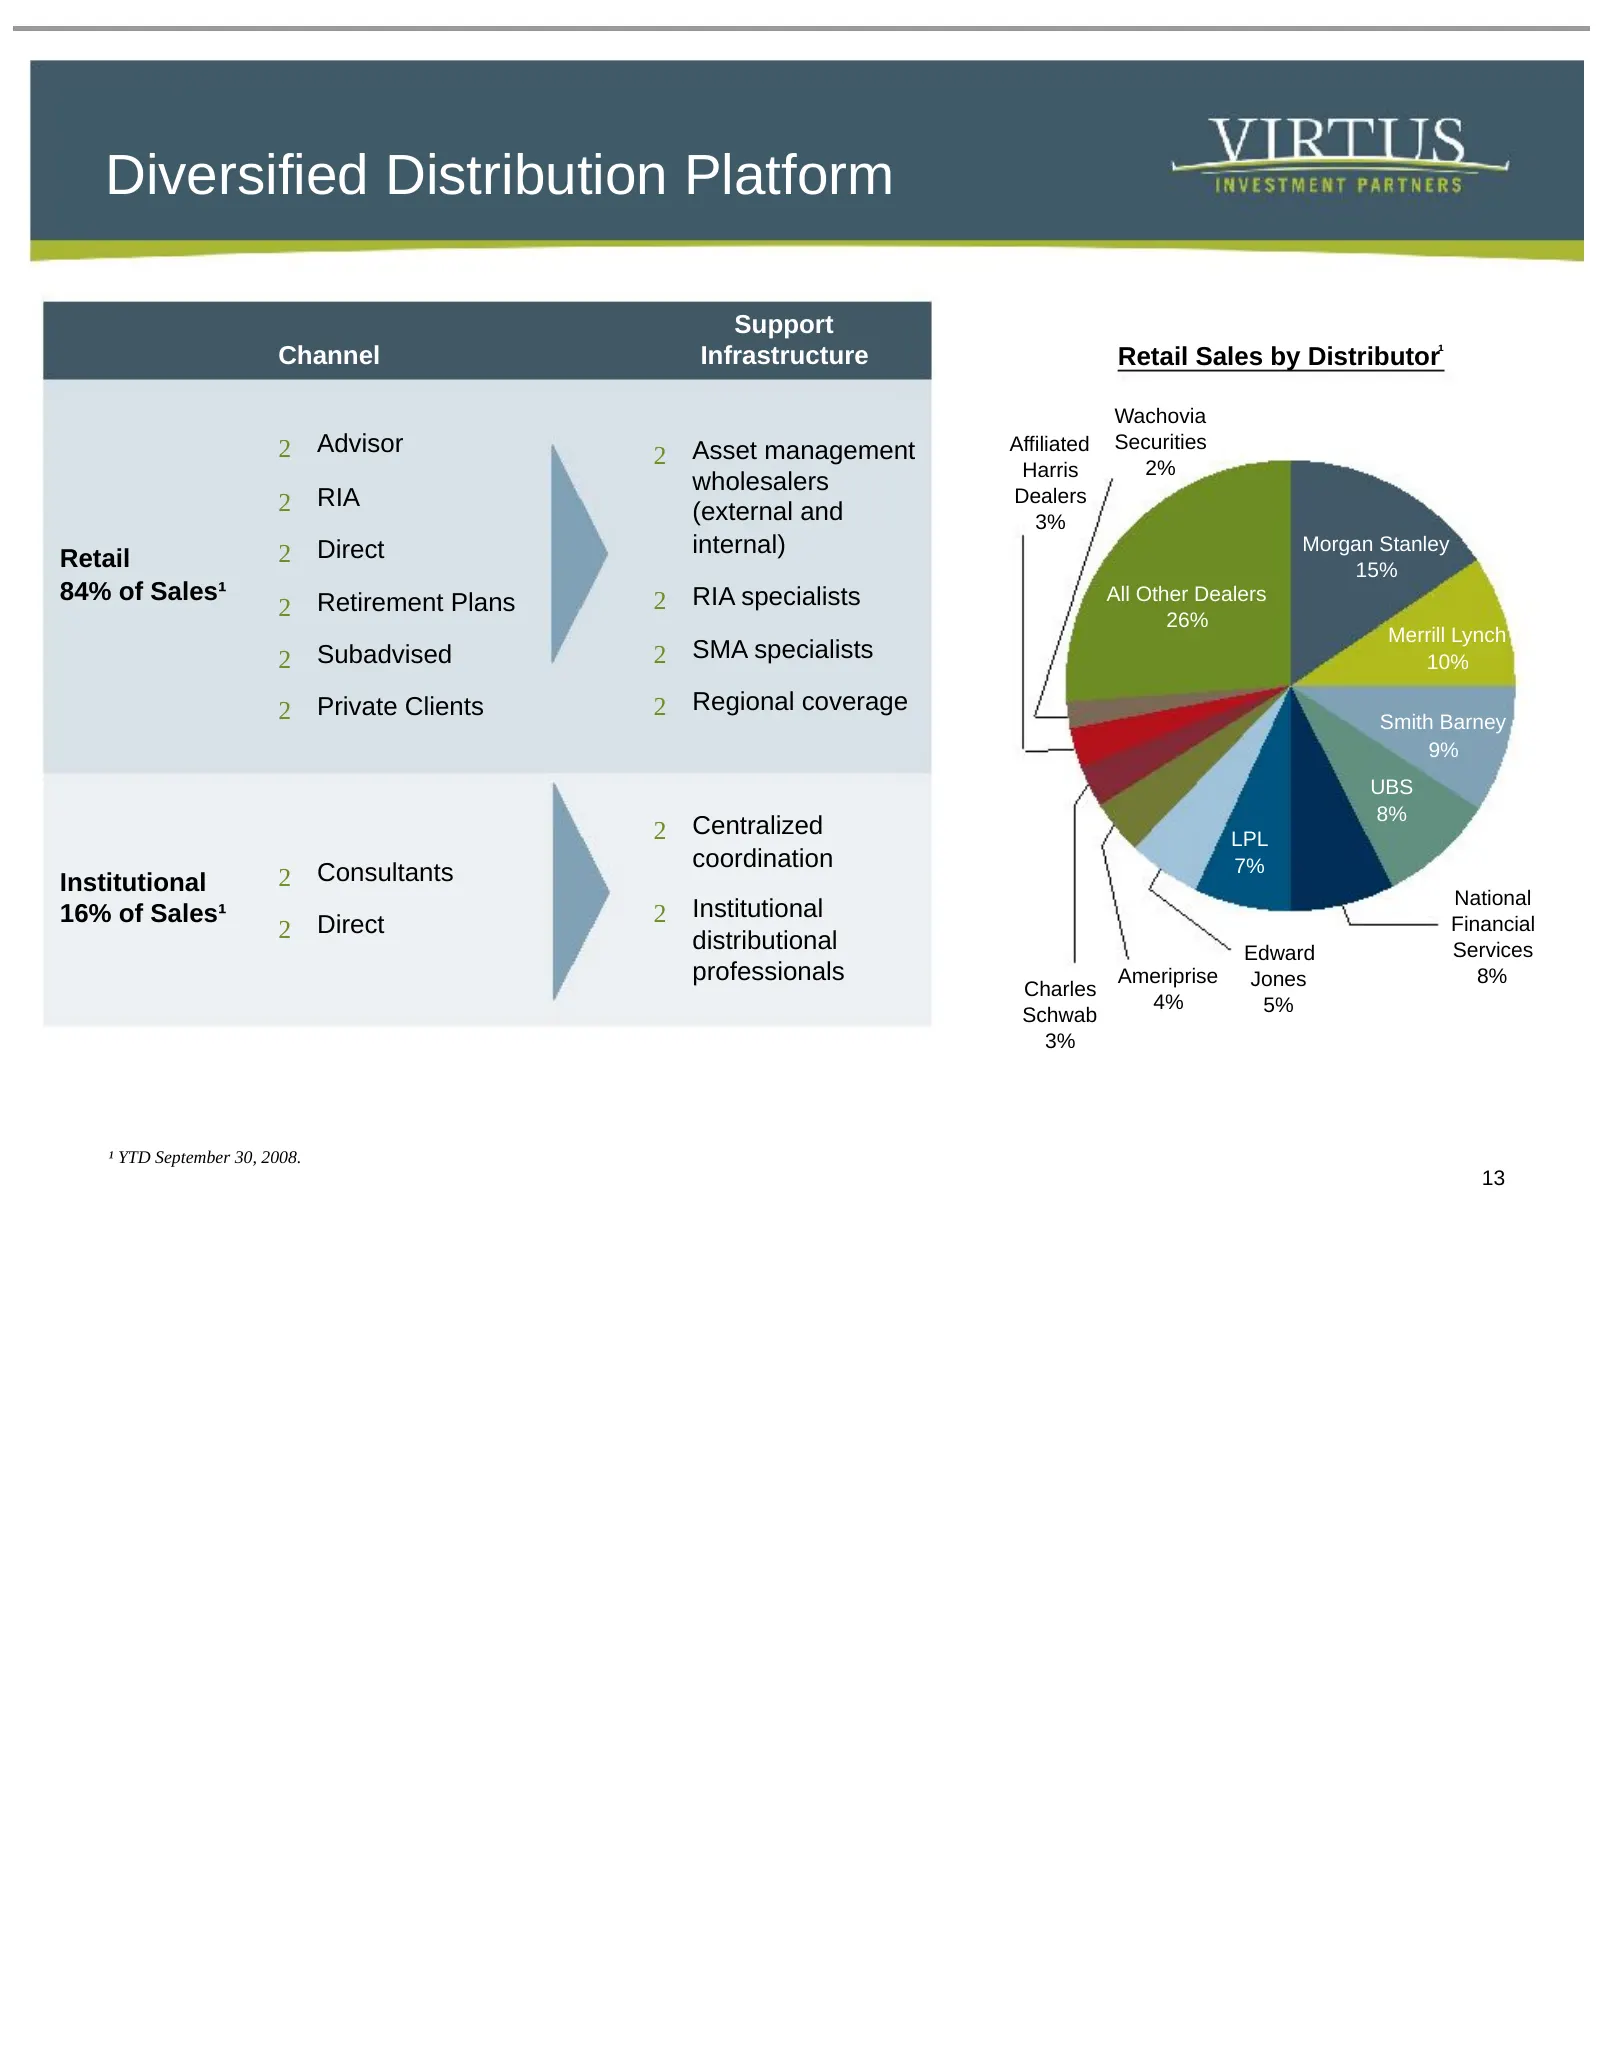
Diversified Distribution Platform Support Channel Infrastructure Retail Sales by Distributor¹ Wachovia 2 Advisor 2 Asset management Affiliated Securities Harris 2% wholesalers 2 RIA Dealers (external and 3% 2 Direct internal) Morgan Stanley Retail 15% 84% of Sales¹ Retirement Plans 2 RIA specialists
Slide 14: Current Sources of Flows
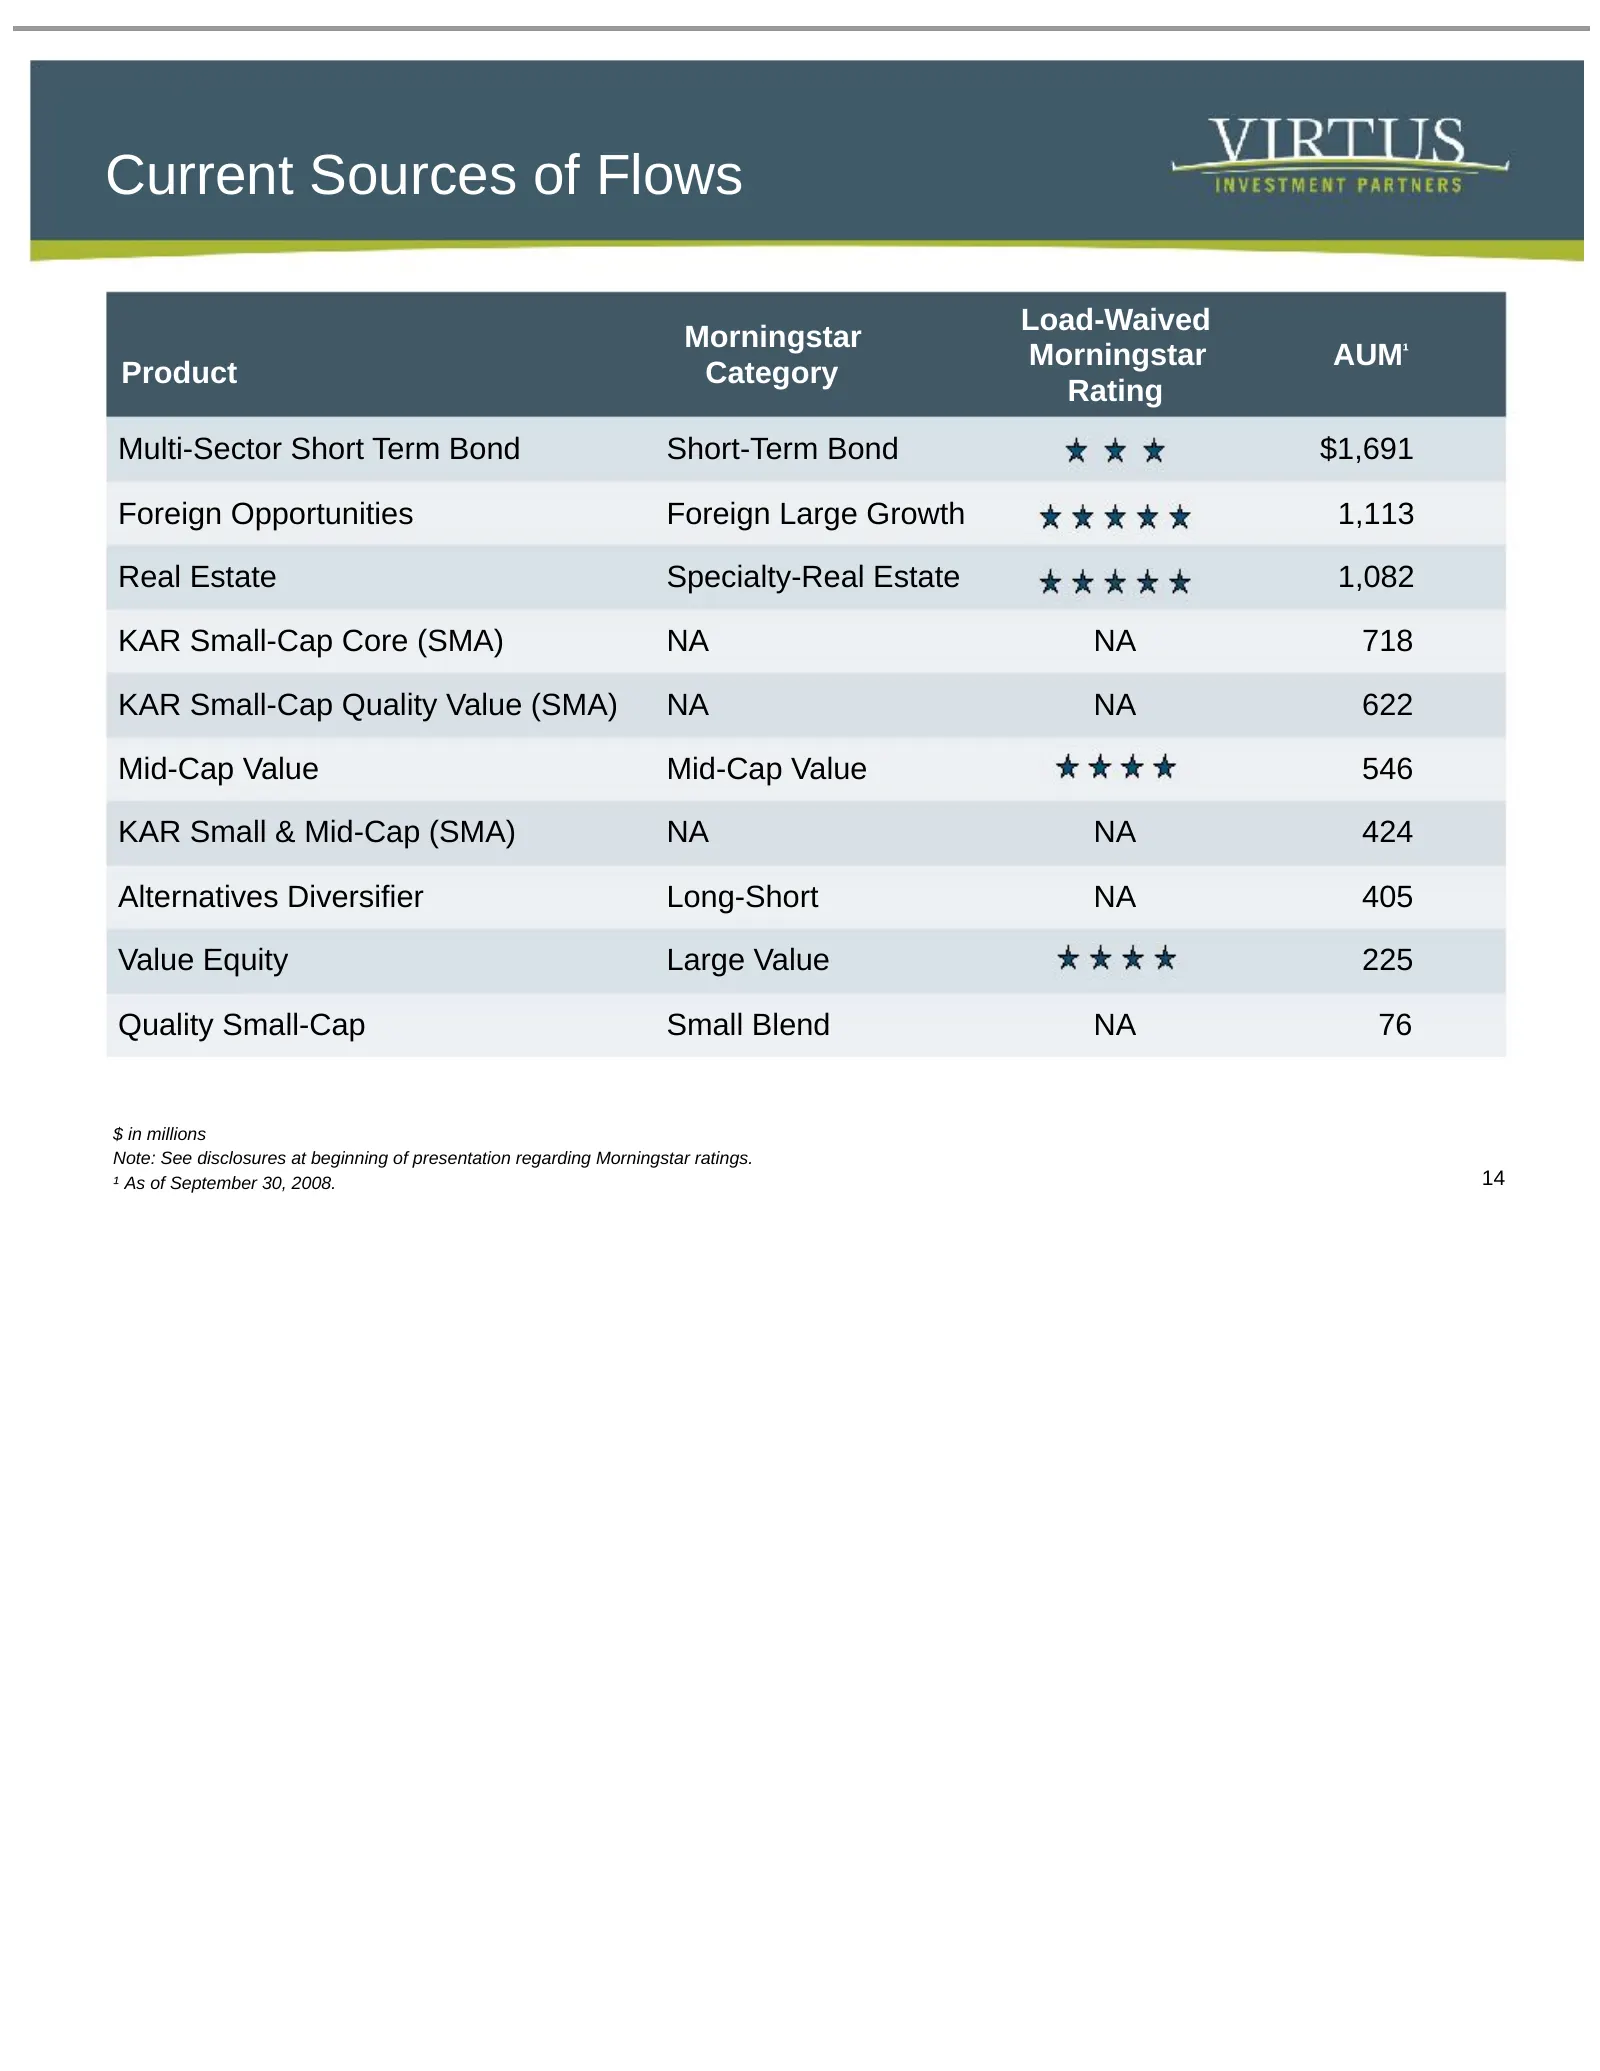
Current Sources of Flows Load-Waived Morningstar Morningstar AUM¹ Product Category Rating Multi-Sector Short Term Bond Short-Term Bond $1,691 Foreign Opportunities Foreign Large Growth 1,113 Real Estate Specialty-Real Estate 1,082 KAR Small-Cap Core (SMA) NA NA 718 KAR Small-Cap Quality Value (SMA)
Slide 15: Emerging Products
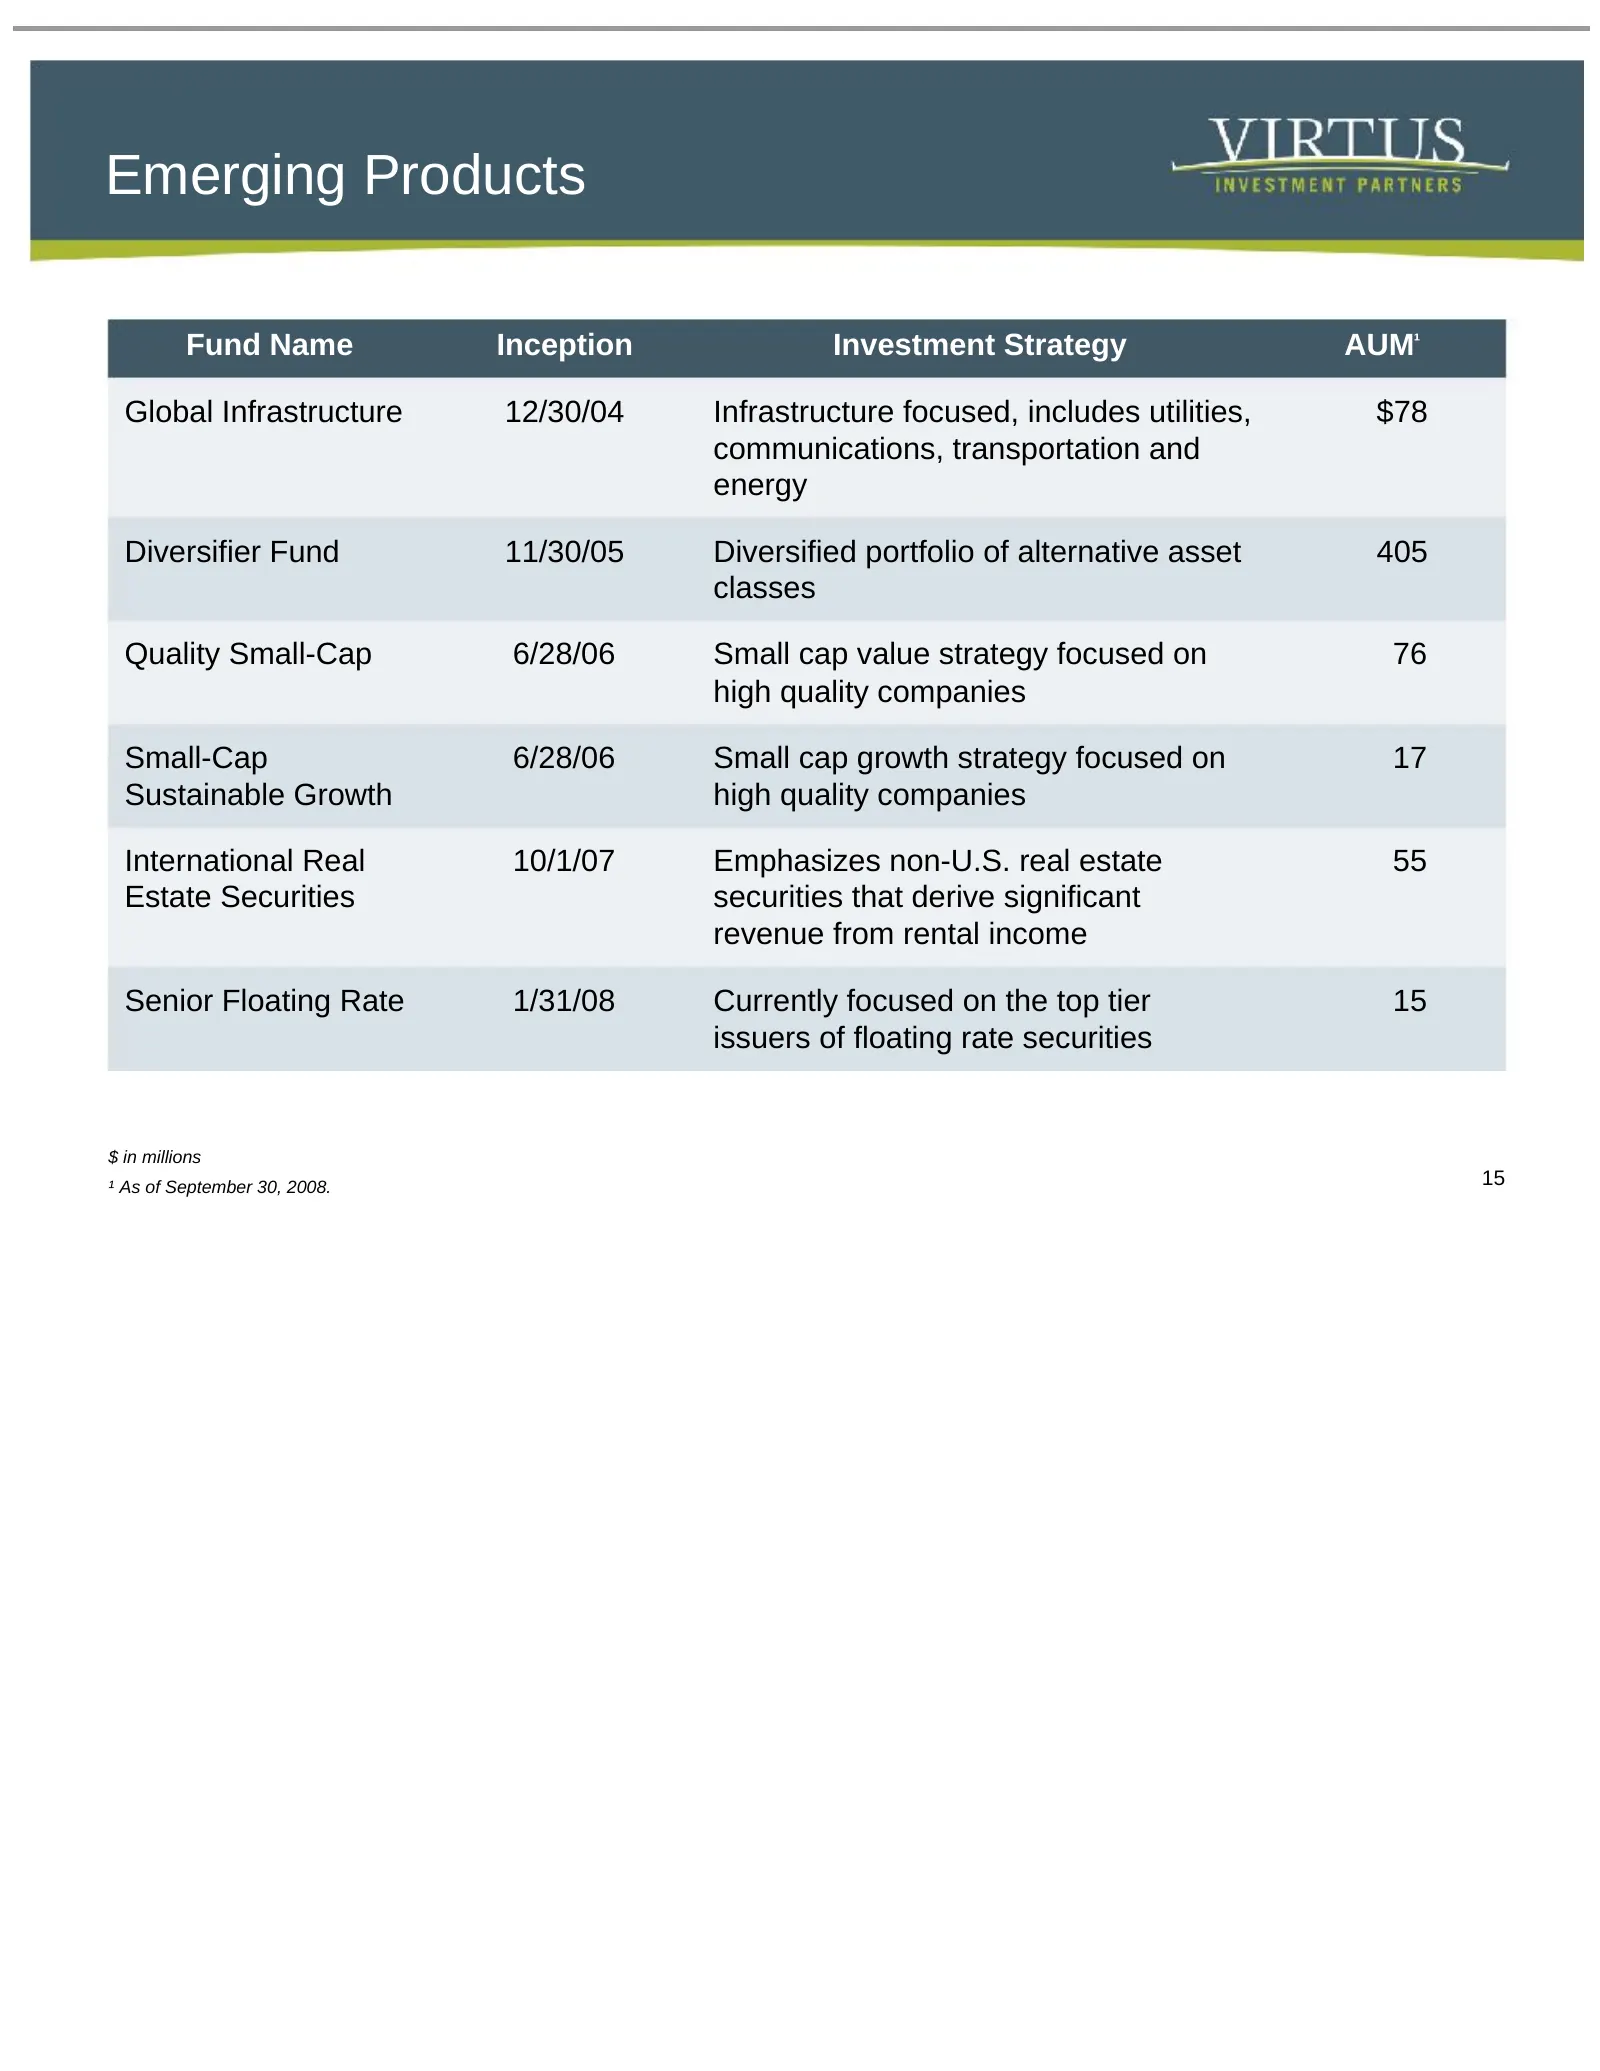
Emerging Products Fund Name Inception Investment Strategy AUM¹ Global Infrastructure 12/30/04 Infrastructure focused, includes utilities, $78 communications, transportation and energy Diversifier Fund 11/30/05 Diversified portfolio of alternative asset 405 classes Quality Small-Cap 6/28/06 Small cap
Slide 16: Financial Summary
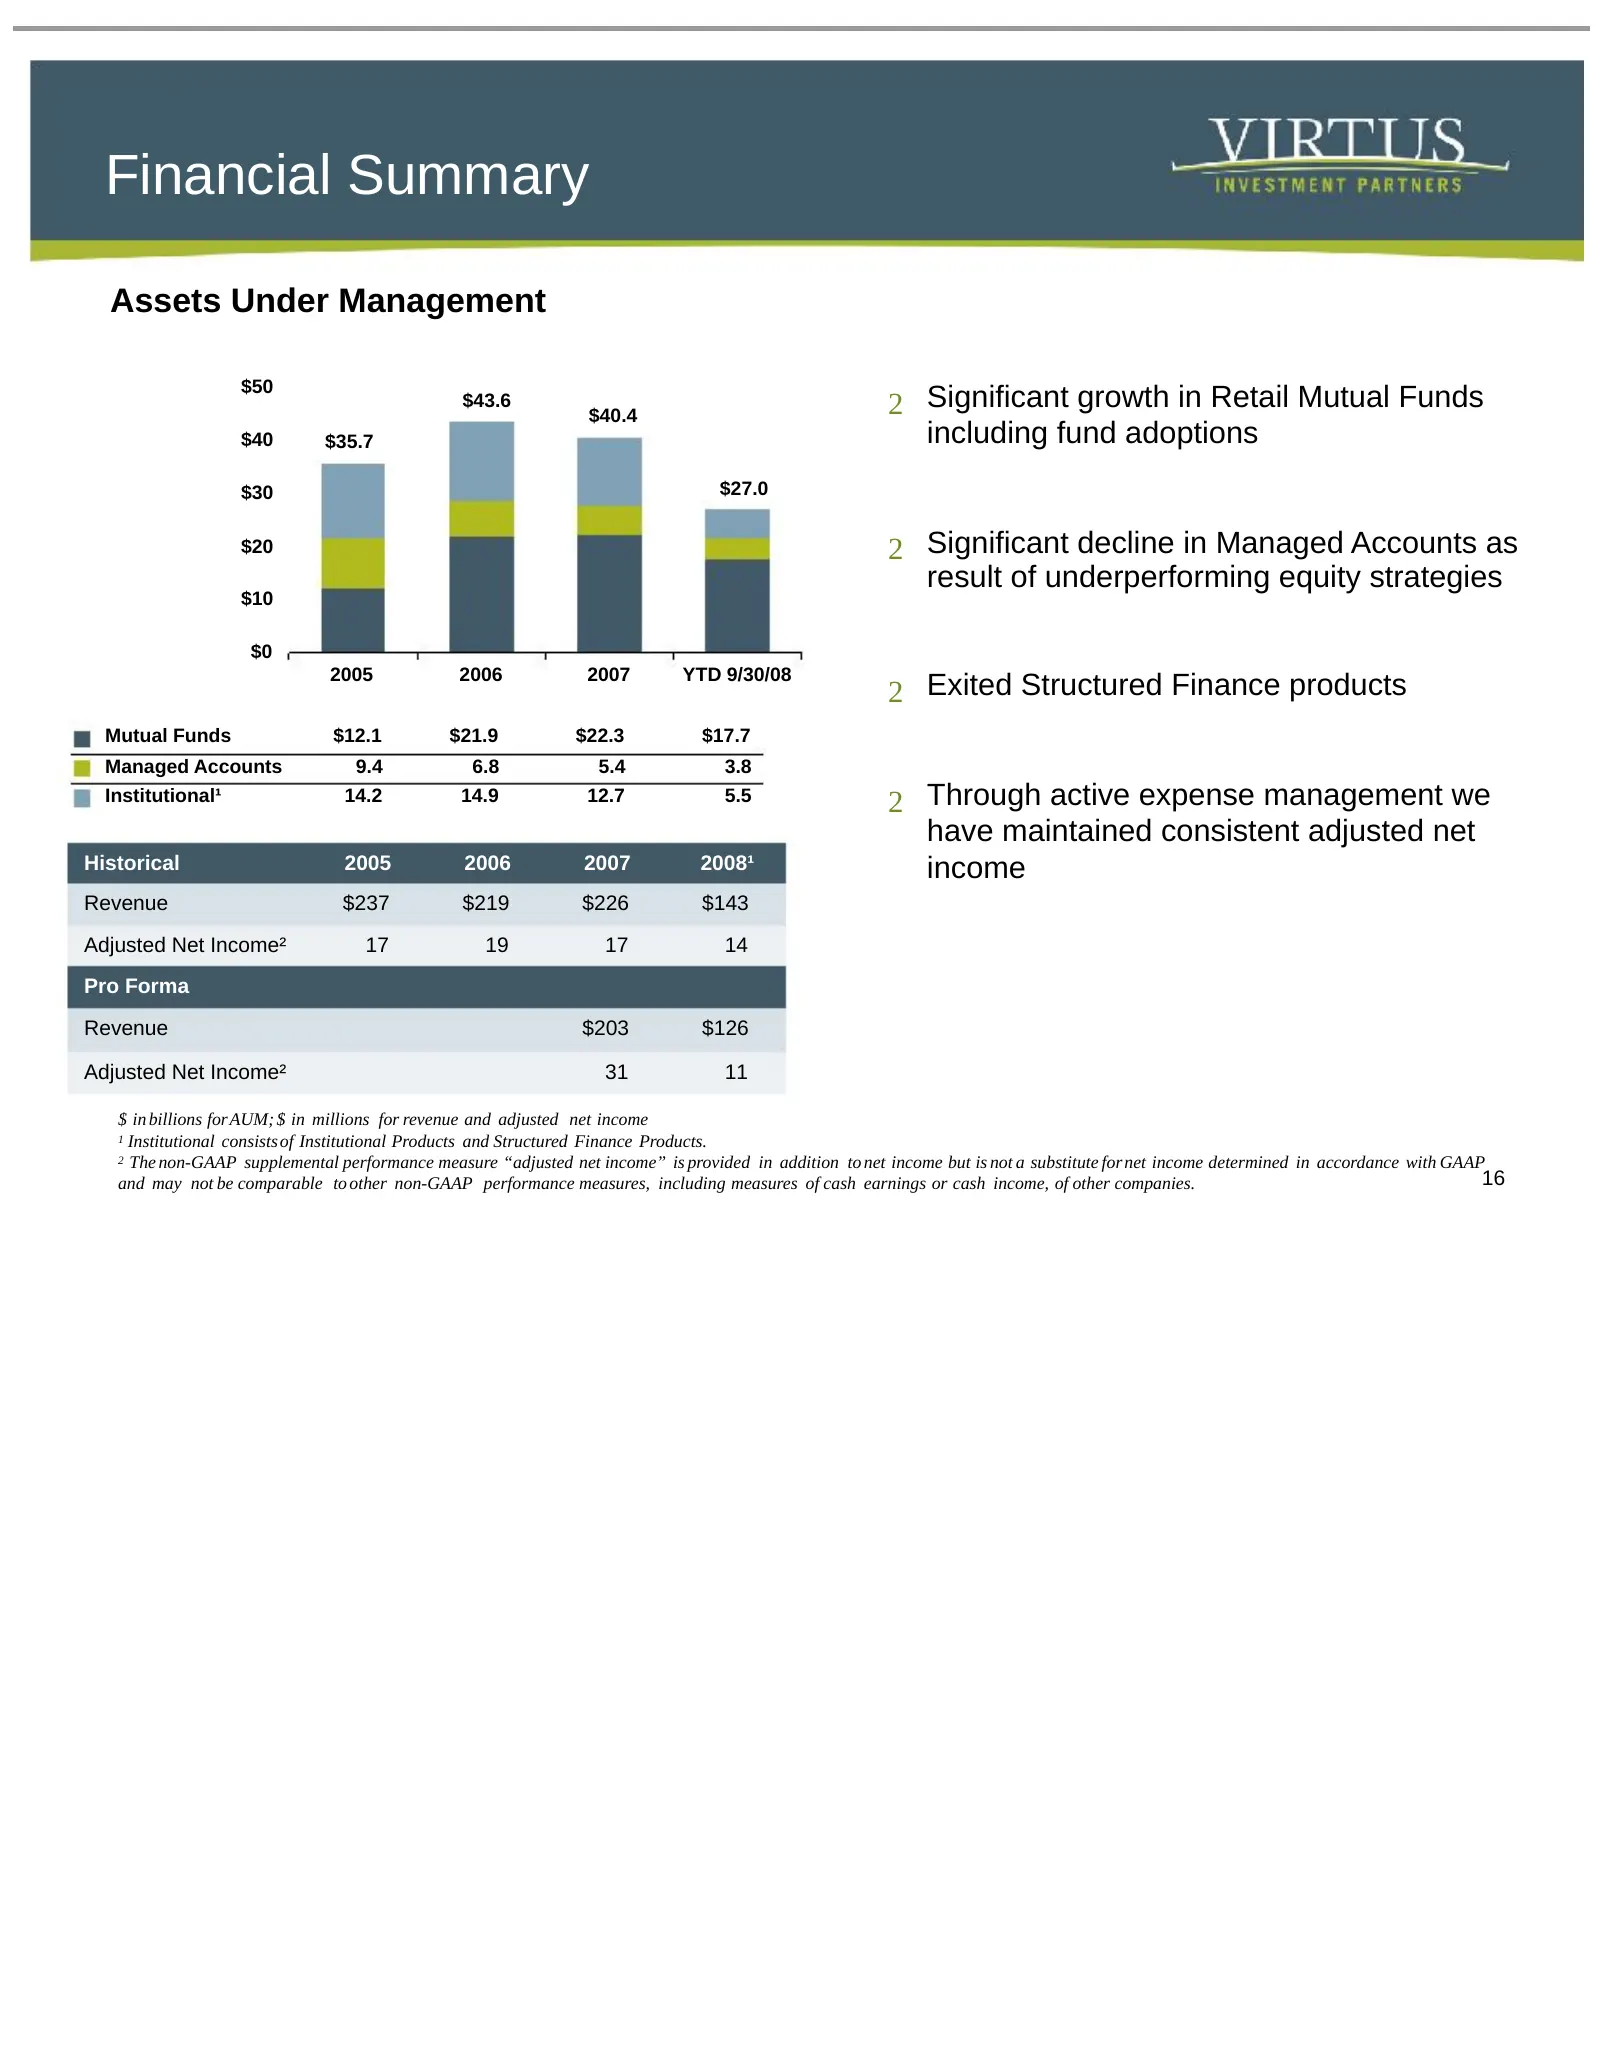
Financial Summary Assets Under Management $50 $43.6 $40.4 2 Significant growth in Retail Mutual Funds $40 $35.7 including fund adoptions $30 $27.0 $20 2 Significant decline in Managed Accounts as result of underperforming equity strategies $10 $0 2005 2006 2007 YTD 9/30/08 2 Exited Structured Financ
Slide 17: Financial Summary
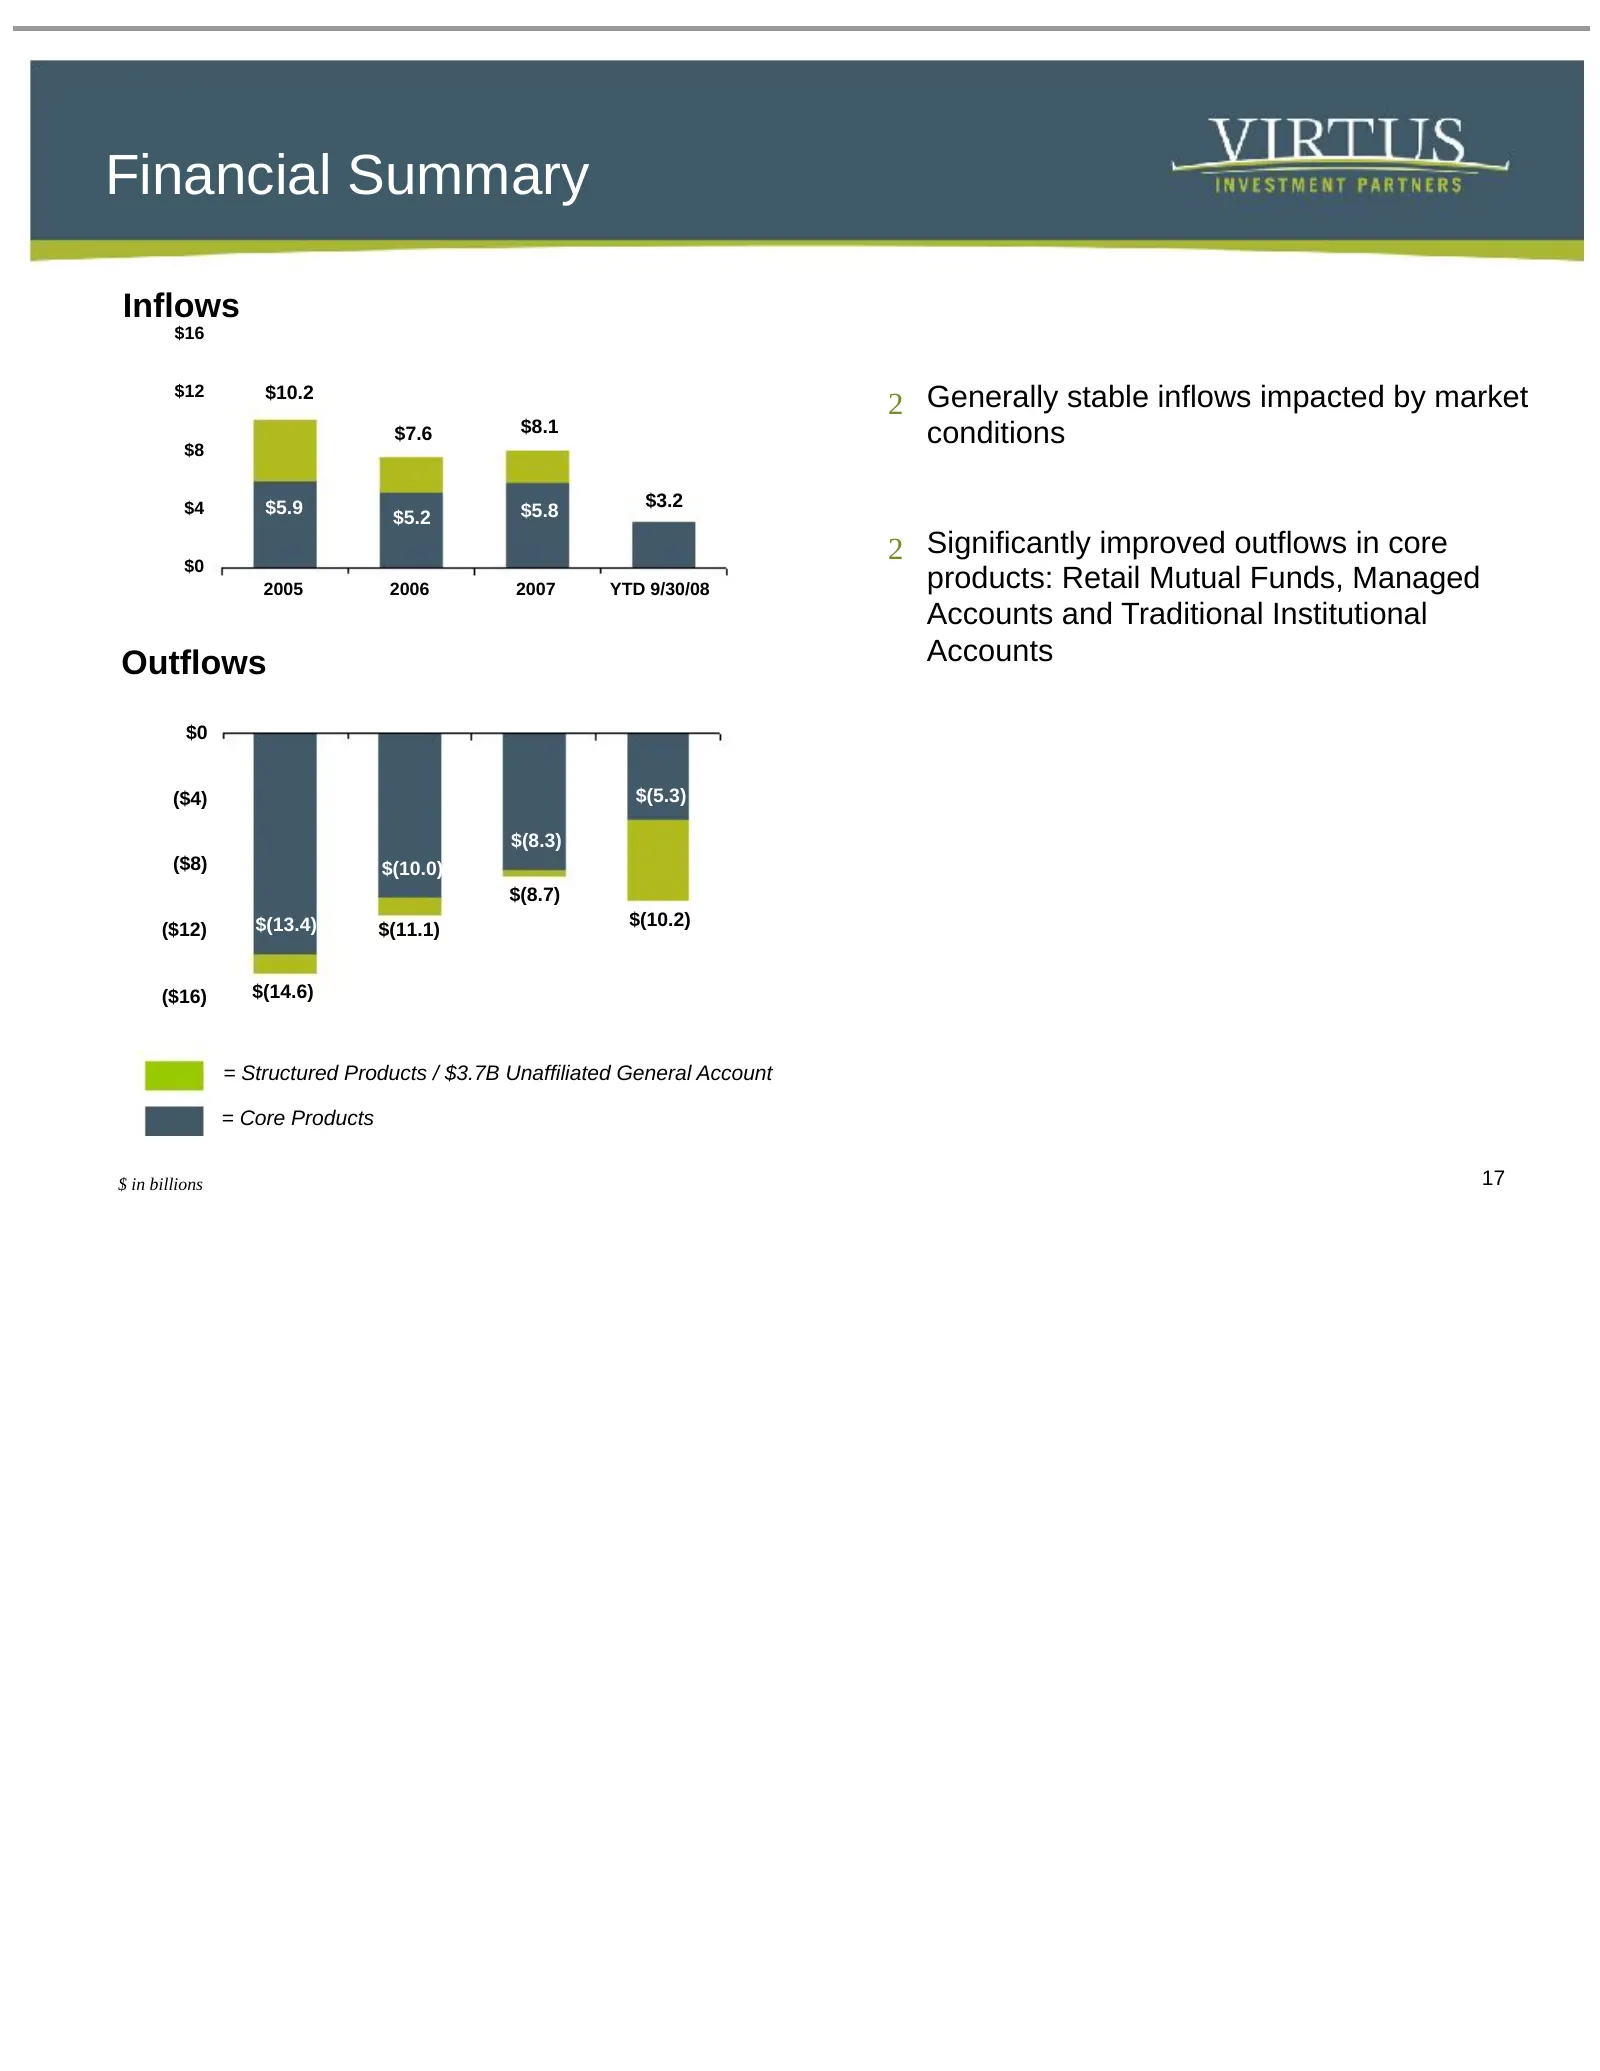
Financial Summary Inflows $16 2 Generally stable inflows impacted by market $12 $10.2 $8 $7.6 $8.1 conditions $4 $5.9 $3.2 $5.2 $5.8 $0 2 Significantly improved outflows in core 2005 2006 2007 YTD 9/30/08 products: Retail Mutual Funds, Managed Accounts and Traditional Institutional Outflows Accounts
Slide 18: Pro Forma Financial Highlights
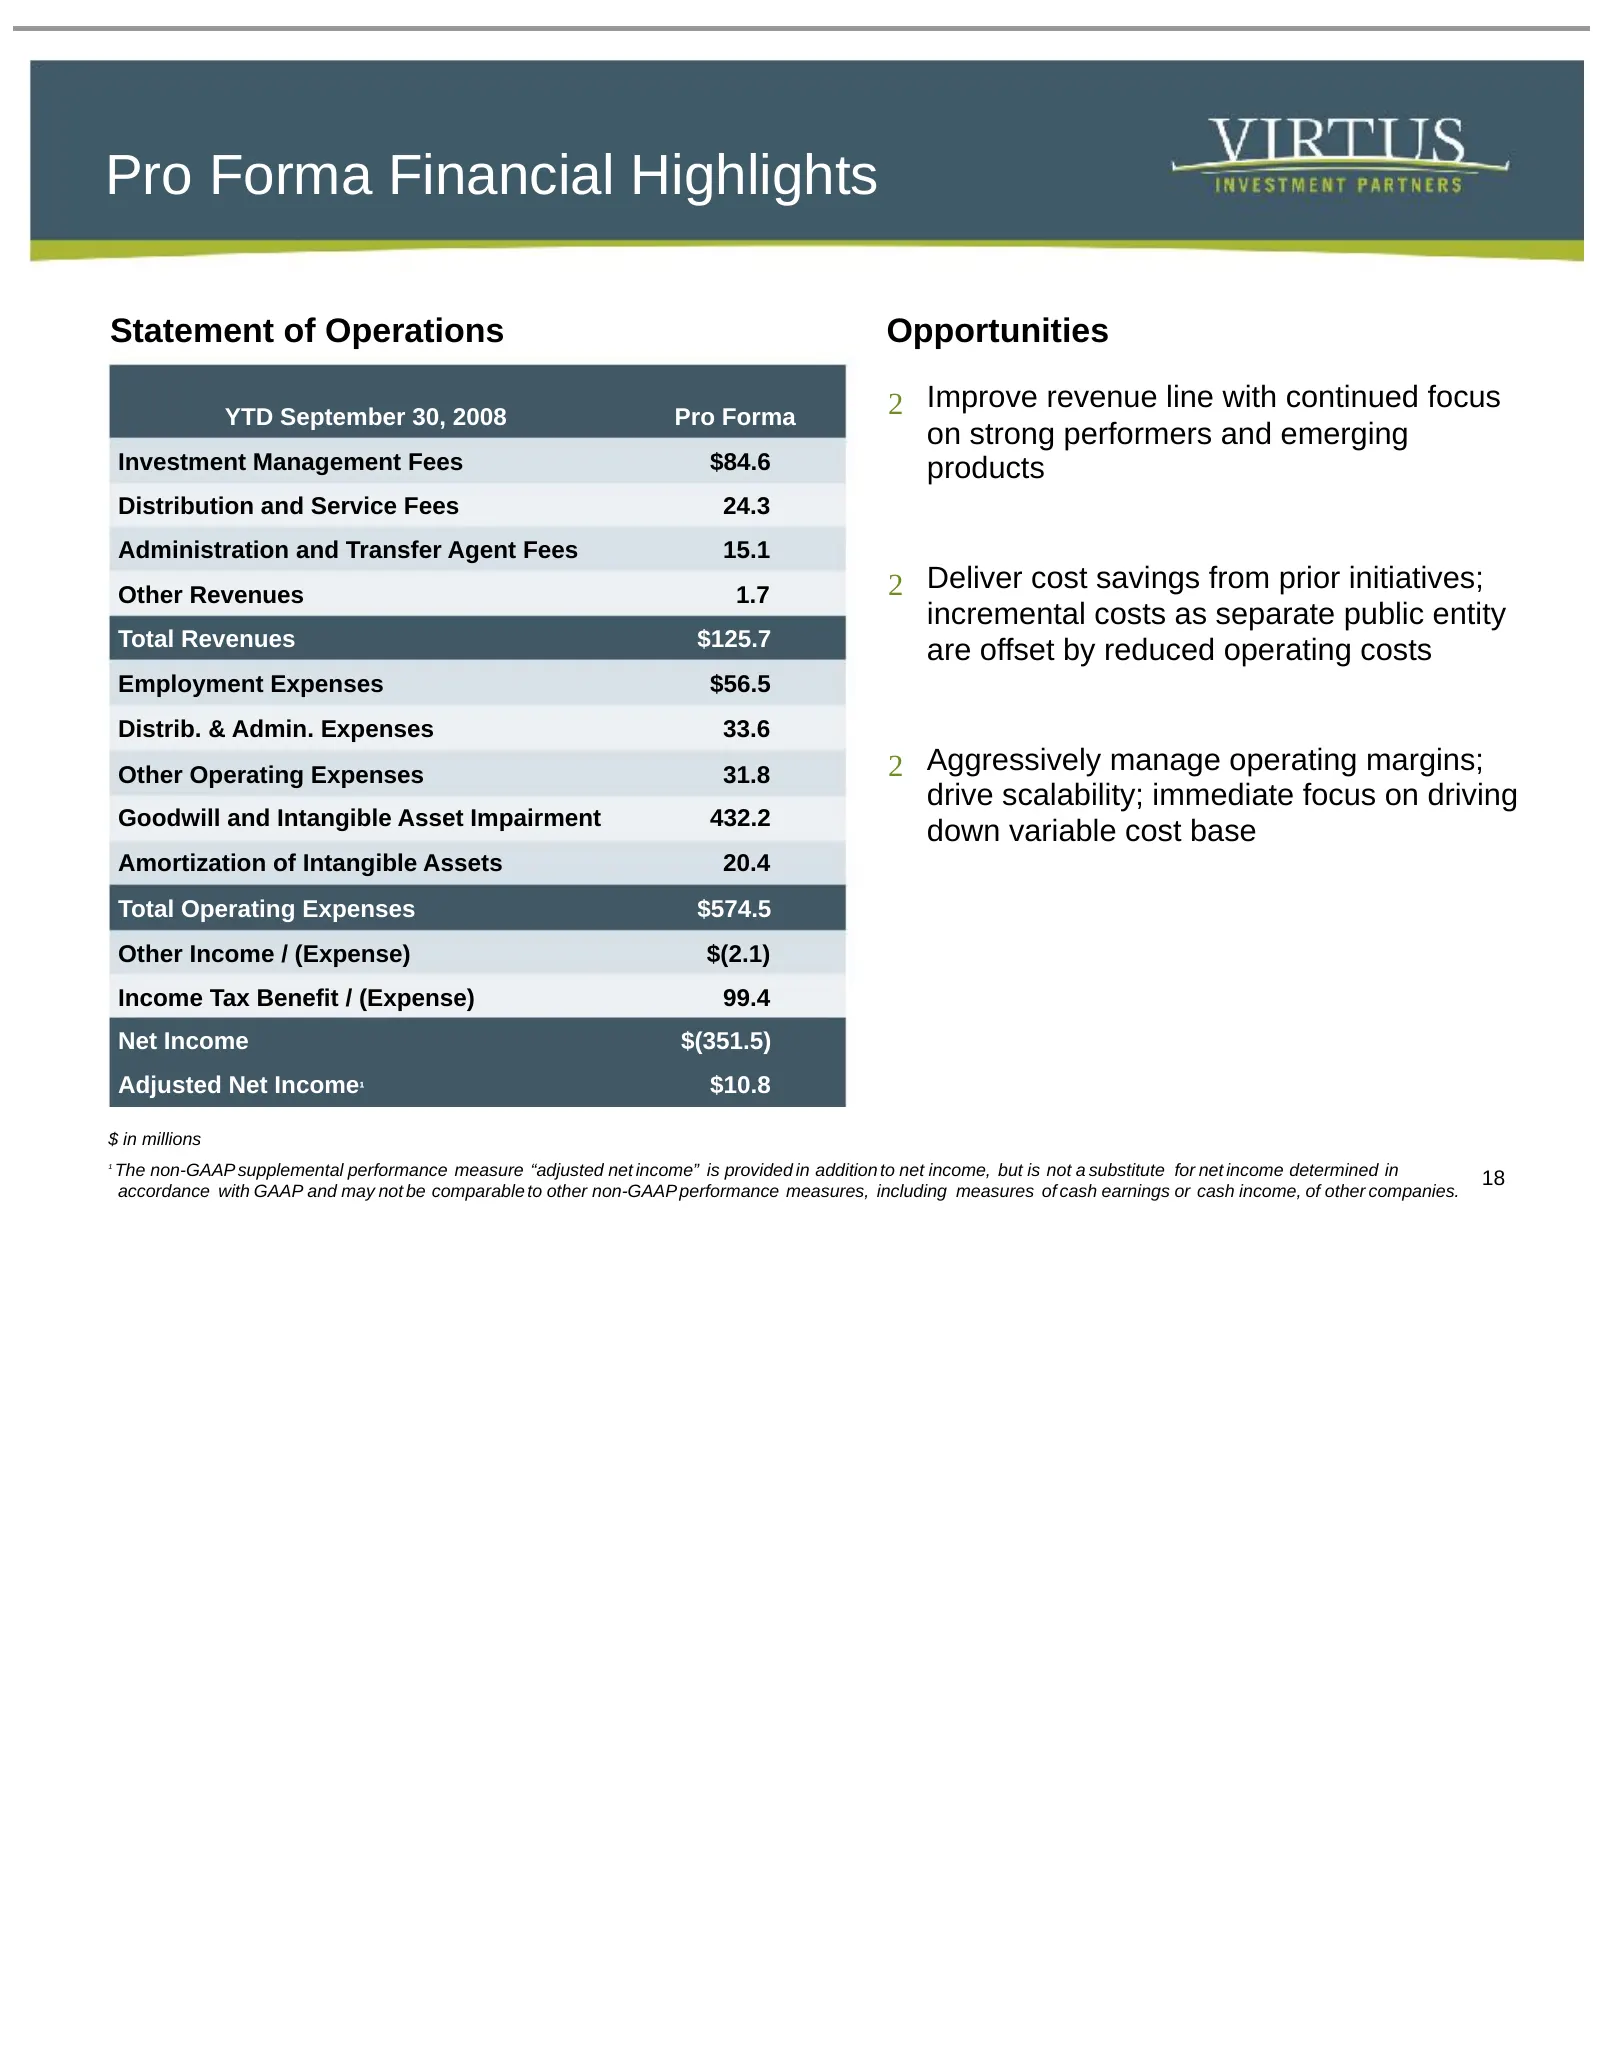
Pro Forma Financial Highlights Statement of Operations Opportunities YTD September 30, 2008 Pro Forma 2 Improve revenue line with continued focus on strong performers and emerging Investment Management Fees $84.6 products Distribution and Service Fees 24.3 Administration and Transfer Agent Fees 15.1
Slide 19: Pro Forma Financial Highlights
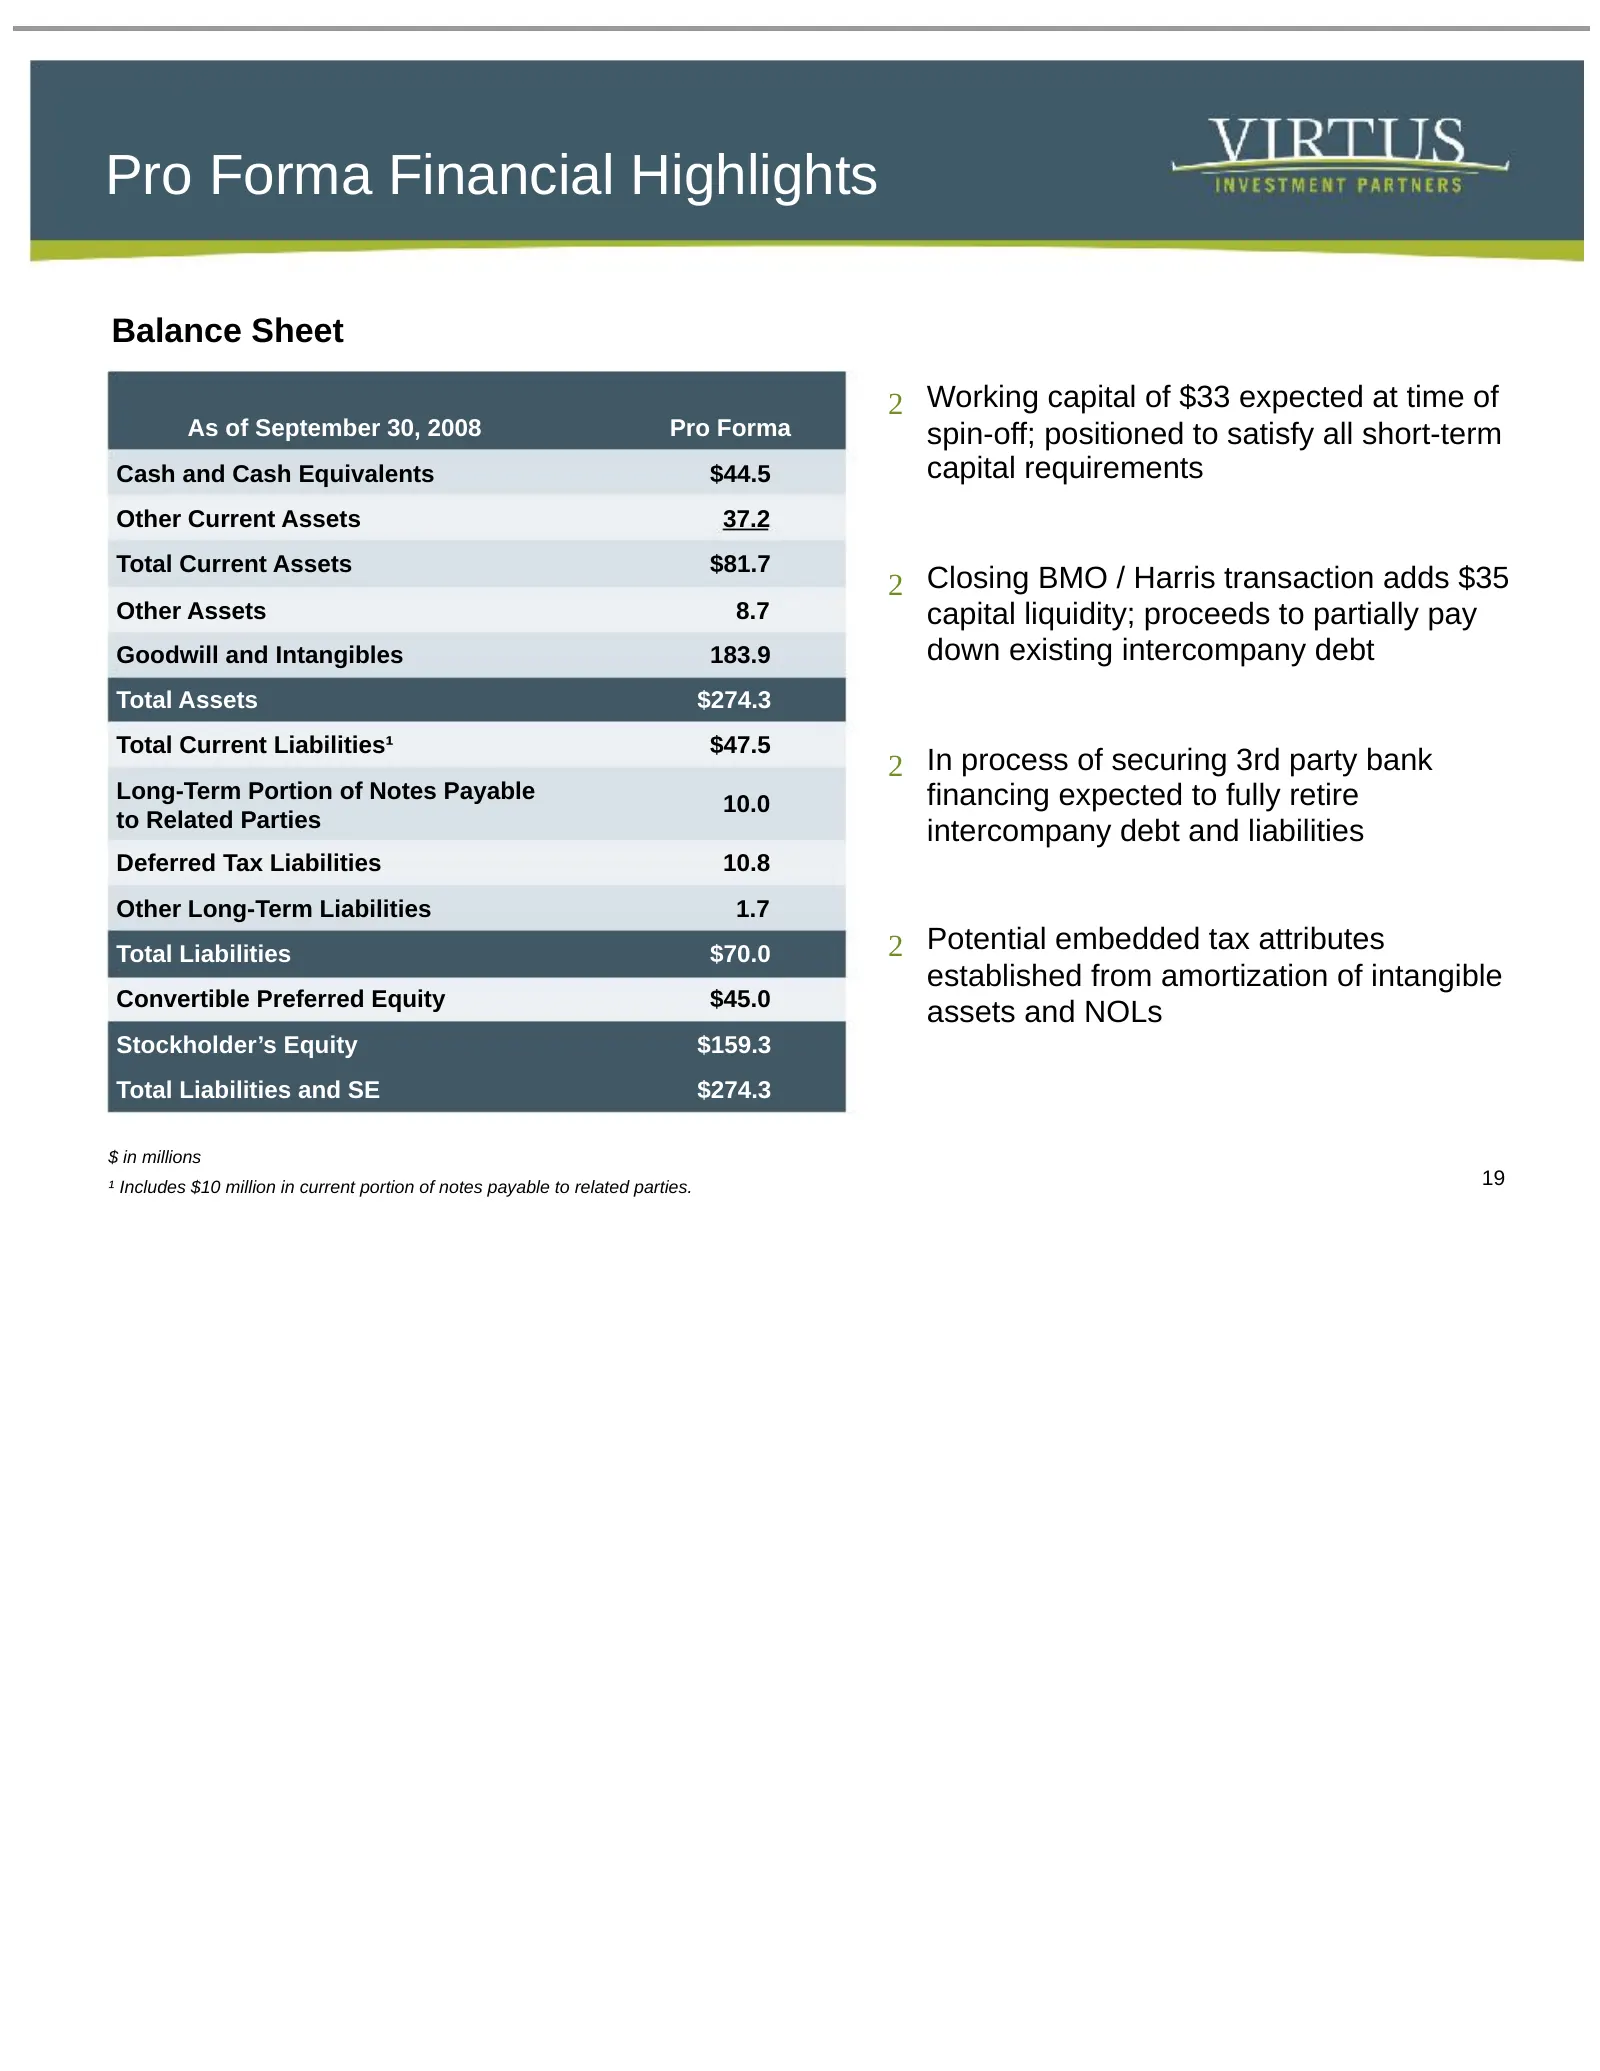
Pro Forma Financial Highlights Balance Sheet 2 Working capital of $33 expected at time of As of September 30, 2008 Pro Forma spin-off; positioned to satisfy all short-term Cash and Cash Equivalents $44.5 capital requirements Other Current Assets 37.2 Total Current Assets $81.7 2 Closing BMO / Harris
Slide 20: Key Investment Highlights
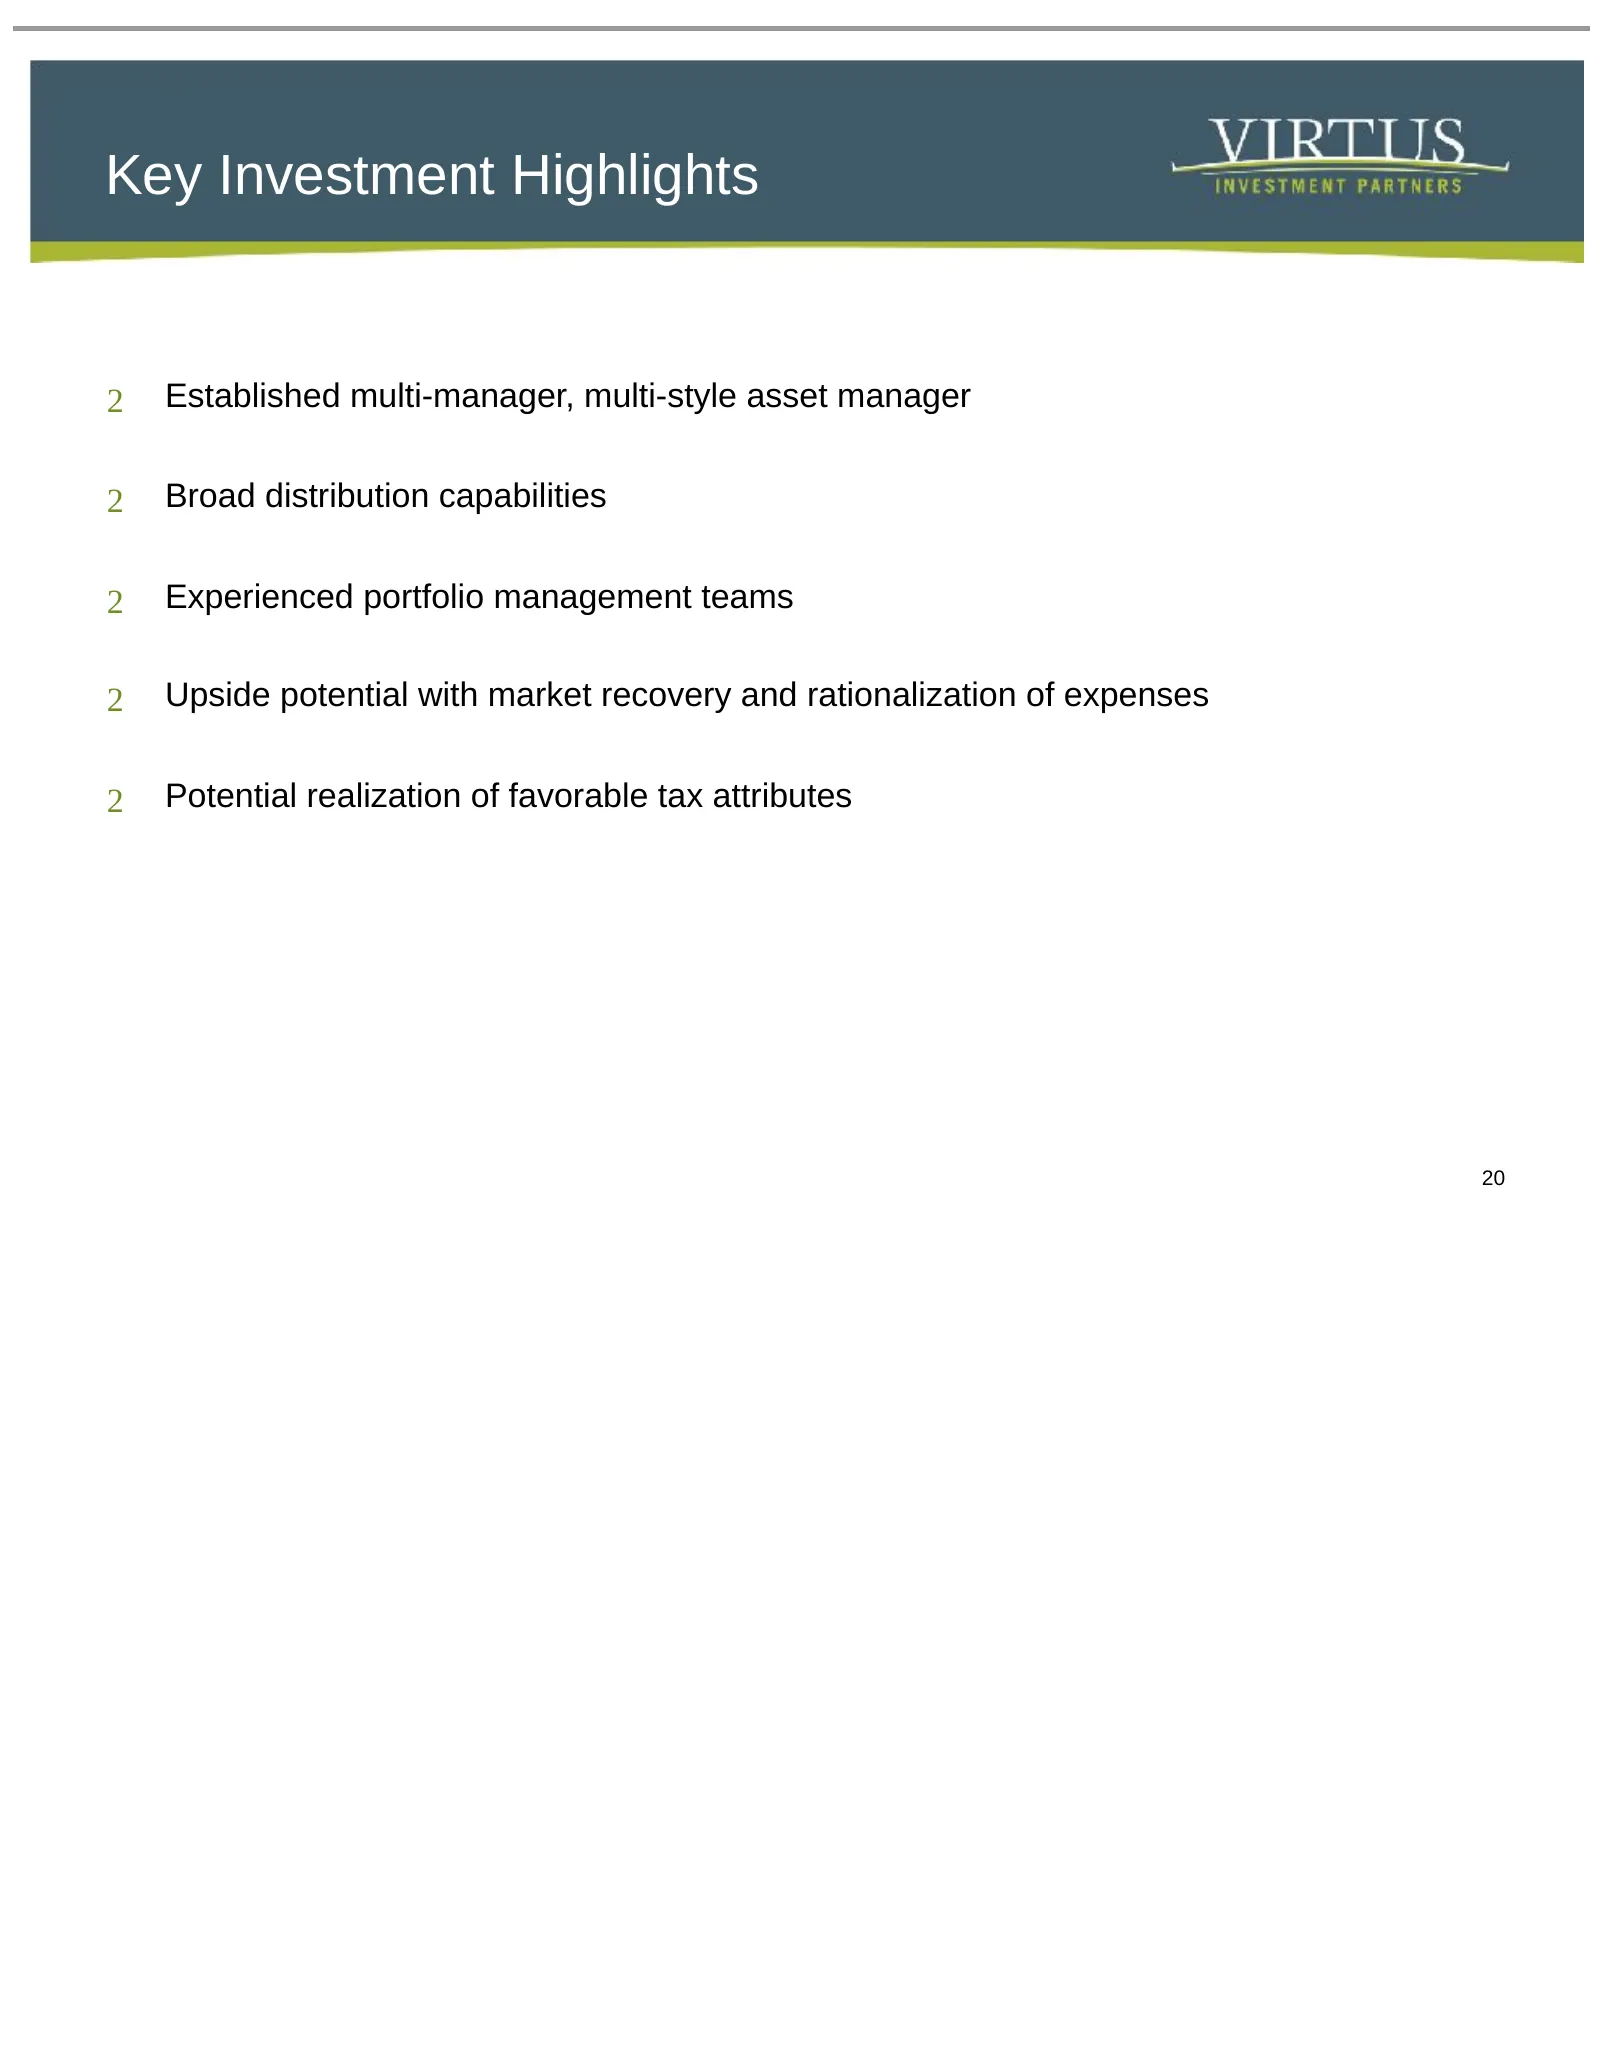
Key Investment Highlights 2 Established multi-manager, multi-style asset manager 2 Broad distribution capabilities 2 Experienced portfolio management teams 2 Upside potential with market recovery and rationalization of expenses 2 Potential realization of favorable tax attributes 20
Slide 21: Appendix
Appendix 21
Slide 22: Reconciliation of Adjusted Net Income
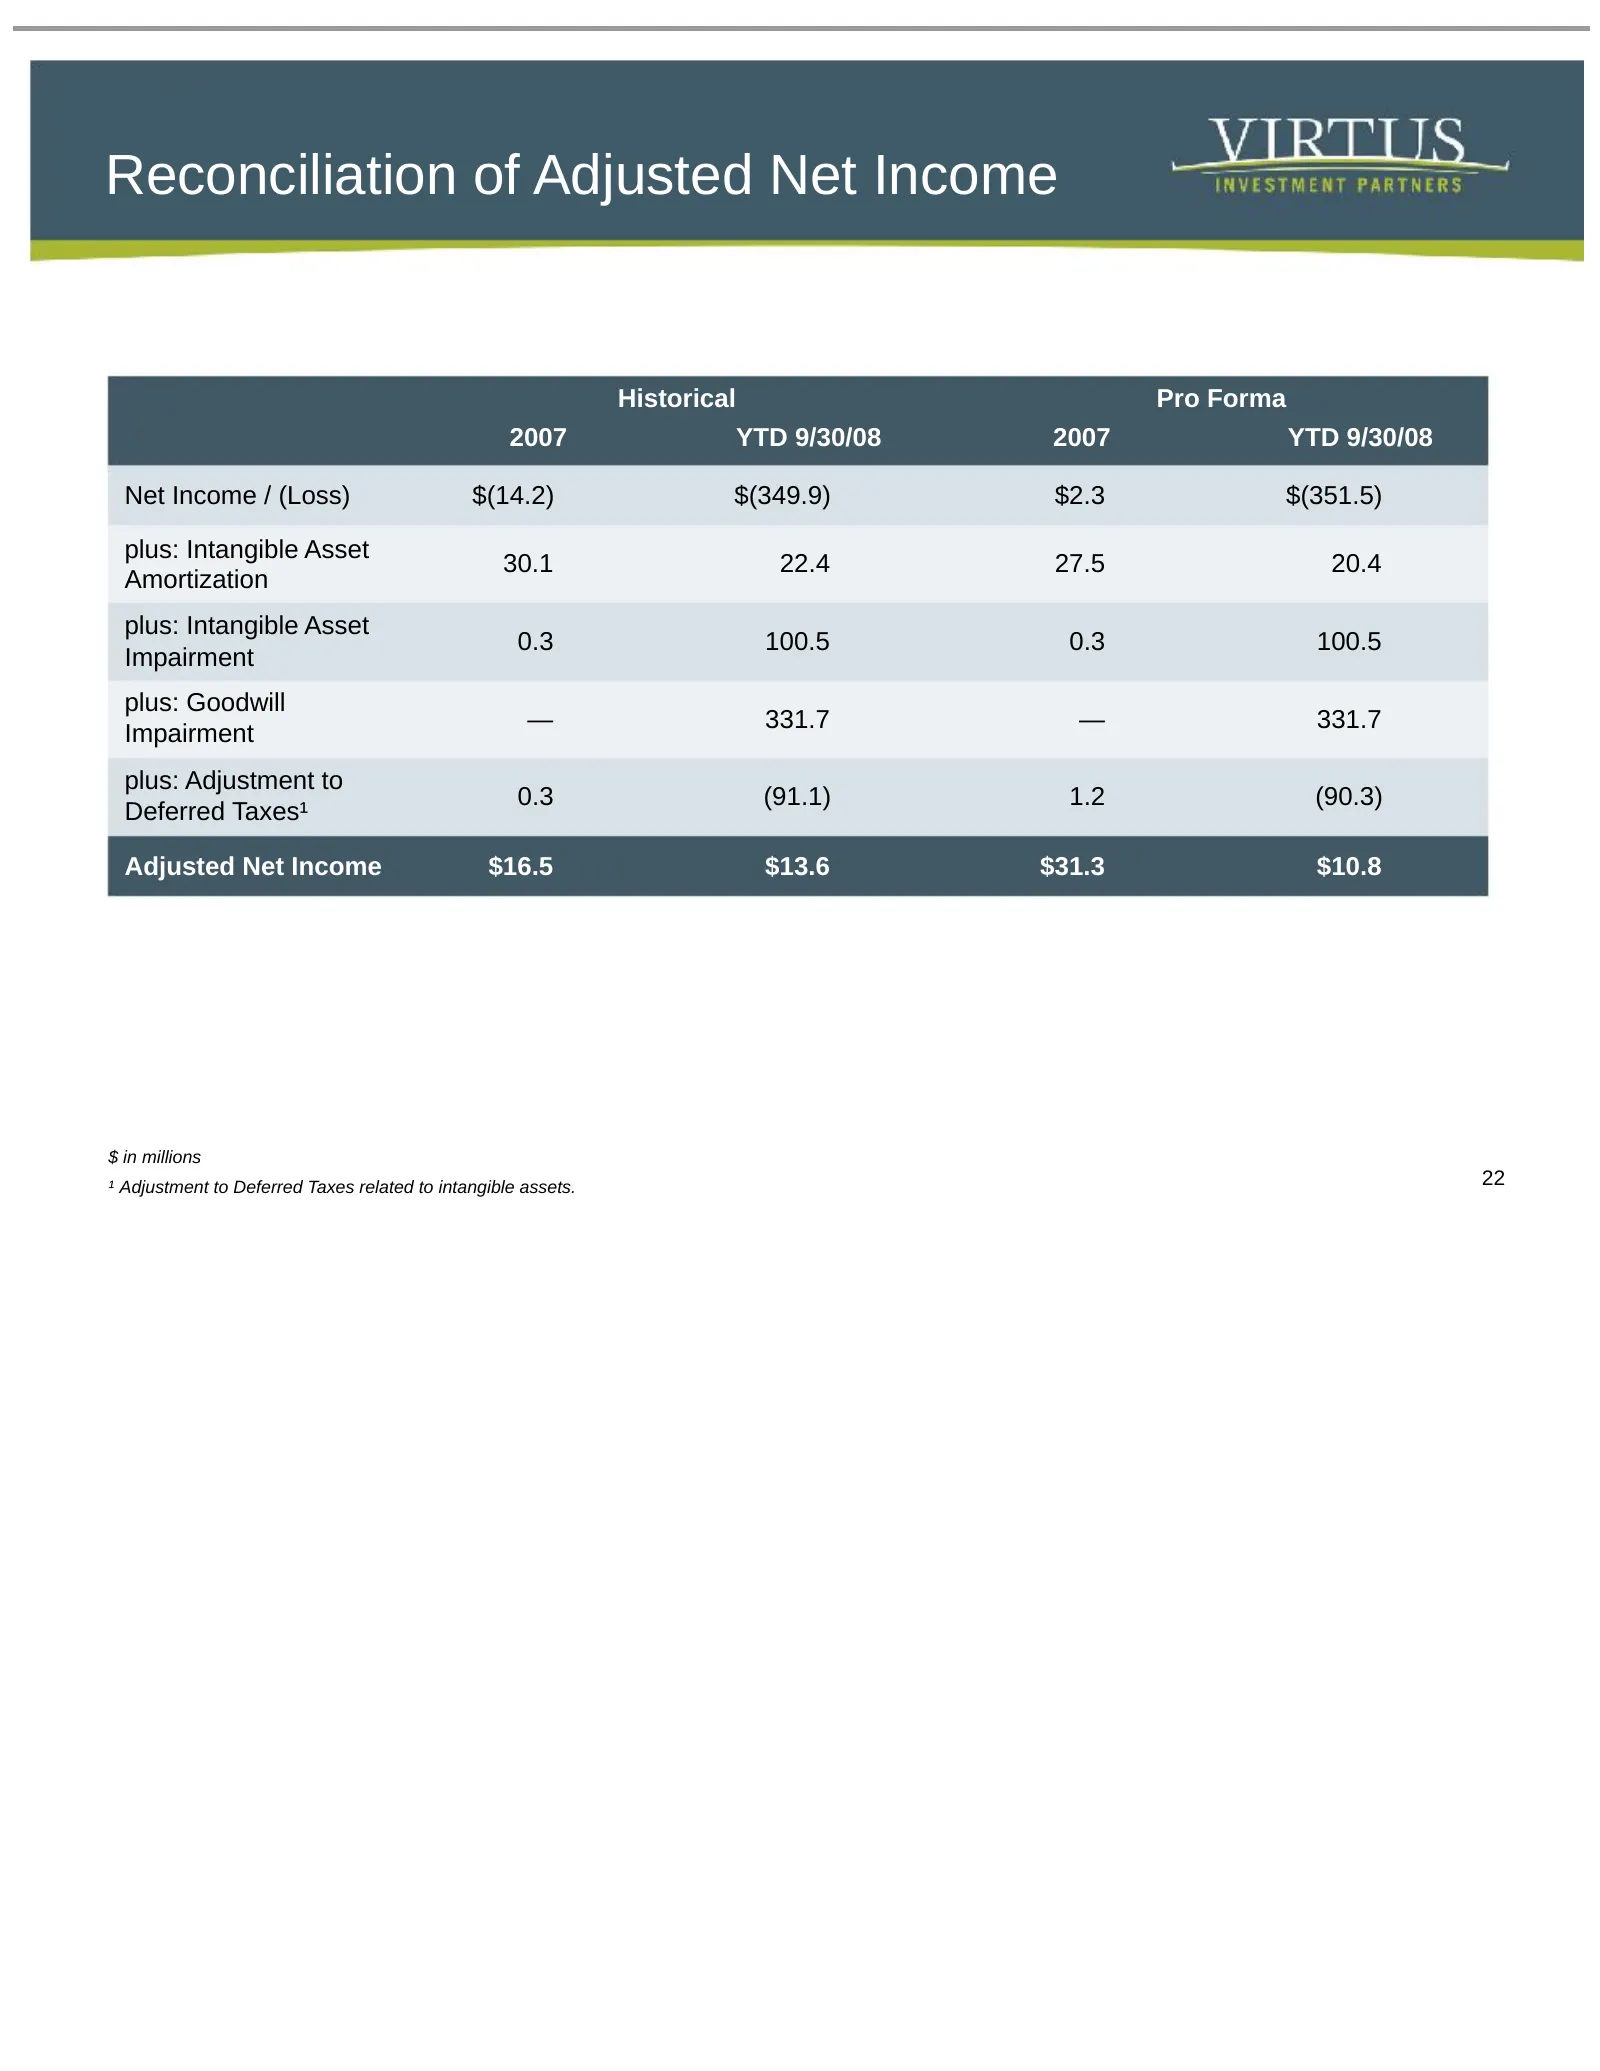
Reconciliation of Adjusted Net Income Historical Pro Forma 2007 YTD 9/30/08 2007 YTD 9/30/08 Net Income / (Loss) $(14.2) $(349.9) $2.3 $(351.5) plus: Intangible Asset 30.1 22.4 27.5 20.4 Amortization plus: Intangible Asset 0.3 100.5 0.3 100.5 Impairment plus: Goodwill — 331.7 — 331.7 Impairment plus
Slide 23: Reconciliation of EBITDA
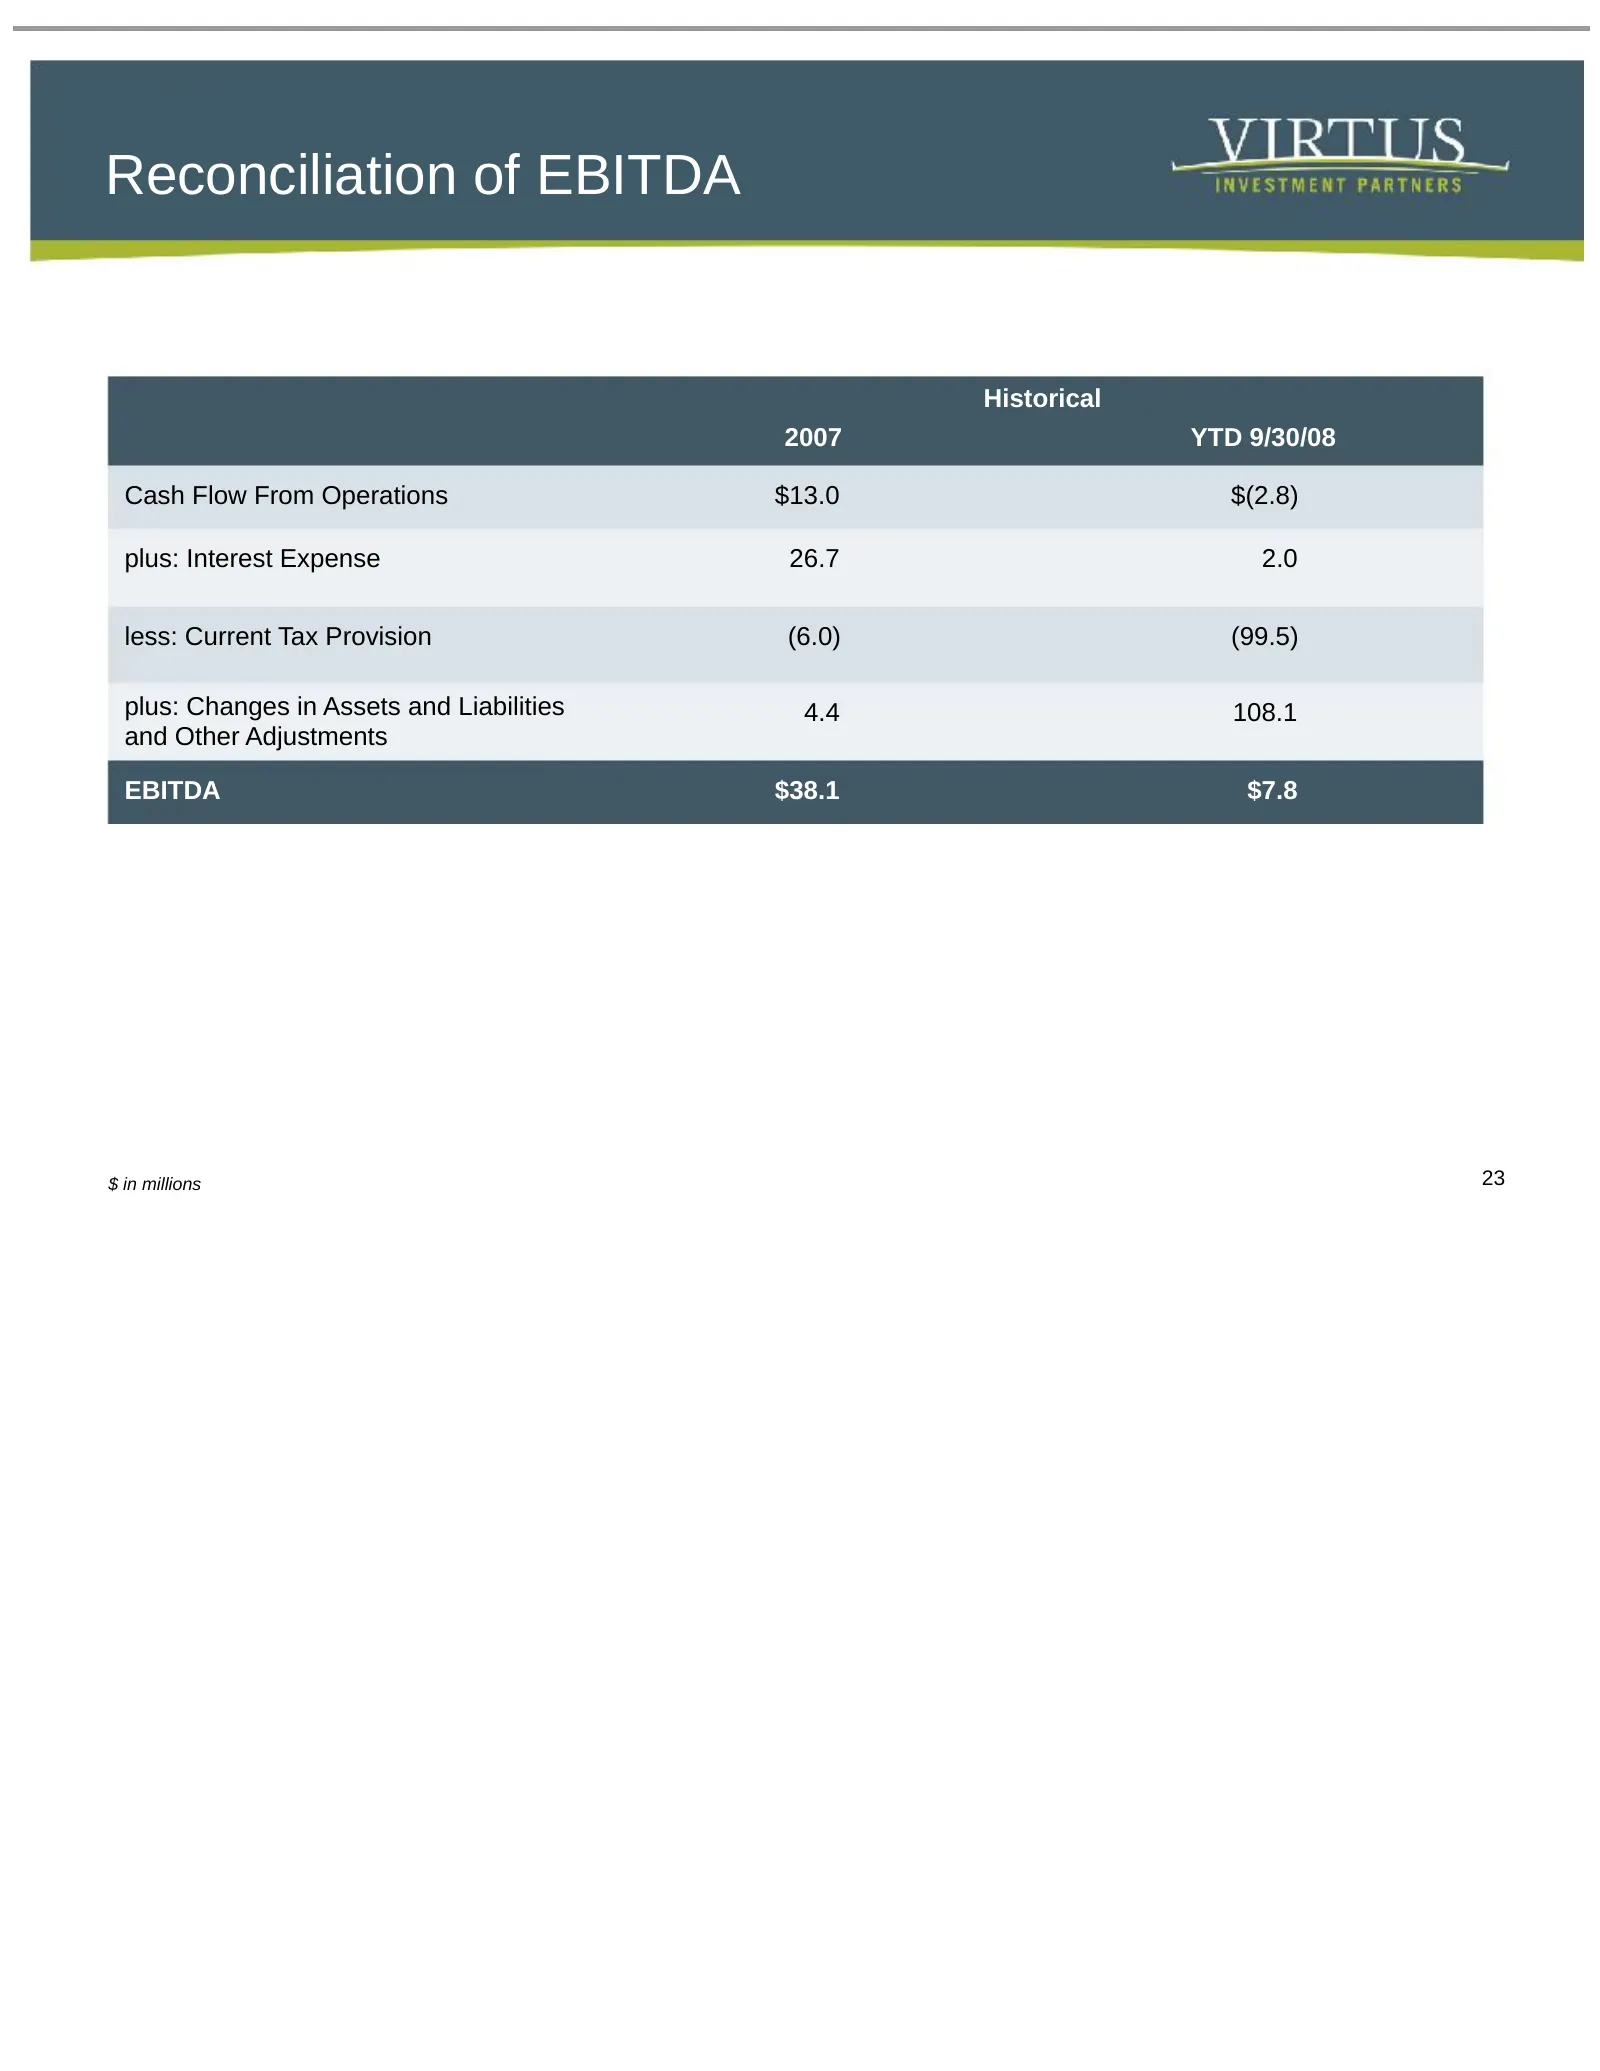
Reconciliation of EBITDA Historical 2007 YTD 9/30/08 Cash Flow From Operations $13.0 $(2.8) plus: Interest Expense 26.7 2.0 less: Current Tax Provision (6.0) (99.5) plus: Changes in Assets and Liabilities 4.4 108.1 and Other Adjustments EBITDA $38.1 $7.8 $ in millions 23
Slide 24
Source: SEC EDGAR · 8-K filed Dec 4, 2008
More decks from The Phoenix Companies Inc
 Q1 2016 Earnings Presentation17 slides · May 10, 2016
 Q4 2015 Earnings Presentation19 slides · Mar 15, 2016
 Q3 2015 Earnings Presentation18 slides · Nov 9, 2015
 Merger or Acquisition (September 2015)8 slides · Sep 29, 2015
 FY2014 Earnings Presentation26 slides · Mar 31, 2015
 Q1 2012 Earnings Presentation25 slides · May 4, 2012