BMC Stock — Stock Building Supply Holdings — Investor Presentation (August 2014)
23 slides from BMC Stock's investor presentation, Aug 5, 2014
Slide 1: STOCK Building Supply Investor Presentation August 2014
STOCK Building Supply Investor Presentation August 2014
Slide 2: Disclaimer: Forward-Looking Statements
2 0 108 78 144 156 172 198 179 146 89 137 209 210 211 231 95 95 95 Disclaimer Forward-Looking Statements This presentation contains forward-looking statements, which are subject to substantial risks, uncertainties and assumptions. You should not place reliance on these statements. These statements o
Slide 3: A Leading Provider of LBM Products and Services
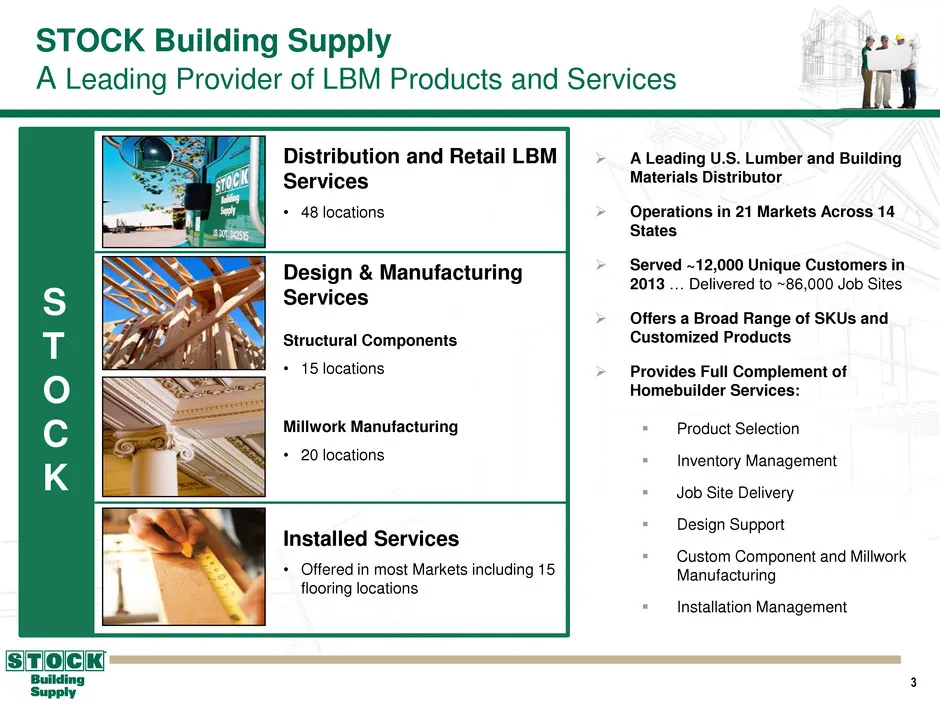
3 0 108 78 144 156 172 198 179 146 89 137 209 210 211 231 95 95 95 STOCK Building Supply A Leading Provider of LBM Products and Services A Leading U.S. Lumber and Building Materials Distributor Operations in 21 Markets Across 14 States Served ~12,000 Unique Customers in 2013 … Delivered to ~86
Slide 4: STOCK is a Leader in the Highly Fragmented U.S. Building Materials Industry
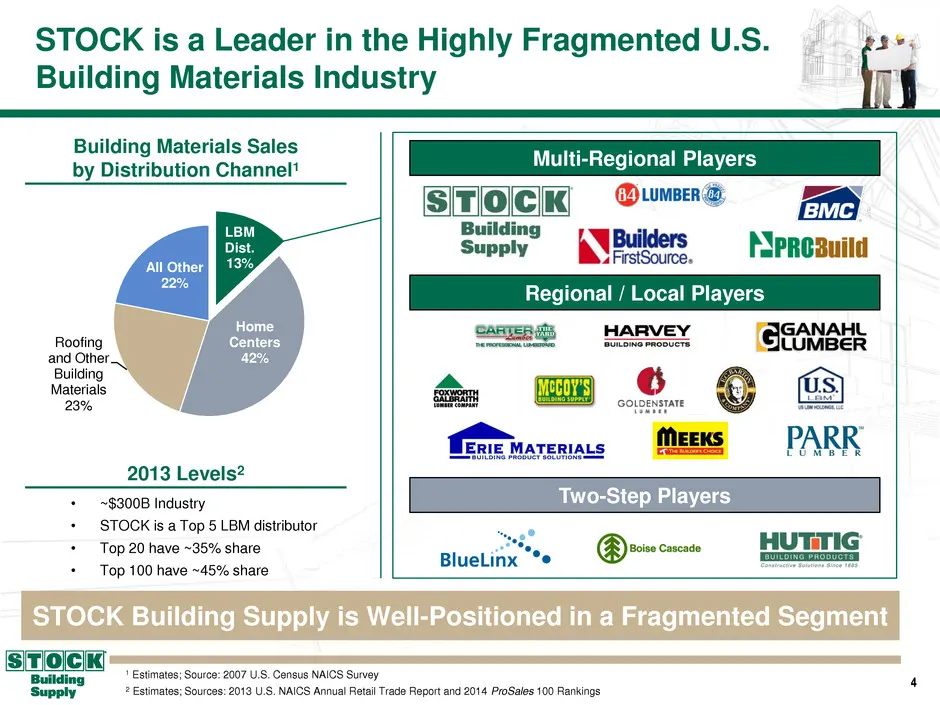
4 0 108 78 144 156 172 198 179 146 89 137 209 210 211 231 95 95 95 STOCK is a Leader in the Highly Fragmented U.S. Building Materials Industry STOCK Building Supply is Well-Positioned in a Fragmented Segment 1 Estimates; Source: 2007 U.S. Census NAICS Survey • ~$300B Industry • STOCK is a Top 5 LBM
Slide 5: Key Highlights
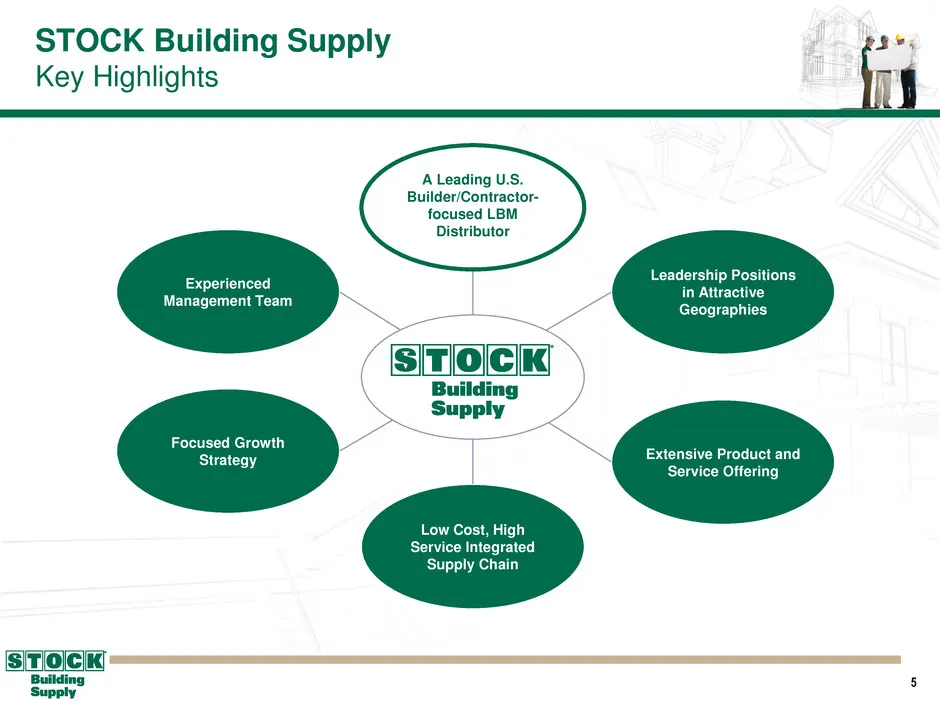
5 0 108 78 144 156 172 198 179 146 89 137 209 210 211 231 95 95 95 STOCK Building Supply Key Highlights Low Cost, High Service Integrated Supply Chain A Leading U.S. Builder/Contractor- focused LBM Distributor Leadership Positions in Attractive Geographies Extensive Product and Service Offering Expe
Slide 6: Strong U.S. LBM Footprint with Significant Room to Grow
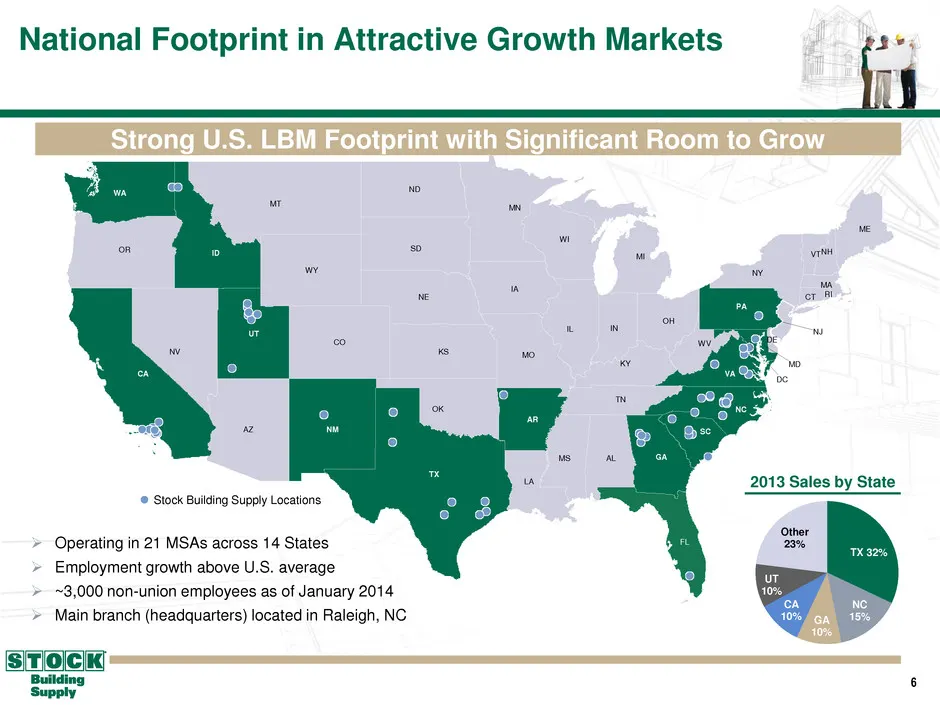
6 0 108 78 144 156 172 198 179 146 89 137 209 210 211 231 95 95 95 TX 32% NC 15% GA 10% CA 10% UT 10% Other 23% Operating in 21 MSAs across 14 States Employment growth above U.S. average ~3,000 non-union employees as of January 2014 Main branch (headquarters) located in Raleigh, NC Strong U.
Slide 7: STOCK's Products and Services Represent ~50% of the Cost of a Typical New Home
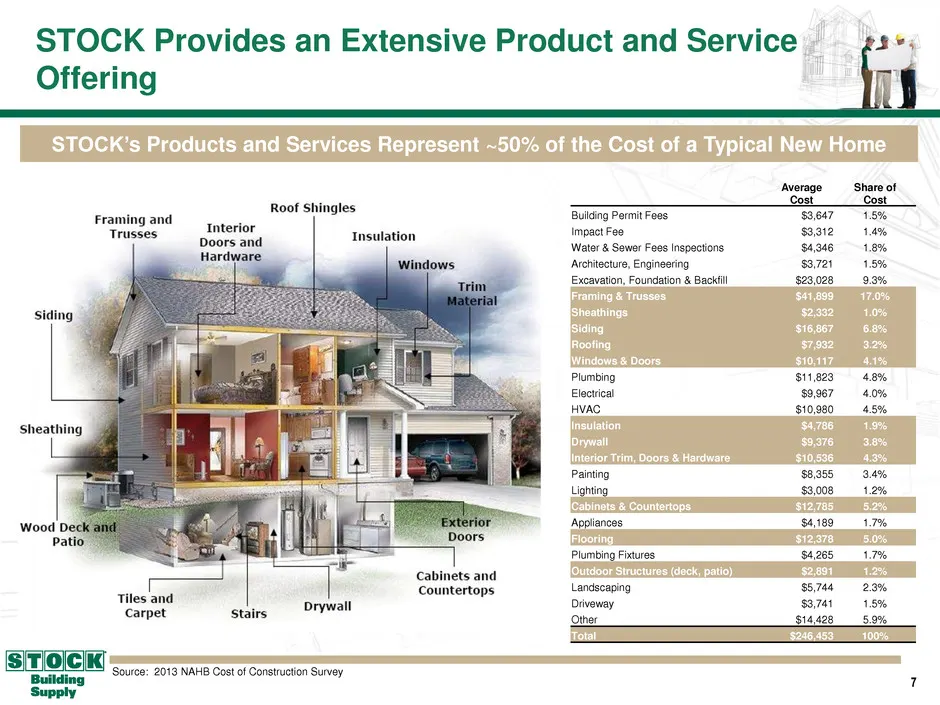
7 0 108 78 144 156 172 198 179 146 89 137 209 210 211 231 95 95 95 STOCK’s Products and Services Represent ~50% of the Cost of a Typical New Home STOCK Provides an Extensive Product and Service Offering Source: 2013 NAHB Cost of Construction Survey Average Cost Share of Cost Building Permit Fees $3,
Slide 8: STOCK Supplies LBM Products and Value-added Services to U.S. Homebuilders & Contractors
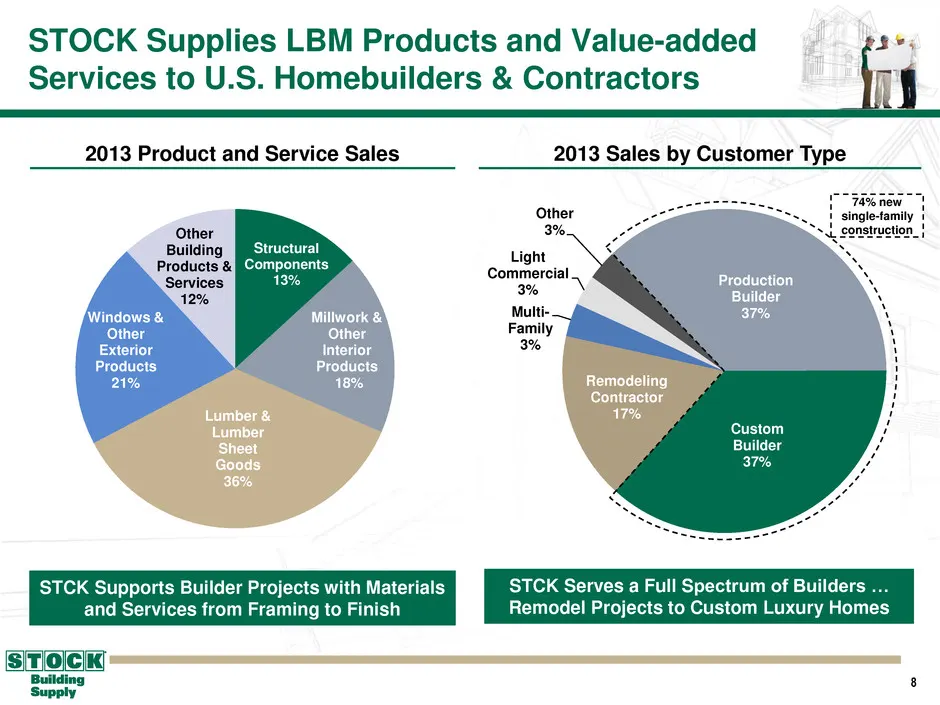
8 0 108 78 144 156 172 198 179 146 89 137 209 210 211 231 95 95 95 STOCK Supplies LBM Products and Value-added Services to U.S. Homebuilders & Contractors 2013 Product and Service Sales 2013 Sales by Customer Type STCK Supports Builder Projects with Materials and Services from Framing to Finish STCK
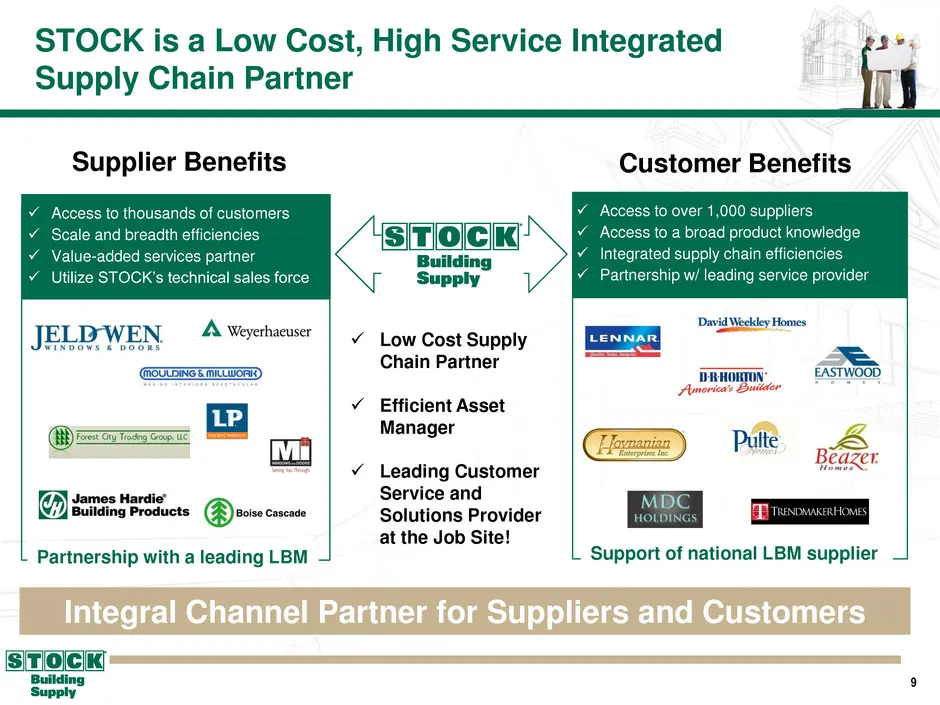
Slide 9: STOCK is a Low Cost, High Service Integrated Supply Chain Partner
9 0 108 78 144 156 172 198 179 146 89 137 209 210 211 231 95 95 95 STOCK is a Low Cost, High Service Integrated Supply Chain Partner Supplier Benefits Customer Benefits Integral Channel Partner for Suppliers and Customers Access to thousands of customers Scale and breadth efficiencies Value-ad
Slide 10: Focused Growth Strategy
10 0 108 78 144 156 172 198 179 146 89 137 209 210 211 231 95 95 95 Focused Growth Strategy
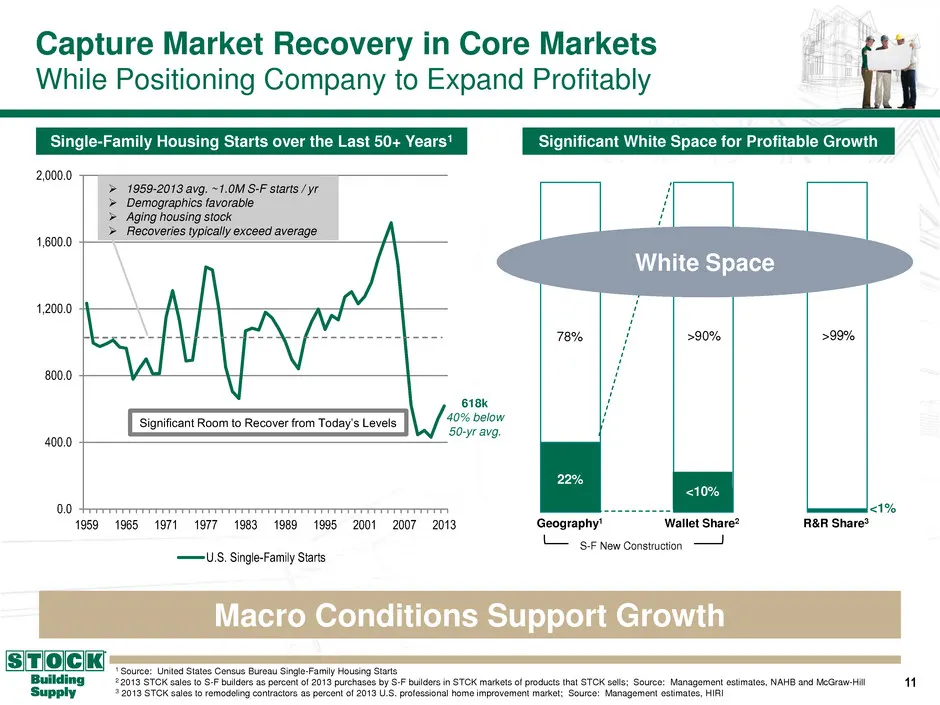
Slide 11: Capture Market Recovery in Core Markets While Positioning Company to Expand Profitably
11 0 108 78 144 156 172 198 179 146 89 137 209 210 211 231 95 95 95 79% 93% >99% 0.0 400.0 800.0 1,200.0 1,600.0 2,000.0 1959 1965 1971 1977 1983 1989 1995 2001 2007 2013 U.S. Single-Family Starts Capture Market Recovery in Core Markets While Positioning Company to Expand Profitably 1 Source: United
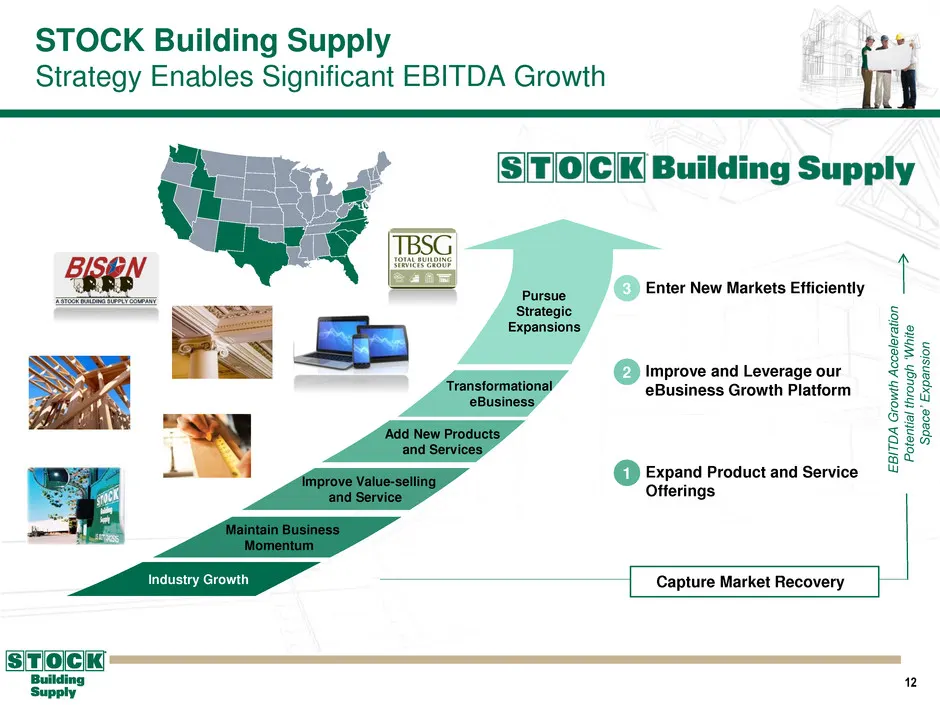
Slide 12: Strategy Enables Significant EBITDA Growth
12 0 108 78 144 156 172 198 179 146 89 137 209 210 211 231 95 95 95 STOCK Building Supply Strategy Enables Significant EBITDA Growth Industry Growth Maintain Business Momentum Improve Value-selling and Service Add New Products and Services Pursue Strategic Expansions Enter New Markets Efficiently E
Slide 13: Expand Product and Service Offerings
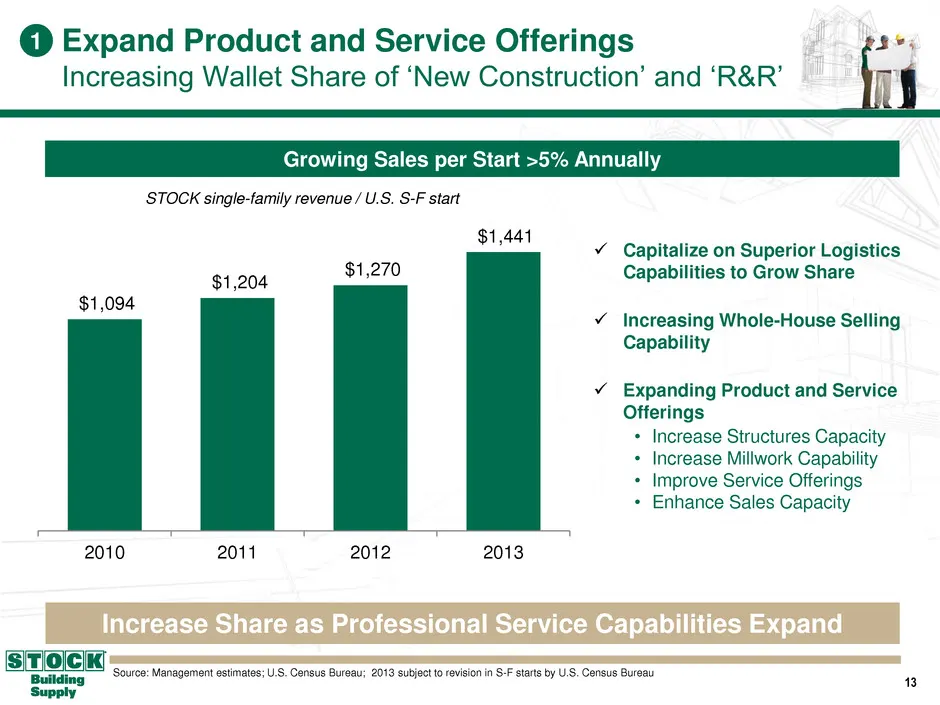
13 0 108 78 144 156 172 198 179 146 89 137 209 210 211 231 95 95 95 Capitalize on Superior Logistics Capabilities to Grow Share Increasing Whole-House Selling Capability Expanding Product and Service Offerings Increase Share as Professional Service Capabilities Expand Growing Sales per Start >
Slide 14: Adding Millwork Facilities and Expanding Sales Capabilities
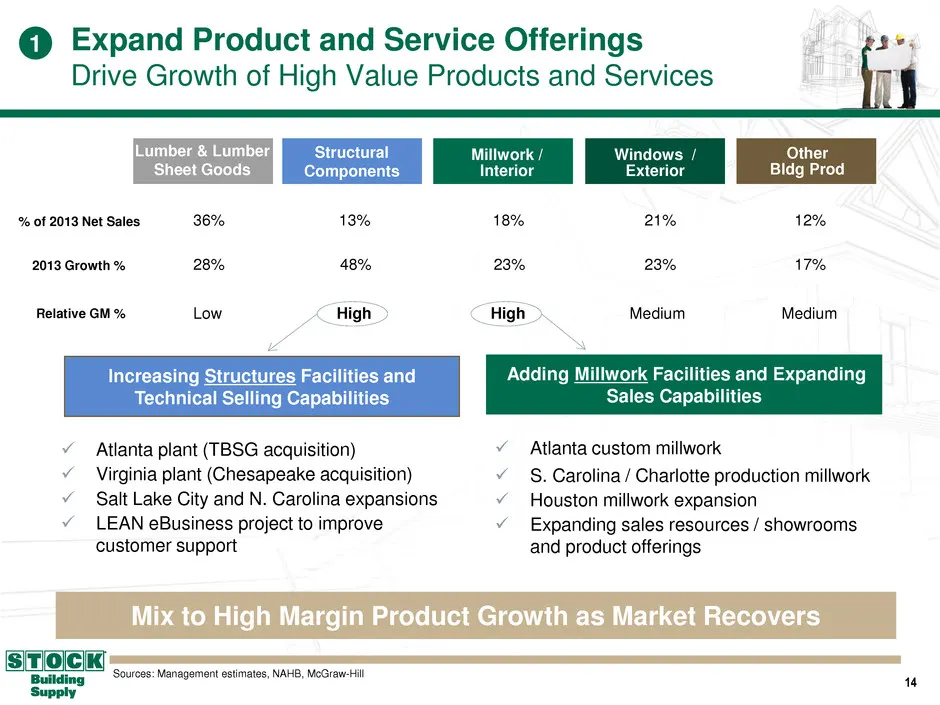
14 0 108 78 144 156 172 198 179 146 89 137 209 210 211 231 95 95 95 Adding Millwork Facilities and Expanding Sales Capabilities Atlanta custom millwork S. Carolina / Charlotte production millwork Houston millwork expansion Expanding sales resources / showrooms and product offerings Mix to Hi
Slide 15: Leverage Our eBusiness Growth Platform
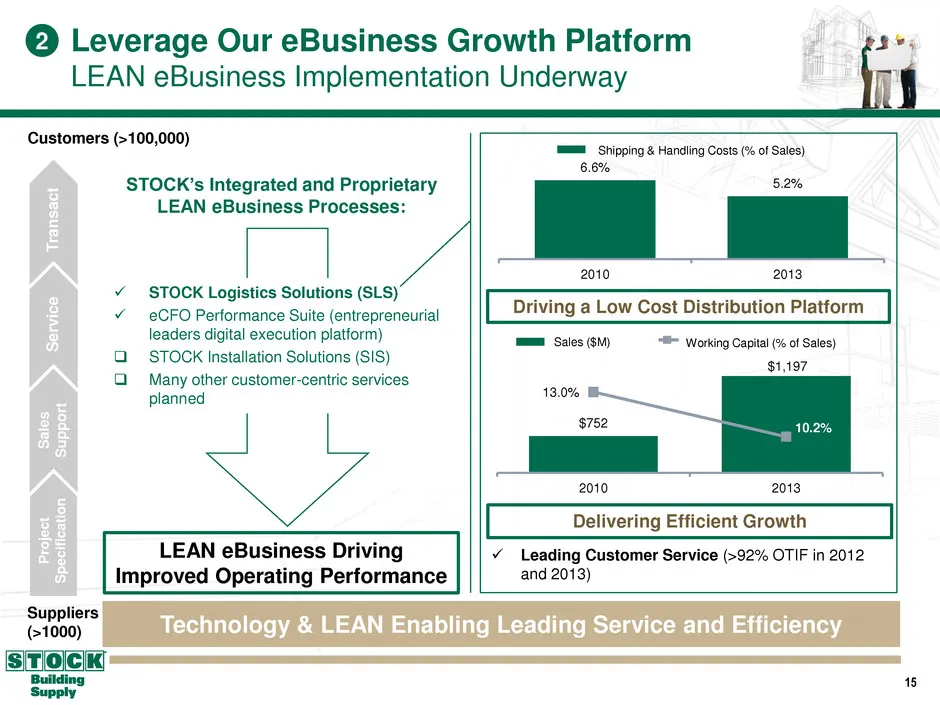
15 0 108 78 144 156 172 198 179 146 89 137 209 210 211 231 95 95 95 $752 13.0% 10.2% 2010 2013 Leverage Our eBusiness Growth Platform LEAN eBusiness Implementation Underway Suppliers (>1000) Customers (>100,000) STOCK’s Integrated and Proprietary LEAN eBusiness Processes: P ro ject S p ec if ica ti
Slide 16: Enter New Markets Efficiently
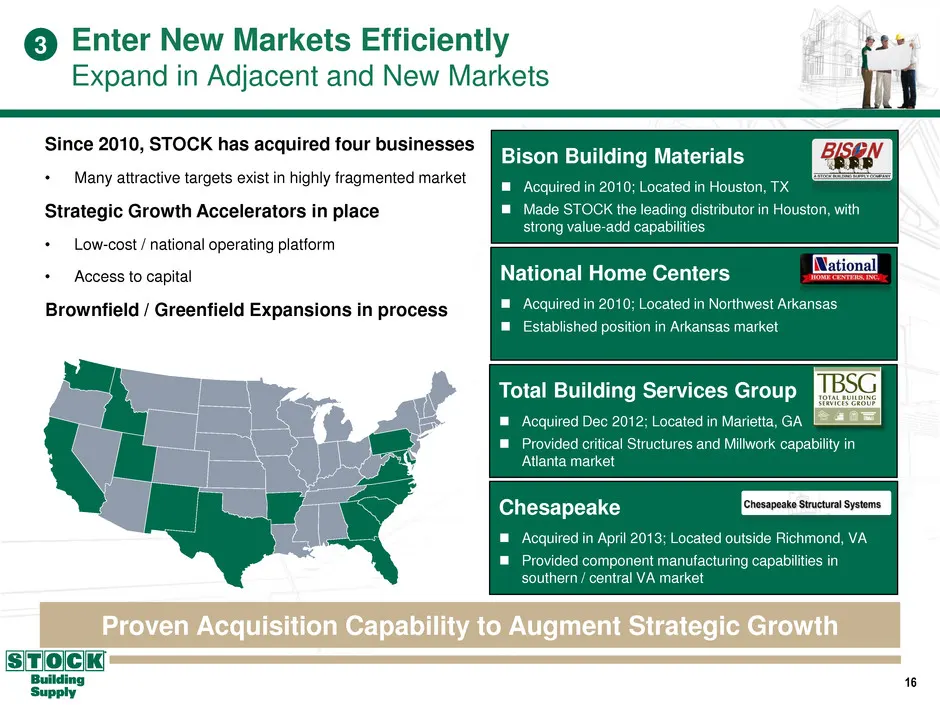
16 0 108 78 144 156 172 198 179 146 89 137 209 210 211 231 95 95 95 Enter New Markets Efficiently Expand in Adjacent and New Markets Since 2010, STOCK has acquired four businesses • Many attractive targets exist in highly fragmented market Strategic Growth Accelerators in place • Low-cost / national
Slide 17: Financial Overview
17 0 108 78 144 156 172 198 179 146 89 137 209 210 211 231 95 95 95 Financial Overview
Slide 18: Review of Historical Financial Performance
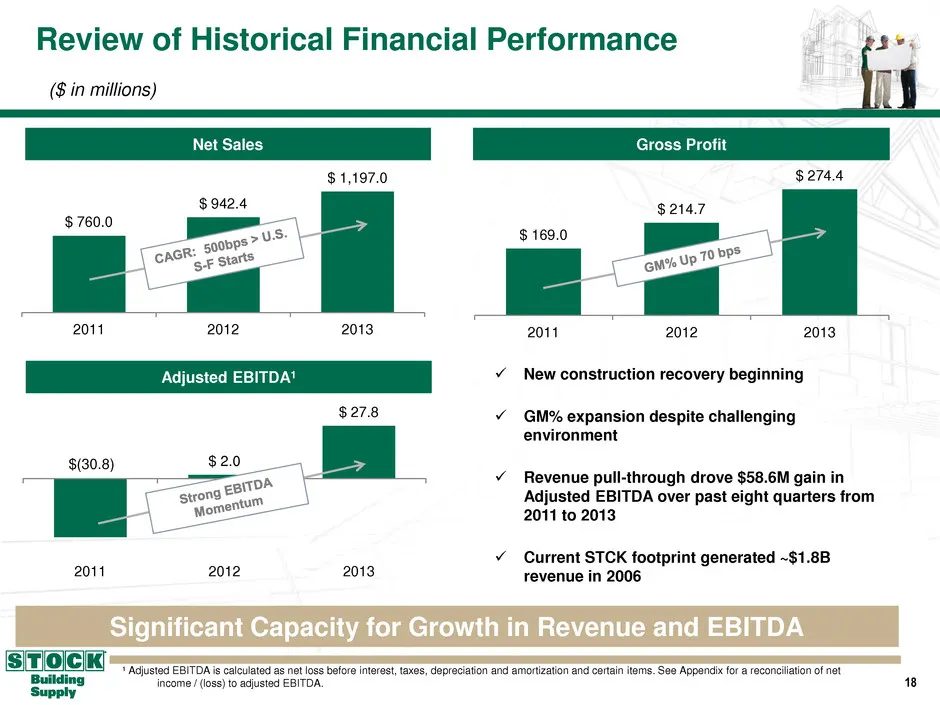
18 0 108 78 144 156 172 198 179 146 89 137 209 210 211 231 95 95 95 $ 760.0 $ 942.4 $ 1,197.0 2011 2012 2013 Review of Historical Financial Performance Net Sales ¹ Adjusted EBITDA is calculated as net loss before interest, taxes, depreciation and amortization and certain items. See Appendix for a re
Slide 19: Quarterly Financial Results
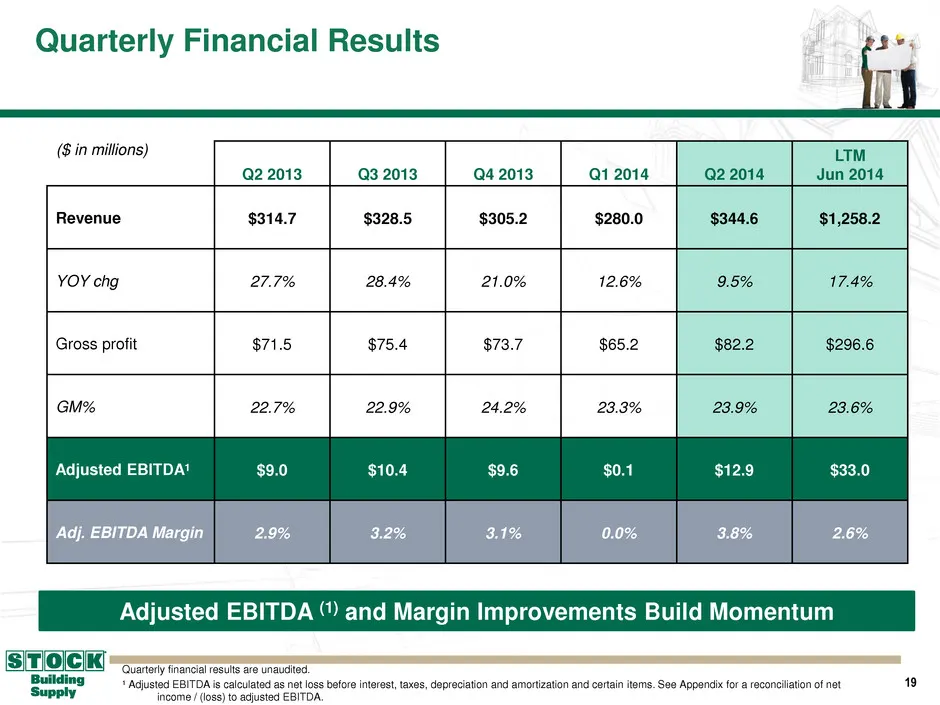
19 0 108 78 144 156 172 198 179 146 89 137 209 210 211 231 95 95 95 Quarterly Financial Results Q2 2013 Q3 2013 Q4 2013 Q1 2014 Q2 2014 LTM Jun 2014 Revenue $314.7 $328.5 $305.2 $280.0 $344.6 $1,258.2 YOY chg 27.7% 28.4% 21.0% 12.6% 9.5% 17.4% Gross profit $71.5 $75.4 $73.7 $65.2 $82.2 $296.6 GM% 22
Slide 20: Single-Family Exposure and Capital Structure Drives Significant Growth Potential
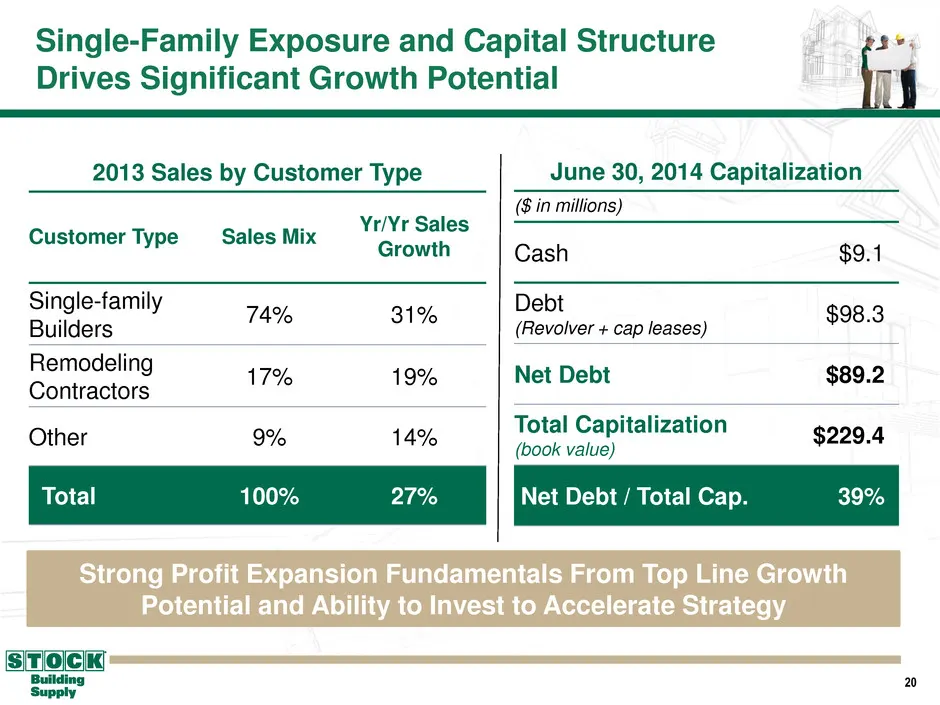
20 0 108 78 144 156 172 198 179 146 89 137 209 210 211 231 95 95 95 Single-Family Exposure and Capital Structure Drives Significant Growth Potential 2013 Sales by Customer Type Customer Type Sales Mix Yr/Yr Sales Growth Single-family Builders 74% 31% Remodeling Contractors 17% 19% Other 9% 14% Total
Slide 21: STOCK Building Supply Positioned for Profitable Growth
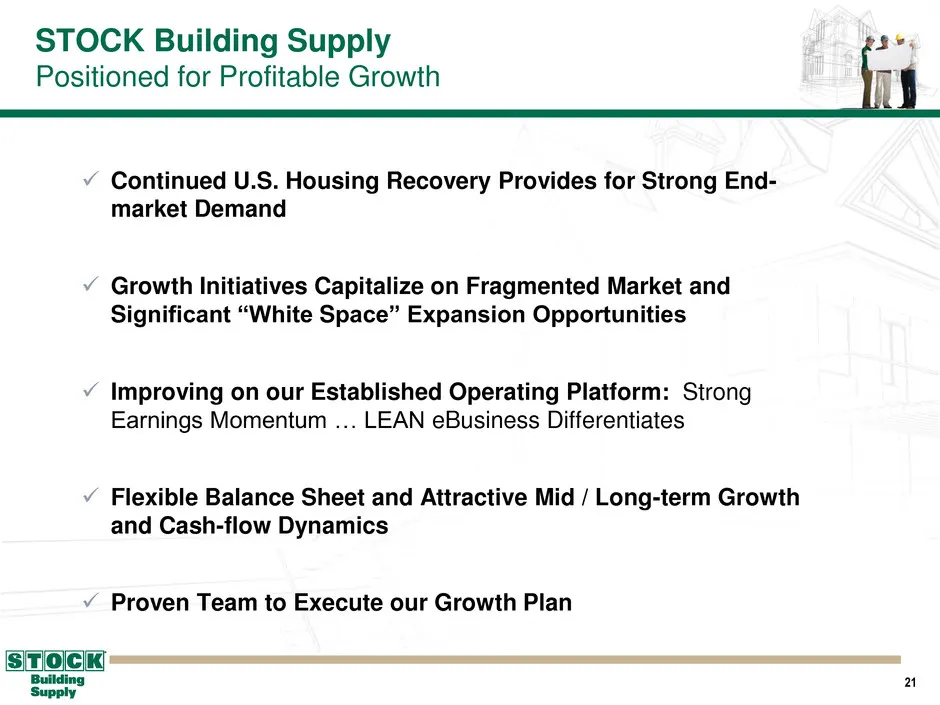
21 0 108 78 144 156 172 198 179 146 89 137 209 210 211 231 95 95 95 STOCK Building Supply Positioned for Profitable Growth Continued U.S. Housing Recovery Provides for Strong End- market Demand Growth Initiatives Capitalize on Fragmented Market and Significant “White Space” Expansion Opportuniti
Slide 22: Appendix
22 0 108 78 144 156 172 198 179 146 89 137 209 210 211 231 95 95 95 Appendix
Slide 23: Reconciliation of Non-GAAP Items
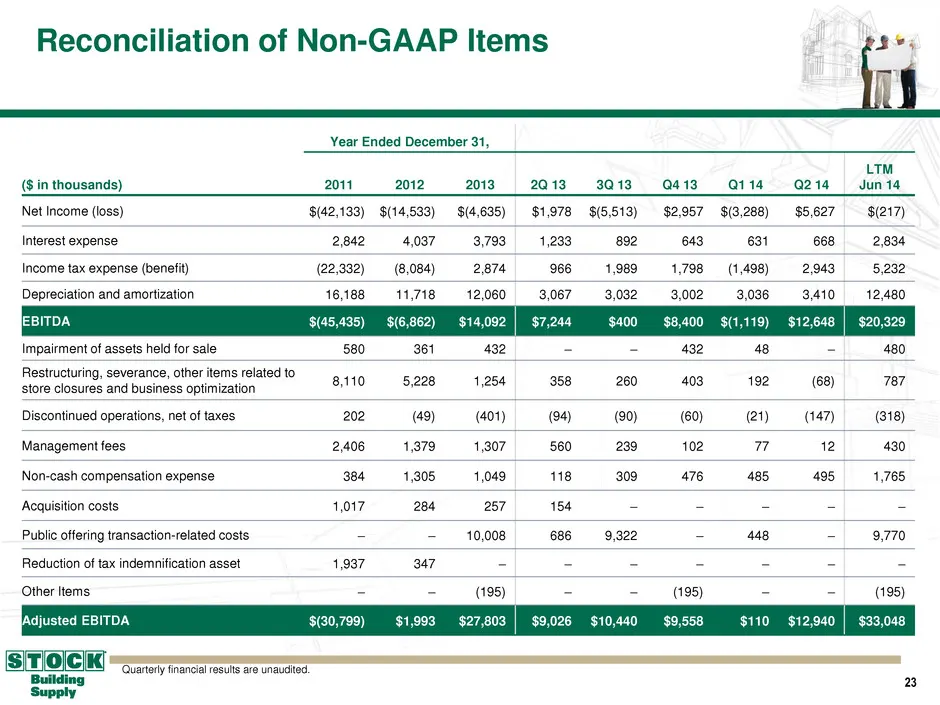
23 0 108 78 144 156 172 198 179 146 89 137 209 210 211 231 95 95 95 Reconciliation of Non-GAAP Items Year Ended December 31, ($ in thousands) 2011 2012 2013 2Q 13 3Q 13 Q4 13 Q1 14 Q2 14 LTM Jun 14 Net Income (loss) $(42,133) $(14,533) $(4,635) $1,978 $(5,513) $2,957 $(3,288) $5,627 $(217) Interest
Source: SEC EDGAR · 8-K filed Aug 5, 2014
More decks from BMC Stock Holdings Inc
 Merger or Acquisition (November 2020)7 slides · Nov 25, 2020
 Q3 2020 Earnings Presentation13 slides · Nov 3, 2020
 Merger or Acquisition (August 2020)21 slides · Aug 27, 2020
 Investor Presentation (August 2017)29 slides · Aug 4, 2017
 Investor Presentation (May 2017)29 slides · May 8, 2017
 Investor Presentation (March 2017)32 slides · Mar 1, 2017