Subsea 7 S.A. · OSL:SUBC
Subsea 7 — FY2021 Earnings Presentation
23 slides from Subsea 7's earnings presentation, Mar 3, 2022
Slide 1: Fourth Quarter and Full Year 2021 Earnings Presentation
Fourth Quarter and Full Year 2021 Earnings Presentation 3 March 2022 1 © Subsea 7 - 2022 subsea7.com
Slide 2: Forward-looking statements
Forward-looking statements This document may contain ‘forward-looking statements’ (within the meaning of the safe harbour provisions of the U.S. Private Securities Litigation Reform Act of 1995). These statements relate to our current expectations, beliefs, intentions, assumptions or strategies rega
Slide 3: Full year 2021 results
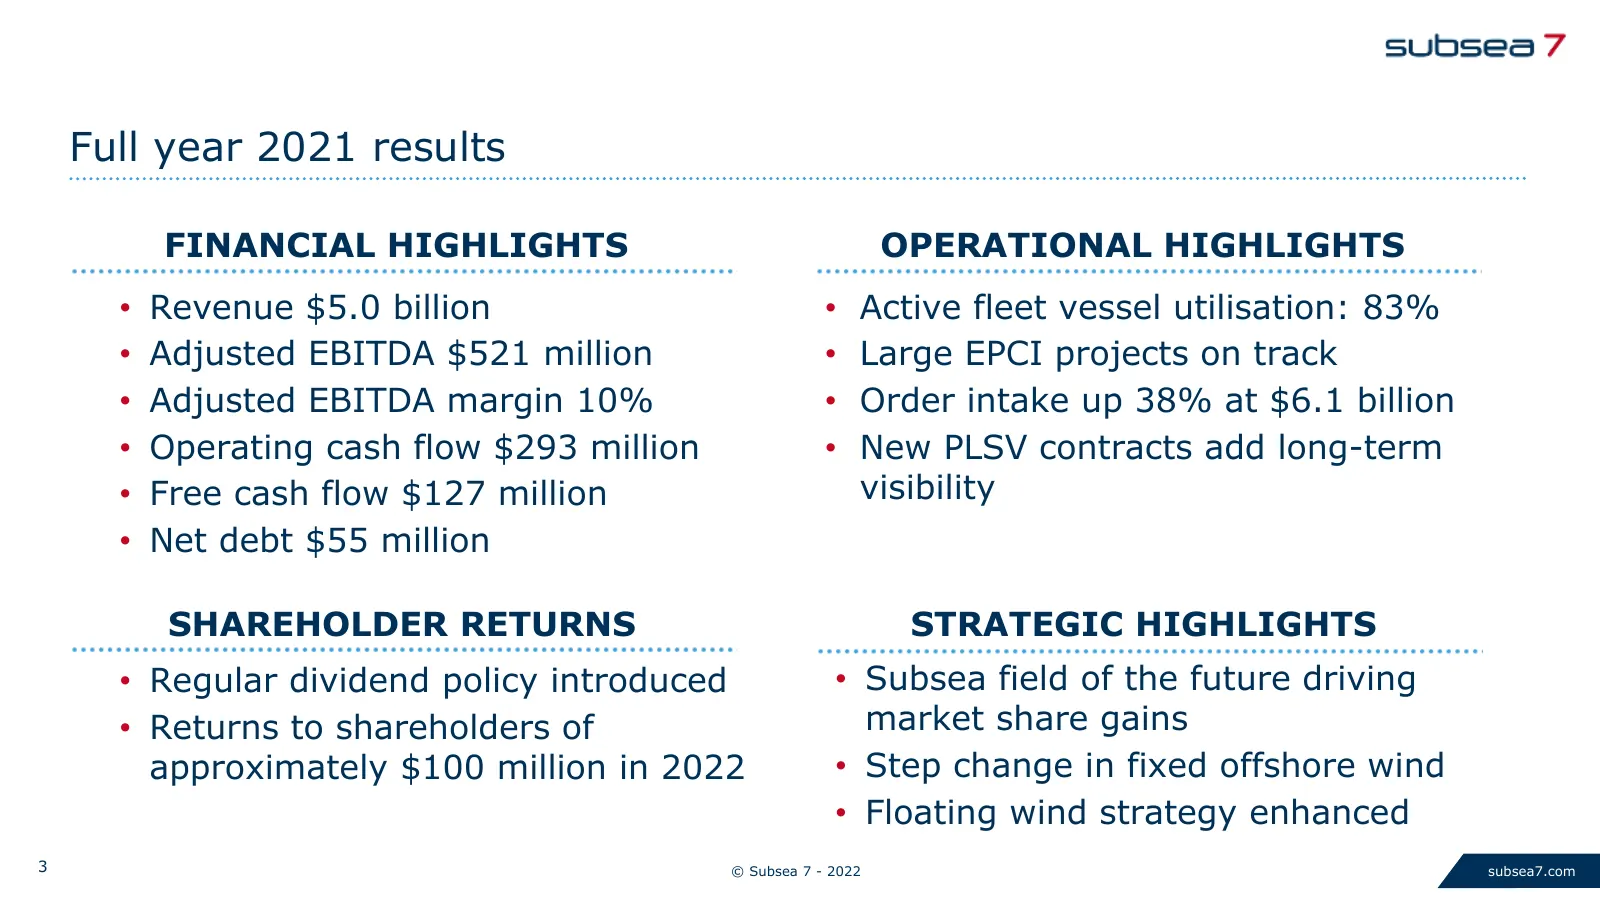
Full year 2021 results FINANCIAL HIGHLIGHTS OPERATIONAL HIGHLIGHTS • Revenue $5.0 billion • Active fleet vessel utilisation: 83% • Adjusted EBITDA $521 million • Large EPCI projects on track • Adjusted EBITDA margin 10% • Order intake up 38% at $6.1 billion • Operating cash flow $293 million • New P
Slide 4: Operational highlights
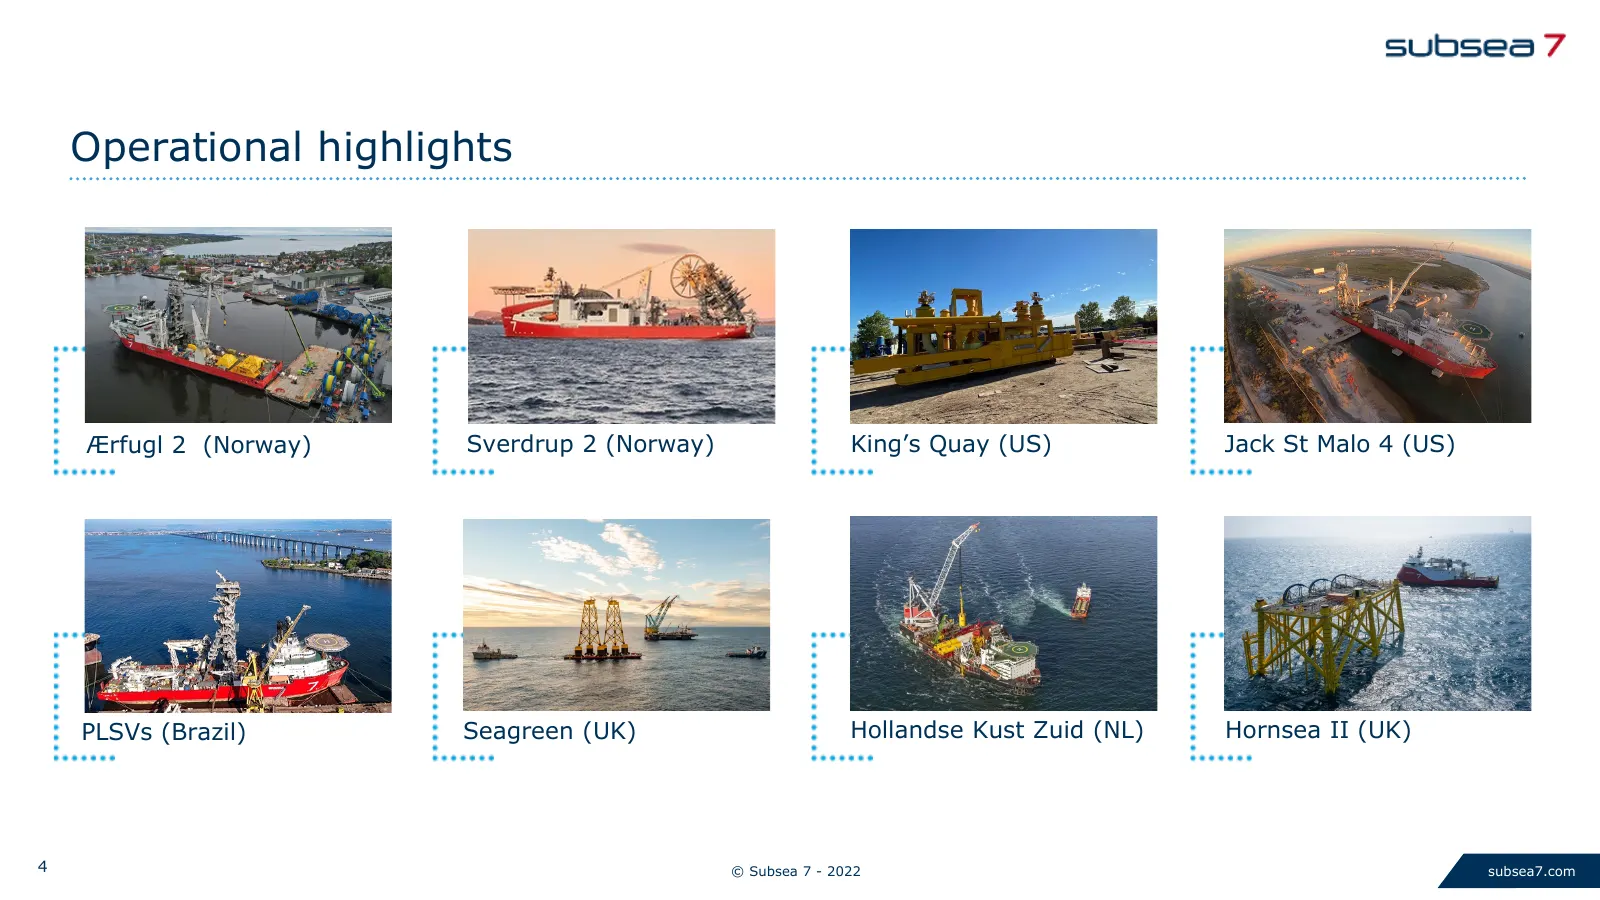
Operational highlights Ærfugl 2 (Norway) Sverdrup 2 (Norway) King’s Quay (US) Jack St Malo 4 (US) PLSVs (Brazil) Seagreen (UK) Hollandse Kust Zuid (NL) Hornsea II (UK) 4 © Subsea 7 - 2022 subsea7.com
Slide 5: Backlog by business unit
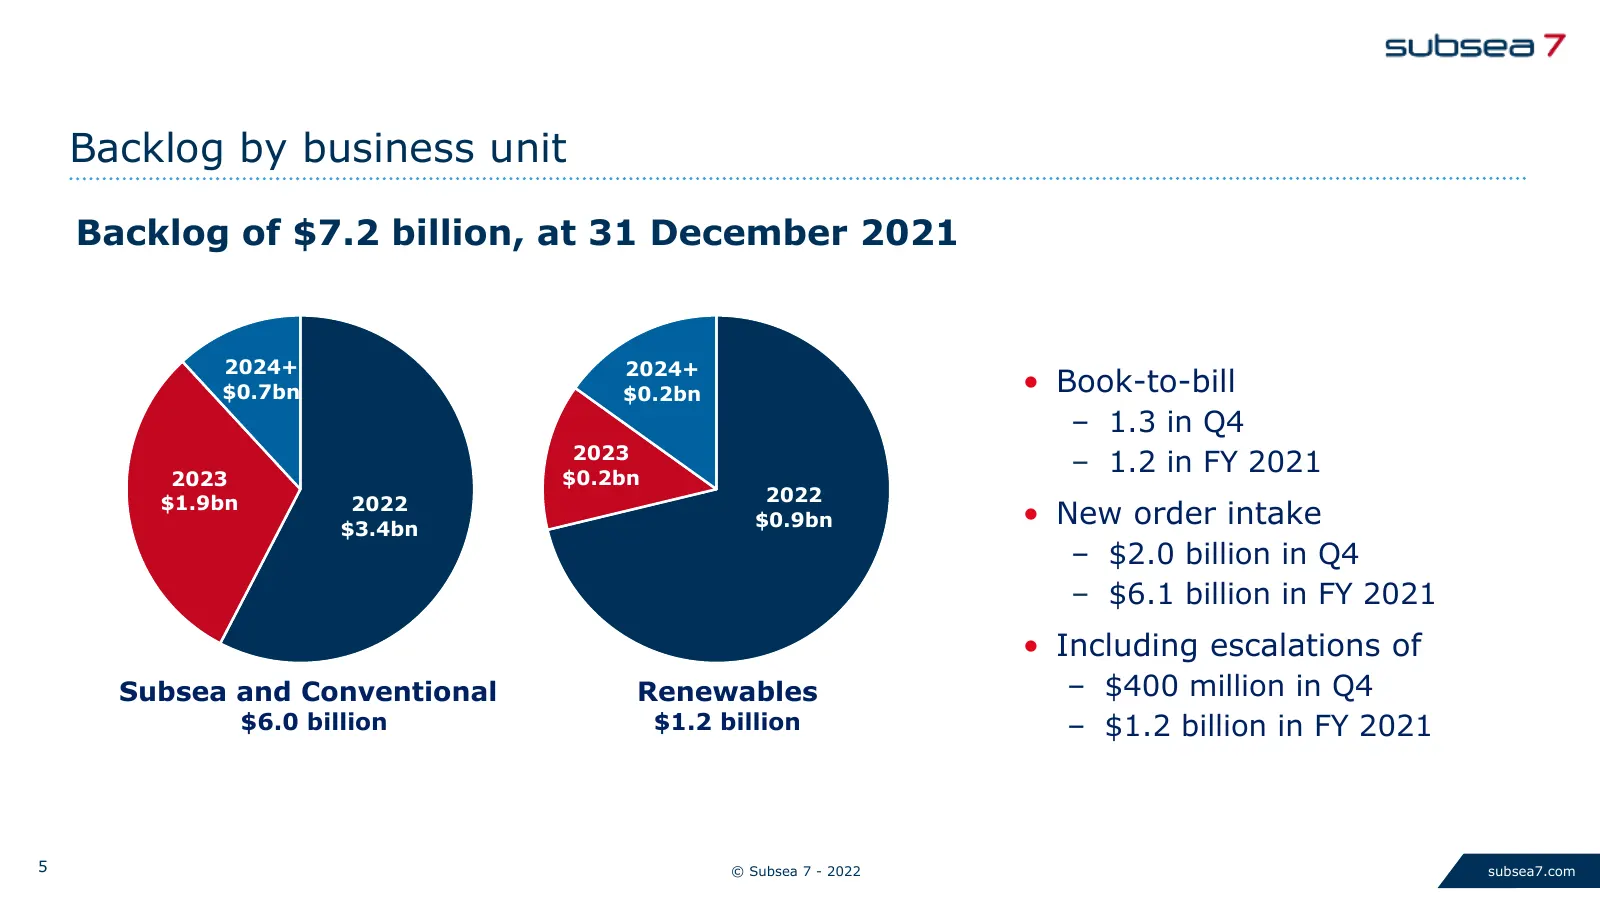
Backlog by business unit Backlog of $7.2 billion, at 31 December 2021 2024+ 2024+ $0.7bn $0.2bn • Book-to-bill – 1.3 in Q4 2023 2023 $0.2bn – 1.2 in FY 2021 $1.9bn 2022 2022 $3.4bn $0.9bn • New order intake – $2.0 billion in Q4 – $6.1 billion in FY 2021 • Including escalations of Subsea and Conventi
Slide 6: Fourth quarter 2021 - business unit performance
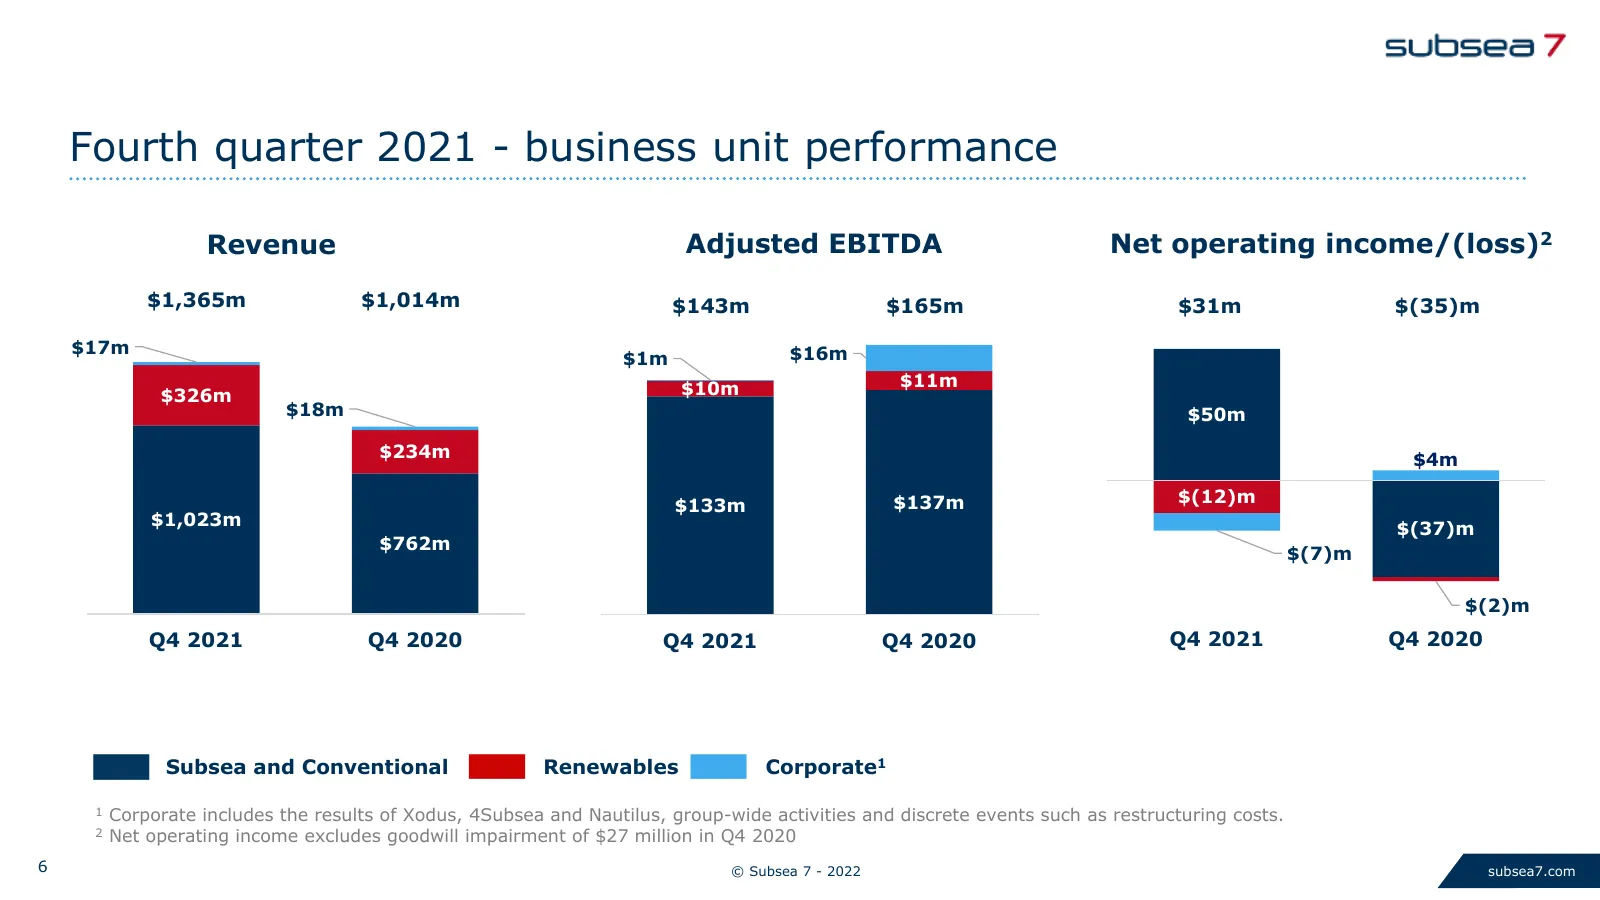
Fourth quarter 2021 - business unit performance Revenue Adjusted EBITDA Net operating income/(loss)2 $1,365m $1,014m $143m $165m $31m $(35)m $17m $16m $1m $10m $11m $326m $18m $50m $234m $4m $133m $137m $(12)m $1,023m $(37)m $762m $(7)m $(2)m Q4 2021 Q4 2020 Q4 2021 Q4 2020 Q4 2021 Q4 2020 Subsea an
Slide 7: Full year 2021 - business unit performance
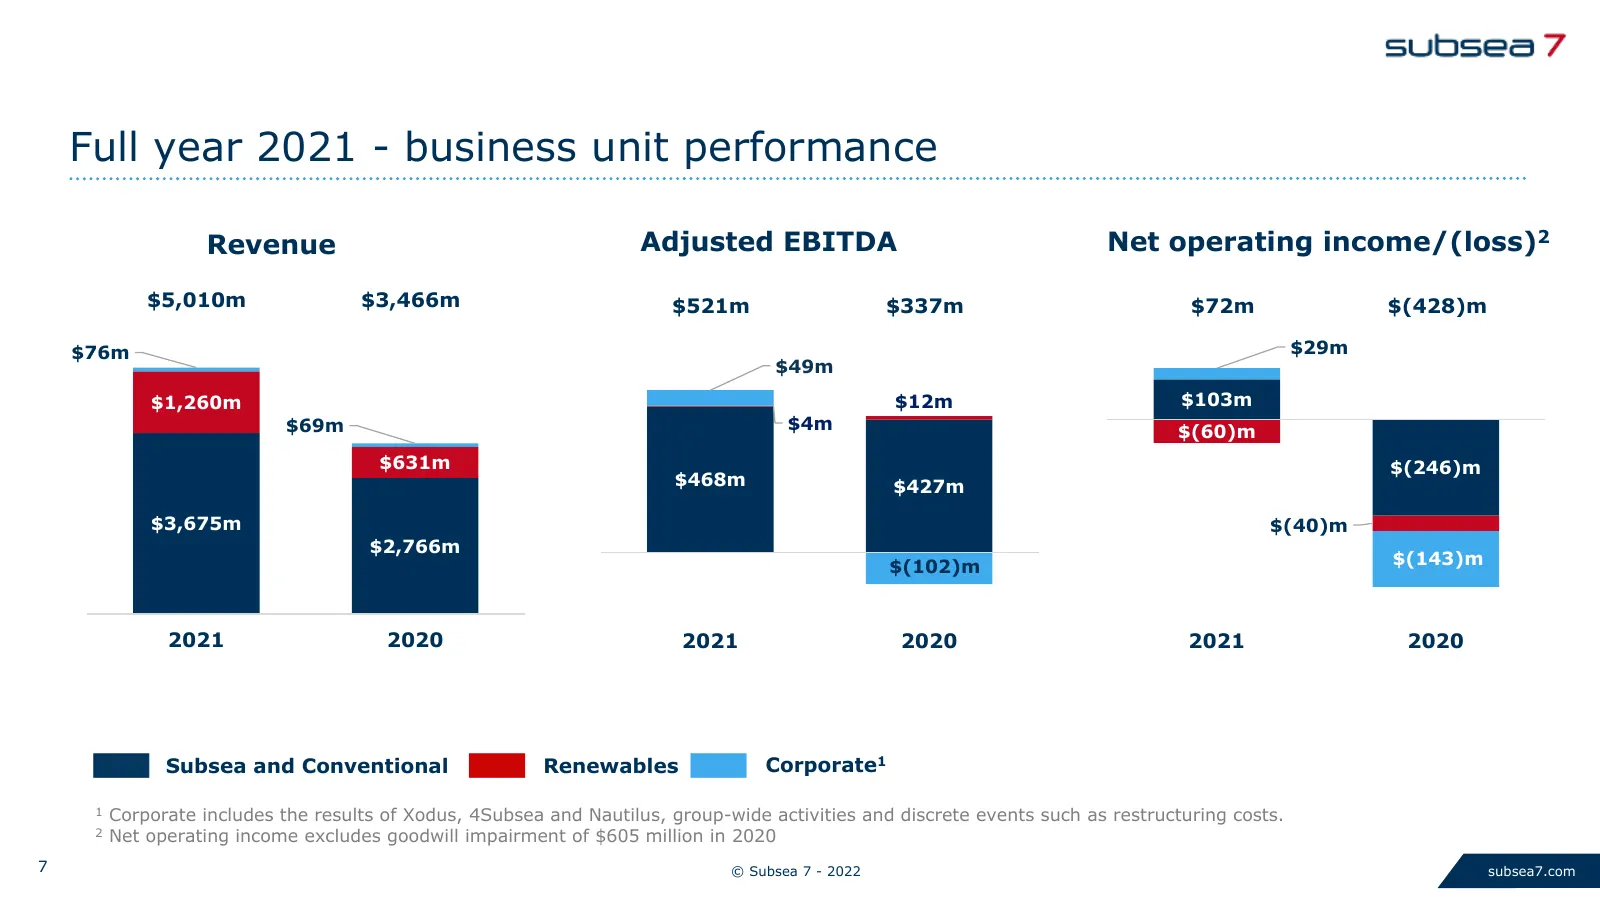
Full year 2021 - business unit performance Revenue Adjusted EBITDA Net operating income/(loss)2 $5,010m $3,466m $521m $337m $72m $(428)m $76m $29m $49m $1,260m $12m $103m $69m $4m $(60)m $631m $(246)m $468m $427m $3,675m $(40)m $2,766m $(102)m $(143)m 2021 2020 2021 2020 2021 2020 Subsea and Convent
Slide 8: Income statement summary - Q4 and FY 2021
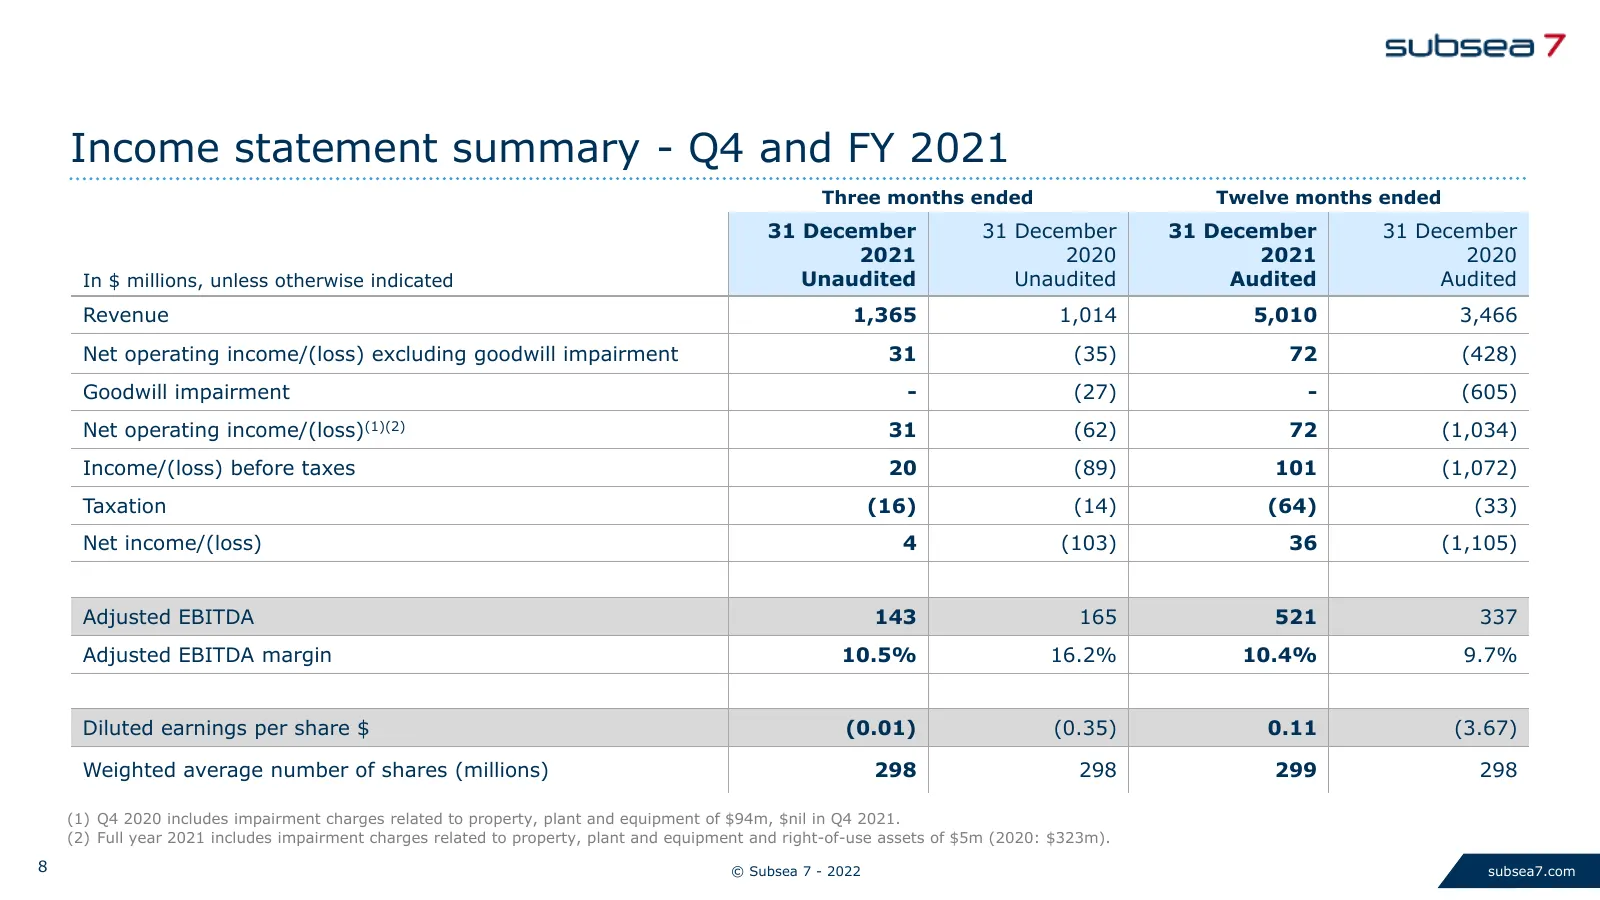
Income statement summary - Q4 and FY 2021 Three months ended Twelve months ended 31 December 31 December 31 December 31 December 2021 2020 2021 2020 In $ millions, unless otherwise indicated Unaudited Unaudited Audited Audited Revenue 1,365 1,014 5,010 3,466 Net operating income/(loss) excluding goo
Slide 9: Supplementary details - Q4 and FY 2021
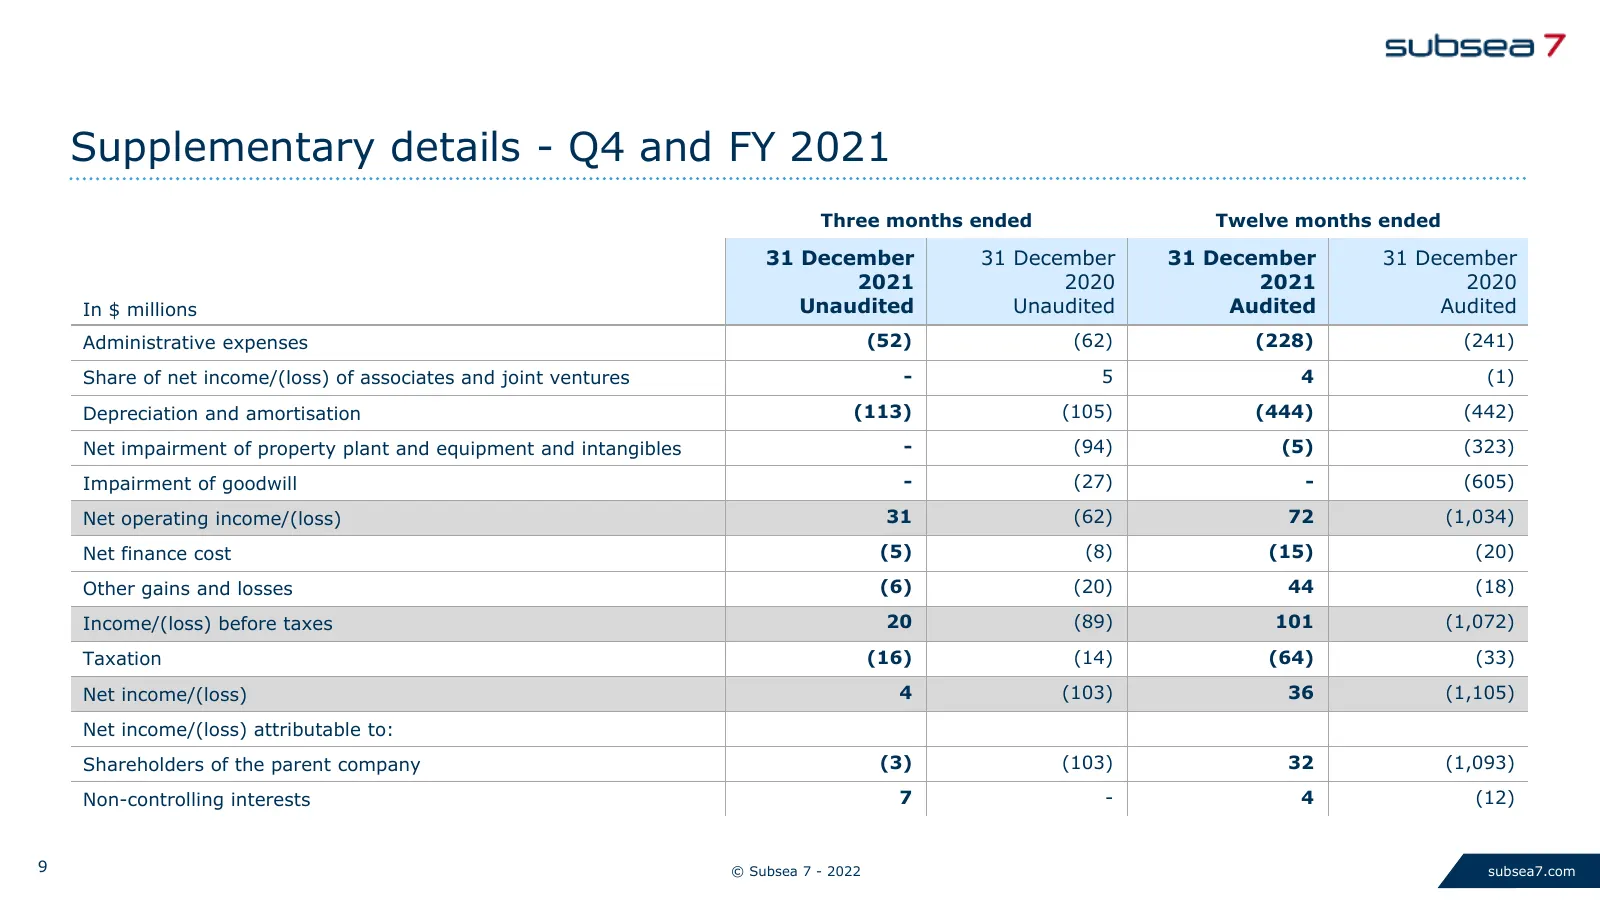
Supplementary details - Q4 and FY 2021 Three months ended Twelve months ended 31 December 31 December 31 December 31 December 2021 2020 2021 2020 In $ millions Unaudited Unaudited Audited Audited Administrative expenses (52) (62) (228) (241) Share of net income/(loss) of associates and joint venture
Slide 10: 2015 - 2021 costs overview
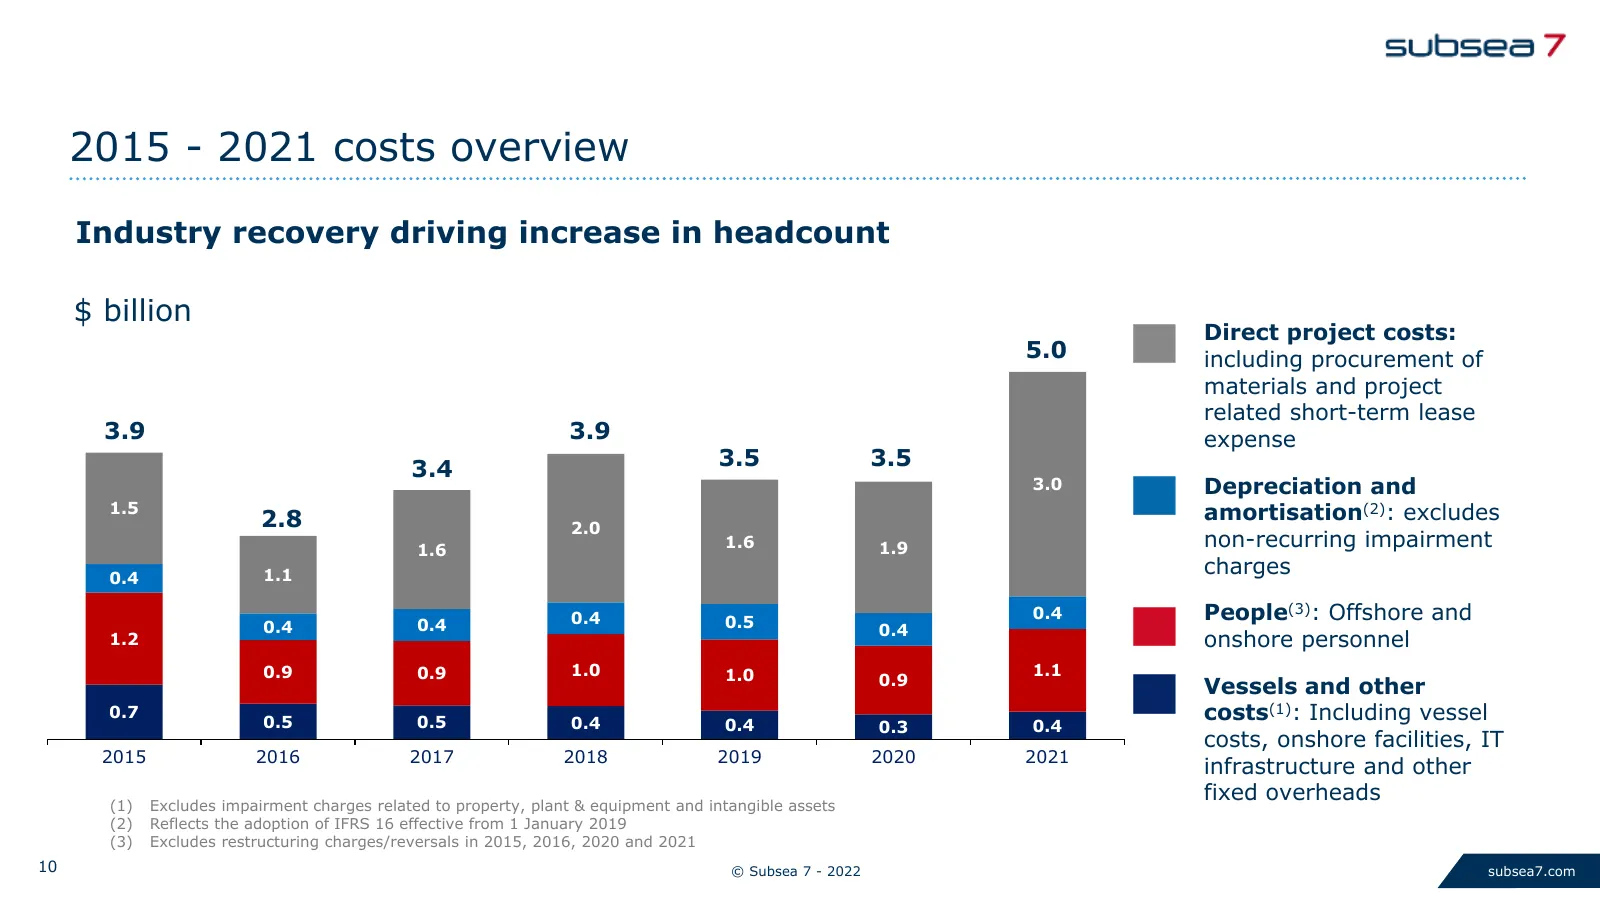
2015 - 2021 costs overview Industry recovery driving increase in headcount $ billion Direct project costs: 5.0 including procurement of materials and project related short-term lease 3.9 3.9 expense 3.4 3.5 3.5 3.0 Depreciation and 1.5 2.8 amortisation(2): excludes 2.0 1.6 1.6 1.9 non-recurring impa
Slide 11: Full year 2021 – summary cash flow
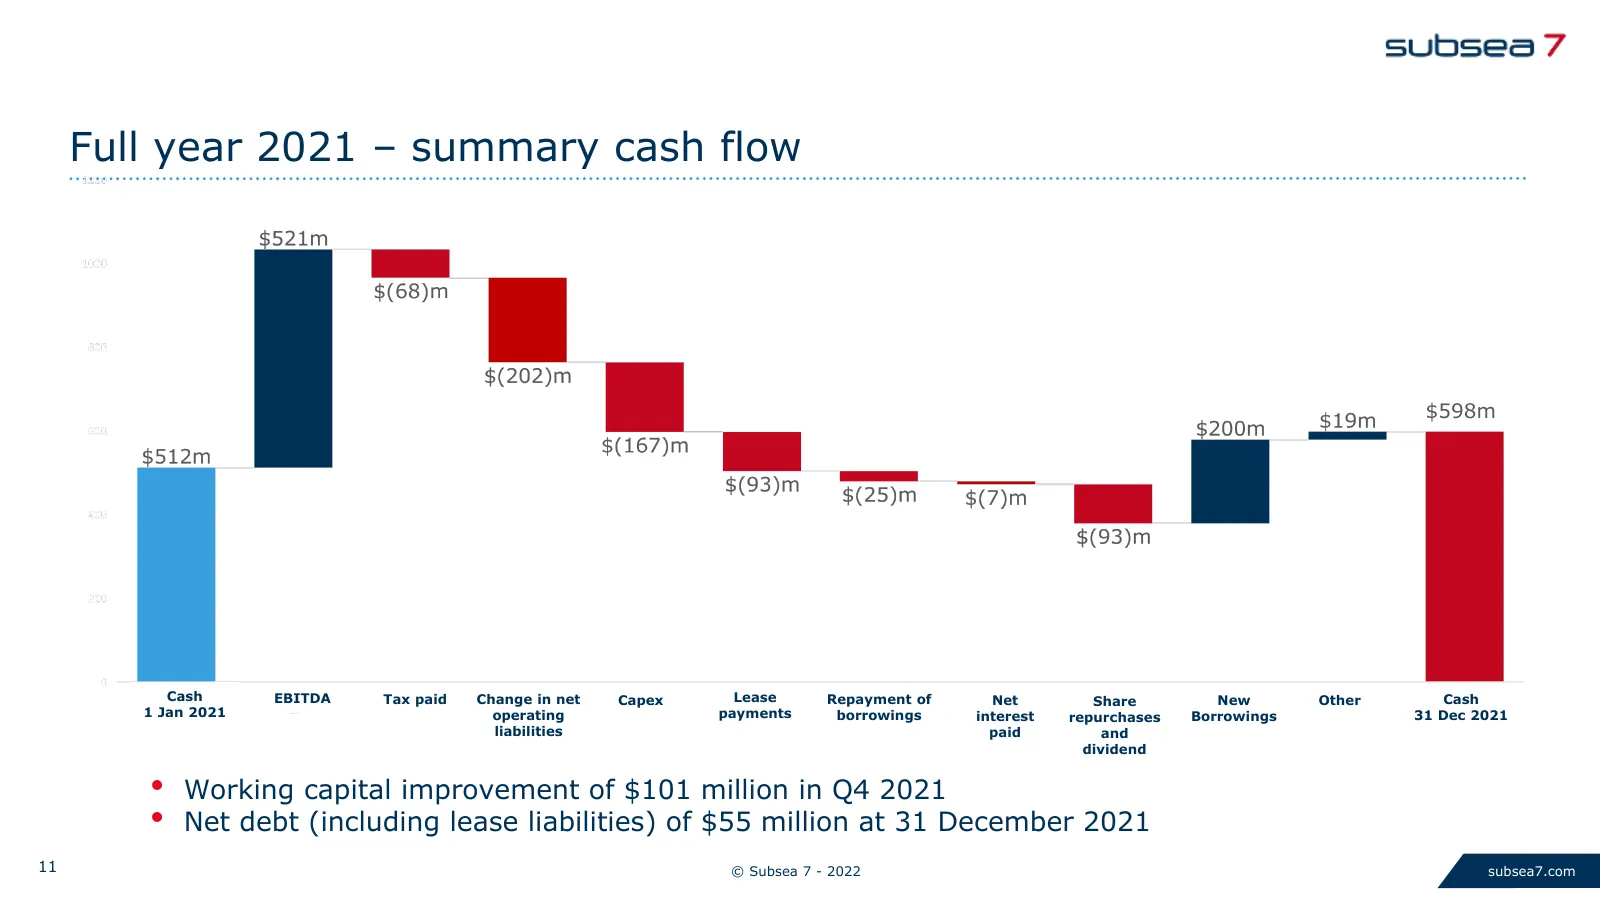
Full year 2021 – summary cash flow $598m Cash EBITDA Tax paid Change in net Capex Lease Repayment of Net Share New Other Cash 1 Jan 2021 operating payments borrowings interest repurchases Borrowings 31 Dec 2021 liabilities paid and dividend • Working capital improvement of $101 million in Q4 2021 •
Slide 12: Financial guidance
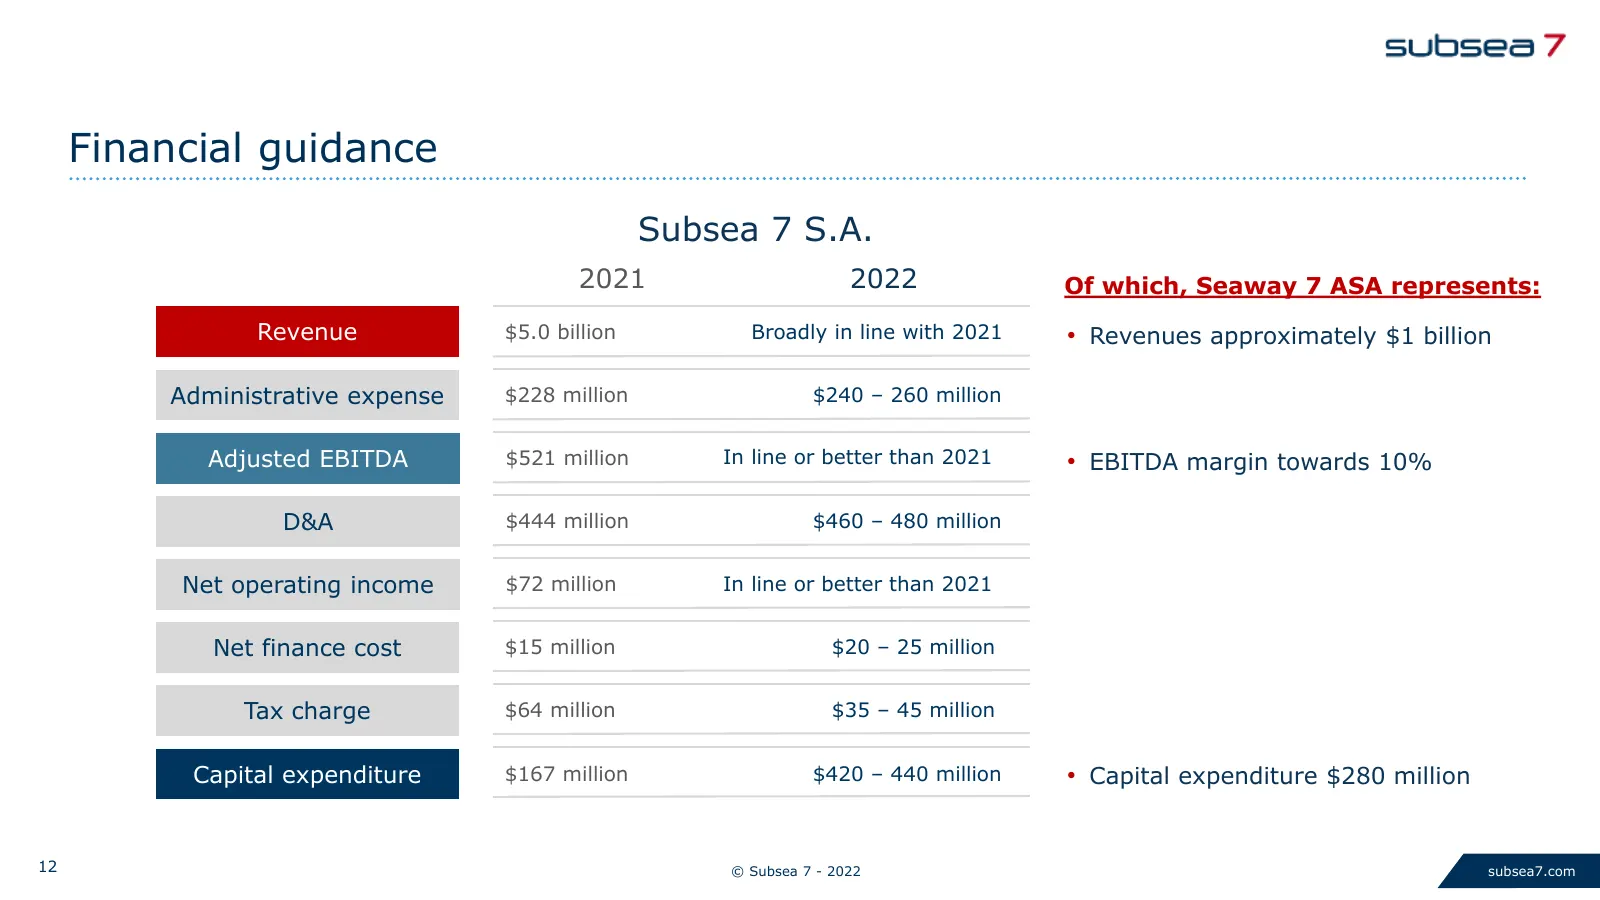
Financial guidance Subsea 7 S.A. 2021 2022 Of which, Seaway 7 ASA represents: Revenue $5.0 billion Broadly in line with 2021 • Revenues approximately $1 billion Administrative expense $228 million $240 – 260 million Adjusted EBITDA $521 million In line or better than 2021 • EBITDA margin towards 10%
Slide 13: Strategic focus areas
Strategic focus areas Subsea Field of the Future: Energy Transition: Systems and Delivery Proactive Participation • Early engagement and partnerships • Renewables – offshore wind • Systems innovation and enabling • Emerging energy – new markets and products opportunities • Integrated SPS and SURF •
Slide 14: Strategic progress: subsea field of the future
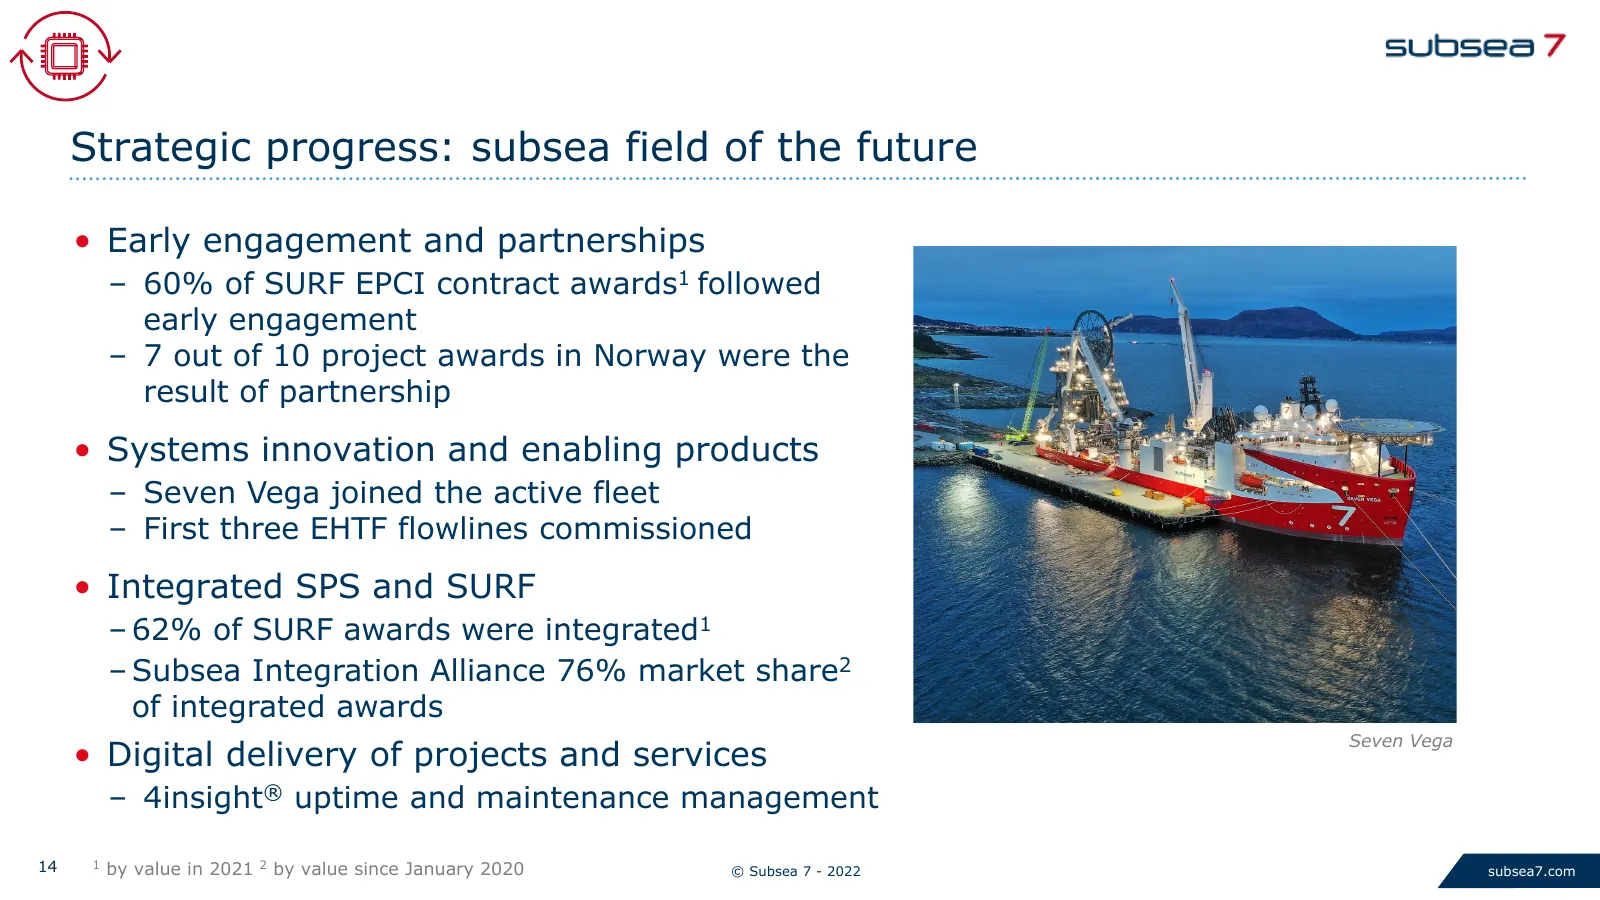
Strategic progress: subsea field of the future • Early engagement and partnerships – 60% of SURF EPCI contract awards1 followed early engagement – 7 out of 10 project awards in Norway were the result of partnership • Systems innovation and enabling products – Seven Vega joined the active fleet – Fir
Slide 15: Strategic progress: energy transition
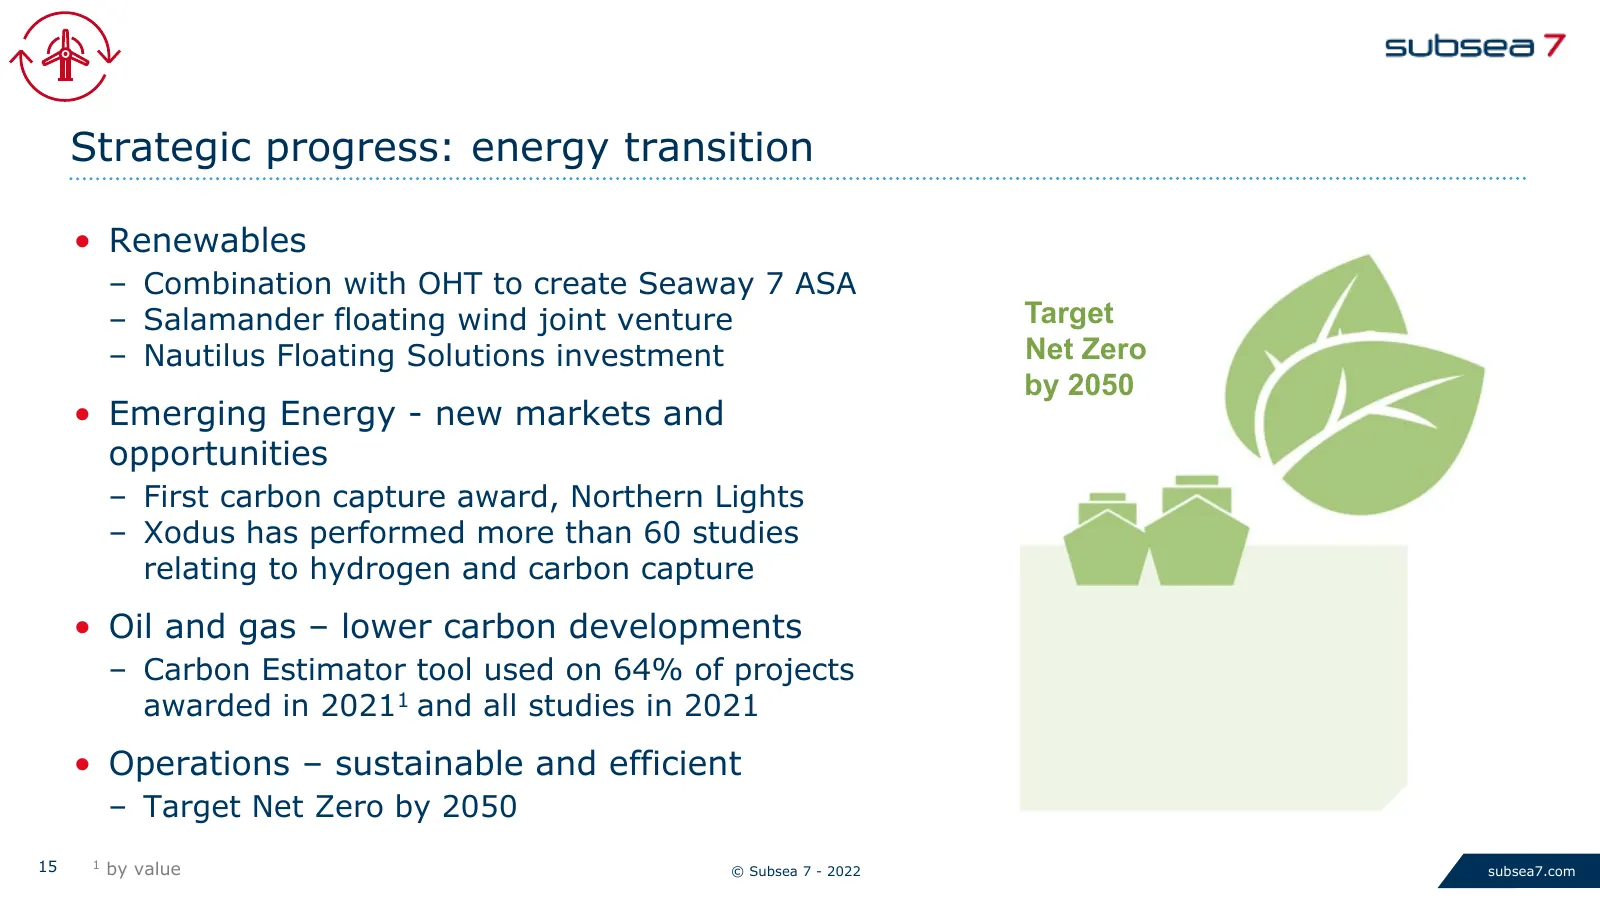
Strategic progress: energy transition • Renewables – Combination with OHT to create Seaway 7 ASA – Salamander floating wind joint venture Target – Nautilus Floating Solutions investment Net Zero by 2050 • Emerging Energy - new markets and opportunities – First carbon capture award, Northern Lights –
Slide 16: Capital allocation framework
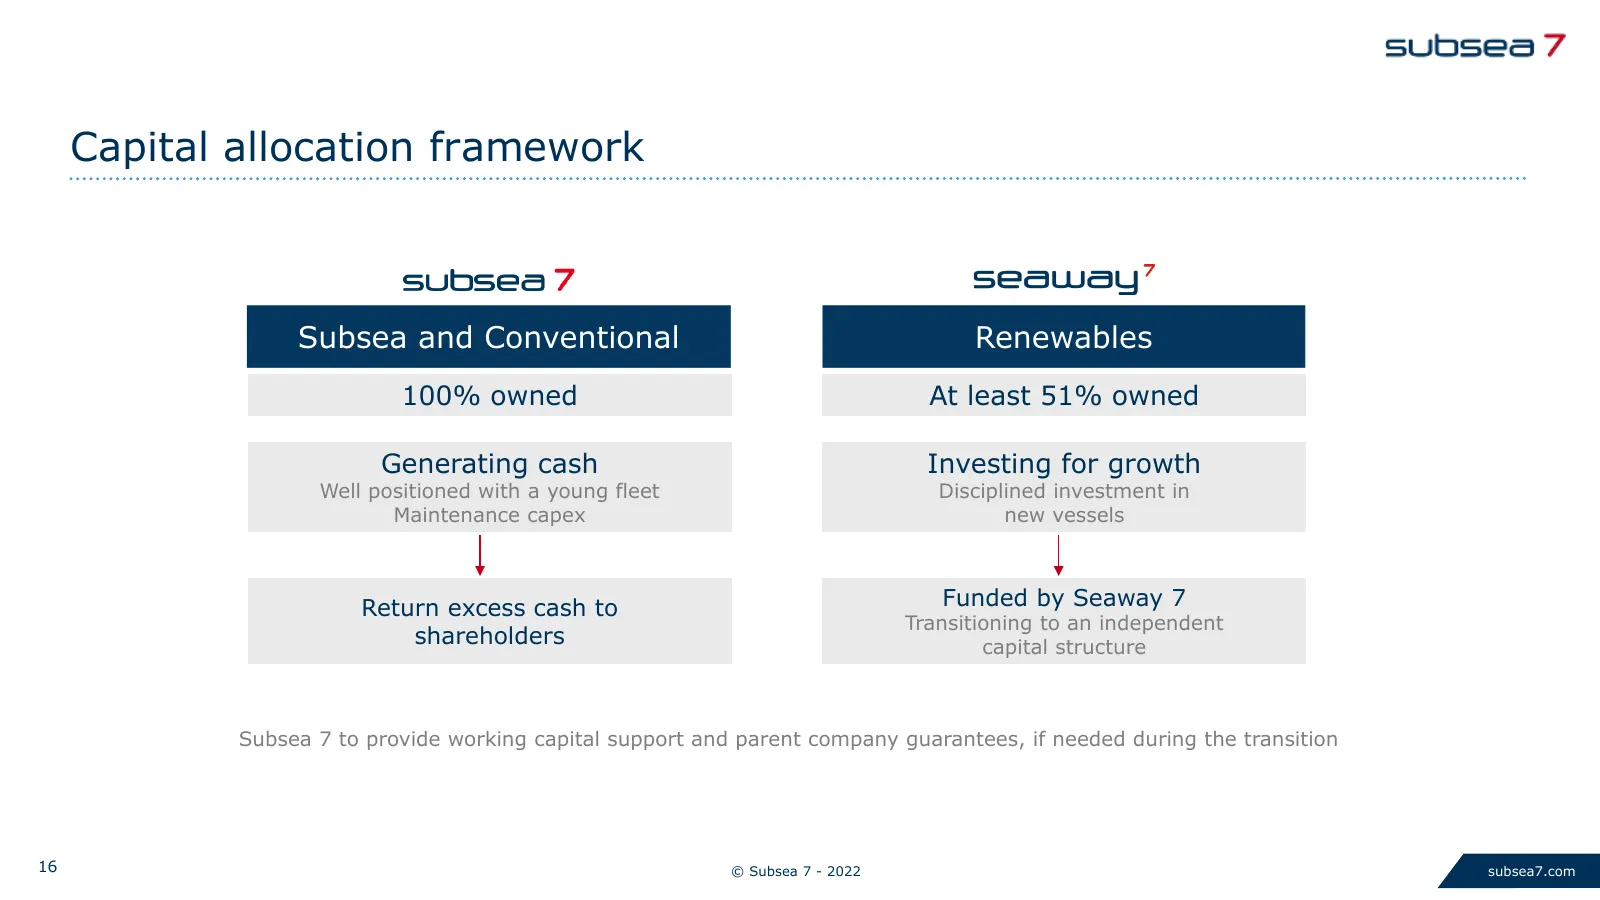
Capital allocation framework Subsea and Conventional Renewables 100% owned At least 51% owned Generating cash Investing for growth Well positioned with a young fleet Disciplined investment in Maintenance capex new vessels Return excess cash to Funded by Seaway 7 Transitioning to an independent share
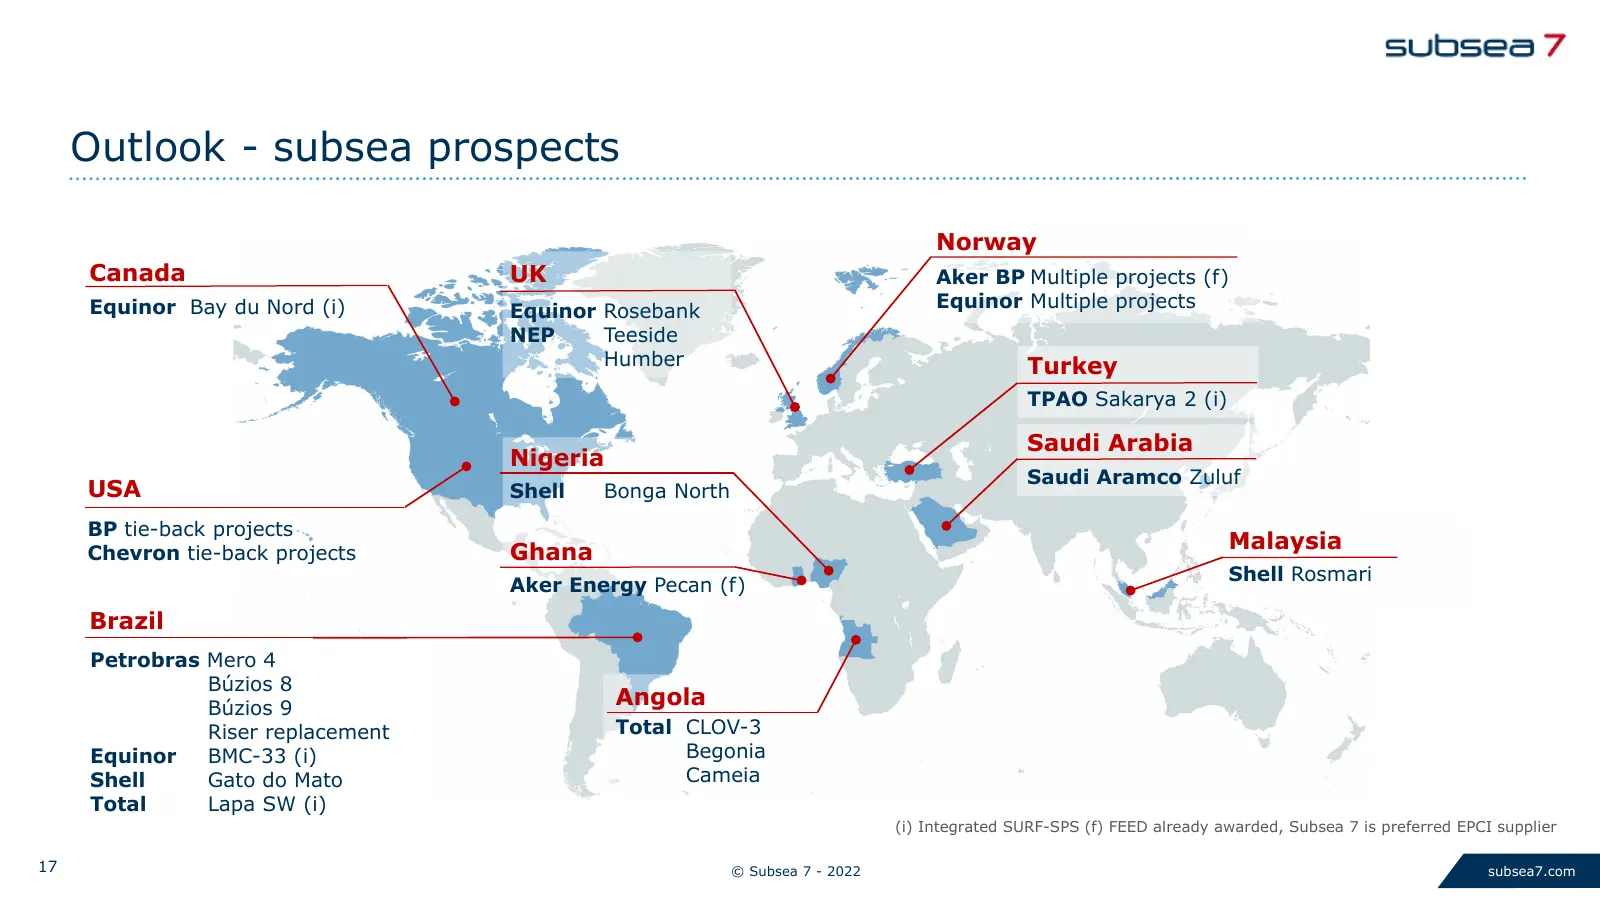
Slide 17: Outlook - subsea prospects
Outlook - subsea prospects Norway Canada UK Aker BP Multiple projects (f) Equinor Bay du Nord (i) Equinor Rosebank Equinor Multiple projects NEP Teeside Humber Turkey TPAO Sakarya 2 (i) Saudi Arabia Nigeria Saudi Aramco Zuluf USA Shell Bonga North BP tie-back projects Ghana Malaysia Chevron tie-back
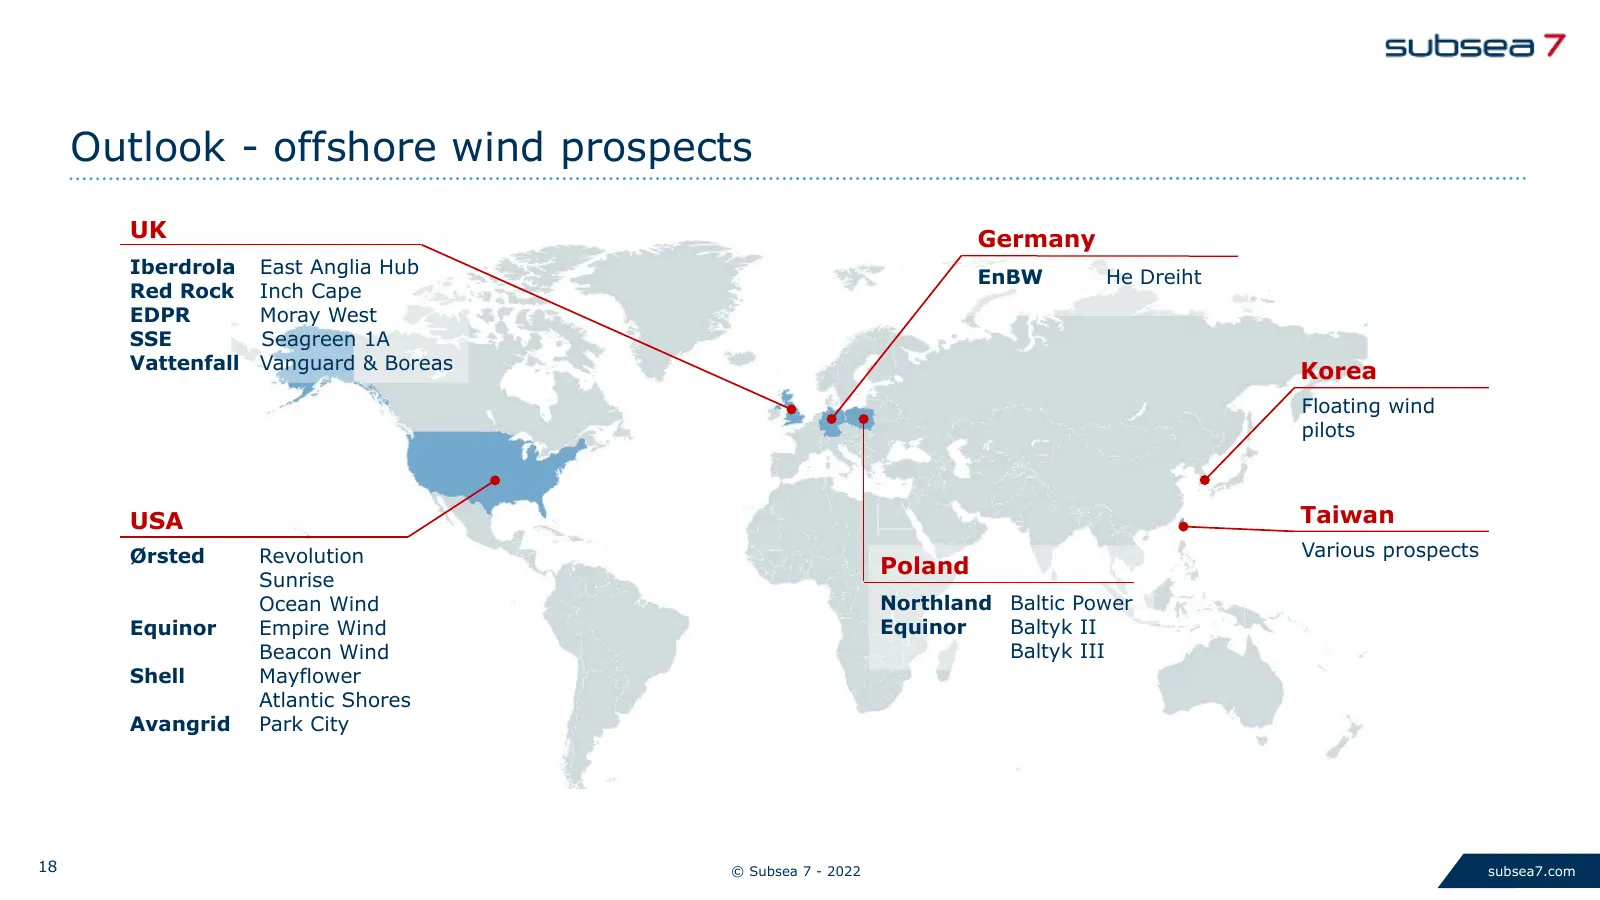
Slide 18: Outlook - offshore wind prospects
Outlook - offshore wind prospects UK Germany Iberdrola East Anglia Hub EnBW He Dreiht Red Rock Inch Cape EDPR Moray West SSE Seagreen 1A Vattenfall Vanguard & Boreas Korea Floating wind pilots USA Taiwan Ørsted Revolution Various prospects Poland Sunrise Ocean Wind Northland Baltic Power Equinor Emp
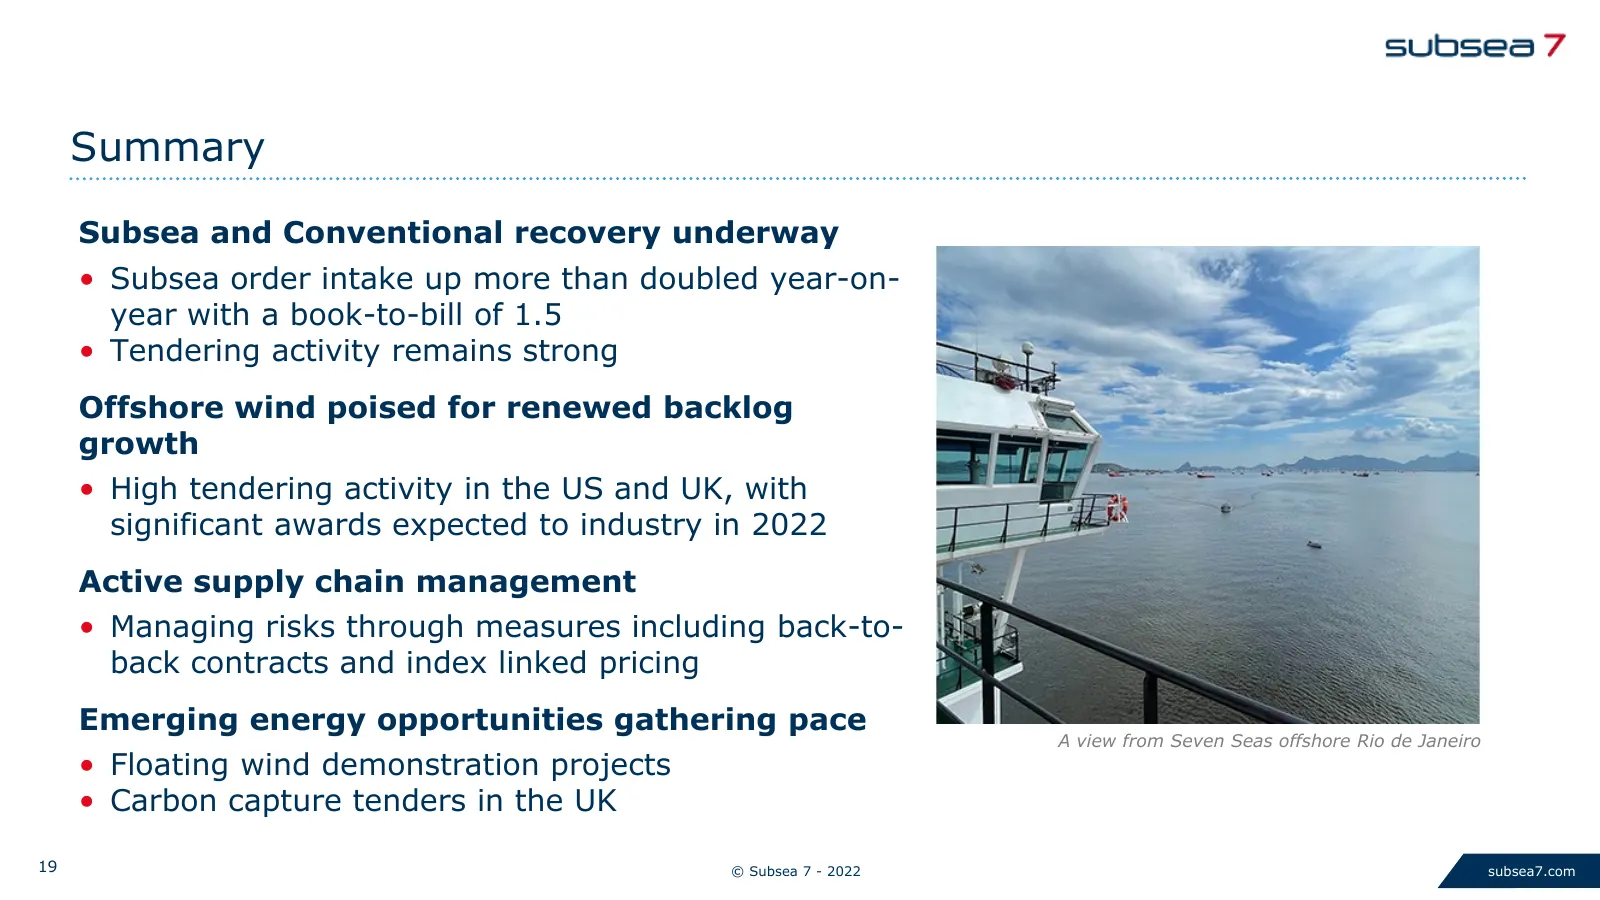
Slide 19: Summary
Summary Subsea and Conventional recovery underway • Subsea order intake up more than doubled year-on- year with a book-to-bill of 1.5 • Tendering activity remains strong Offshore wind poised for renewed backlog growth • High tendering activity in the US and UK, with significant awards expected to in
Slide 20: Q&A
Q&A 20 © Subsea 7 - 2022 subsea7.com
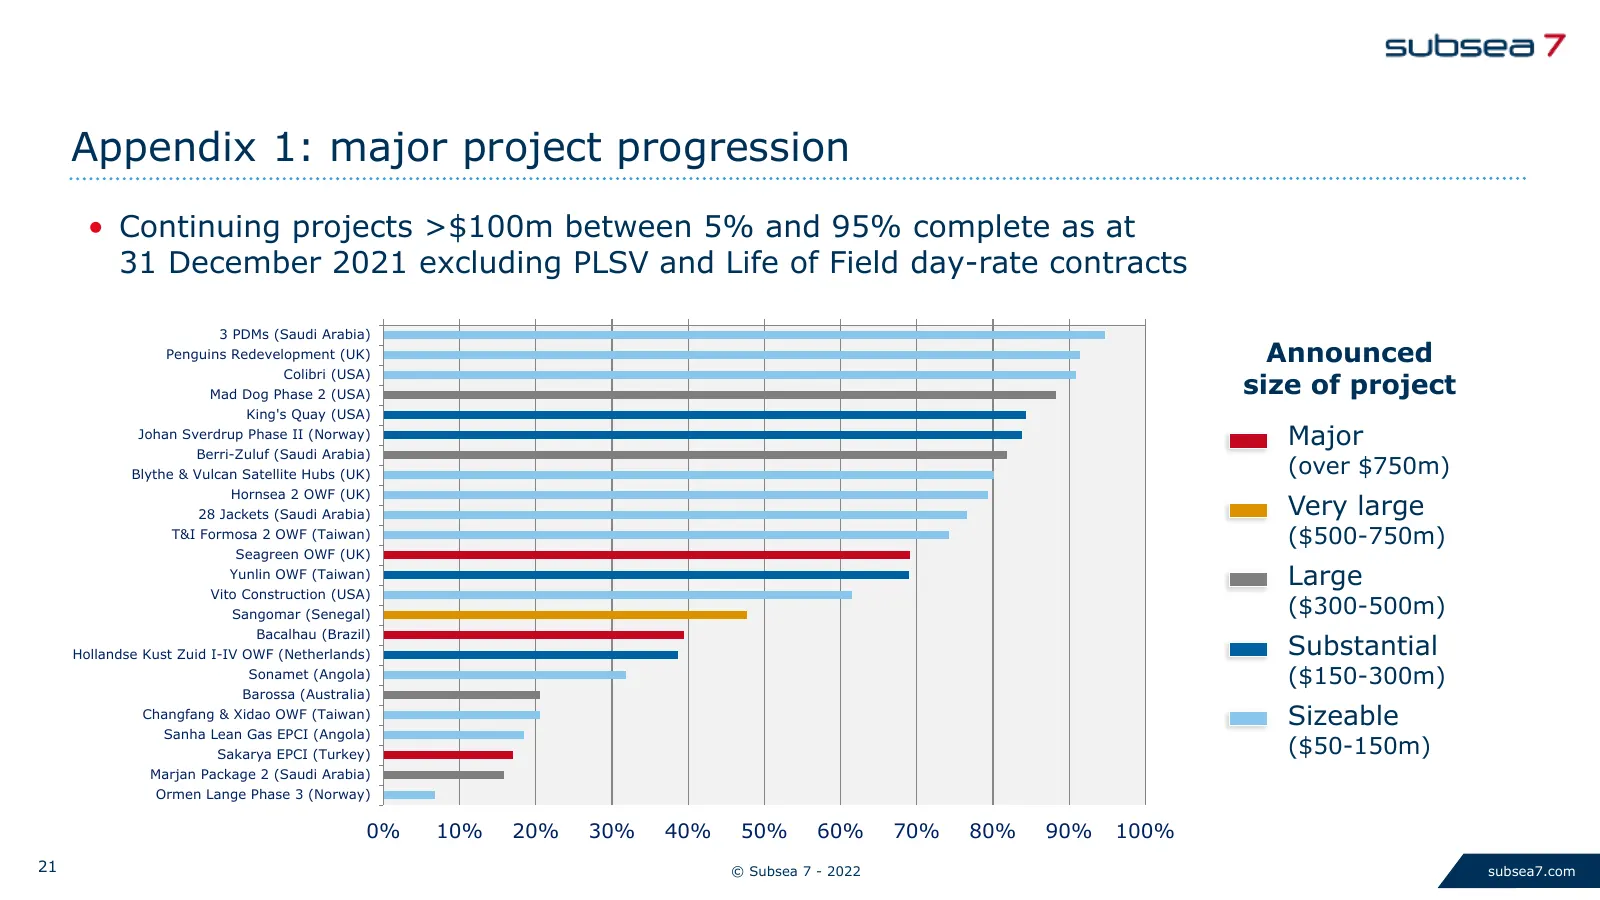
Slide 21: Appendix 1: major project progression
Appendix 1: major project progression • Continuing projects >$100m between 5% and 95% complete as at 31 December 2021 excluding PLSV and Life of Field day-rate contracts 3 PDMs (Saudi Arabia) Penguins Redevelopment (UK) Announced Colibri (USA) Mad Dog Phase 2 (USA) size of project King's Quay (USA)
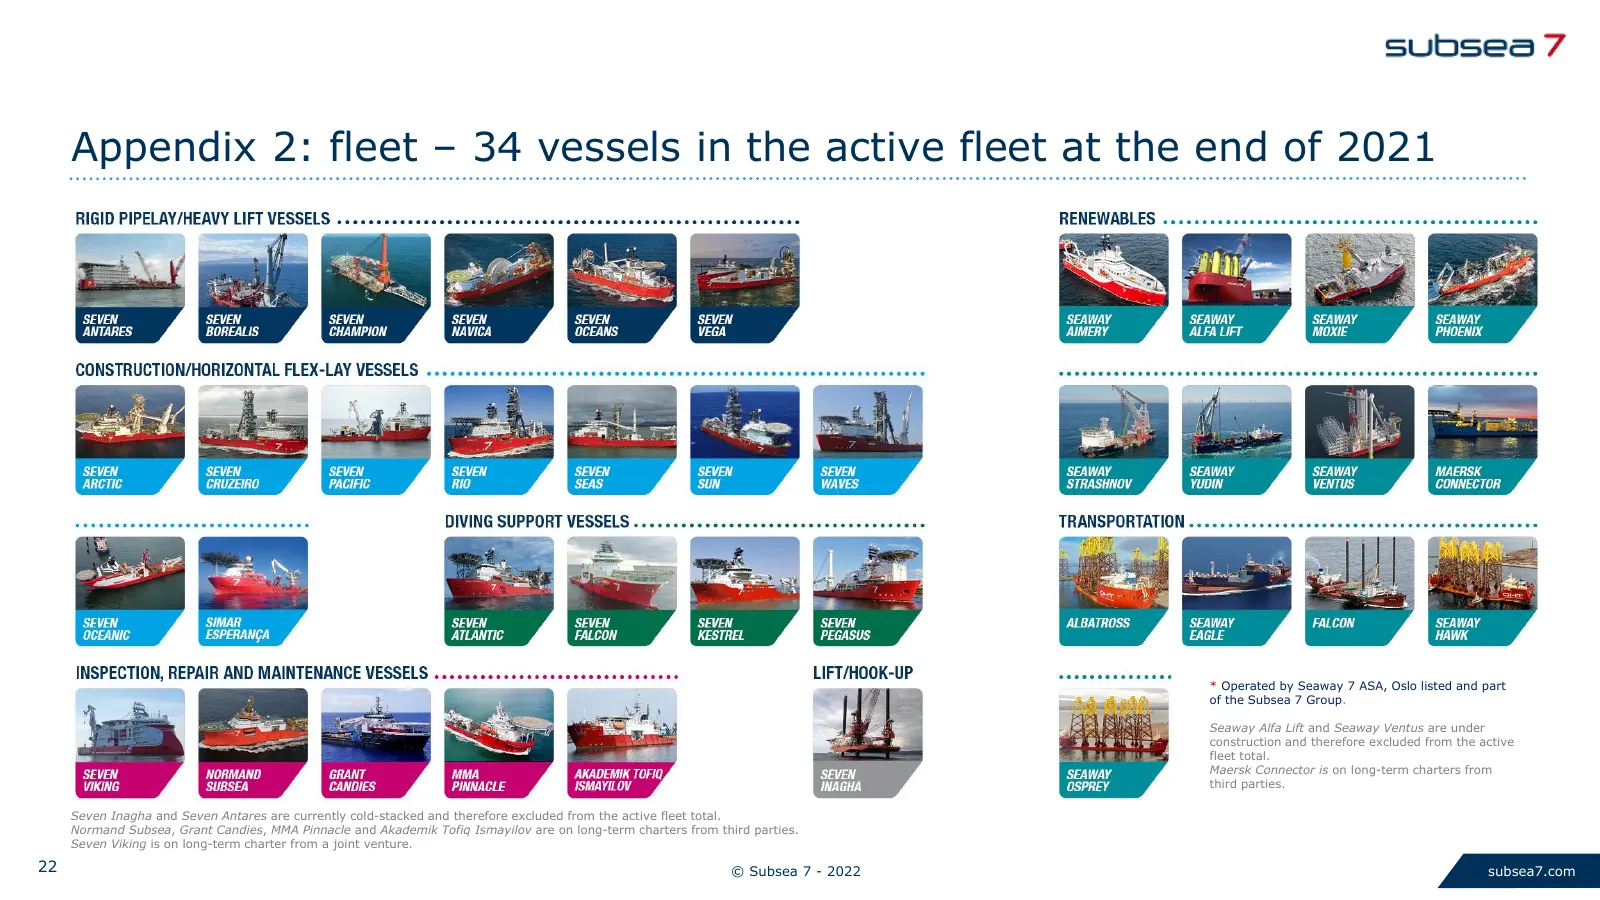
Slide 22: Appendix 2: fleet – vessels in the active fleet at the end of 2021
Appendix 2: fleet – 34 vessels in the active fleet at the end of 2021 * Operated by Seaway 7 ASA, Oslo listed and part of the Subsea 7 Group. Seaway Alfa Lift and Seaway Ventus are under construction and therefore excluded from the active fleet total. Maersk Connector is on long-term charters from t
Slide 23: © Subsea 7 - 2022 subsea7.com
23 © Subsea 7 - 2022 subsea7.com
Source: Internet Archive copy of subsea7.com
More decks from Subsea 7 S.A.
 Q2 2026 Earnings Presentation17 slides · Jul 30, 2026
 Q1 2026 Earnings Presentation20 slides · Apr 30, 2026
 Q4 2025 Earnings Presentation17 slides · Feb 26, 2026
 Q3 2025 Earnings Presentation18 slides · Nov 20, 2025
 Q2 2025 Earnings Presentation18 slides · Jul 31, 2025
 Merger or Acquisition (July 2025)21 slides · Jul 24, 2025