MB Financial — Merger or Acquisition (February 2016)
35 slides from MB Financial's merger presentation, Feb 10, 2016
Slide 1: Forward-Looking Statements
Forward-Looking Statements 1 When used in this presentation and in reports filed with or furnished to the Securities and Exchange Commission (the "SEC"), in press releases or other public stockholder communications, or in oral statements made with the approval of an authorized executive officer, the
Slide 2: Additional Information
Additional Information 2 In connection with the proposed merger between MB Financial and American Chartered, MB Financial has filed a registration statement on Form S-4 with the SEC, which was declared effective by the SEC on February 4, 2016. The registration statement includes a proxy statement/pr
Slide 3: Company Highlights
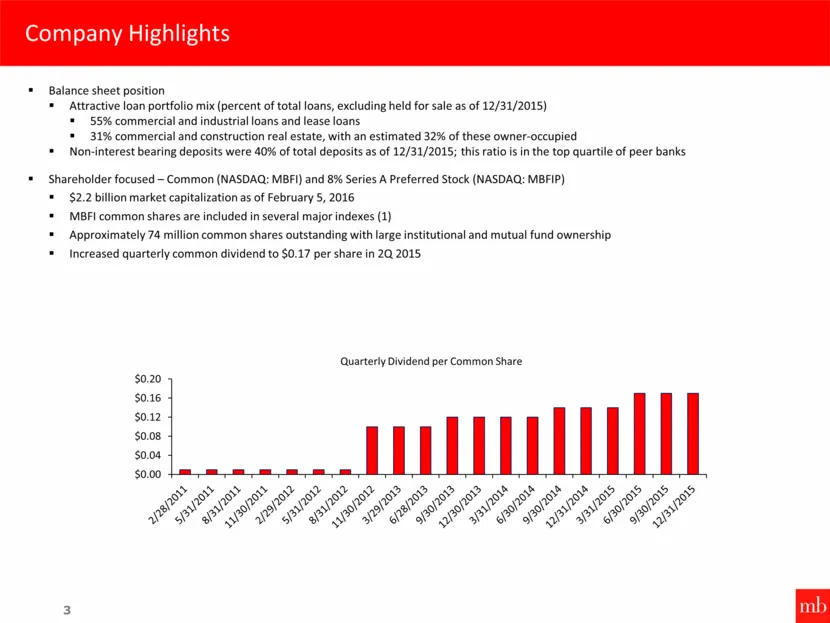
Company Highlights 3 Balance sheet position Attractive loan portfolio mix (percent of total loans, excluding held for sale as of 12/31/2015) 55% commercial and industrial loans and lease loans 31% commercial and construction real estate, with an estimated 32% of these owner-occupied Non-interest bea
Slide 4: Company Strategy
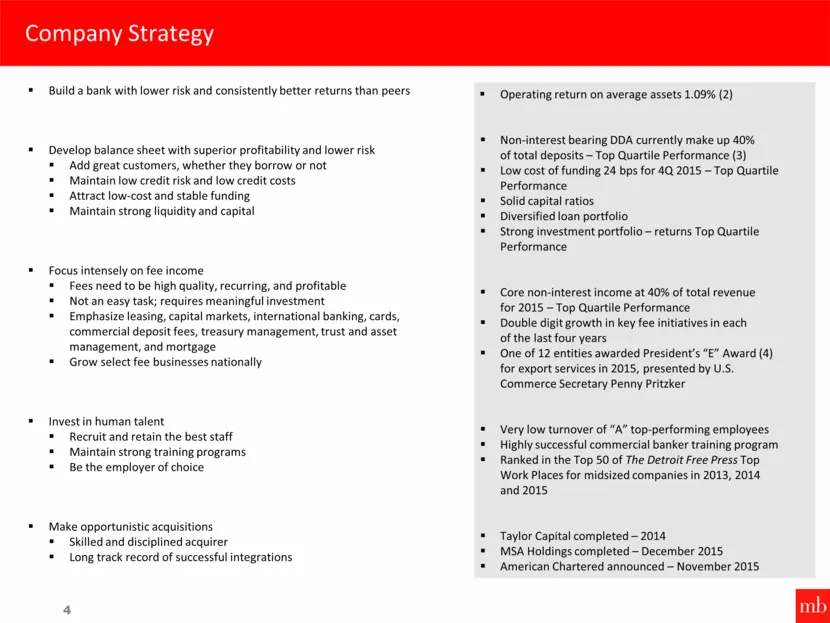
Company Strategy 4 Operating return on average assets 1.09% (2) Non-interest bearing DDA currently make up 40% of total deposits – Top Quartile Performance (3) Low cost of funding 24 bps for 4Q 2015 – Top Quartile Performance Solid capital ratios Diversified loan portfolio Strong investment portfoli
Slide 5: Banking Segment
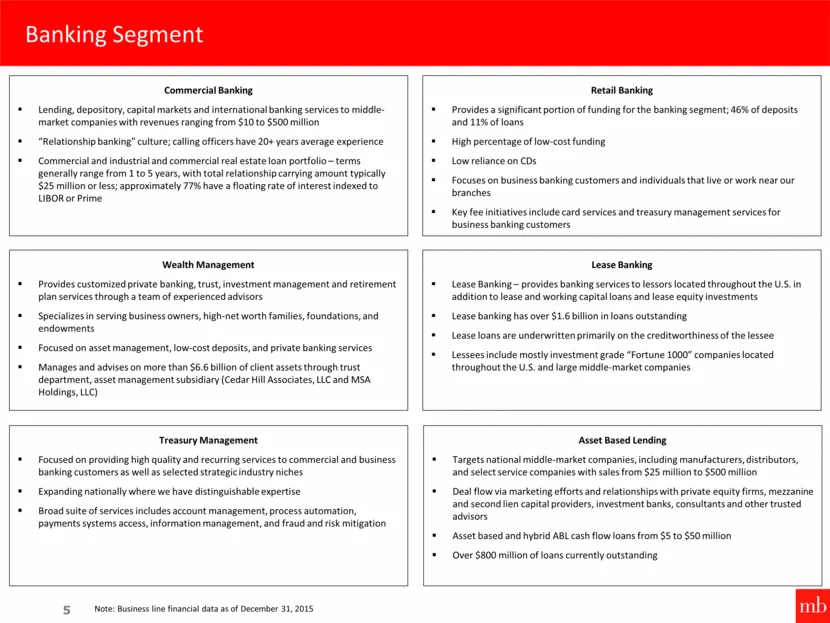
Banking Segment 5 Retail Banking Provides a significant portion of funding for the banking segment; 46% of deposits and 11% of loans High percentage of low-cost funding Low reliance on CDs Focuses on business banking customers and individuals that live or work near our branches Key fee initiatives i
Slide 6: Leasing Segment
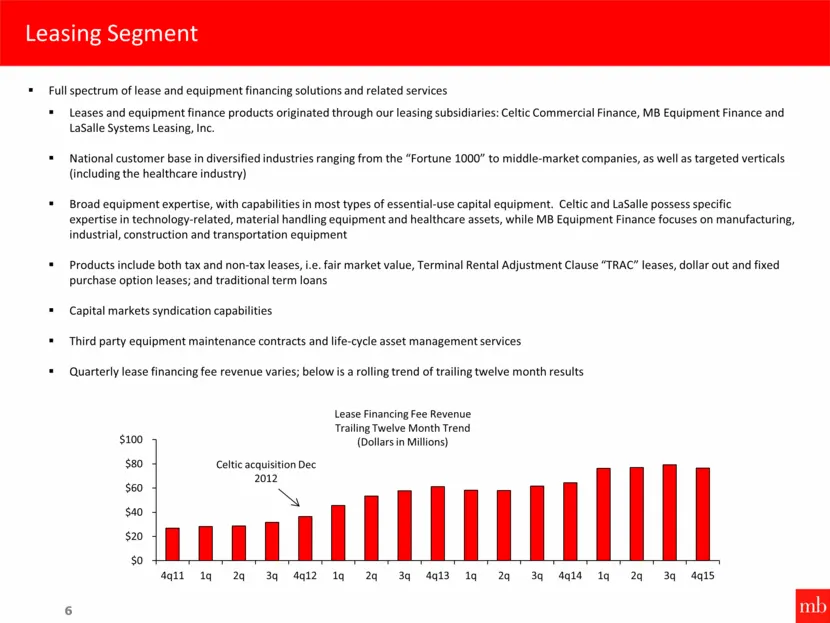
Leasing Segment 6 Full spectrum of lease and equipment financing solutions and related services Leases and equipment finance products originated through our leasing subsidiaries: Celtic Commercial Finance, MB Equipment Finance and LaSalle Systems Leasing, Inc. National customer base in diversified i
Slide 7: Mortgage Segment
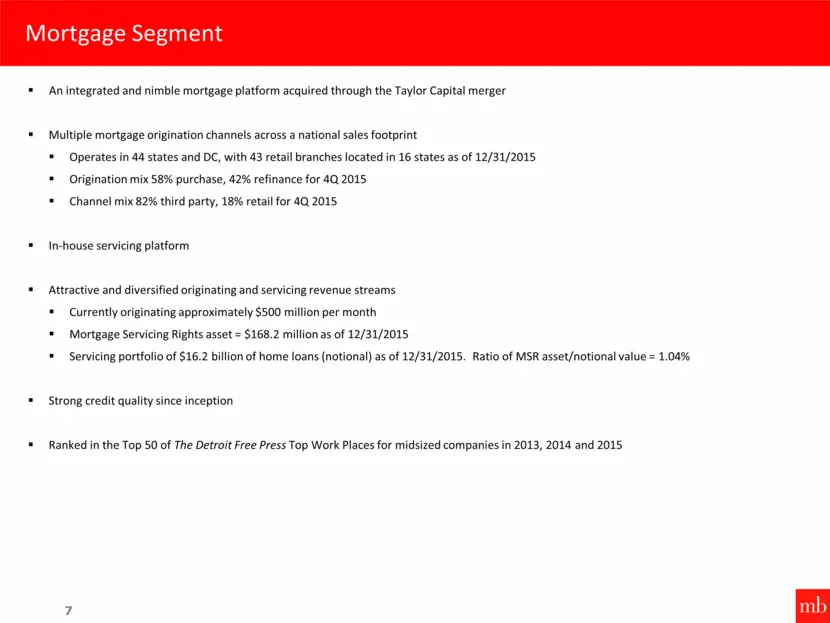
Mortgage Segment 7 An integrated and nimble mortgage platform acquired through the Taylor Capital merger Multiple mortgage origination channels across a national sales footprint Operates in 44 states and DC, with 43 retail branches located in 16 states as of 12/31/2015 Origination mix 58% purchase,
Slide 8: Diversified Loan Portfolio
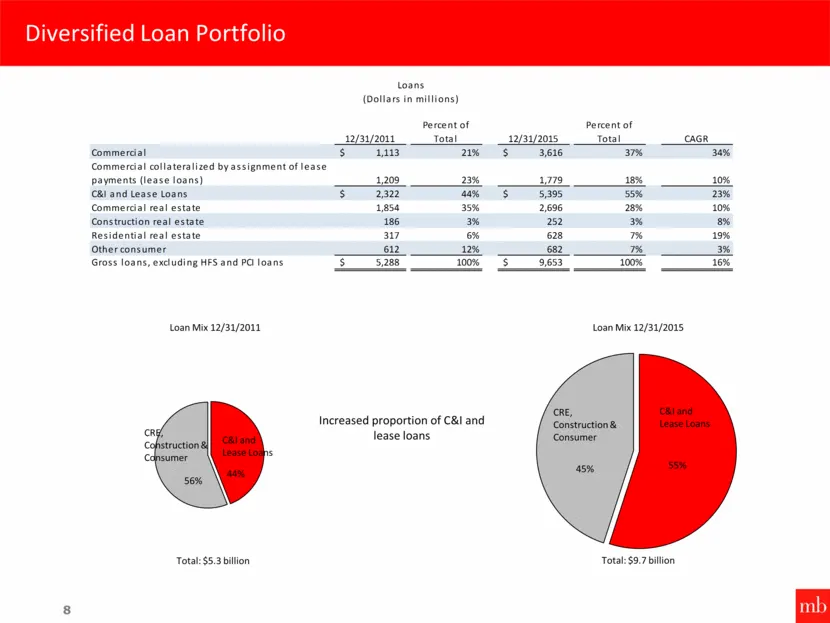
Diversified Loan Portfolio 8 Loan Mix 12/31/2015 Total: $9.7 billion Loan Mix 12/31/2011 Total: $5.3 billion Increased proportion of C&I and lease loans 55% 45% C&I and Lease Loans CRE, Construction & Consumer 44% 56% C&I and Lease Loans CRE, Construction & Consumer 12/31/2011 Percent of Total 12/31
Slide 9: Asset Quality Statistics
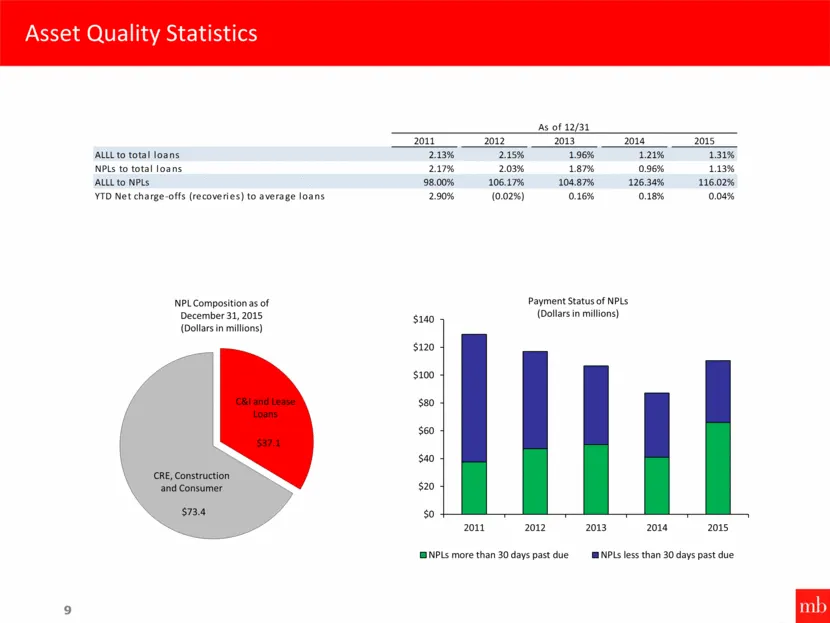
NPL Composition as of December 31, 2015 (Dollars in millions) Asset Quality Statistics 9 Payment Status of NPLs (Dollars in millions) C&I and Lease Loans CRE, Construction and Consumer $37.1 $73.4 $0 $20 $40 $60 $80 $100 $120 $140 2011 2012 2013 2014 2015 NPLs more than 30 days past due NPLs less th
Slide 10: Investment Portfolio – Top Quartile Performance
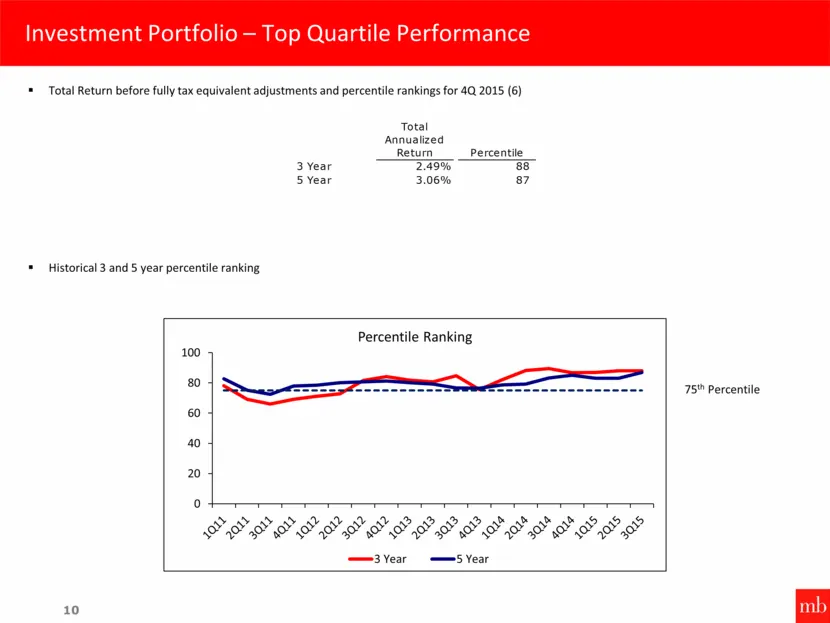
10 Investment Portfolio – Top Quartile Performance 75th Percentile Total Return before fully tax equivalent adjustments and percentile rankings for 4Q 2015 (6) Historical 3 and 5 year percentile ranking 0 20 40 60 80 100 Percentile Ranking 3 Year 5 Year Total Annualized Return Percentile 3 Year 2.49
Slide 11: Attractive Deposit Mix with Significant Concentration of Low-Cost Deposits
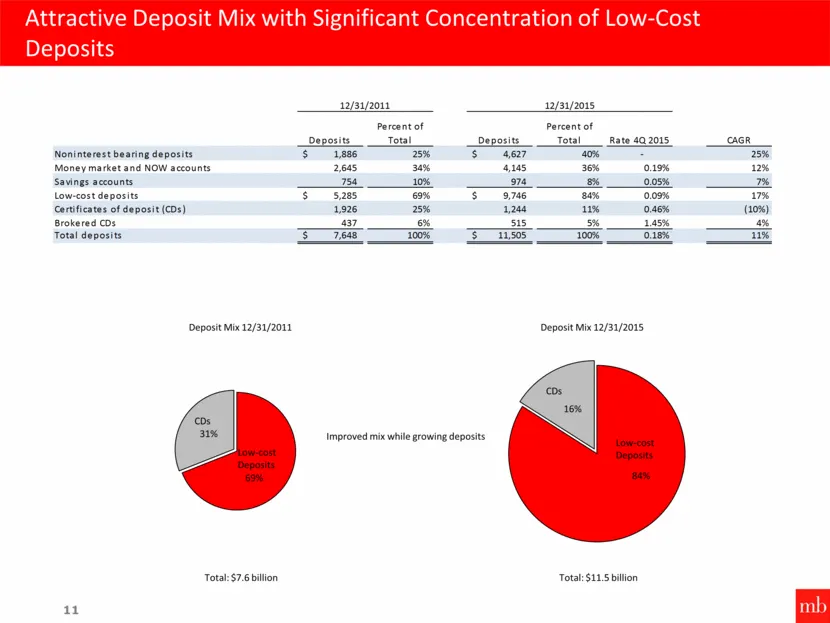
Attractive Deposit Mix with Significant Concentration of Low-Cost Deposits 11 Deposit Mix 12/31/2015 Total: $11.5 billion Deposit Mix 12/31/2011 Total: $7.6 billion Improved mix while growing deposits 84% 16% Low - cost Deposits CDs 69% 31% Low - cost Deposits CDs Deposits Percent of Total Deposits
Slide 12: Capital Planning
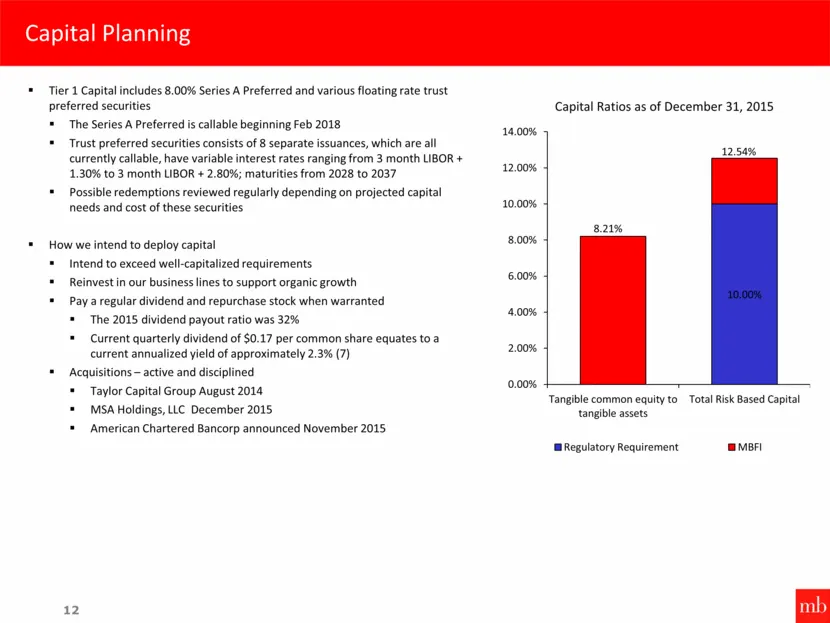
Capital Planning 12 Tier 1 Capital includes 8.00% Series A Preferred and various floating rate trust preferred securities The Series A Preferred is callable beginning Feb 2018 Trust preferred securities consists of 8 separate issuances, which are all currently callable, have variable interest rates
Slide 13: Summary Income Statement and EPS
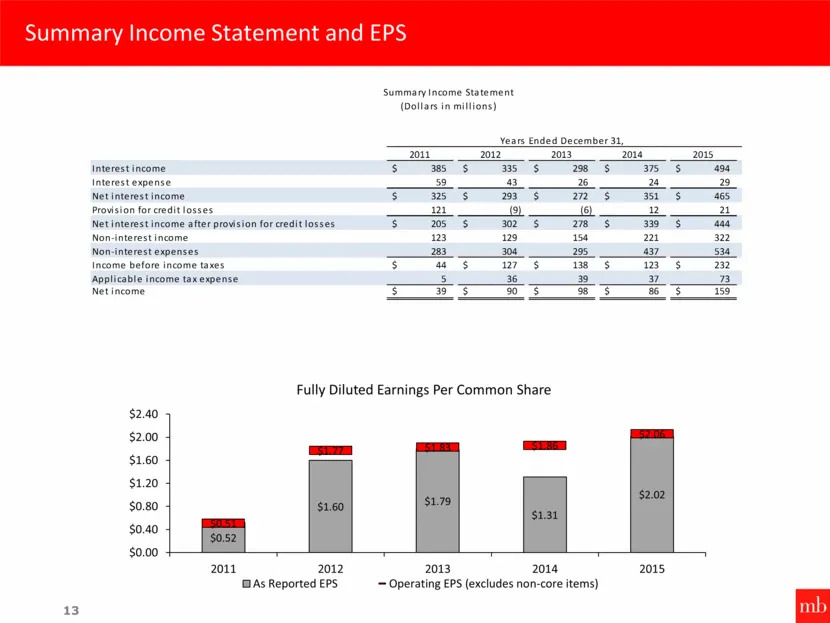
Summary Income Statement and EPS 13 $0.52 $1.60 $1.79 $1.31 $2.02 $0.51 $1.77 $1.83 $1.86 $2.06 $0.00 $0.40 $0.80 $1.20 $1.60 $2.00 $2.40 2011 2012 2013 2014 2015 Fully Diluted Earnings Per Common Share As Reported EPS Operating EPS (excludes non-core items) 2011 2012 2013 2014 2015 Interest income
Slide 14: Key Fee Initiatives – Reflect Continued Solid Growth
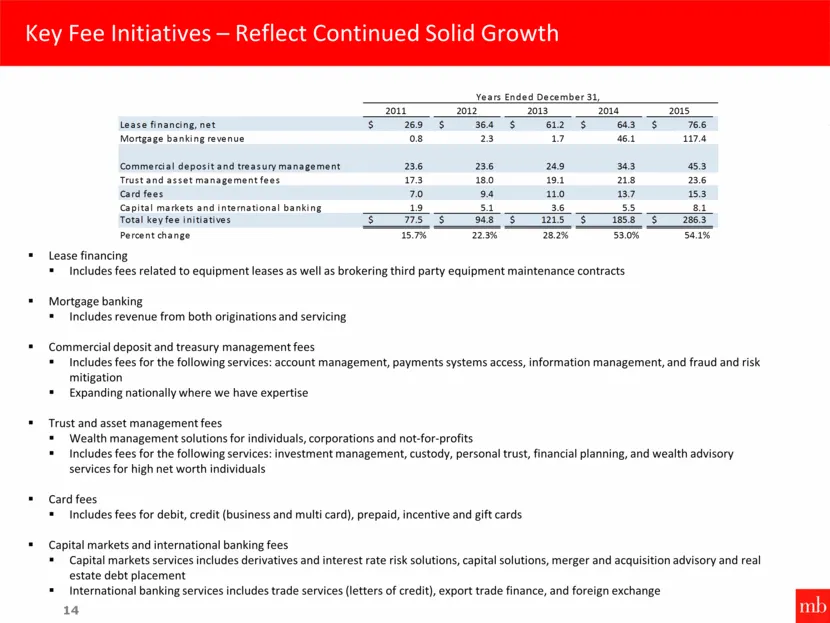
Key Fee Initiatives – Reflect Continued Solid Growth 14 Lease financing Includes fees related to equipment leases as well as brokering third party equipment maintenance contracts Mortgage banking Includes revenue from both originations and servicing Commercial deposit and treasury management fees In
Slide 15: Operating Performance
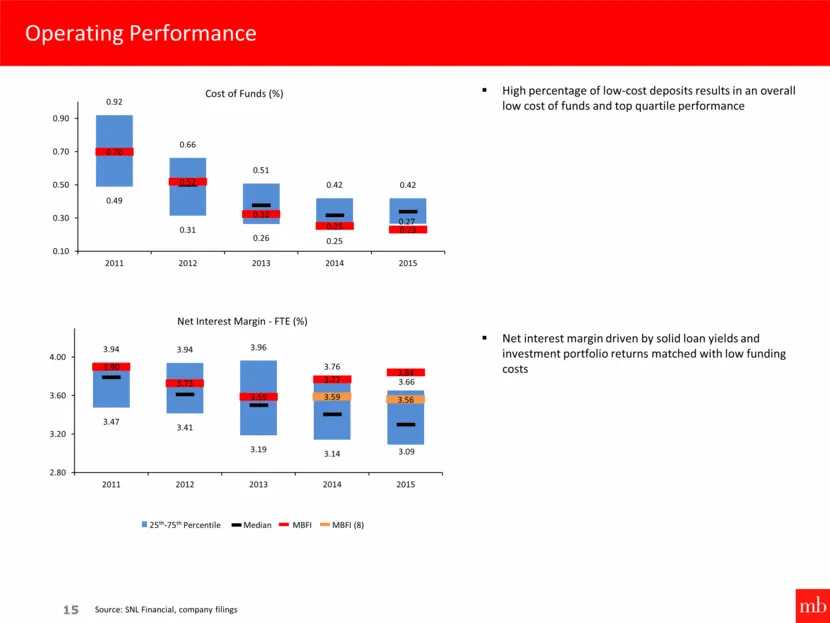
Operating Performance 15 25th-75th Percentile Median MBFI MBFI (8) High percentage of low-cost deposits results in an overall low cost of funds and top quartile performance Net interest margin driven by solid loan yields and investment portfolio returns matched with low funding costs Source: SNL Fin
Slide 16: Operating Performance
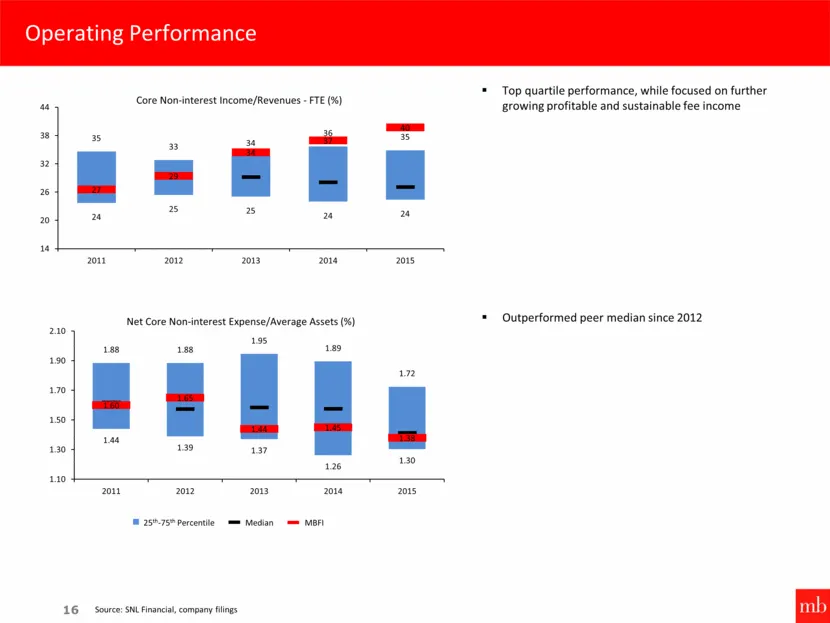
Operating Performance 16 25th-75th Percentile Median MBFI Top quartile performance, while focused on further growing profitable and sustainable fee income Outperformed peer median since 2012 Source: SNL Financial, company filings 24 25 25 24 24 27 29 34 37 40 35 33 34 36 35 14 20 26 32 38 44 2011 20
Slide 17: Top Quartile Returns
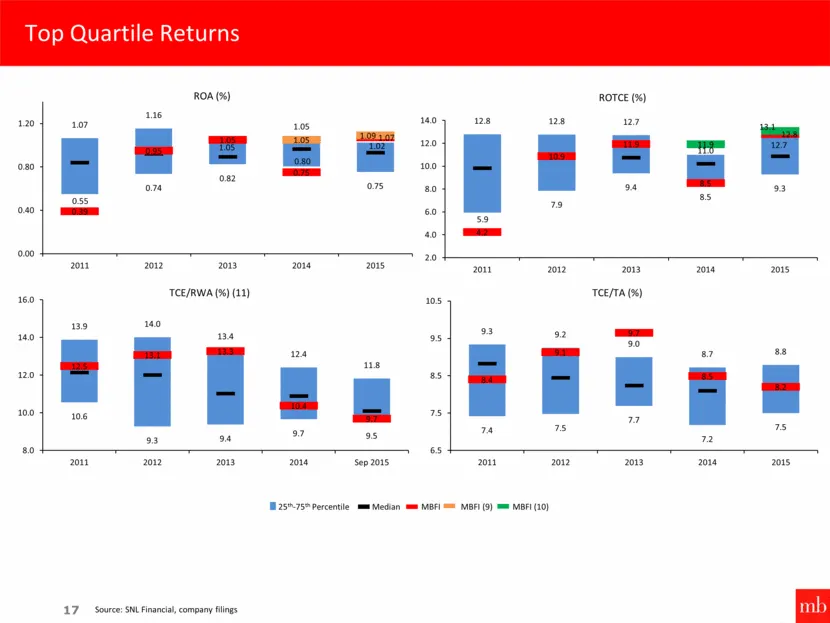
Top Quartile Returns 17 25th-75th Percentile Median MBFI MBFI (9) MBFI (10) Source: SNL Financial, company filings 7.4 7.5 7.7 7.2 7.5 8.4 9.1 9.7 8.5 8.2 9.3 9.2 9.0 8.7 8.8 6.5 7.5 8.5 9.5 10.5 2011 2012 2013 2014 2015 TCE/TA (%) 0.55 0.74 0.82 0.80 0.75 0.39 0.95 1.05 0.75 1.07 1.07 1.16 1.05 1.0
Slide 18: Credit Metrics
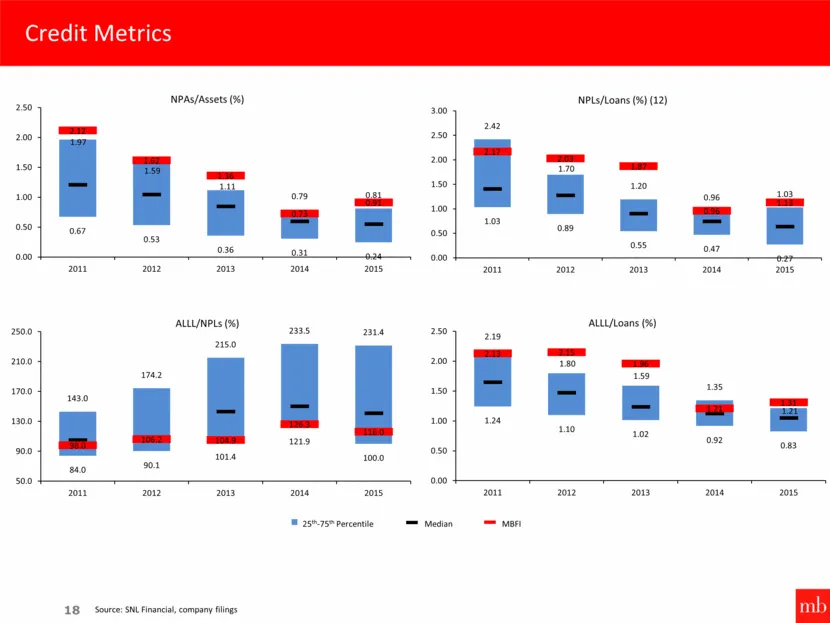
18 Reserves/Loans (%) Credit Metrics 25th-75th Percentile Median MBFI Source: SNL Financial, company filings 0.67 0.53 0.36 0.31 0.24 2.12 1.62 1.36 0.73 0.91 1.97 1.59 1.11 0.79 0.81 0.00 0.50 1.00 1.50 2.00 2.50 2011 2012 2013 2014 2015 NPAs/Assets (%) 1.03 0.89 0.55 0.47 0.27 2.17 2.03 1.87 0.96
Slide 19: Skilled Acquirer
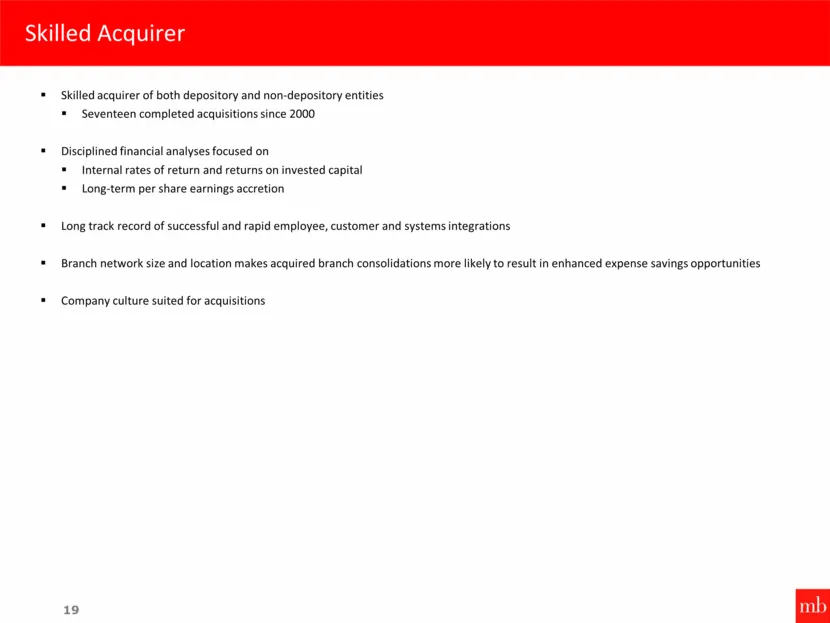
19 Skilled Acquirer Skilled acquirer of both depository and non-depository entities Seventeen completed acquisitions since 2000 Disciplined financial analyses focused on Internal rates of return and returns on invested capital Long-term per share earnings accretion Long track record of successful an
Slide 20: Track Record of Being a Disciplined Acquirer and Experienced Integrator
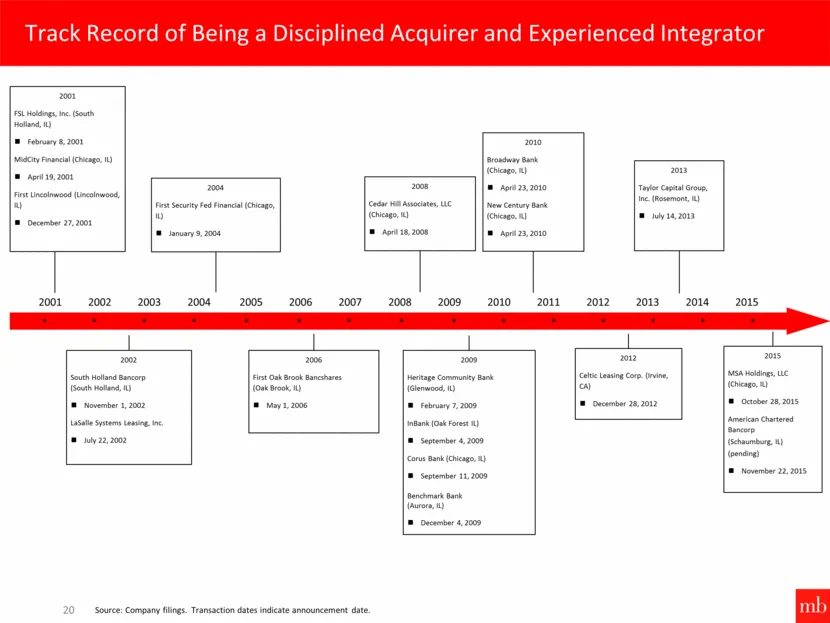
20 2004 First Security Fed Financial (Chicago, IL) January 9, 2004 2002 South Holland Bancorp (South Holland, IL) November 1, 2002 LaSalle Systems Leasing, Inc. July 22, 2002 2006 First Oak Brook Bancshares (Oak Brook, IL) May 1, 2006 2009 Heritage Community Bank (Glenwood, IL) February 7, 2009 InBa
Slide 21: Transaction Strategic Rationale
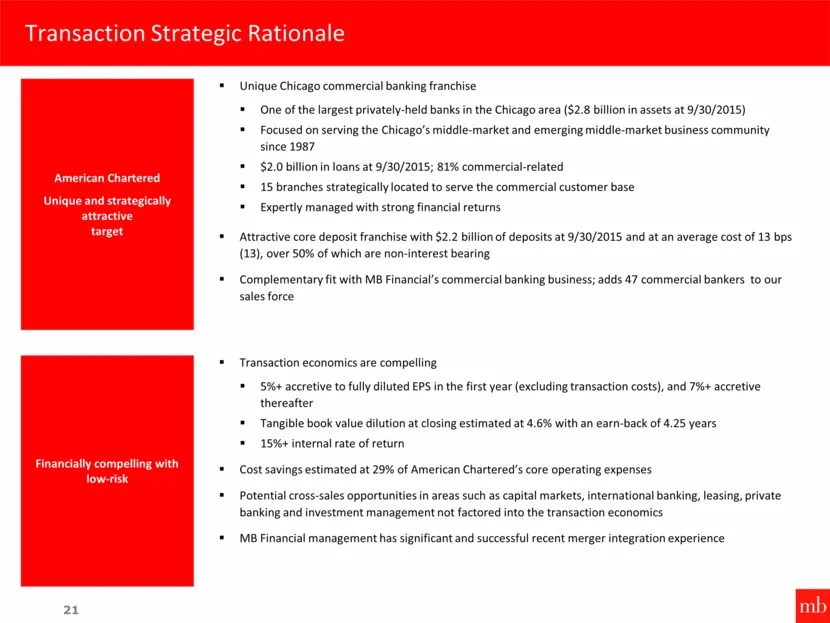
21 Transaction Strategic Rationale American Chartered Unique and strategically attractive target Financially compelling with low-risk Unique Chicago commercial banking franchise One of the largest privately-held banks in the Chicago area ($2.8 billion in assets at 9/30/2015) Focused on serving the C
Slide 22: Transaction Summary
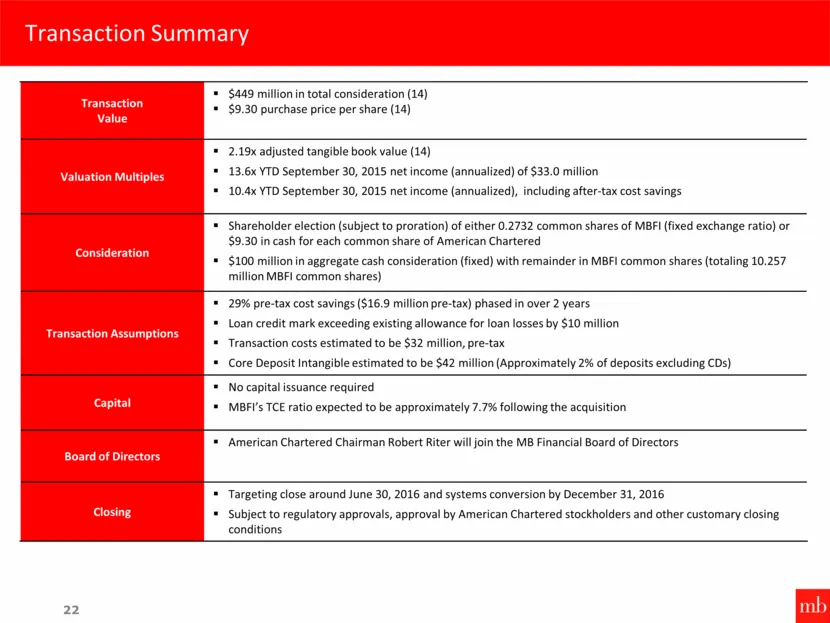
22 Transaction Summary Transaction Value $449 million in total consideration (14) $9.30 purchase price per share (14) Valuation Multiples 2.19x adjusted tangible book value (14) 13.6x YTD September 30, 2015 net income (annualized) of $33.0 million 10.4x YTD September 30, 2015 net income (annualized)
Slide 23: American Chartered Overview
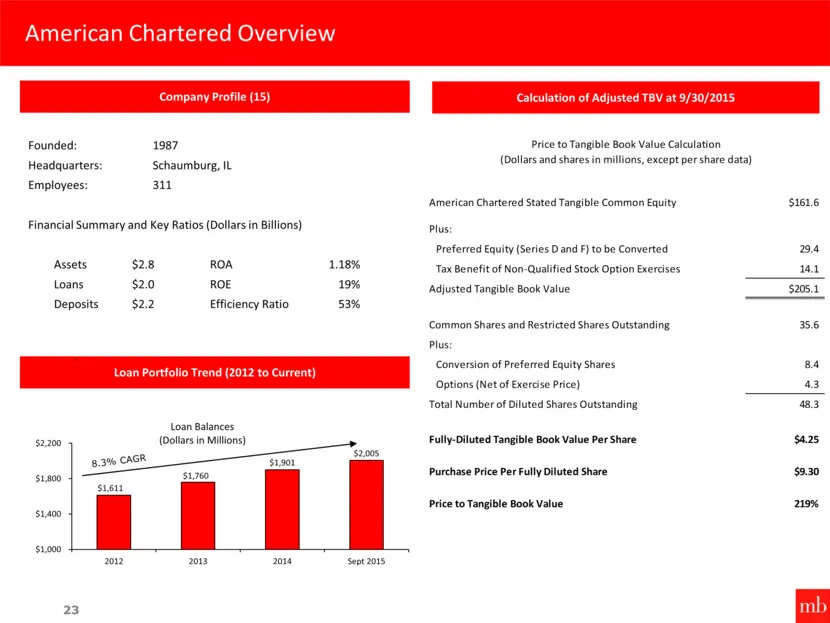
23 Company Profile (15) Calculation of Adjusted TBV at 9/30/2015 Loan Portfolio Trend (2012 to Current) 8.3% CAGR Founded: 1987 Headquarters: Schaumburg, IL Employees: 311 Financial Summary and Key Ratios (Dollars in Billions) Assets $2.8 ROA 1.18% Loans $2.0 ROE 19% Deposits $2.2 Efficiency Ratio 5
Slide 24: American Chartered Acquisition Enhances Position in the Chicago MSA
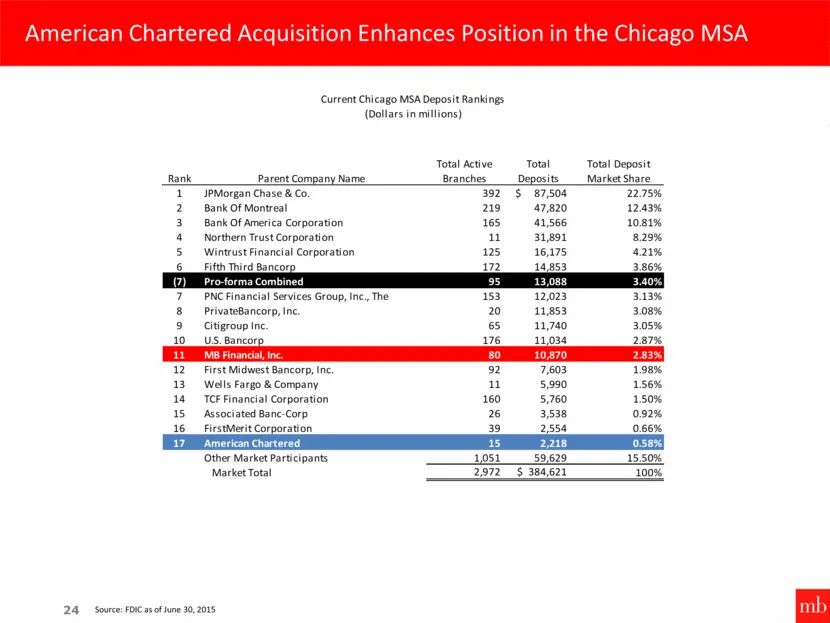
American Chartered Acquisition Enhances Position in the Chicago MSA 24 Source: FDIC as of June 30, 2015 Rank Parent Company Name Total Active Branches Total Deposits Total Deposit Market Share 1 JPMorgan Chase & Co. 392 $ 87,504 22.75% 2 Bank Of Montreal 219 47,820 12.43% 3 Bank Of America Corporati
Slide 25: Combined Chicago MSA Branch Footprint
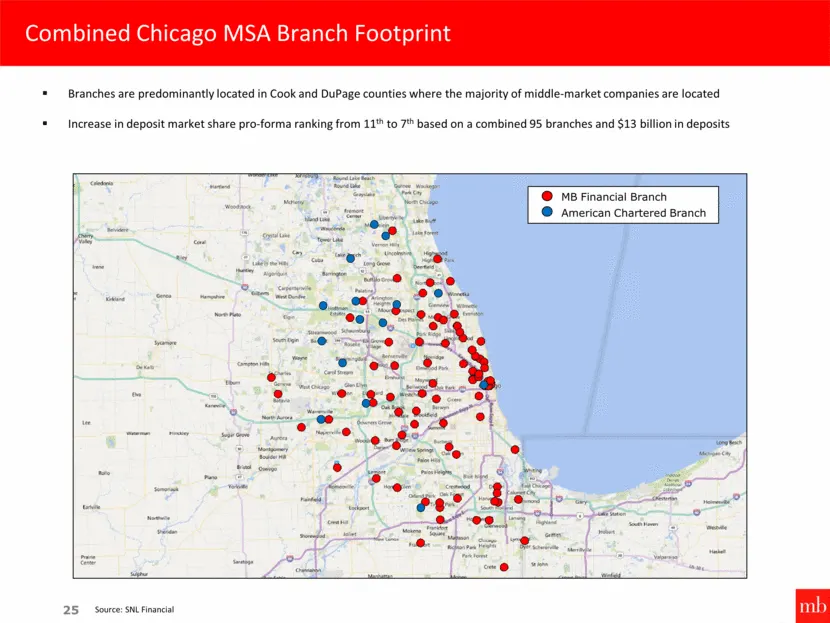
Combined Chicago MSA Branch Footprint 25 MB Financial Branch American Chartered Branch Branches are predominantly located in Cook and DuPage counties where the majority of middle-market companies are located Increase in deposit market share pro-forma ranking from 11th to 7th based on a combined 95 b
Slide 26: Fourth Quarter 2015 Highlights
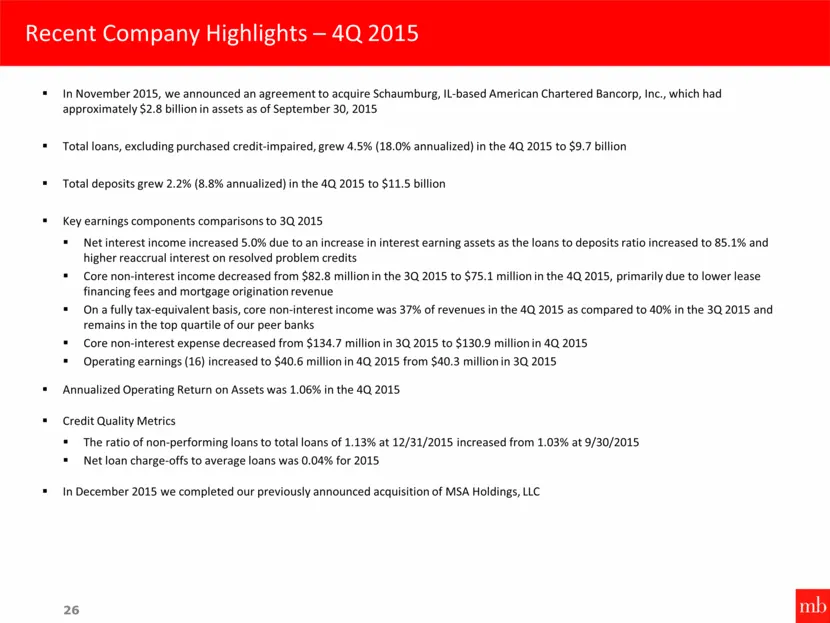
In November 2015, we announced an agreement to acquire Schaumburg, IL-based American Chartered Bancorp, Inc., which had approximately $2.8 billion in assets as of September 30, 2015 Total loans, excluding purchased credit-impaired, grew 4.5% (18.0% annualized) in the 4Q 2015 to $9.7 billion Total de
Slide 27: Appendix
Non-GAAP Disclosure Appendix 27
Slide 28: Non-GAAP Disclosure Reconciliations
Non-GAAP Disclosure Reconciliations 28 This presentation contains certain financial information determined by methods other than in accordance with accounting principles generally accepted in the United States of America (GAAP). These measures include net interest margin on a fully tax equivalent ba
Slide 29: Non-GAAP Disclosure Reconciliations
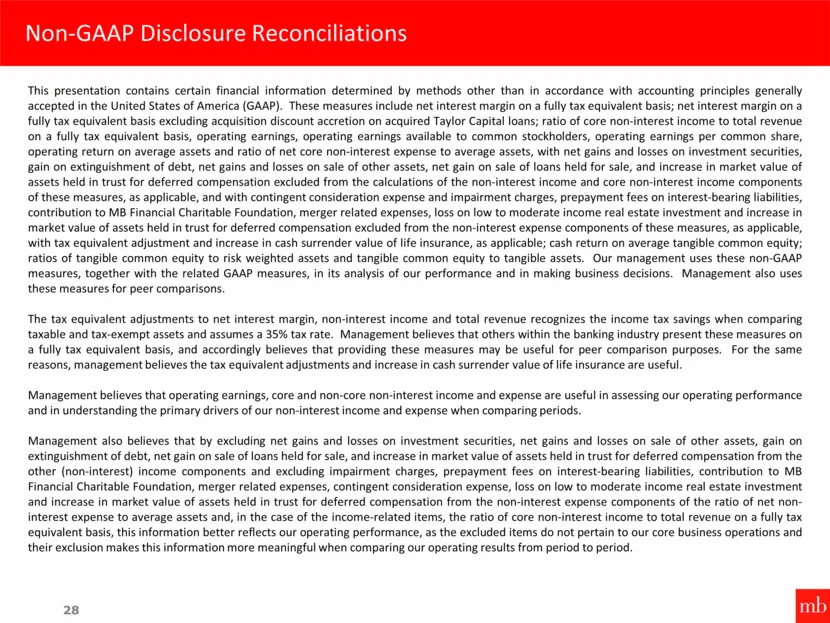
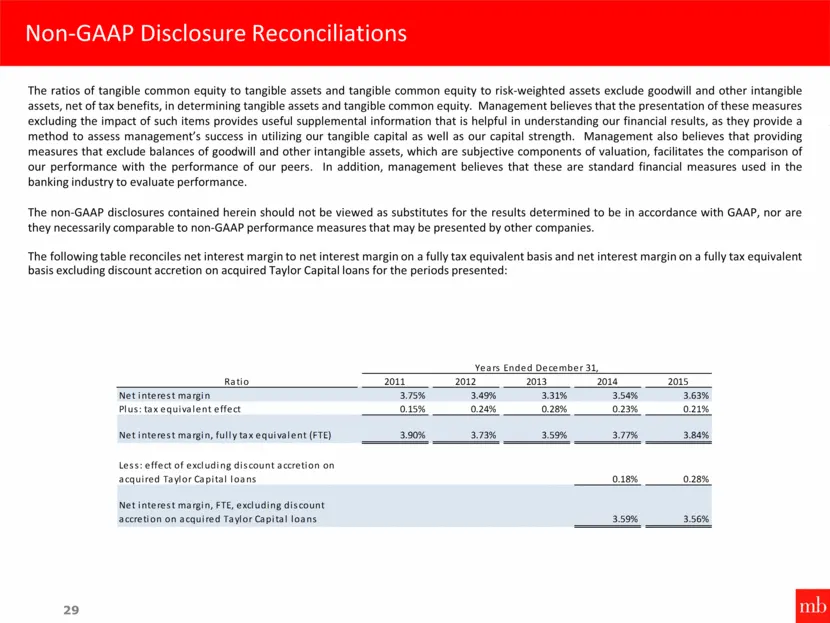
Non-GAAP Disclosure Reconciliations 29 The ratios of tangible common equity to tangible assets and tangible common equity to risk-weighted assets exclude goodwill and other intangible assets, net of tax benefits, in determining tangible assets and tangible common equity. Management believes that the
Slide 30: Non-GAAP Disclosure Reconciliations
Non-GAAP Disclosure Reconciliations 30 The following table presents a reconciliation of net income to operating earnings: 2011 2012 2013 2014 2015 Net income, as reported $ 38.7 $ 90.4 $ 98.5 $ 86.1 $ 158.9 Non-core item adjustments Net losses (gains) on investment securities (0.6) (0.6) - 2.5 0.2 N
Slide 31: Non-GAAP Disclosure Reconciliations
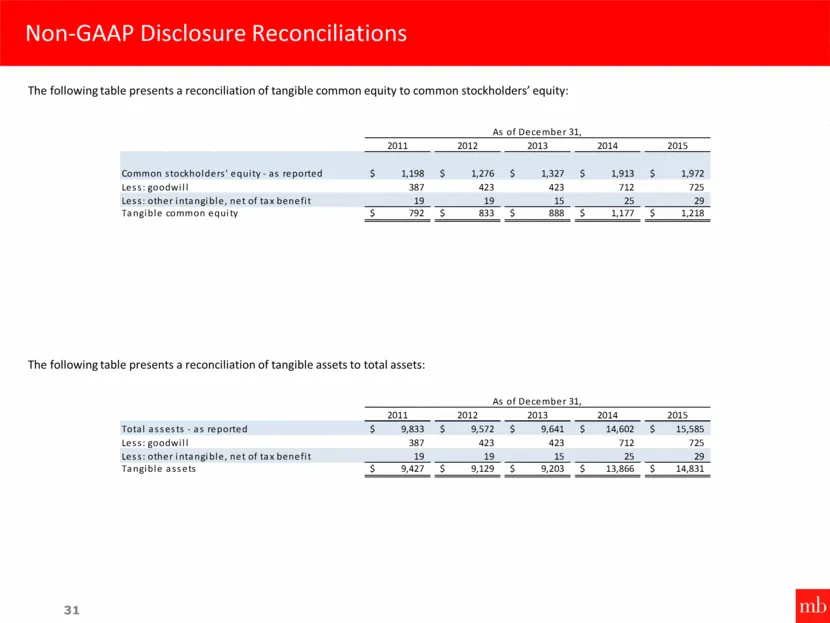
Non-GAAP Disclosure Reconciliations 32 2.4 1.9 1.8 1.8 1.8
Slide 32: Non-GAAP Disclosure Reconciliations
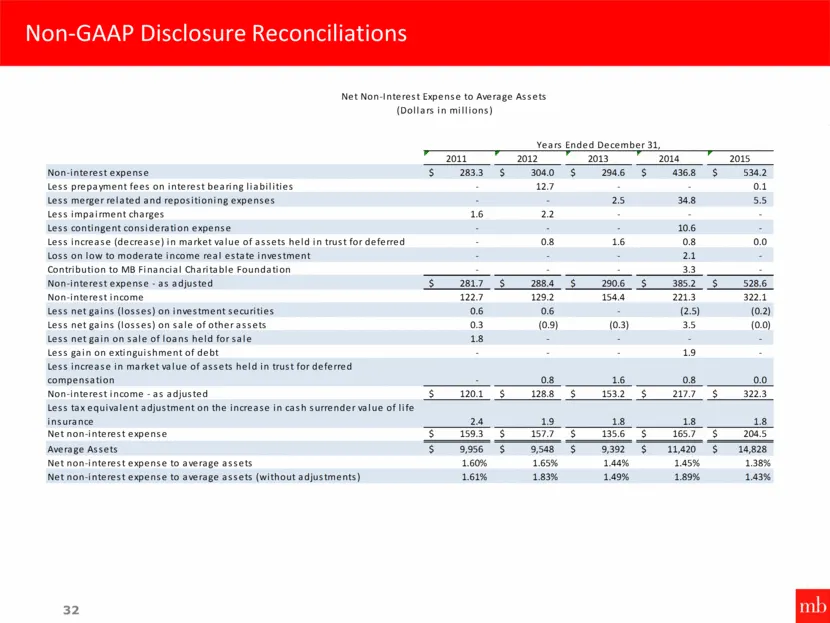
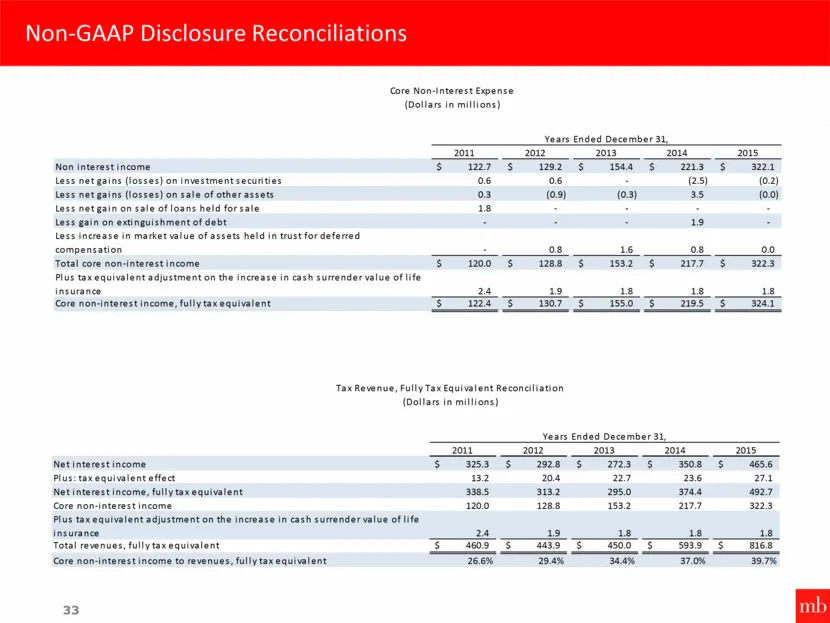
Non-GAAP Disclosure Reconciliations 33 2011 2012 2013 2014 2015 Non interest income $ 122.7 $ 129.2 $ 154.4 $ 221.3 $ 322.1 Less net gains (losses) on investment securities 0.6 0.6 - (2.5) (0.2) Less net gains (losses) on sale of other assets 0.3 (0.9) (0.3) 3.5 (0.0) Less net gain on sale of loans
Slide 33: Footnotes
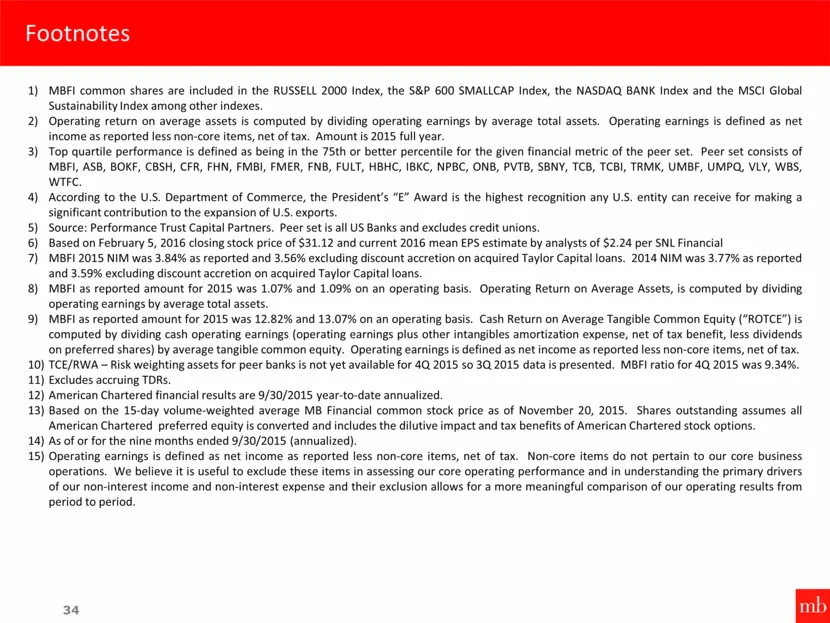
Footnotes 34 MBFI common shares are included in the RUSSELL 2000 Index, the S&P 600 SMALLCAP Index, the NASDAQ BANK Index and the MSCI Global Sustainability Index among other indexes. Operating return on average assets is computed by dividing operating earnings by average total assets. Operating ear
Slide 34: February 2016
February 2016 NASDAQ: MBFI Investor Presentation
Slide 35: financial
financial Investor Presentation February 2016 NASDAQ: MBFI
Source: SEC EDGAR · 425 filed Feb 10, 2016
More decks from MB Financial Inc
 RBC Capital Markets Financial Institutions Conference 201914 slides · Mar 12, 2019
 Q4 2018 Earnings Presentation23 slides · Jan 22, 2019
 Goldman Sachs U.S. Financial Services Conference 201815 slides · Dec 4, 2018
 BancAnalysts Association of Boston Conference 201817 slides · Nov 8, 2018
 Q3 2018 Earnings Presentation24 slides · Oct 23, 2018
 Barclays Global Financial Services Conference 201816 slides · Sep 12, 2018