Super Micro Computer, Inc. · NASDAQ:SMCI
Super Micro Computer — Q1 2027 Earnings Presentation
19 slides from Super Micro Computer's earnings presentation, Nov 3, 2026
Slide 1: FQ1 2027 Results
FQ1 2027 Results November 3rd, 2026 Accelerate Everything © 2026 Supermicro
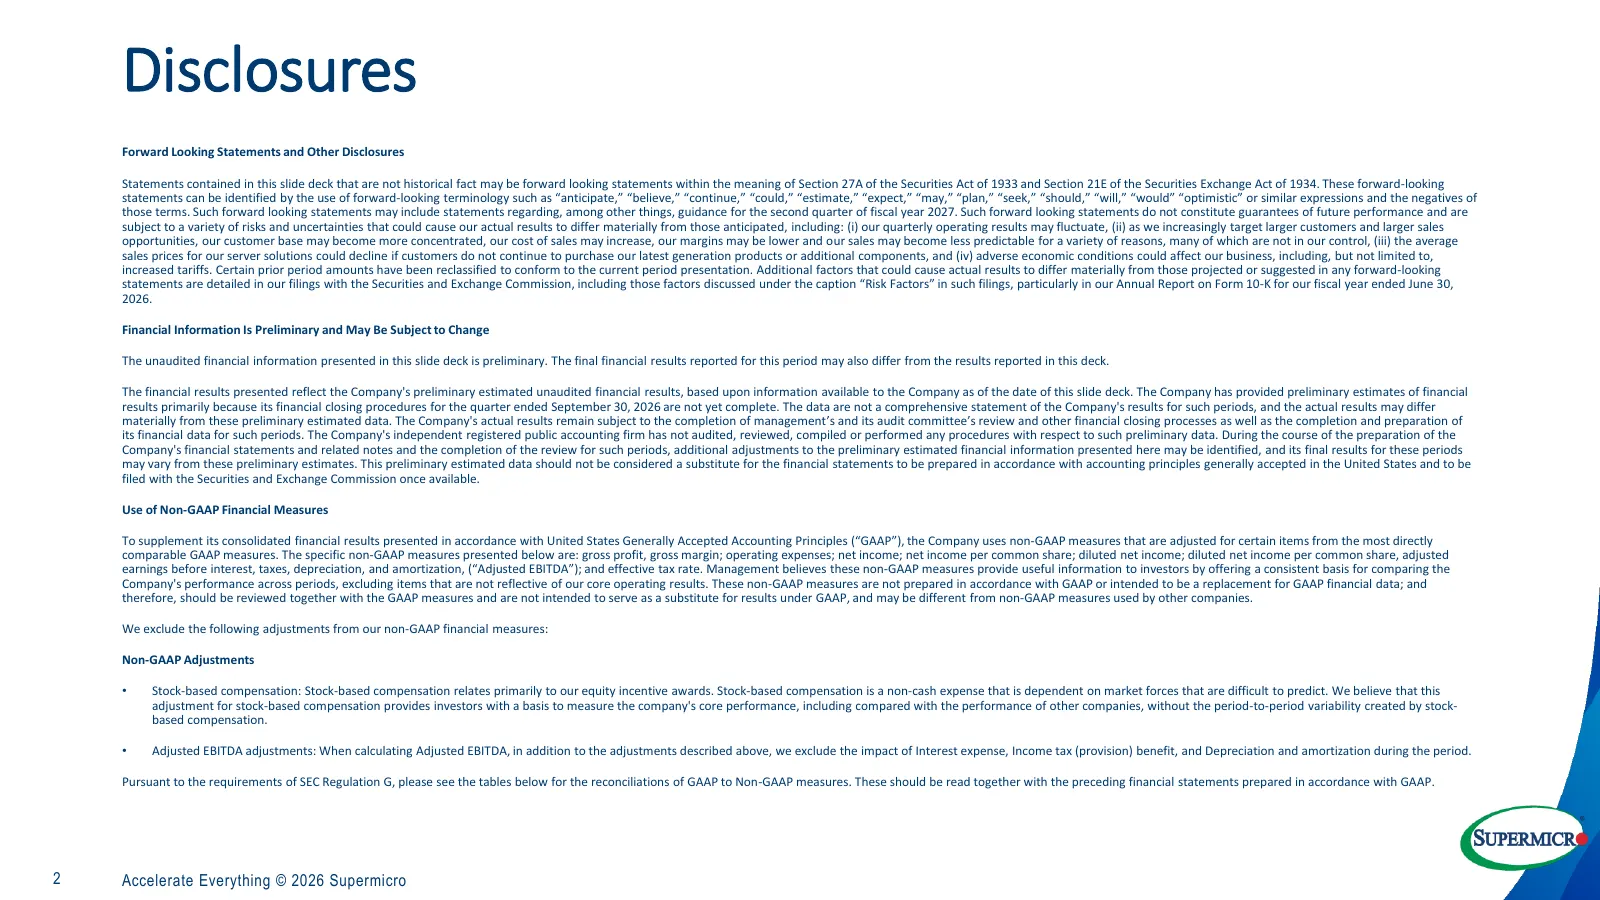
Slide 2: Disclosures
Disclosures Forward Looking Statements and Other Disclosures Statements contained in this slide deck that are not historical fact may be forward looking statements within the meaning of Section 27A of the Securities Act of 1933 and Section 21E of the Securities Exchange Act of 1934. These forward-lo
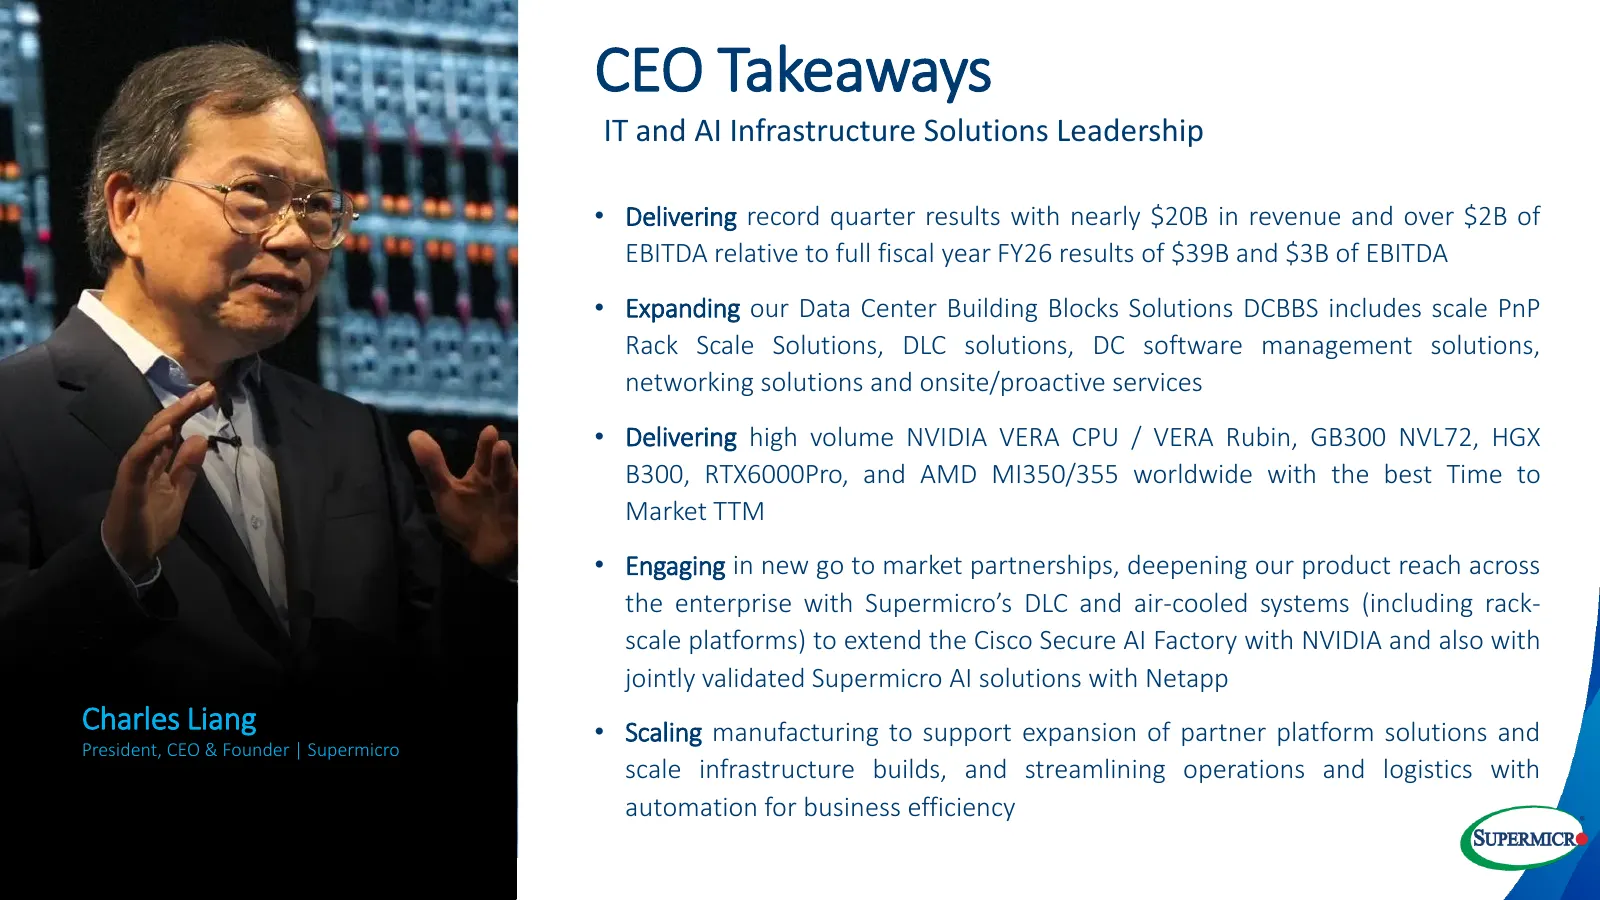
Slide 3: CEO Takeaways
CEO Takeaways IT and AI Infrastructure Solutions Leadership • Delivering record quarter results with nearly $20B in revenue and over $2B of EBITDA relative to full fiscal year FY26 results of $39B and $3B of EBITDA • Expanding our Data Center Building Blocks Solutions DCBBS includes scale PnP Rack S
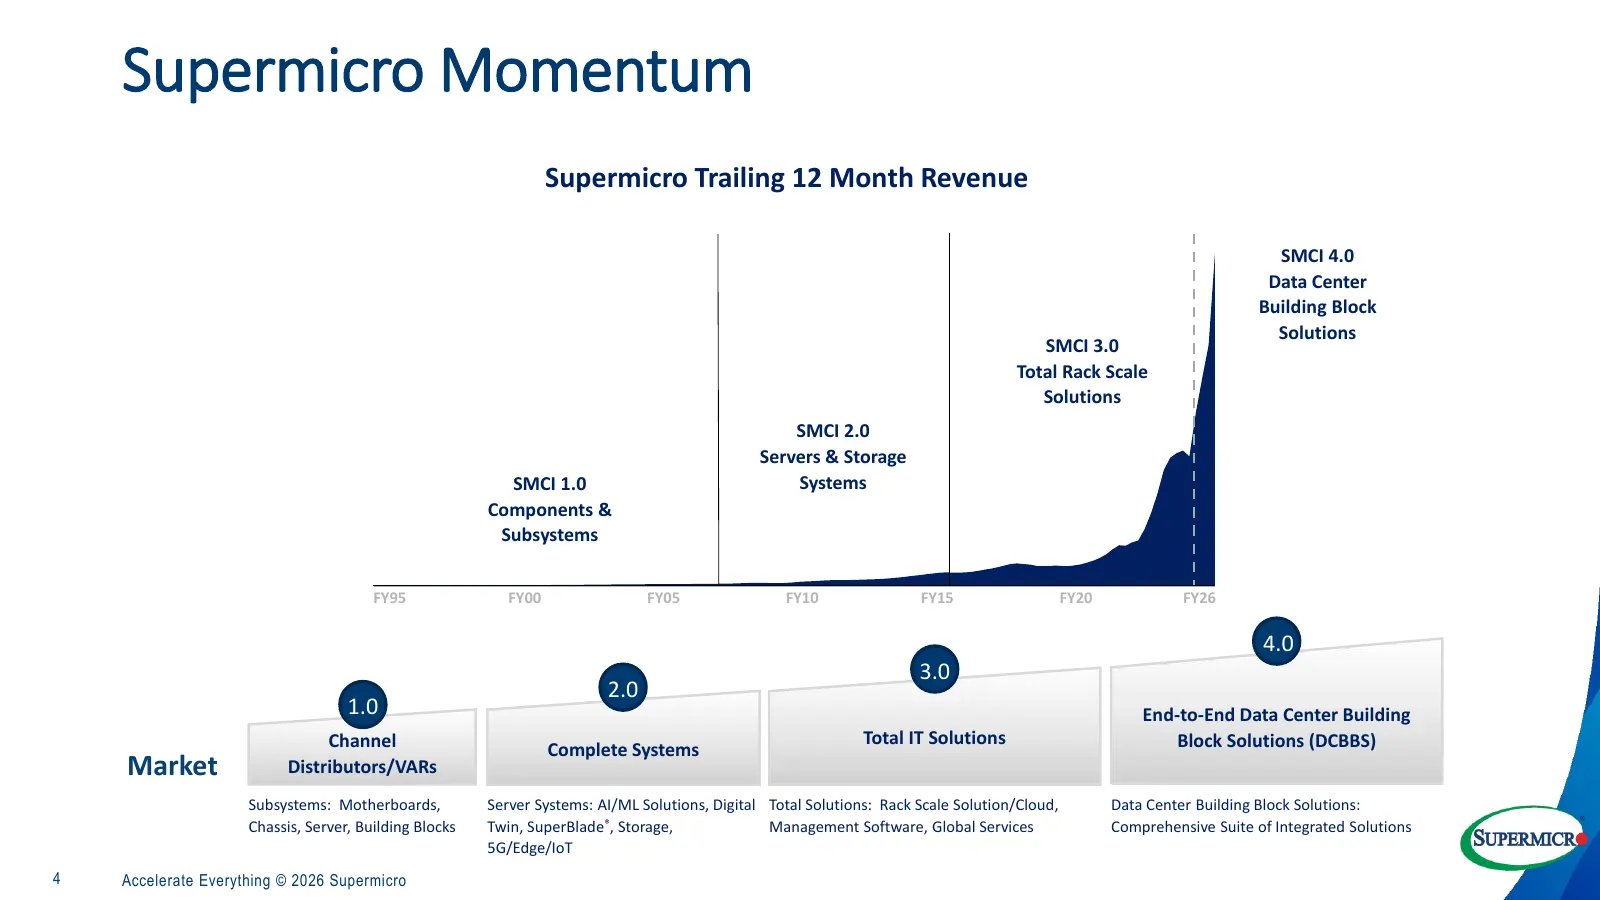
Slide 4: Supermicro Momentum
Supermicro Momentum Supermicro Trailing 12 Month Revenue SMCI 4.0 Data Center Building Block Solutions SMCI 3.0 Total Rack Scale Solutions SMCI 2.0 Servers & Storage SMCI 1.0 Systems Components & Subsystems FY95 FY00 FY05 FY10 FY15 FY20 FY26 4.0 3.0 2.0 1.0 End-to-End Data Center Building Channel To
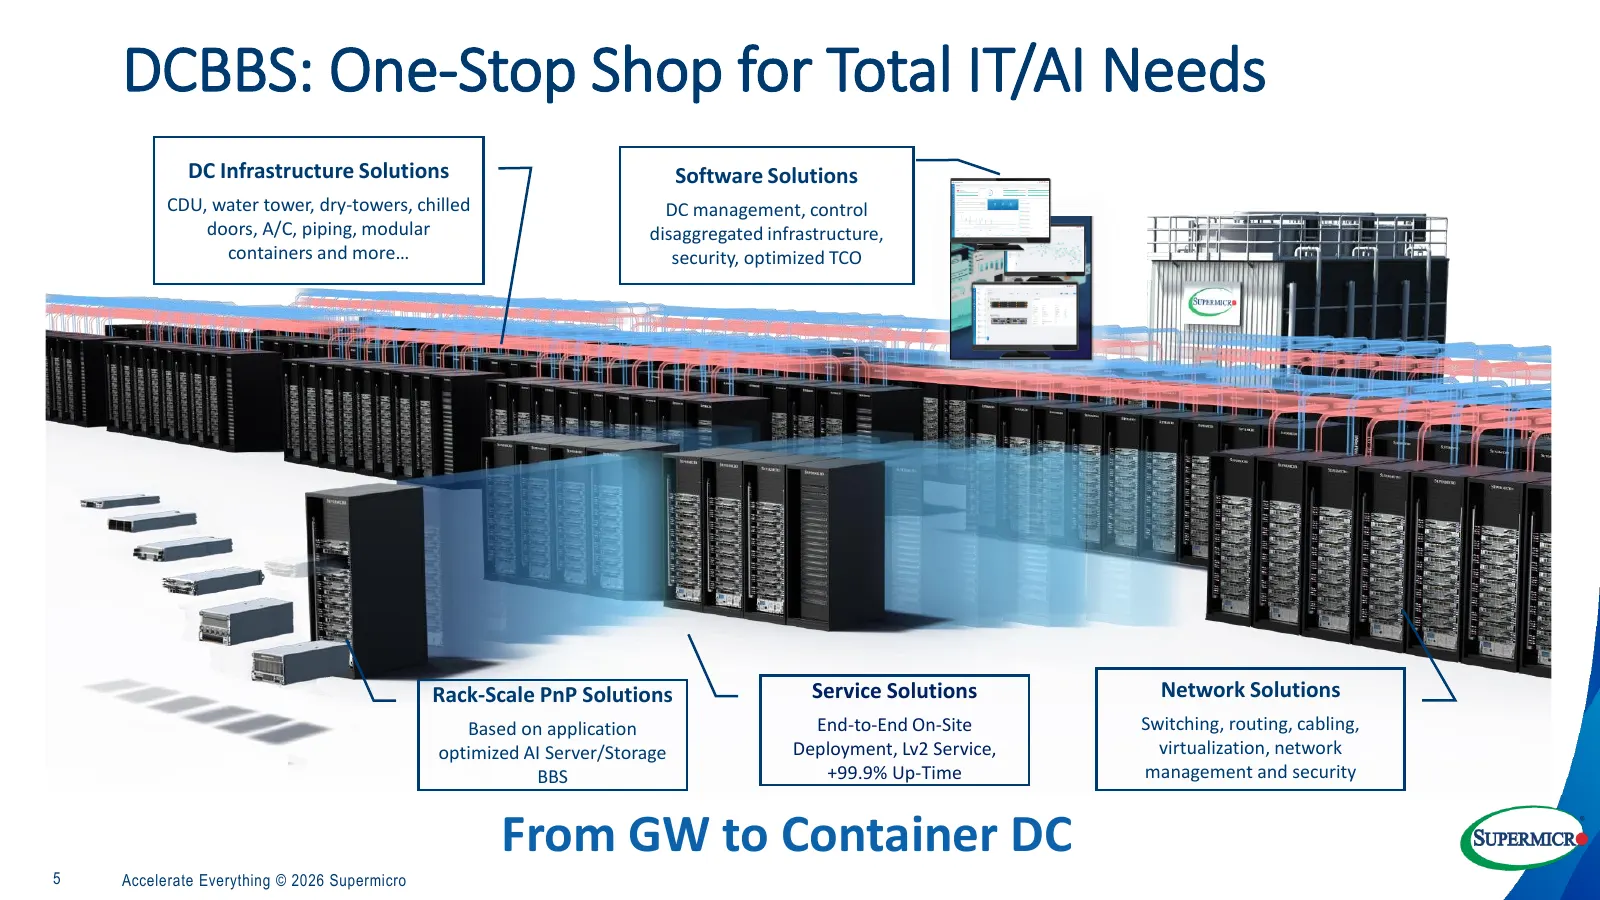
Slide 5: DCBBS: One-Stop Shop for Total IT/AI Needs
DCBBS: One-Stop Shop for Total IT/AI Needs DC Infrastructure Solutions Software Solutions CDU, water tower, dry-towers, chilled DC management, control doors, A/C, piping, modular disaggregated infrastructure, containers and more… security, optimized TCO Rack-Scale PnP Solutions Service Solutions Net
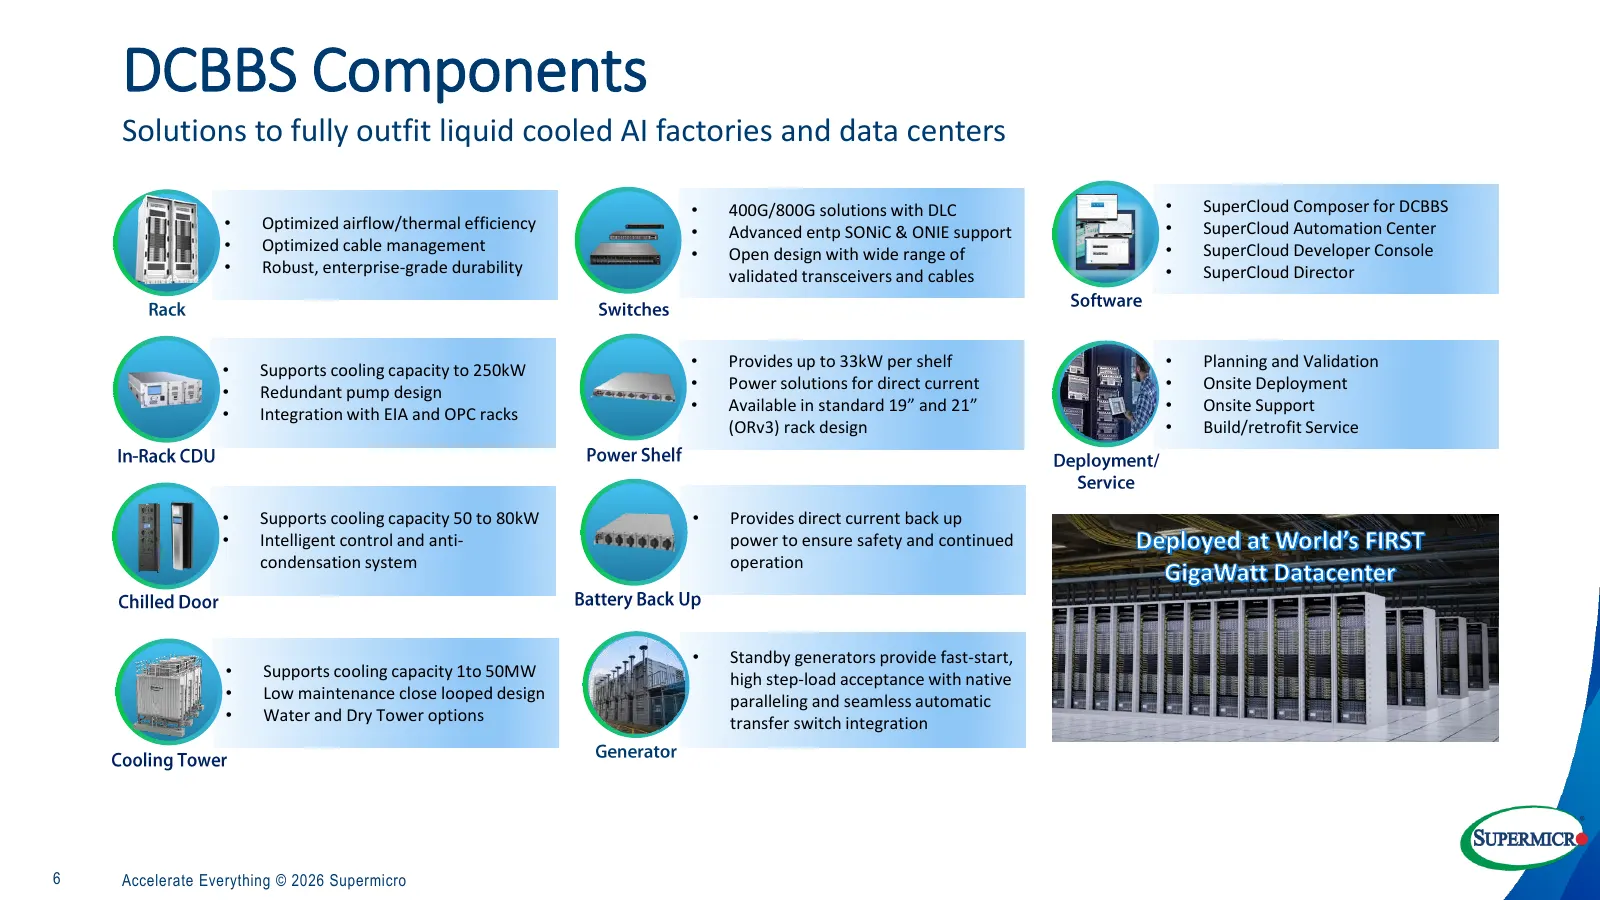
Slide 6: DCBBS Components
DCBBS Components Solutions to fully outfit liquid cooled AI factories and data centers • 400G/800G solutions with DLC • SuperCloud Composer for DCBBS • Optimized airflow/thermal efficiency • Advanced entp SONiC & ONIE support • SuperCloud Automation Center • Optimized cable management • Open design
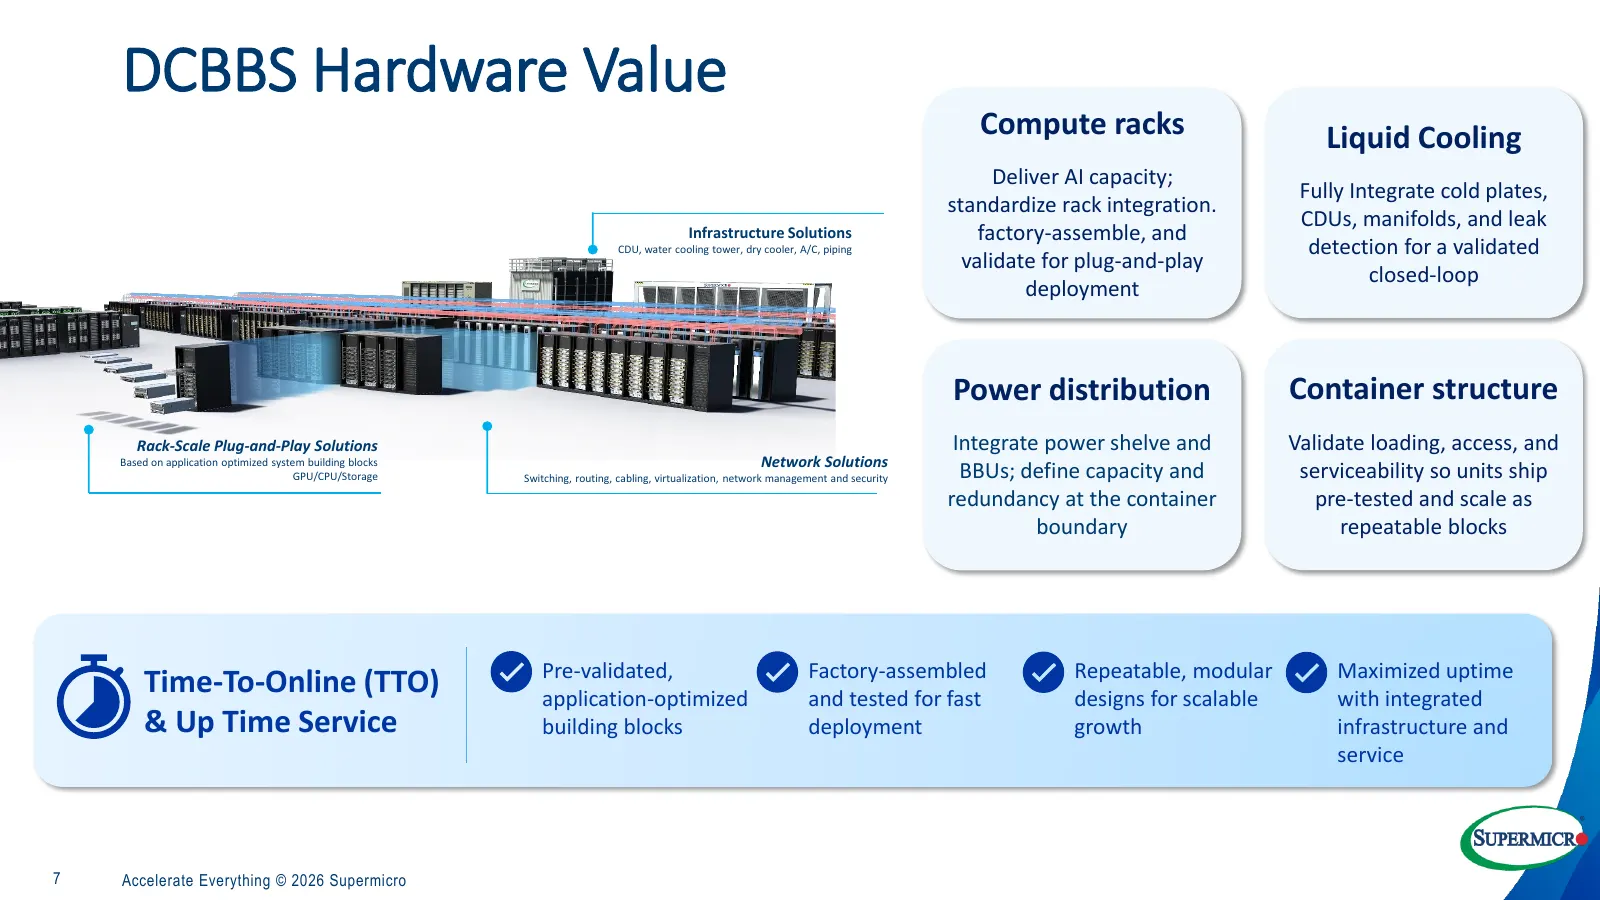
Slide 7: DCBBS Hardware Value
DCBBS Hardware Value Compute racks Liquid Cooling Deliver AI capacity; Fully Integrate cold plates, standardize rack integration. CDUs, manifolds, and leak Infrastructure Solutions factory-assemble, and CDU, water cooling tower, dry cooler, A/C, piping detection for a validated validate for plug-and
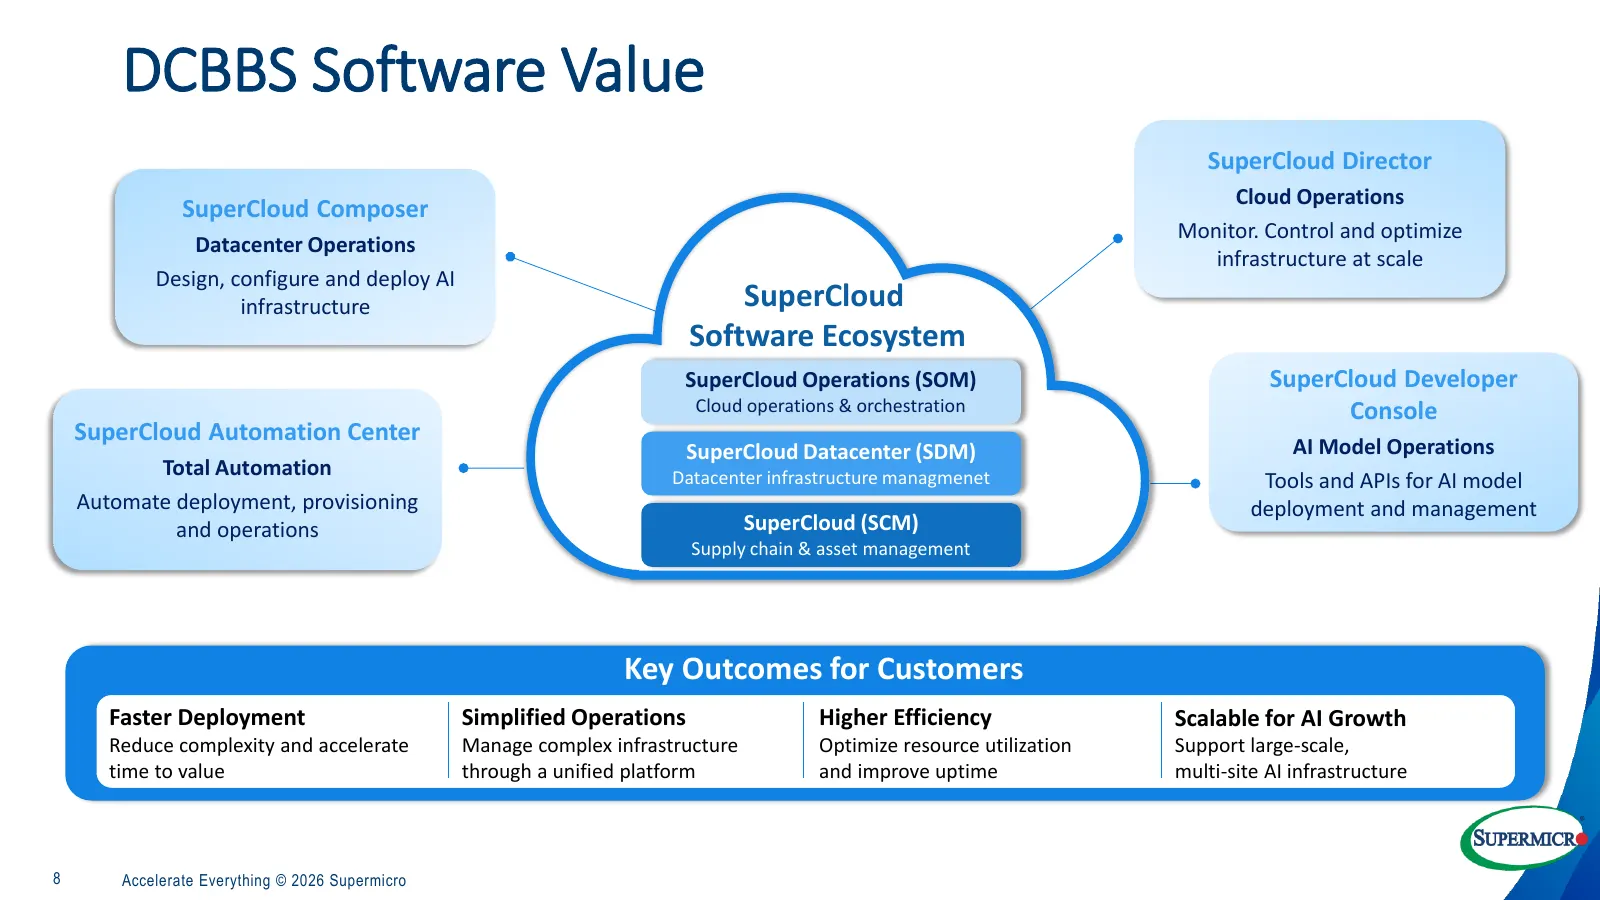
Slide 8: DCBBS Software Value
DCBBS Software Value SuperCloud Director Cloud Operations SuperCloud Composer Monitor. Control and optimize Datacenter Operations infrastructure at scale Design, configure and deploy AI infrastructure SuperCloud Software Ecosystem SuperCloud Operations (SOM) SuperCloud Developer Cloud operations & o
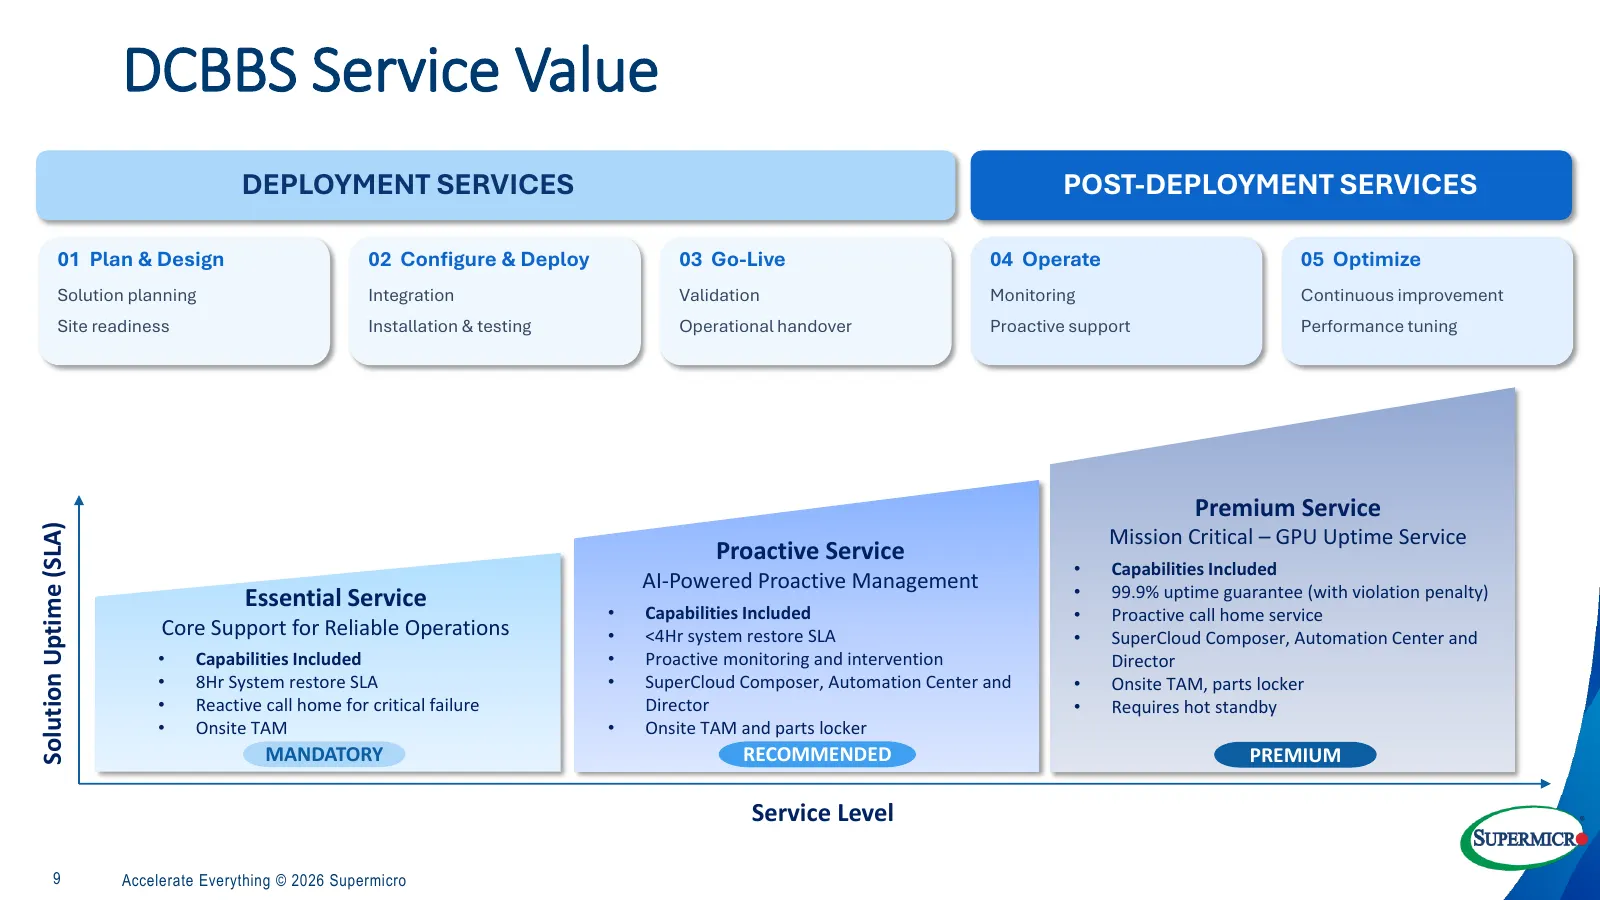
Slide 9: DCBBS Service Value
DCBBS Service Value DEPLOYMENT SERVICES POST-DEPLOYMENT SERVICES 01 Plan & Design 02 Configure & Deploy 03 Go-Live 04 Operate 05 Optimize Solution planning Integration Validation Monitoring Continuous improvement Site readiness Installation & testing Operational handover Proactive support Performanc
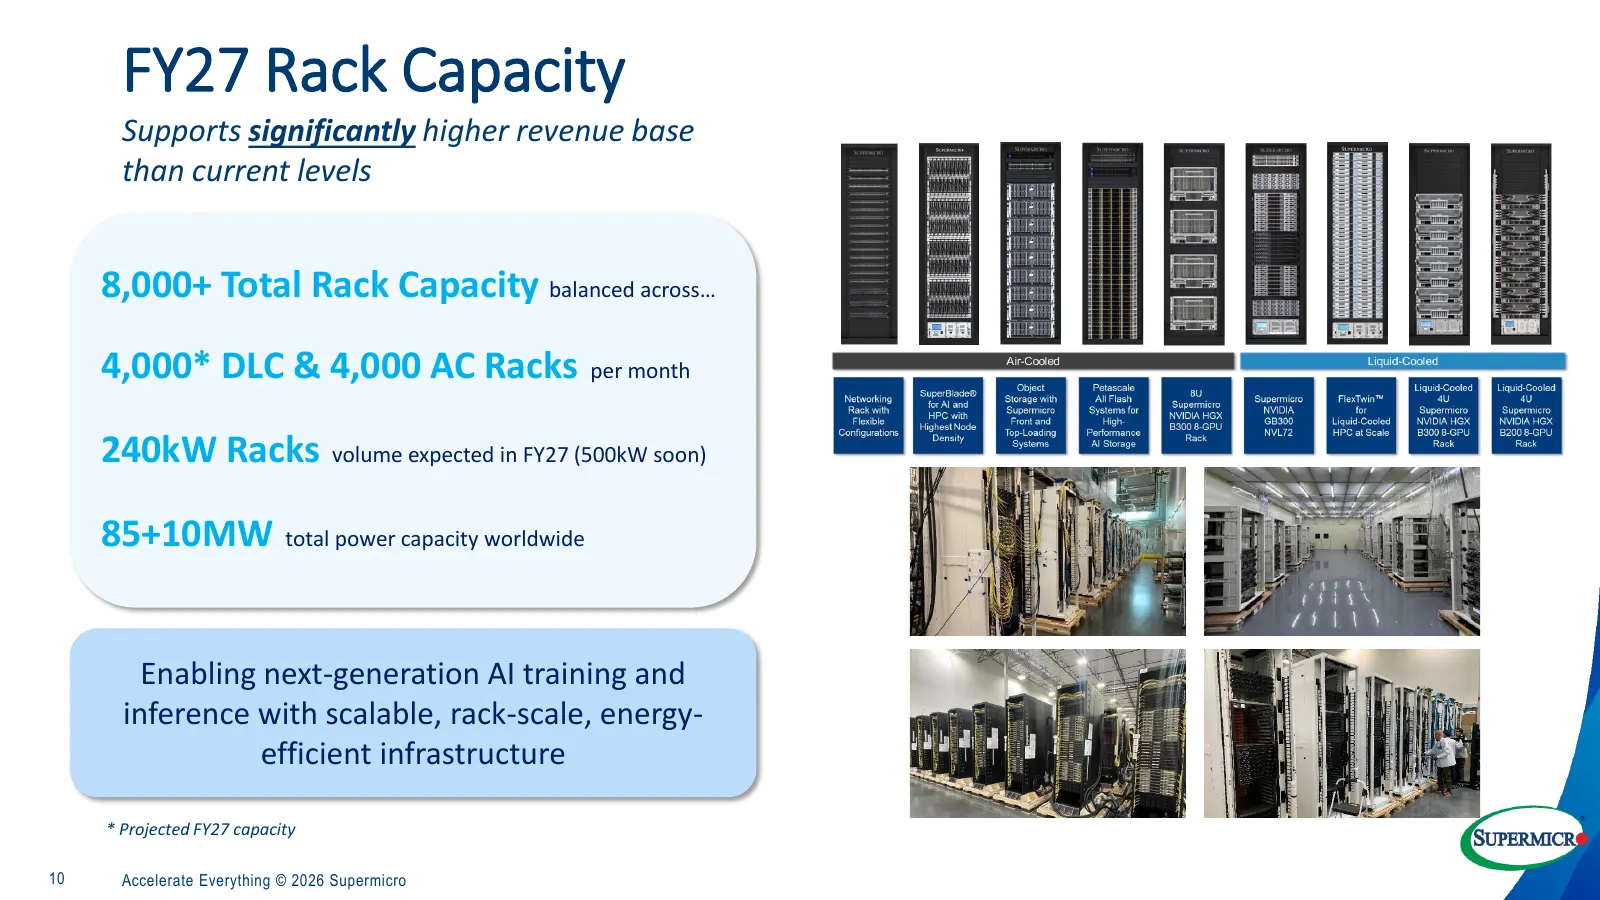
Slide 10: FY27 Rack Capacity
FY27 Rack Capacity Supports significantly higher revenue base than current levels 8,000+ Total Rack Capacity balanced across… 4,000* DLC & 4,000 AC Racks per month 240kW Racks volume expected in FY27 (500kW soon) 85+10MW total power capacity worldwide Enabling next-generation AI training and inferen
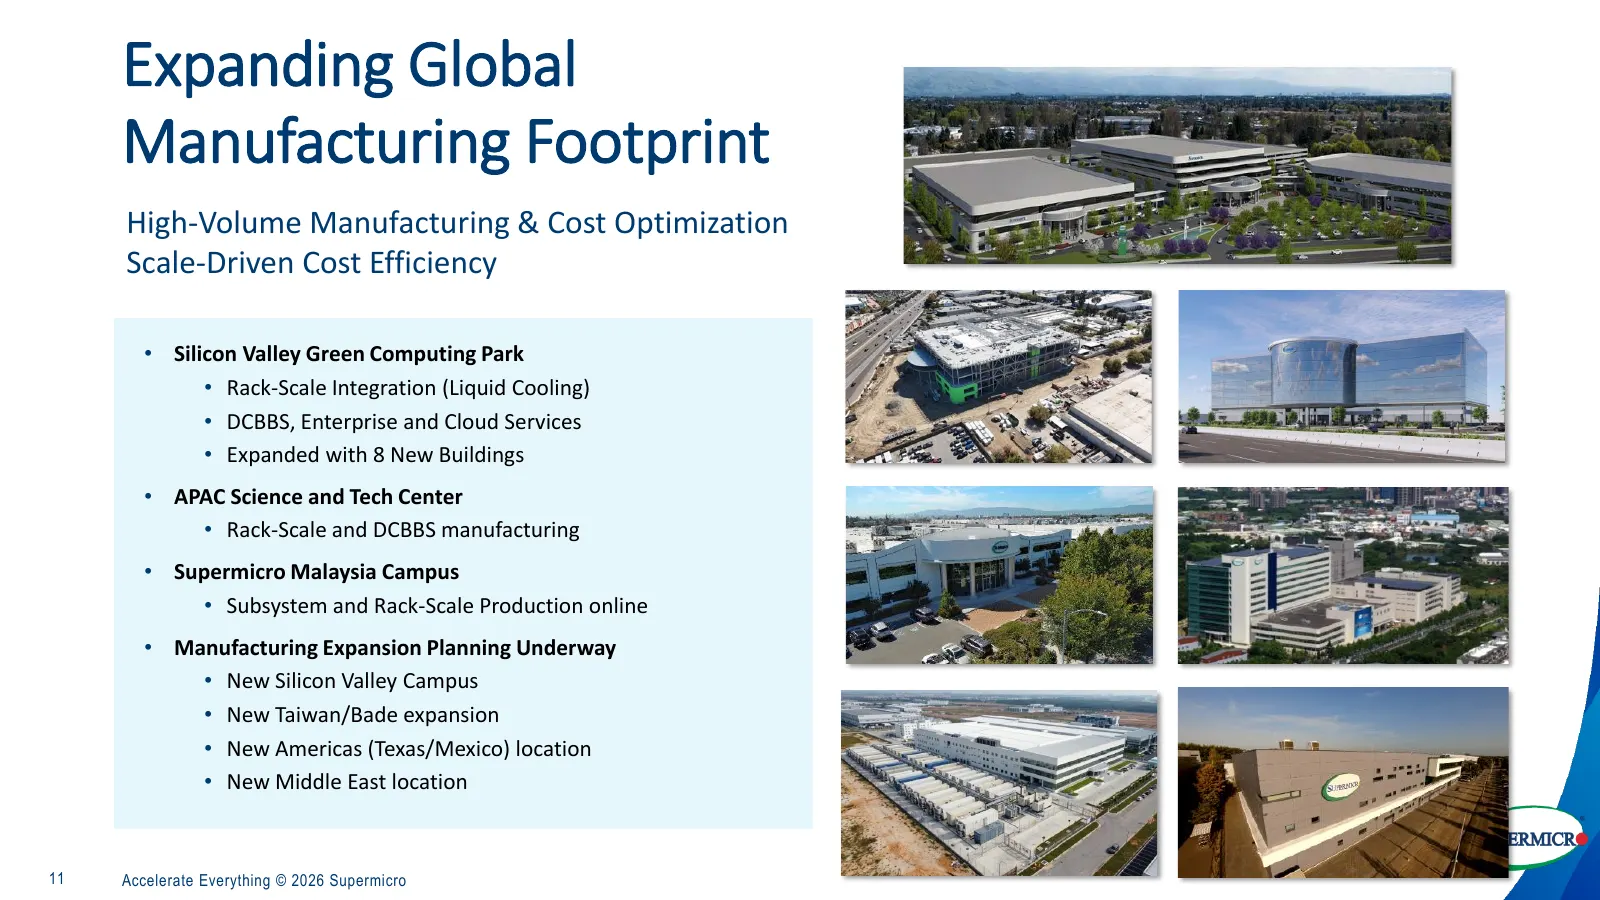
Slide 11: Expanding Global Manufacturing Footprint
Expanding Global Manufacturing Footprint High-Volume Manufacturing & Cost Optimization Scale-Driven Cost Efficiency • Silicon Valley Green Computing Park • Rack-Scale Integration (Liquid Cooling) • DCBBS, Enterprise and Cloud Services • Expanded with 8 New Buildings • APAC Science and Tech Center •
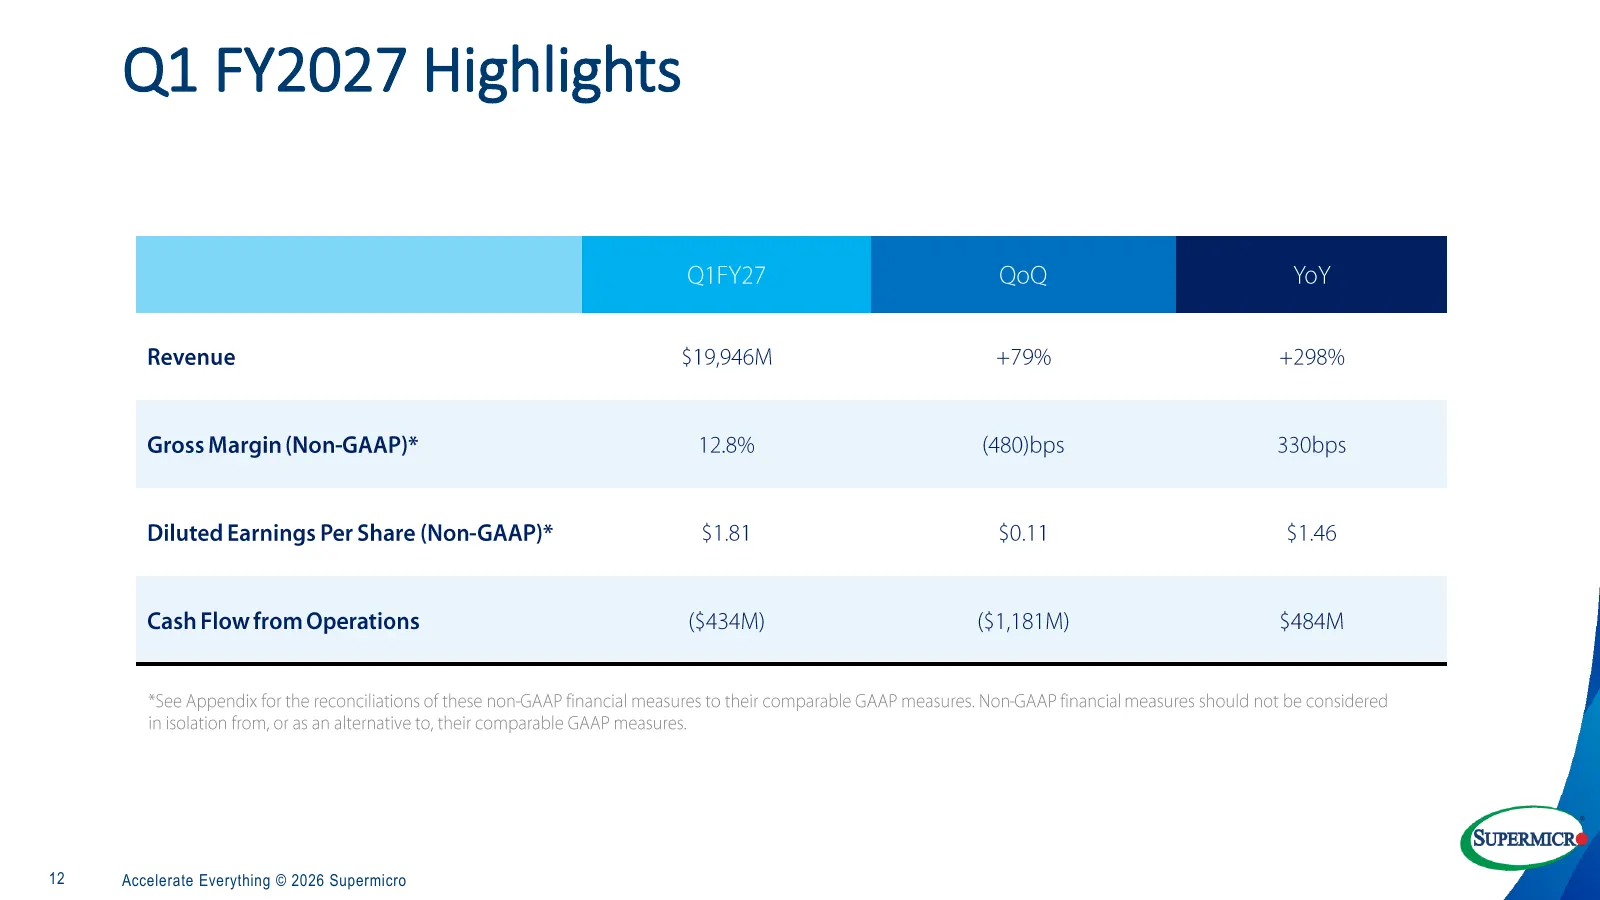
Slide 12: Q1 FY2027 Highlights
Q1 FY2027 Highlights Q1FY27 QoQ YoY Revenue $19,946M +79% +298% Gross Margin (Non-GAAP)* 12.8% (480)bps 330bps Diluted Earnings Per Share (Non-GAAP)* $1.81 $0.11 $1.46 Cash Flow from Operations ($434M) ($1,181M) $484M *See Appendix for the reconciliations of these non -GAAP financial measures to the
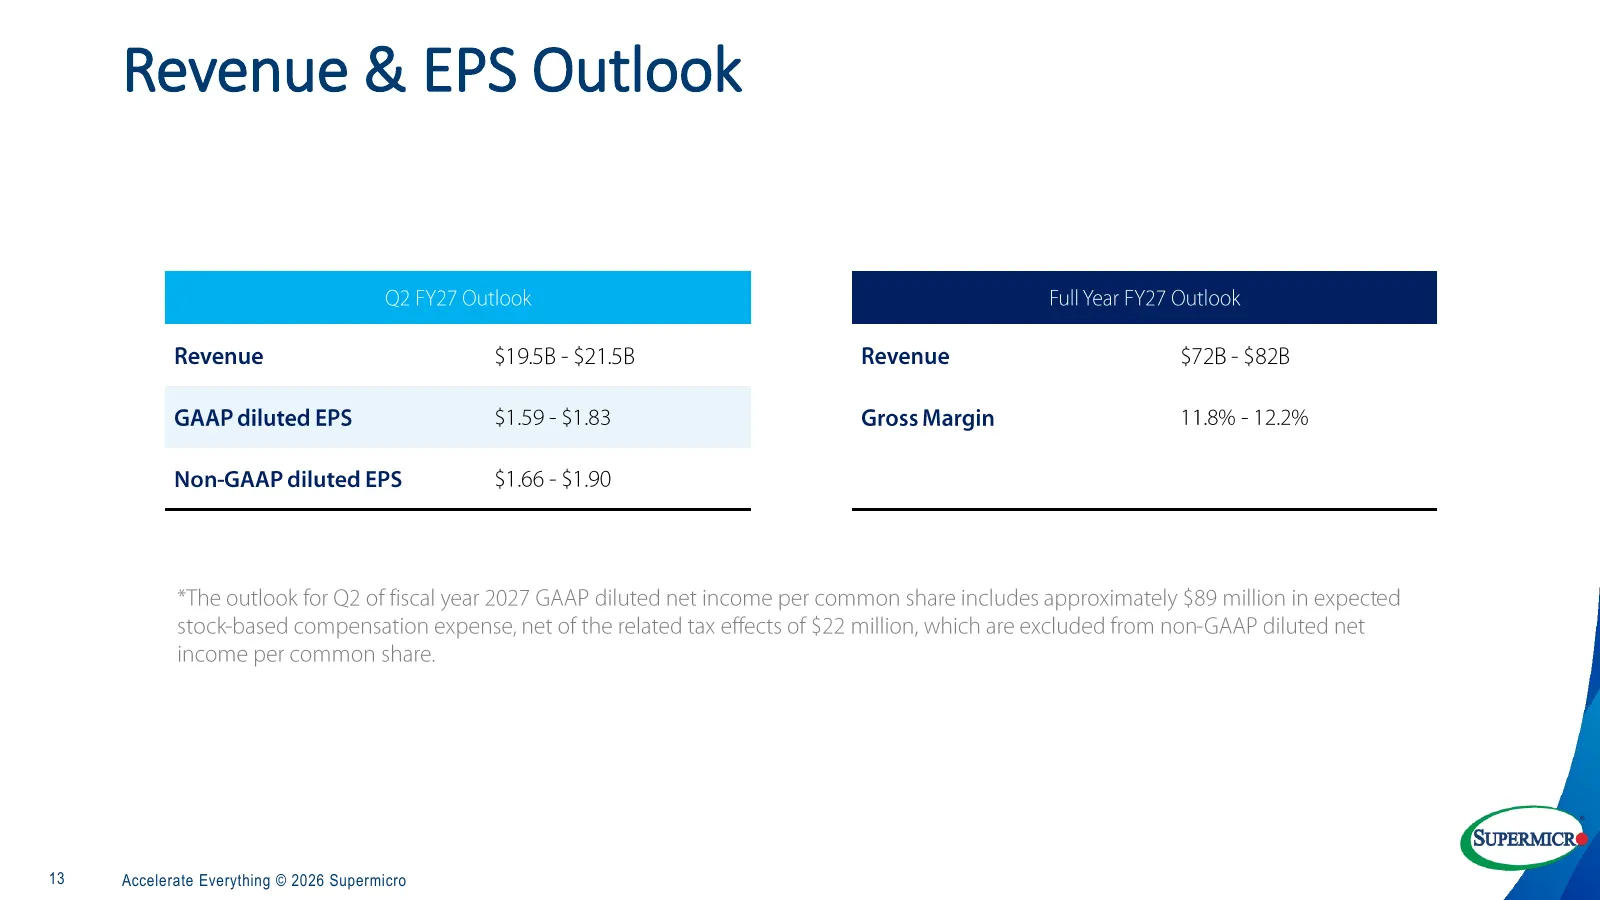
Slide 13: Revenue & EPS Outlook
Revenue & EPS Outlook Q2 FY27 Outlook Full Year FY27 Outlook Revenue $19.5B - $21.5B Revenue $72B - $82B GAAP diluted EPS $1.59 - $1.83 Gross Margin 11.8% - 12.2% Non-GAAP diluted EPS $1.66 - $1.90 *The outlook for Q2 of fiscal year 2027 GAAP diluted net income per common share includes approximatel
Slide 14: Appendix
APPENDIX Accelerate Everything © 2026 Supermicro
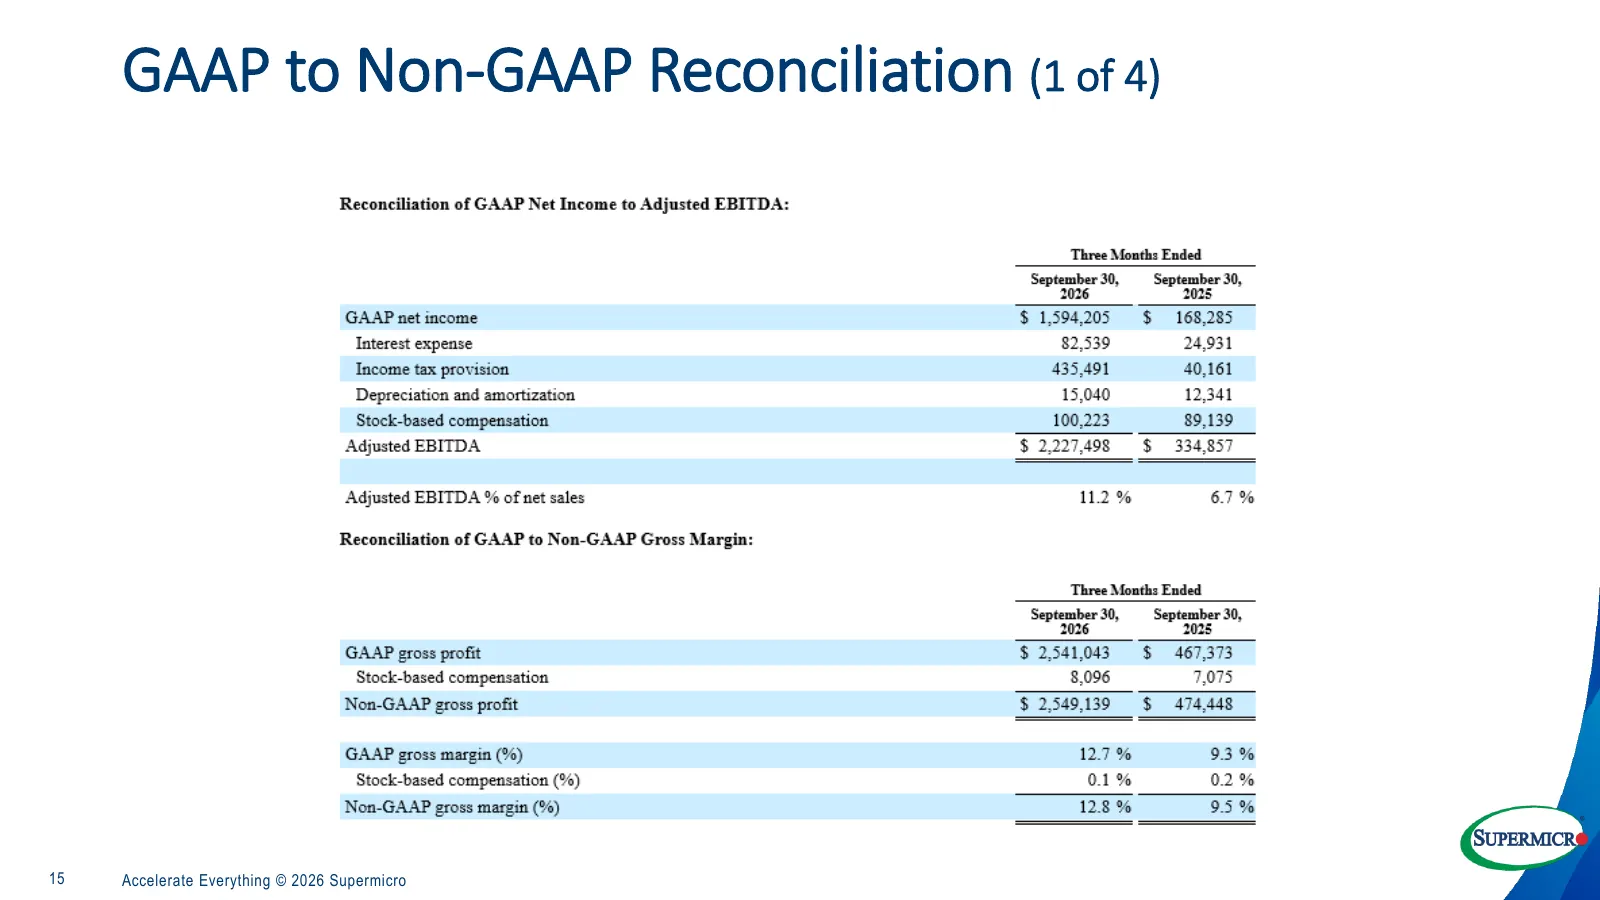
Slide 15: GAAP to Non-GAAP Reconciliation (1 of 4)
GAAP to Non-GAAP Reconciliation (1 of 4) 15 Accelerate Everything © 2026 Supermicro
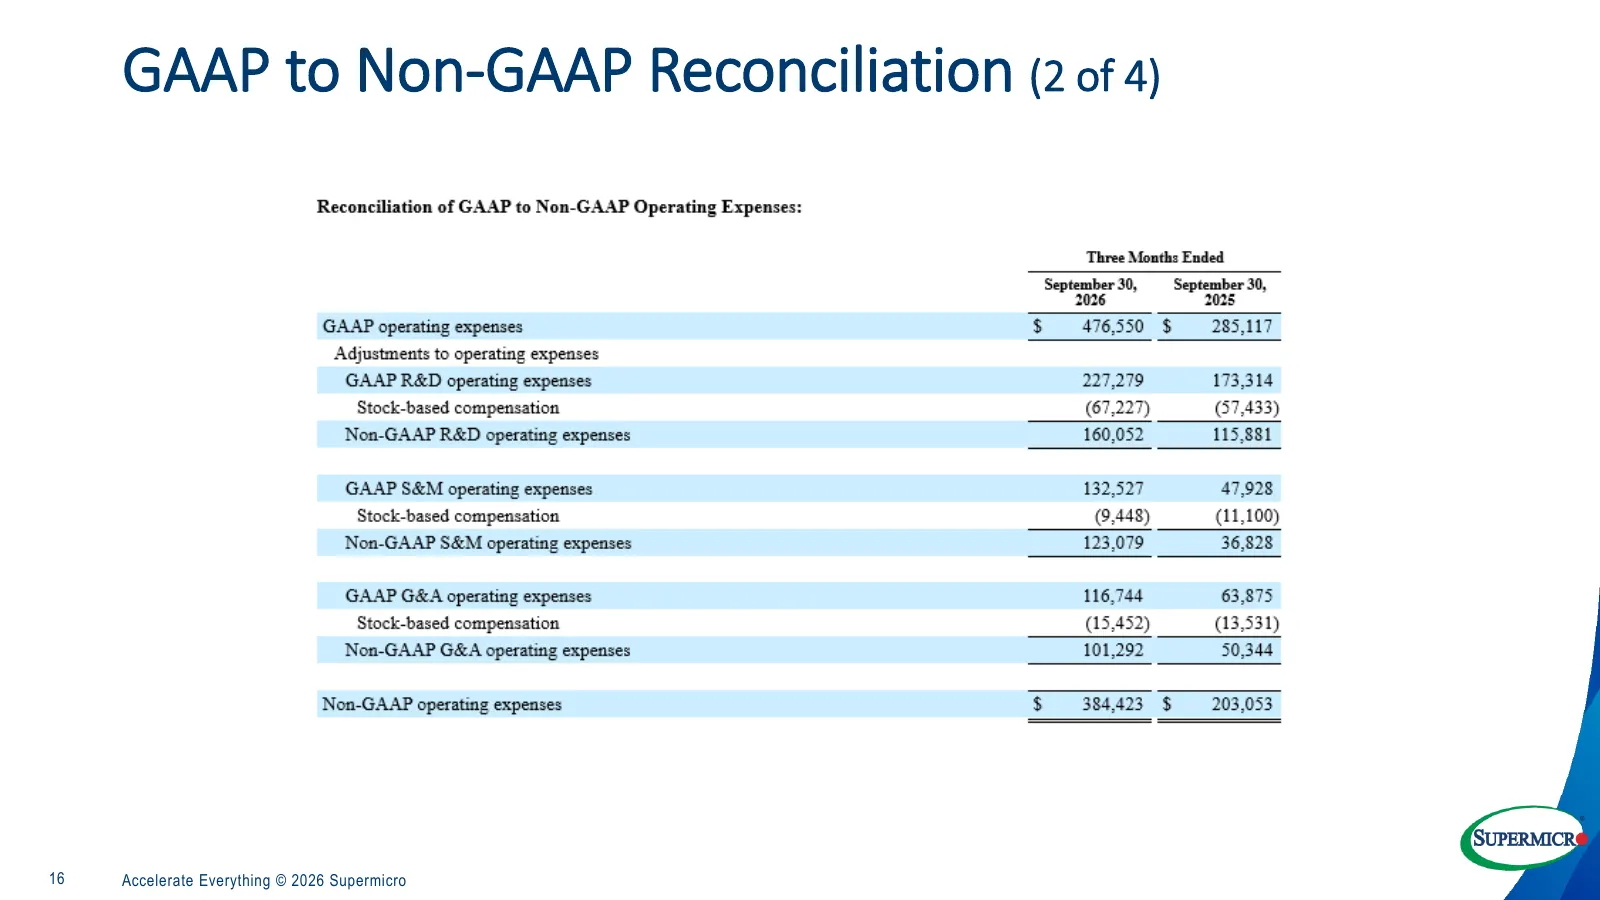
Slide 16: GAAP to Non-GAAP Reconciliation (2 of 4)
GAAP to Non-GAAP Reconciliation (2 of 4) 16 Accelerate Everything © 2026 Supermicro
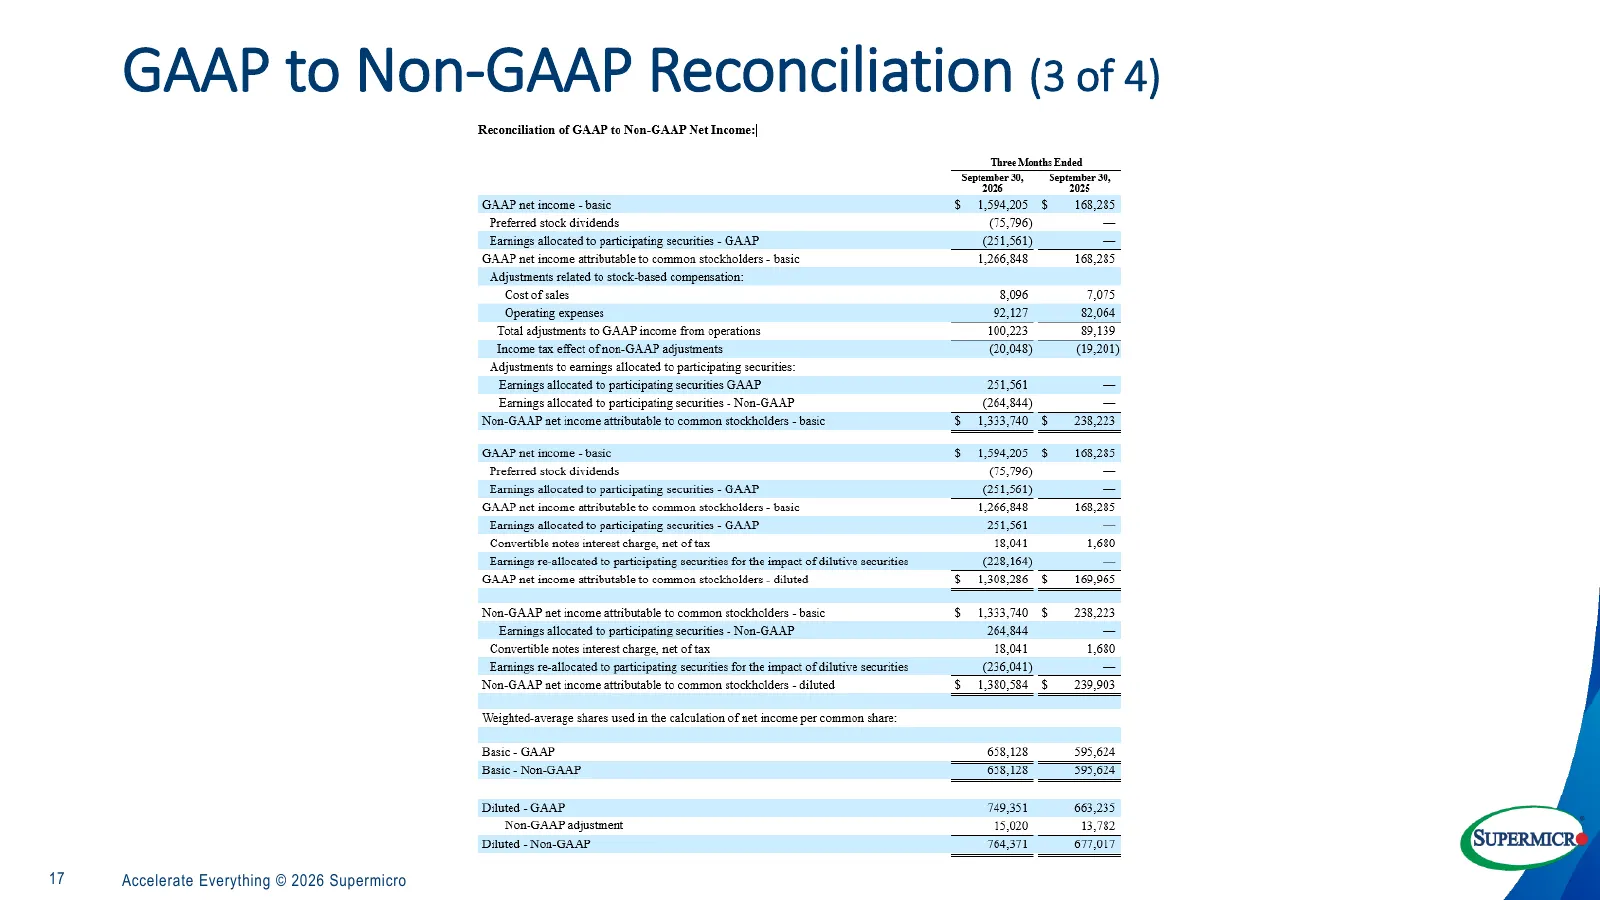
Slide 17: GAAP to Non-GAAP Reconciliation (3 of 4)
GAAP to Non-GAAP Reconciliation (3 of 4) 17 Accelerate Everything © 2026 Supermicro
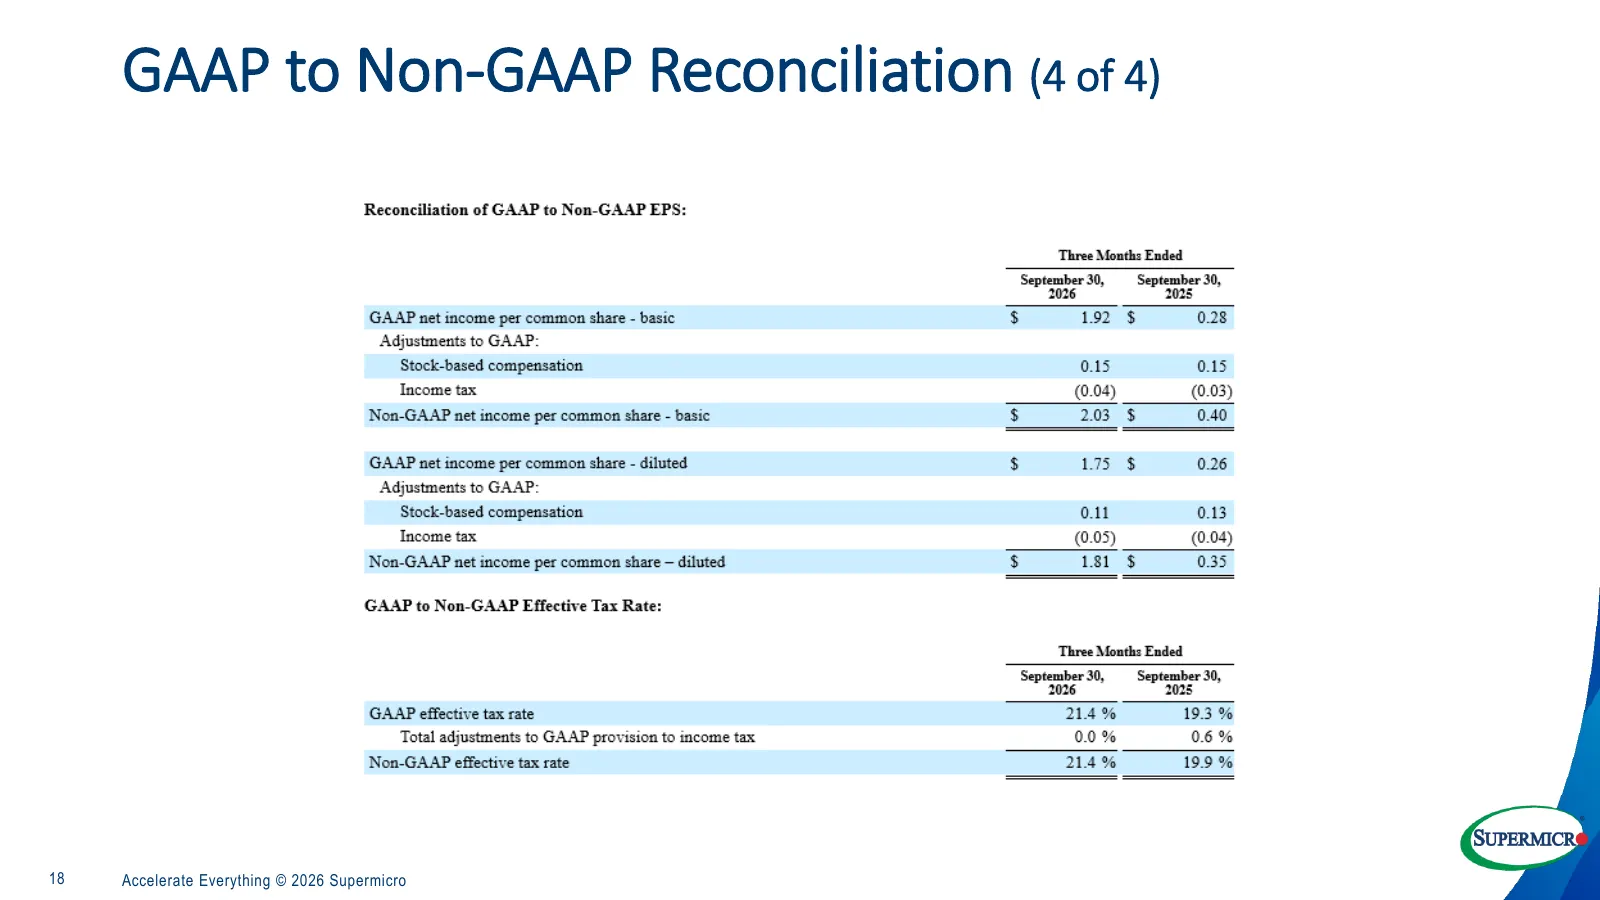
Slide 18: GAAP to Non-GAAP Reconciliation (4 of 4)
GAAP to Non-GAAP Reconciliation (4 of 4) 18 Accelerate Everything © 2026 Supermicro

Slide 19: www.supermicro.com
Wwww.supermicro.com
Source: 6ix earnings call
More decks from Super Micro Computer, Inc.
 Q4 2026 Earnings Presentation17 slides · Aug 11, 2026
 Q3 2026 Earnings Presentation16 slides · May 5, 2026
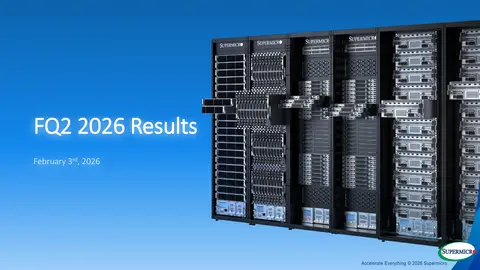 Q2 2026 Earnings Presentation16 slides · Feb 3, 2026
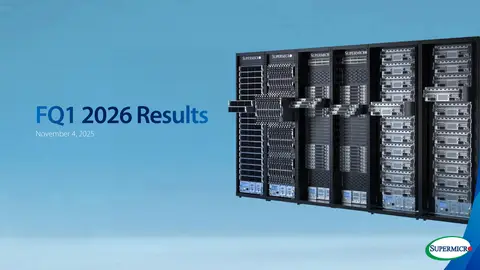 Q1 2026 Earnings Presentation15 slides · Nov 4, 2025
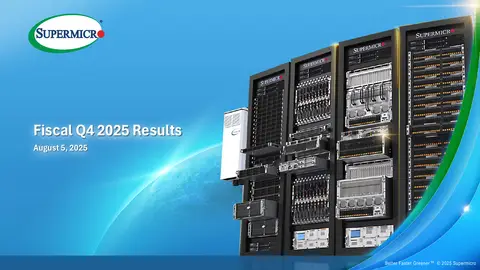 Q4 2025 Earnings Presentation17 slides · Aug 5, 2025
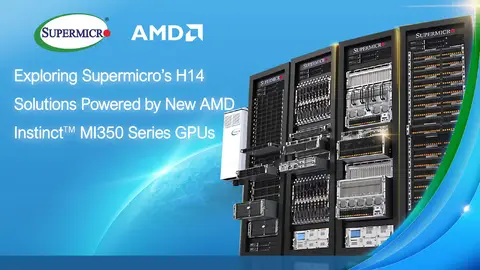 Technical Presentation (July 2025)24 slides · July 2025