InZinc Mining Ltd. · TSXV:IZN
InZinc Mining — Investor Presentation (July 2016)
25 slides from InZinc Mining's investor presentation, July 2016
Slide 1: Emerging Low-cost Mid-tier Zinc Producer
Emerging Low-cost Mid-tier Zinc Producer July 2016
Slide 2: Cautionary Statement
Cautionary Statement This presentation contains certain statements that may be deemed "forward-looking statements". All statements in this presentation, other than statements of historical fact, that address future production, reserve potential, exploration drilling, exploitation activities and even
Slide 3: InZinc Mining: Emerging Low-Cost Mid-Tier Zinc Producer
InZinc Mining Emerging Low-Cost Mid-Tier Zinc Producer 100% interest in the West Desert zinc-iron-copper project in Utah o One of the best located and larger undeveloped zinc resources Excellent results from updated West Desert PEA (April 2014) o One of best returning zinc projects within peer g
Slide 4: Capital Structure
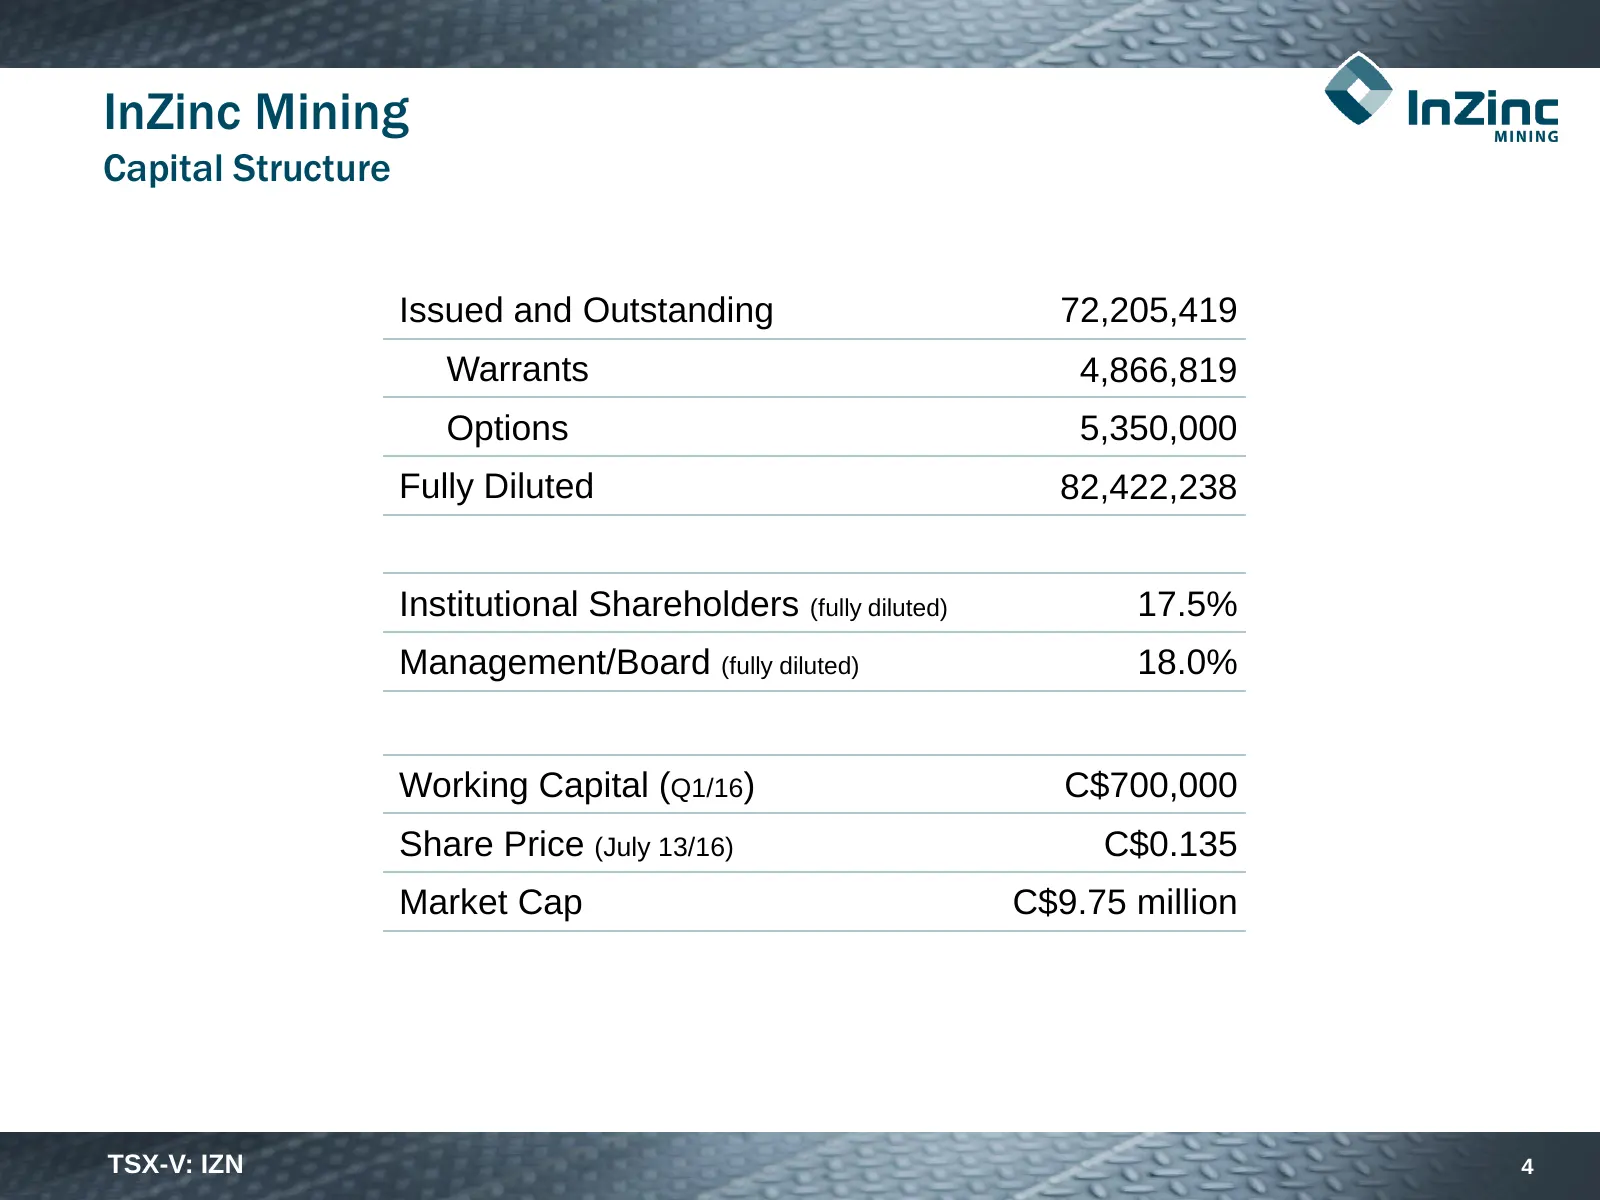
InZinc Mining Capital Structure Issued and Outstanding 72,205,419 Warrants 4,866,819 Options 5,350,000 Fully Diluted 82,422,238 Institutional Shareholders (fully diluted) 17.5% Management/Board (fully diluted) 18.0% Working Capital (Q1/16) C$700,000 Share Price (July 13/16) C$0.135 Market Cap C$9.75
Slide 5: Focused on Delivering Value
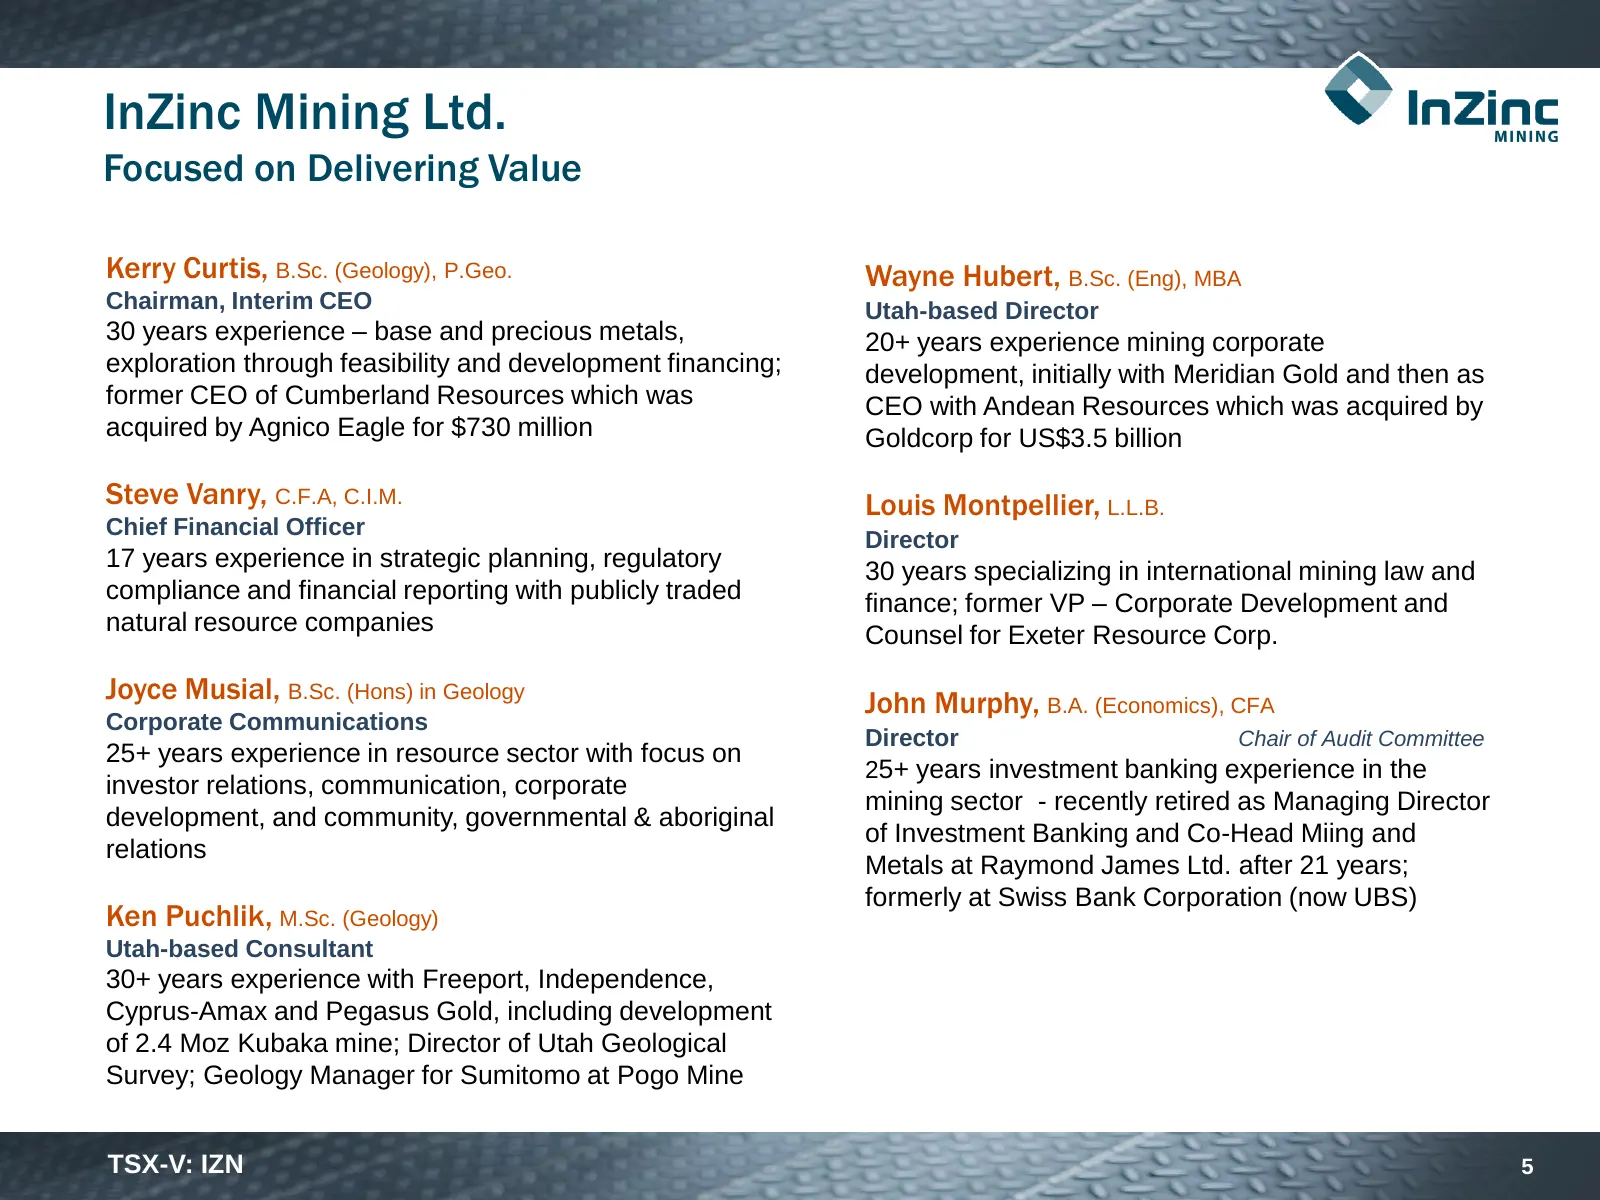
InZinc Mining Ltd. Focused on Delivering Value Kerry Curtis, B.Sc. (Geology), P.Geo. Wayne Hubert, B.Sc. (Eng), MBA Chairman, Interim CEO Utah-based Director 30 years experience – base and precious metals, 20+ years experience mining corporate exploration through feasibility and development financin
Slide 6: Excellent Jurisdiction – Surrounded by Infrastructure
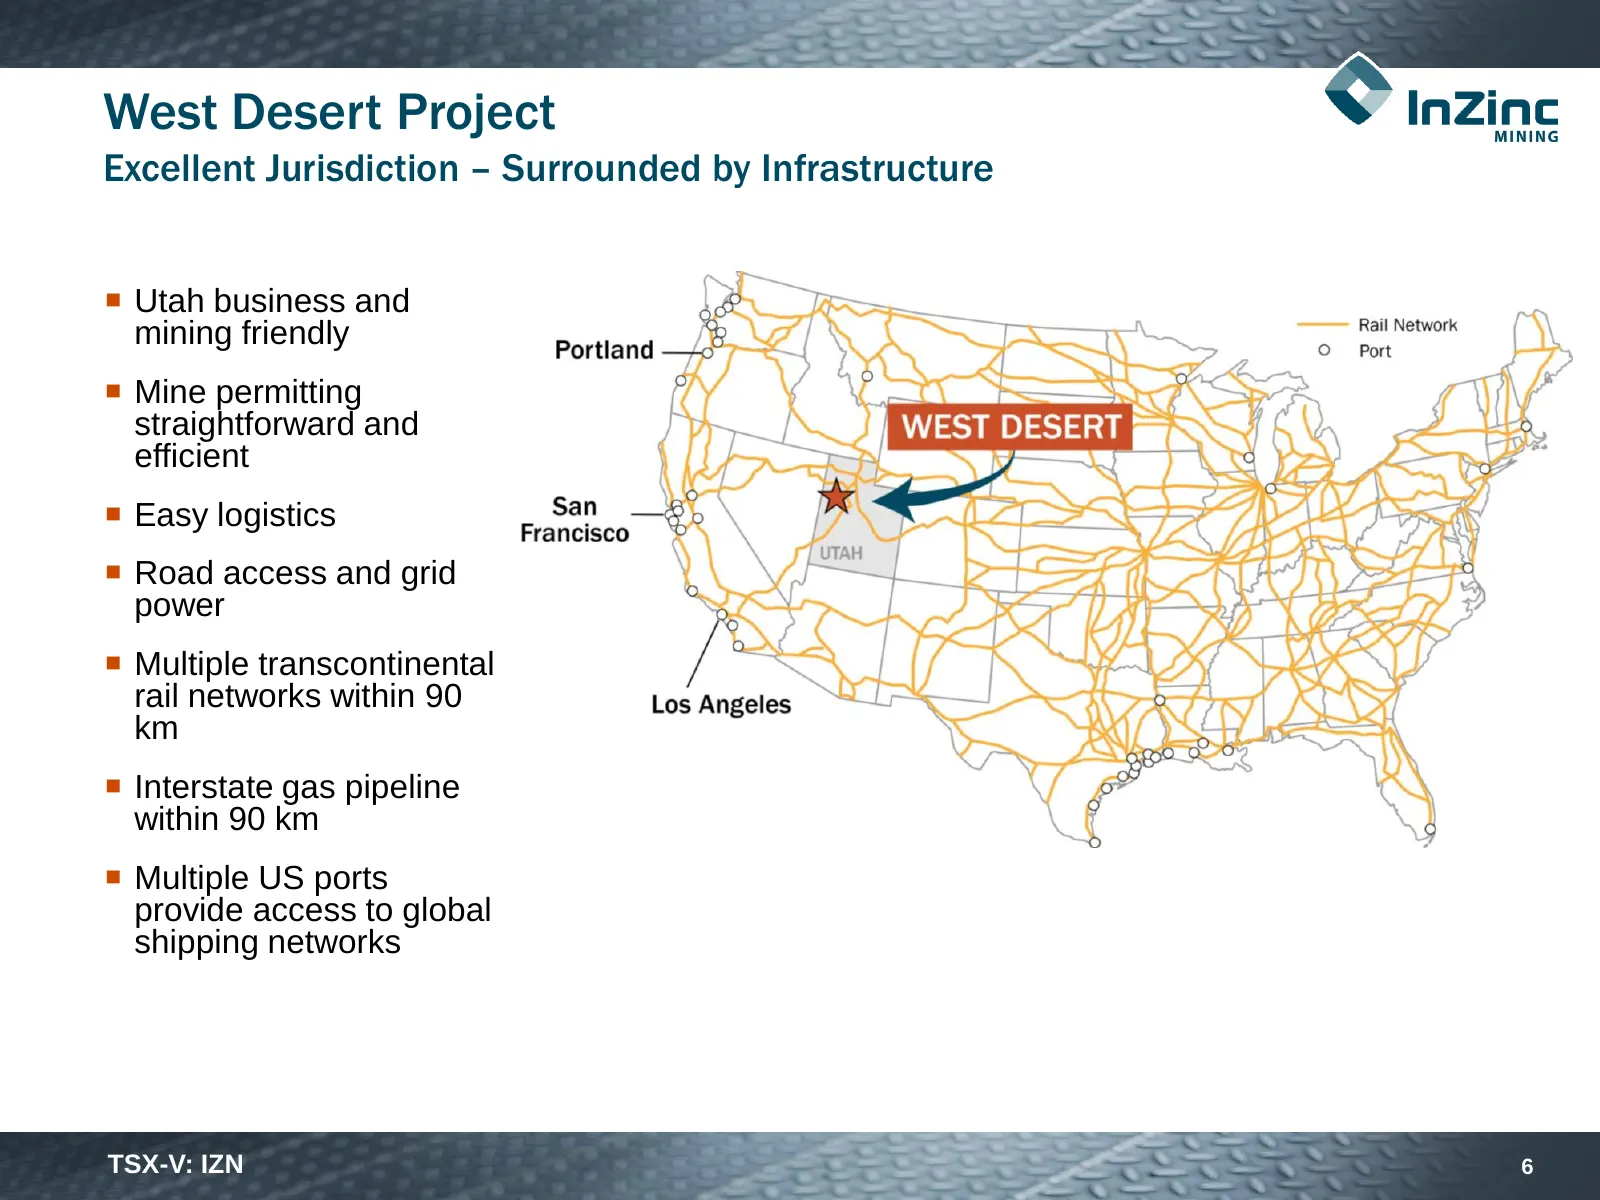
West Desert Project Excellent Jurisdiction – Surrounded by Infrastructure Utah business and mining friendly Mine permitting straightforward and efficient Easy logistics Road access and grid power Multiple transcontinental rail networks within 90 km Interstate gas pipeline within 90 km
Slide 7: The Right Address
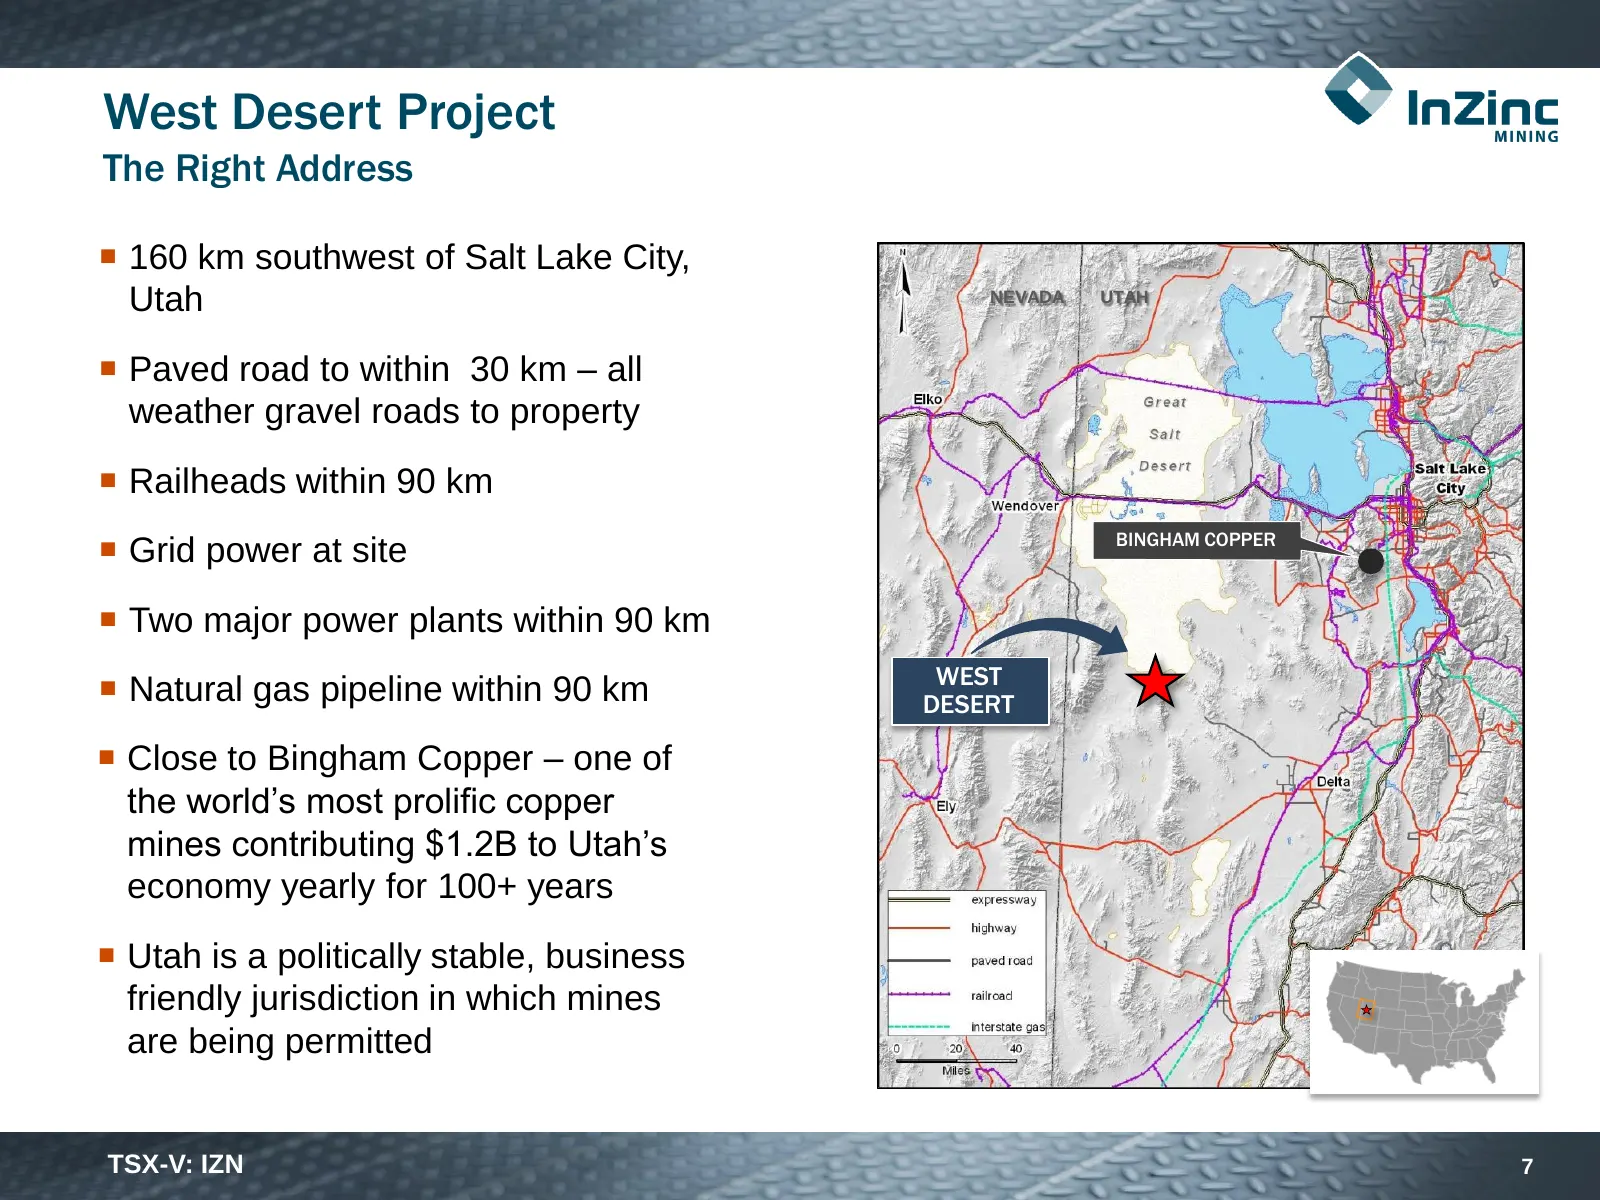
West Desert Project The Right Address 160 km southwest of Salt Lake City, Utah NEVADA UTAH Paved road to within 30 km – all weather gravel roads to property Railheads within 90 km BINGHAM COPPER Grid power at site Two major power plants within 90 km WEST Natural gas pipeline within 90 km
Slide 8: Low Project Execution Risk
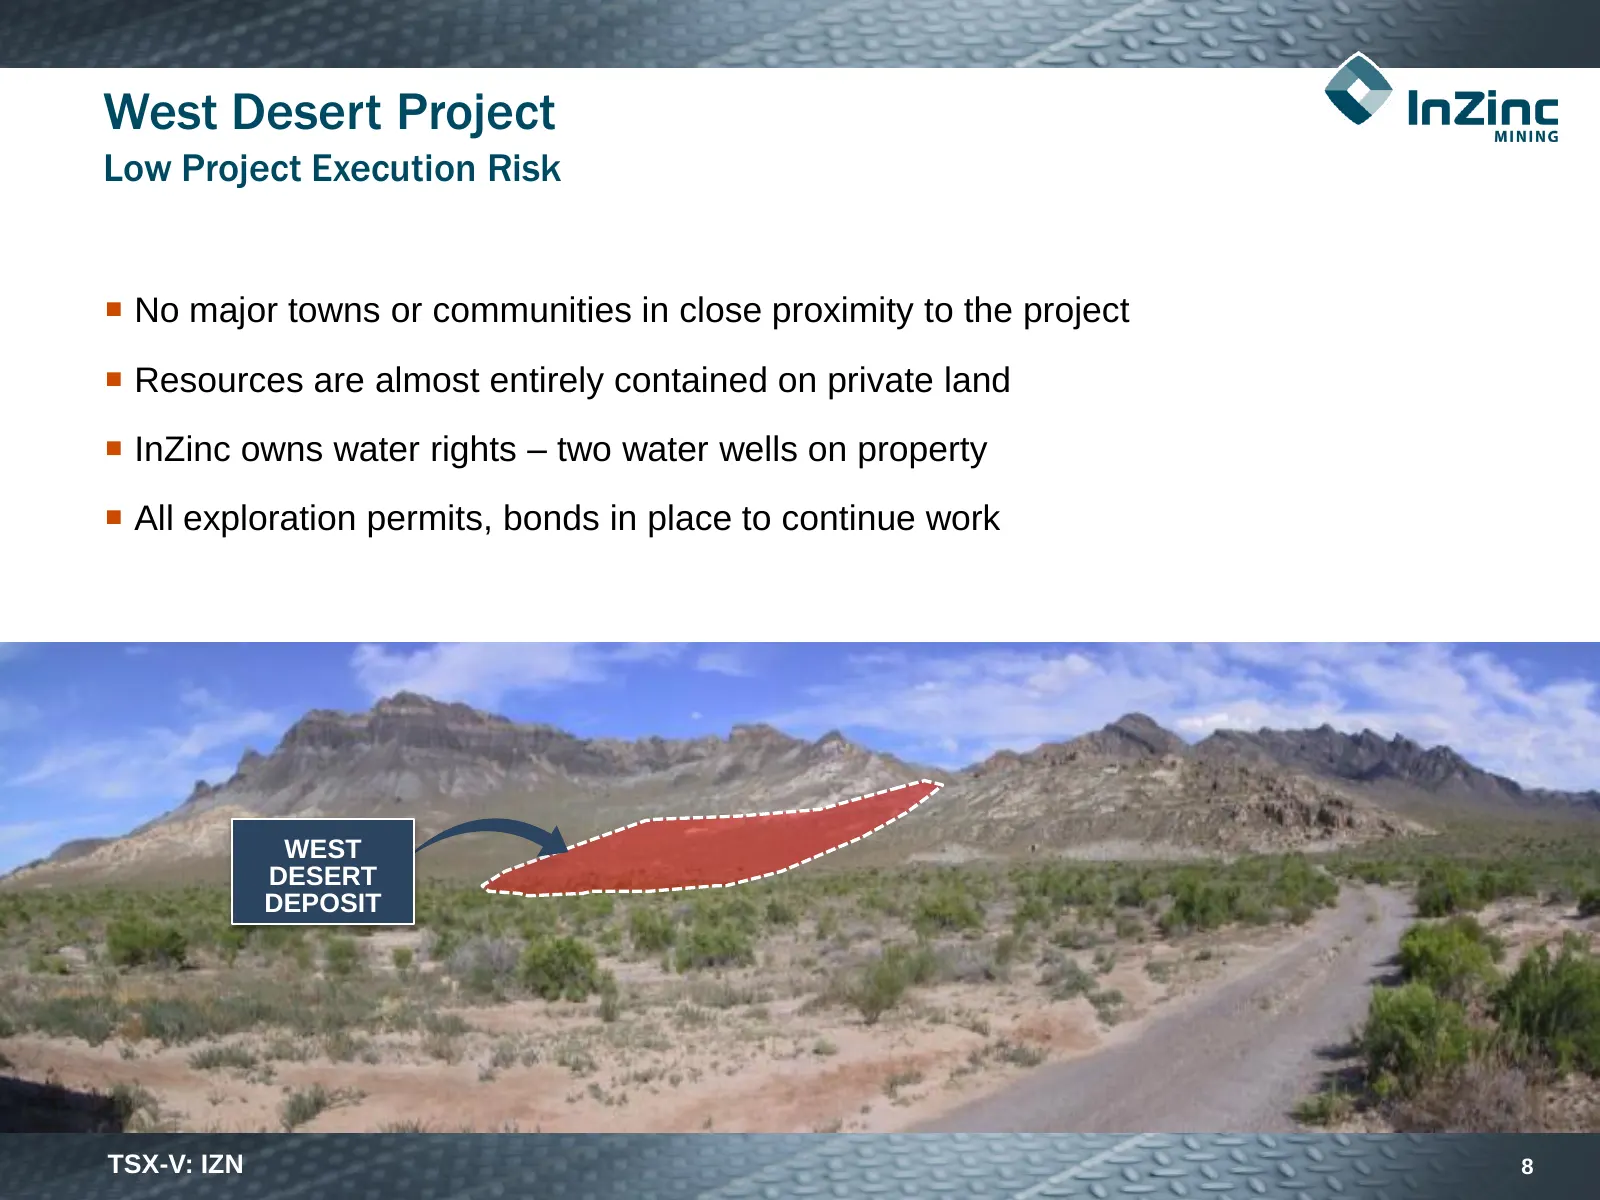
West Desert Project Low Project Execution Risk No major towns or communities in close proximity to the project Resources are almost entirely contained on private land InZinc owns water rights – two water wells on property All exploration permits, bonds in place to continue work WEST DESERT D
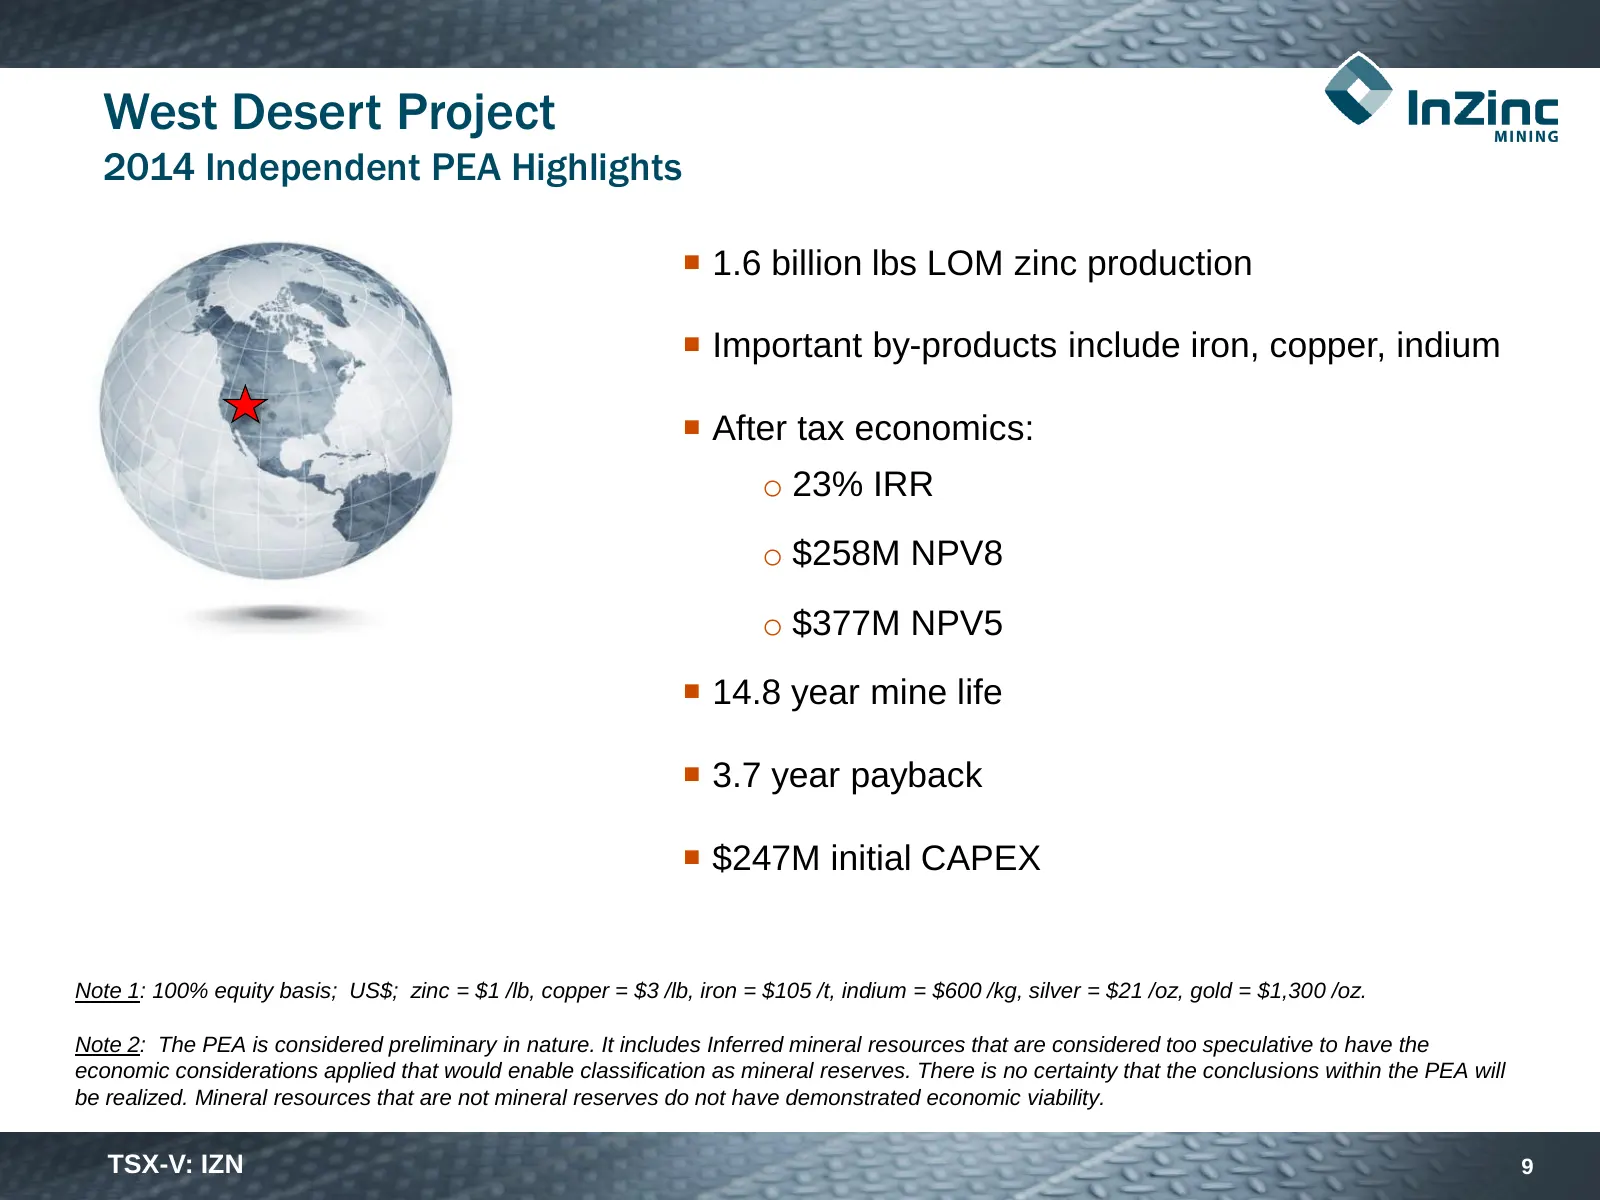
Slide 9: 2014 Independent PEA Highlights
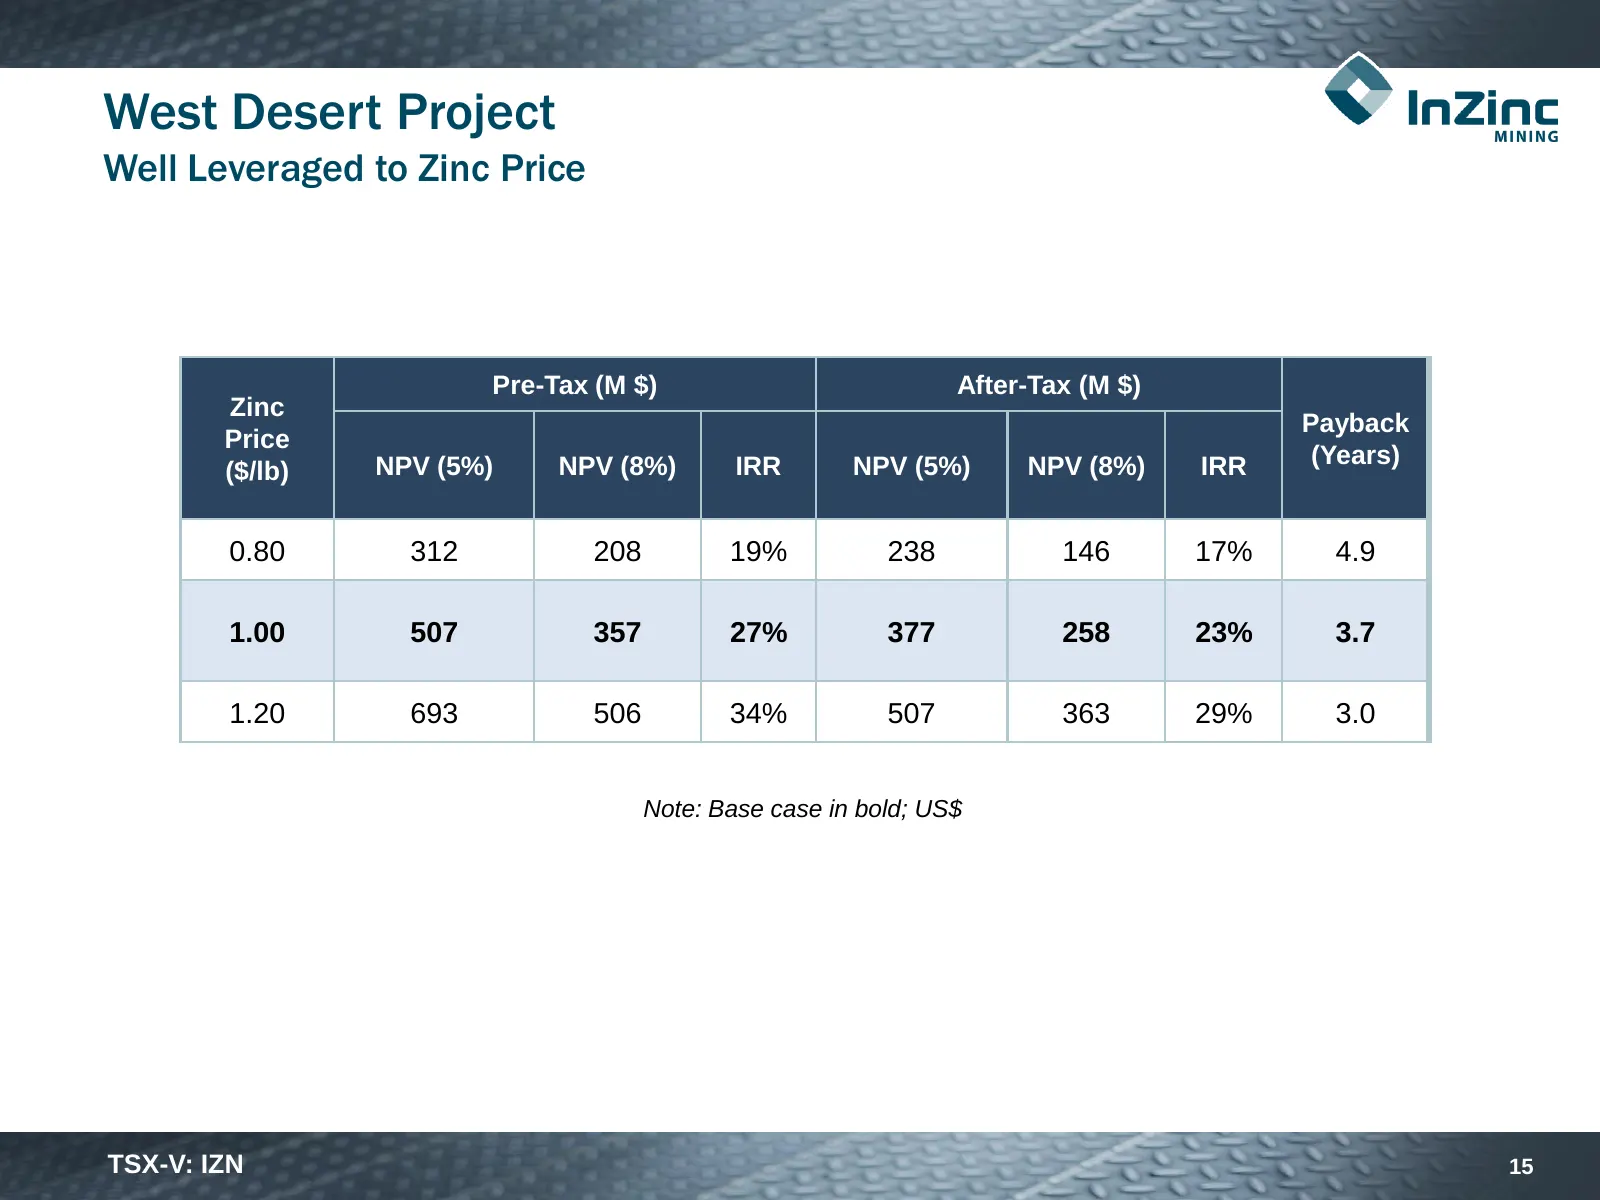
West Desert Project 2014 Independent PEA Highlights 1.6 billion lbs LOM zinc production Important by-products include iron, copper, indium After tax economics: o 23% IRR o $258M NPV8 o $377M NPV5 14.8 year mine life 3.7 year payback $247M initial CAPEX Note 1: 100% equity basis; US$; zin
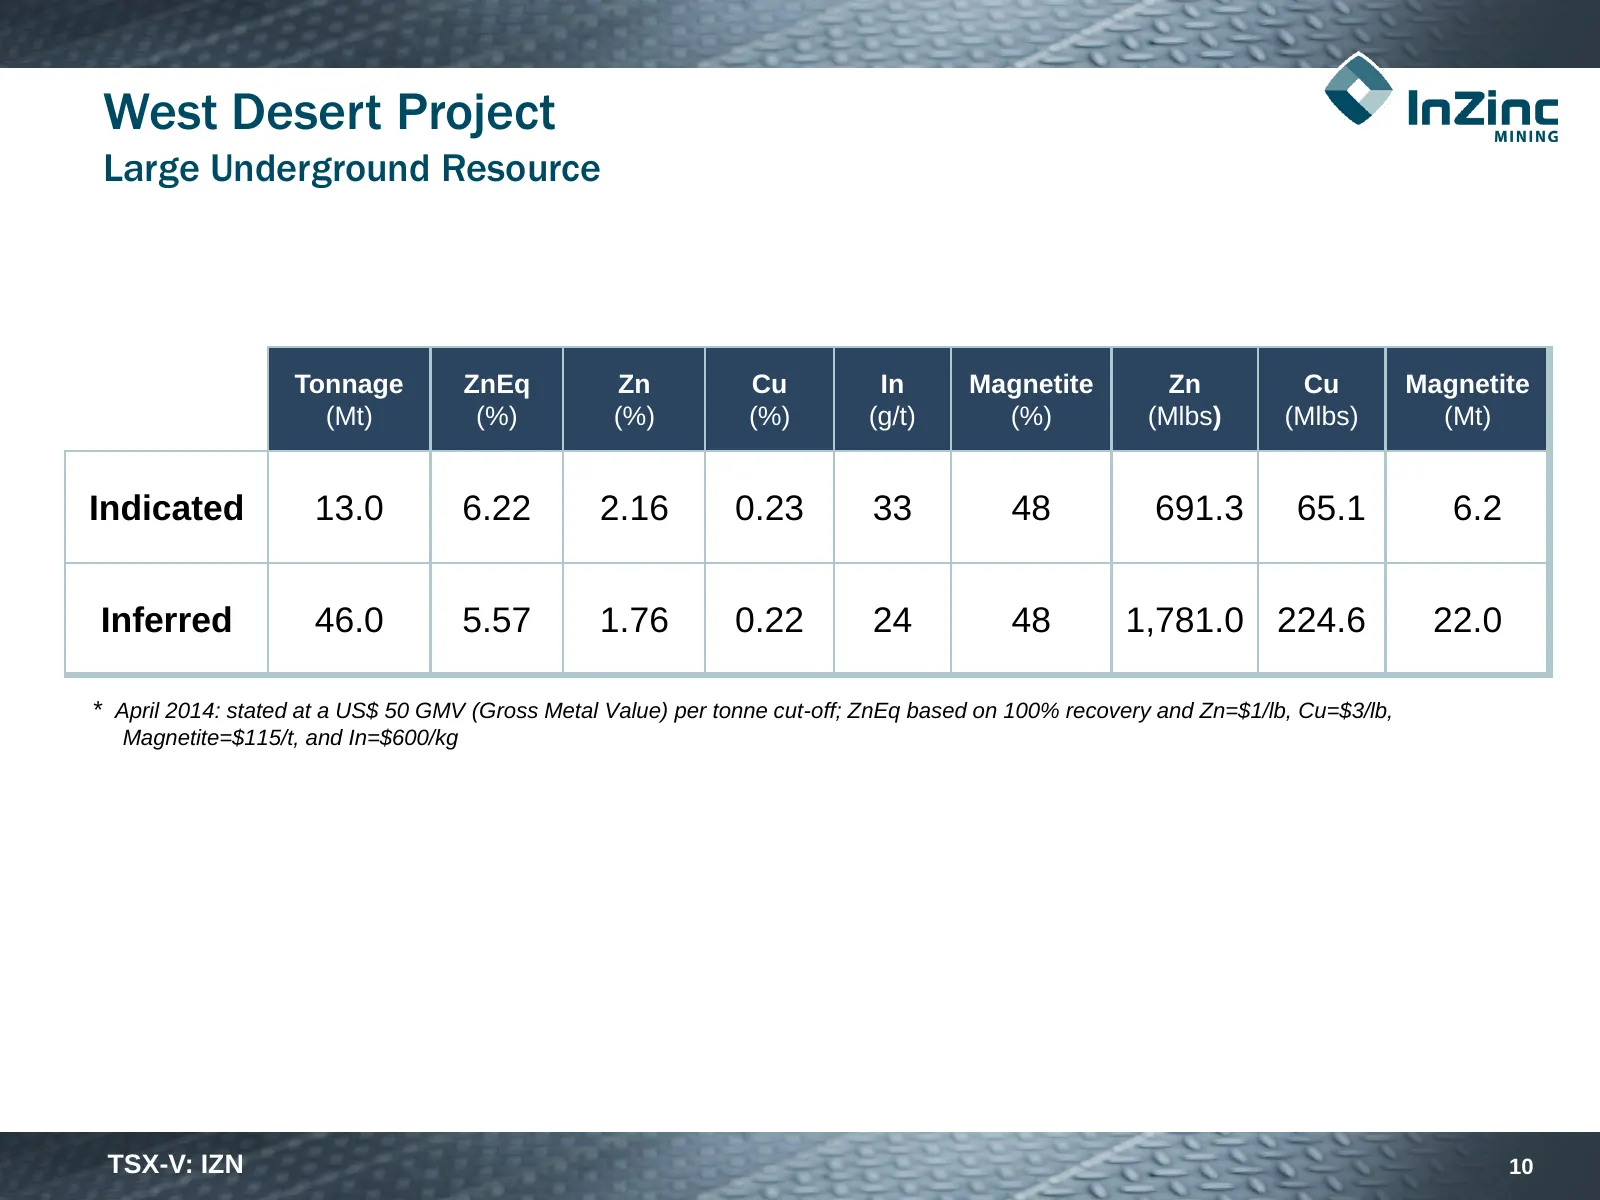
Slide 10: Large Underground Resource
West Desert Project Large Underground Resource Tonnage ZnEq Zn Cu In Magnetite Zn Cu Magnetite (Mt) (%) (%) (%) (g/t) (%) (Mlbs) (Mlbs) (Mt) Indicated 13.0 6.22 2.16 0.23 33 48 691.3 65.1 6.2 Inferred 46.0 5.57 1.76 0.22 24 48 1,781.0 224.6 22.0 * April 2014: stated at a US$ 50 GMV (Gross Metal Valu
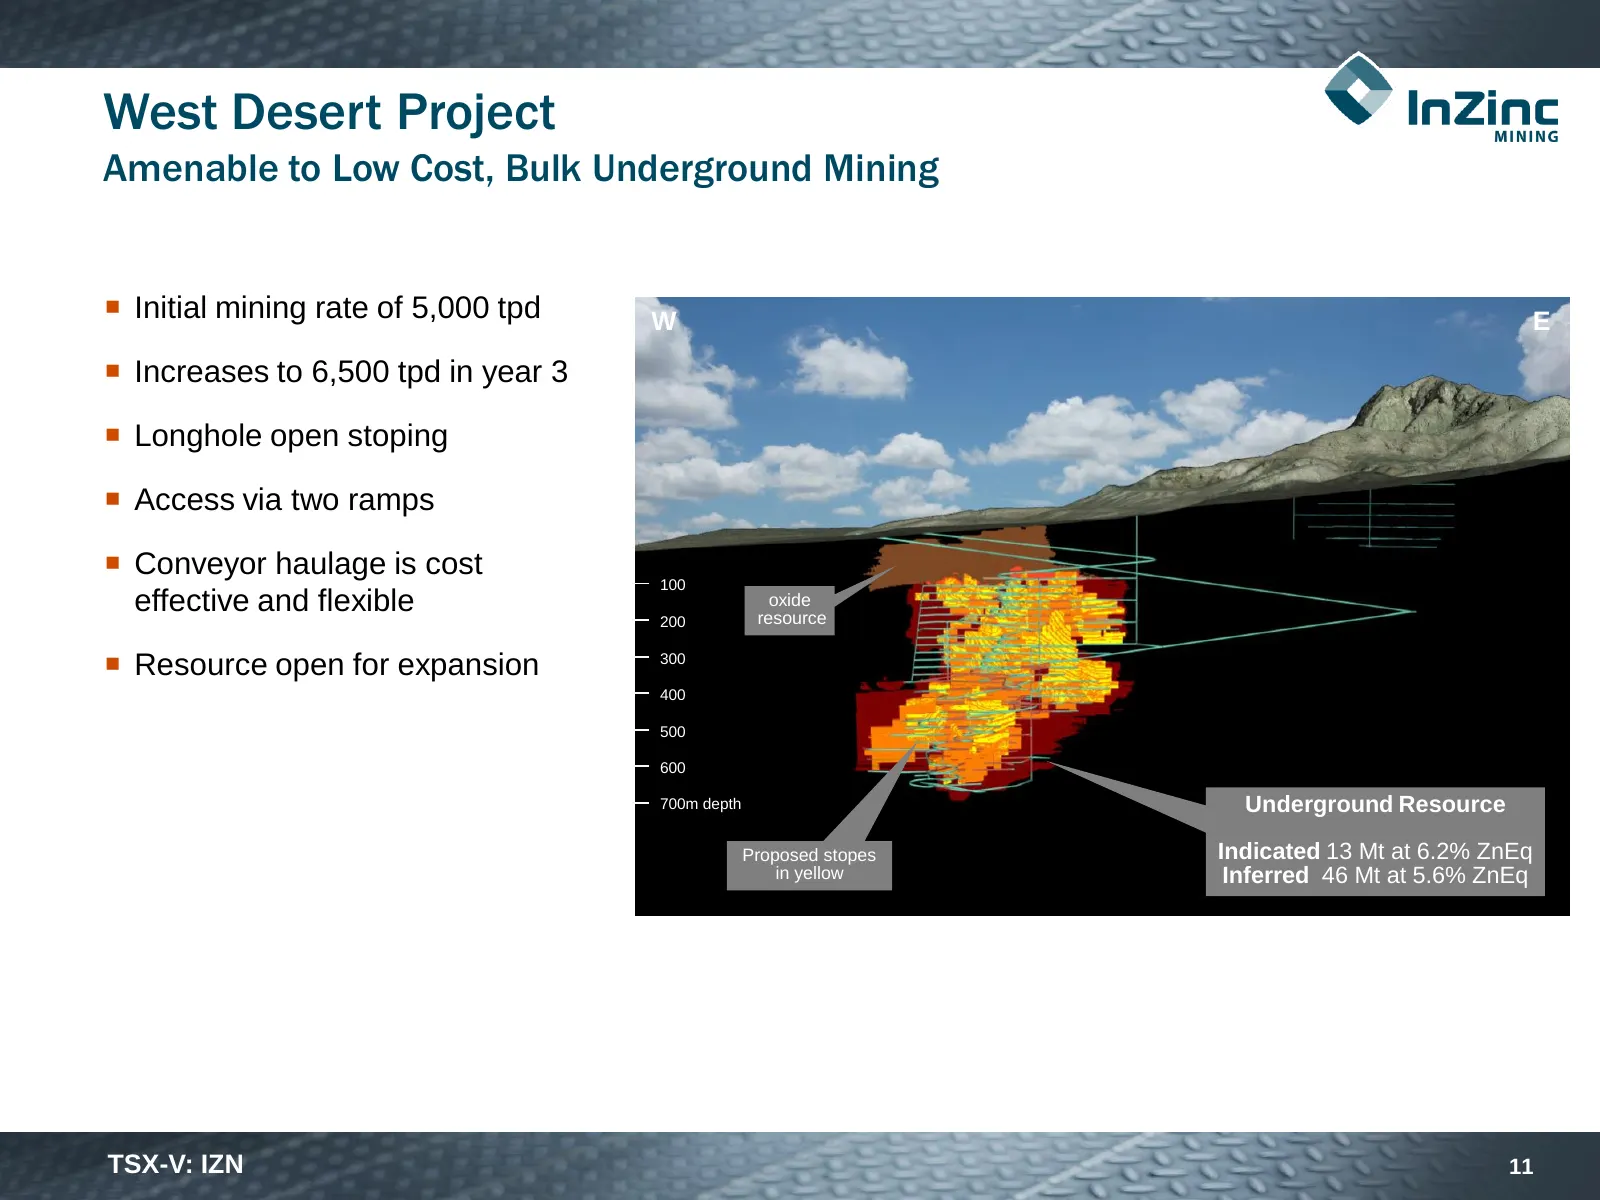
Slide 11: Amenable to Low Cost, Bulk Underground Mining
West Desert Project Amenable to Low Cost, Bulk Underground Mining Initial mining rate of 5,000 tpd W E Increases to 6,500 tpd in year 3 Longhole open stoping Access via two ramps Conveyor haulage is cost 100 effective and flexible oxide resource 200 Resource open for expansion 300 400 50
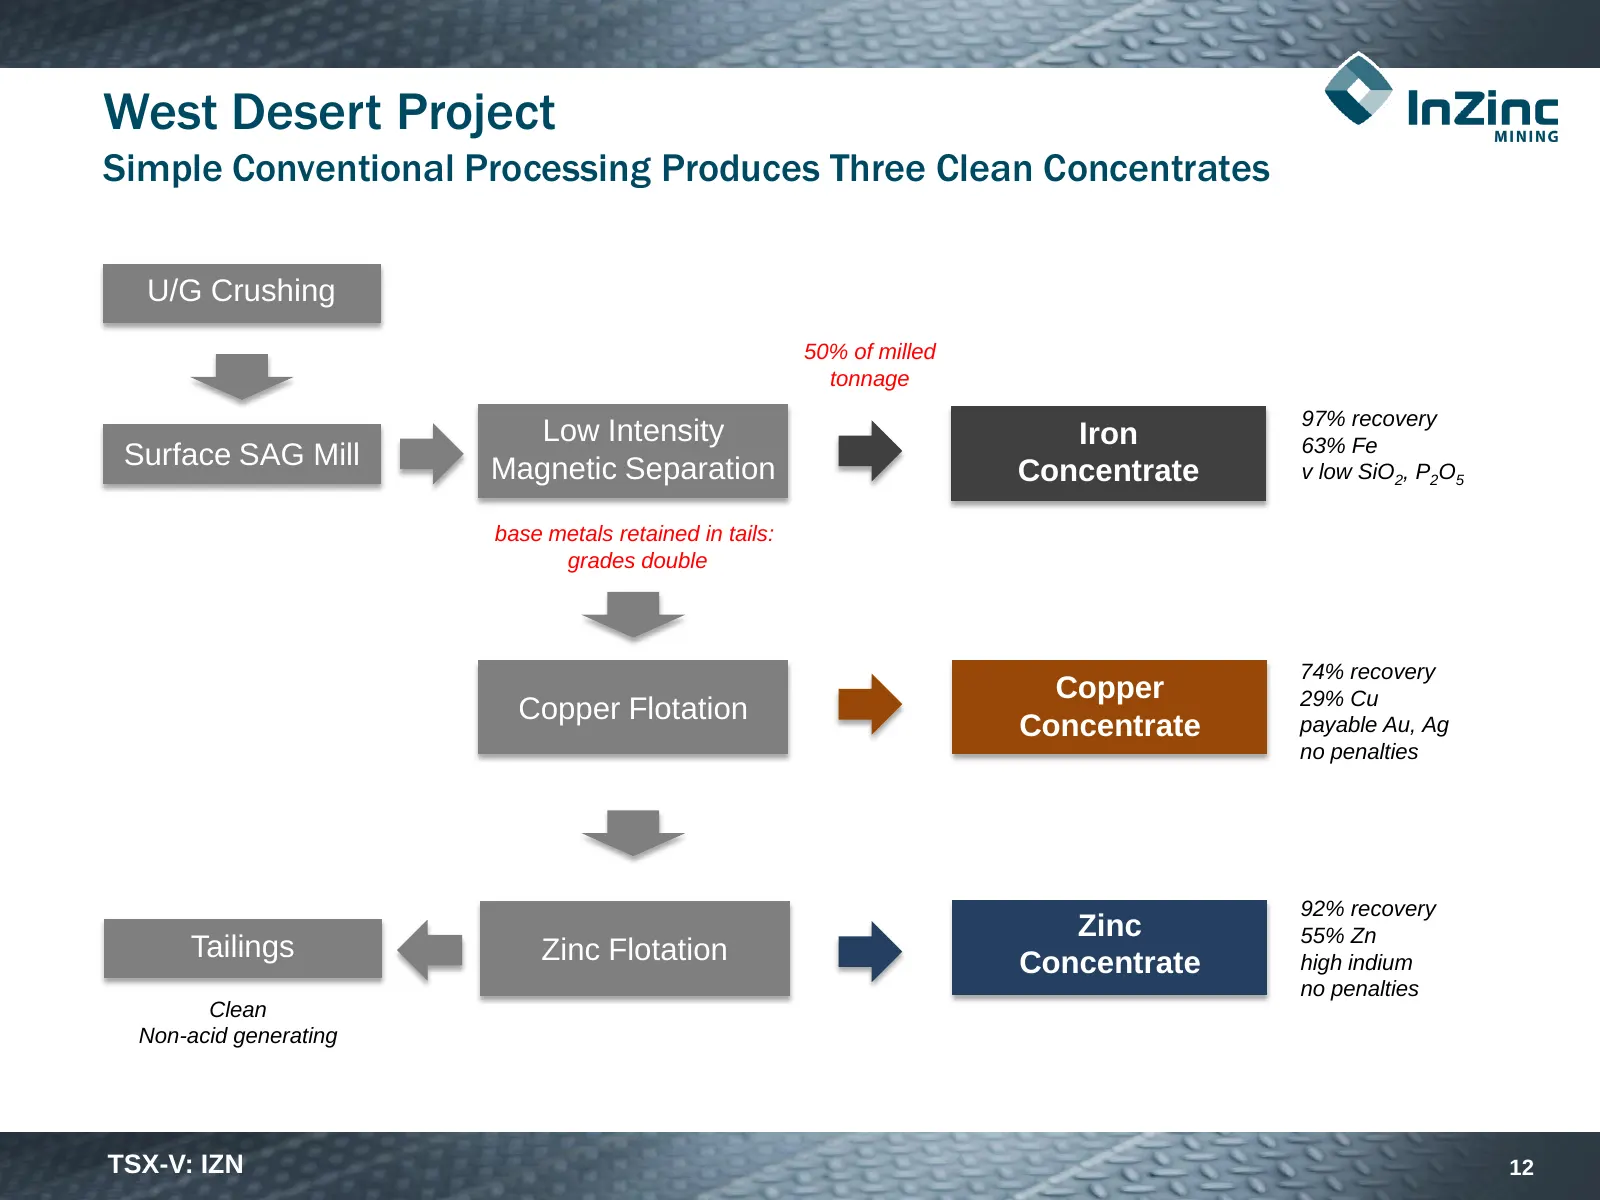
Slide 12: Simple Conventional Processing Produces Three Clean Concentrates
West Desert Project Simple Conventional Processing Produces Three Clean Concentrates U/G Crushing 50% of milled tonnage 97% recovery Low Intensity Iron 63% Fe Surface SAG Mill Magnetic Separation Concentrate v low SiO2, P2O5 base metals retained in tails: grades double 74% recovery Copper 29% Cu Cop
Slide 13: Multiple Projected Payable Metals
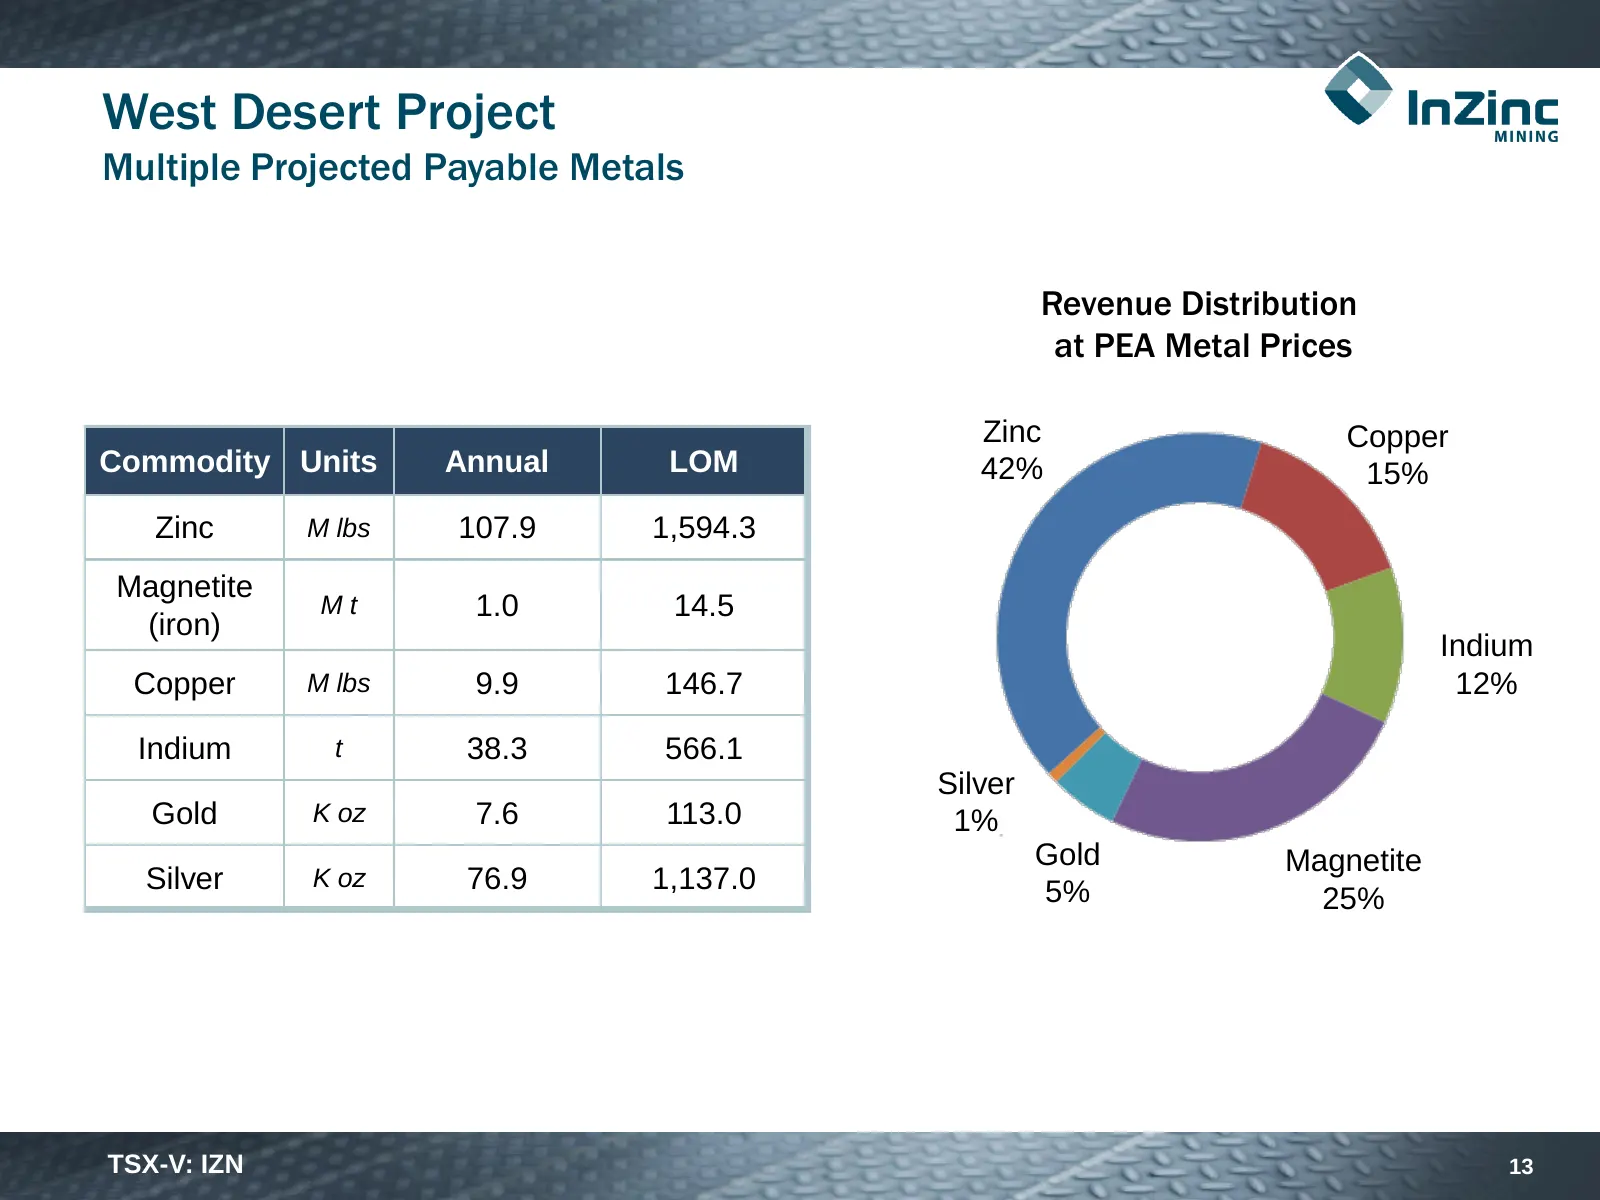
West Desert Project Multiple Projected Payable Metals Revenue Distribution at PEA Metal Prices Zinc Copper Commodity Units Annual LOM 42% 15% Zinc M lbs 107.9 1,594.3 Magnetite Mt 1.0 14.5 (iron) Indium Copper M lbs 9.9 146.7 12% Indium t 38.3 566.1 Silver Gold K oz 7.6 113.0 1% Gold Magnetite Silve
Slide 14: Cash Costs (C1) in the Lowest 5% of Global Production
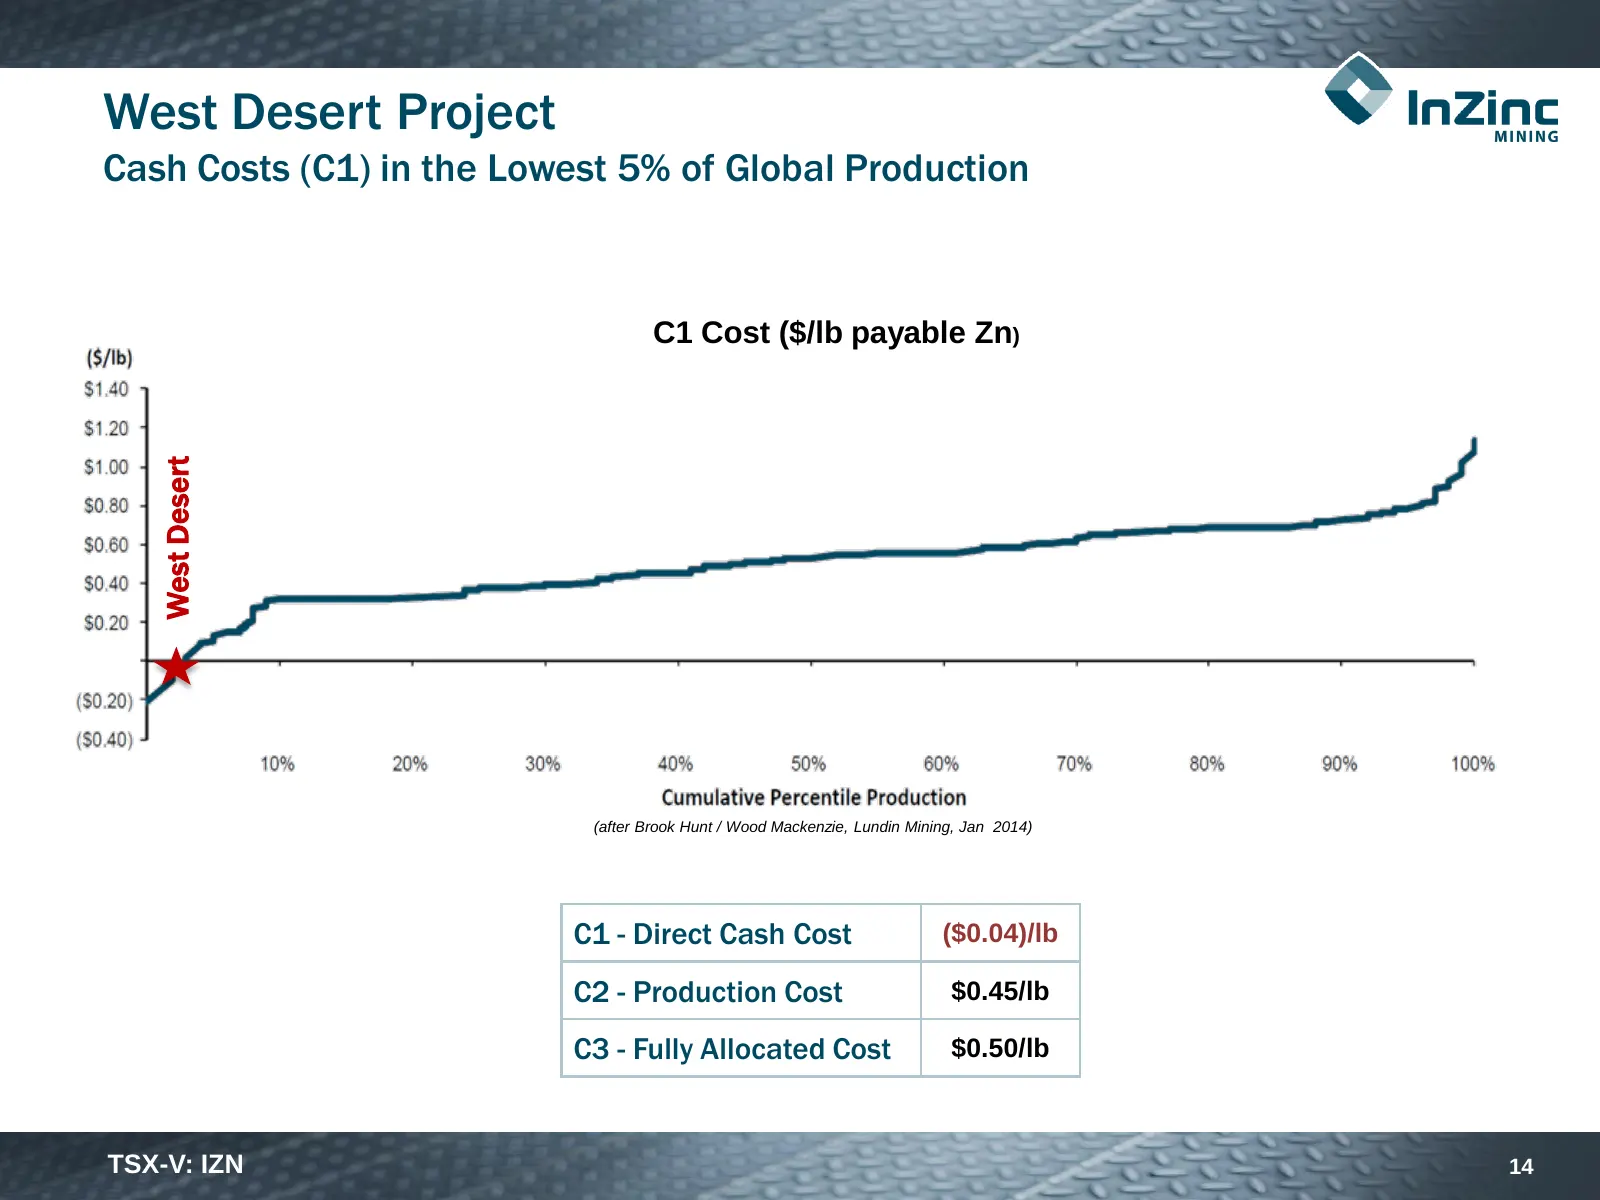
West Desert Project Cash Costs (C1) in the Lowest 5% of Global Production C1 Cost ($/lb payable Zn) West Desert (after Brook Hunt / Wood Mackenzie, Lundin Mining, Jan 2014) C1 - Direct Cash Cost ($0.04)/lb C2 - Production Cost $0.45/lb C3 - Fully Allocated Cost $0.50/lb TSX-V: IZN 14
Slide 15: Well Leveraged to Zinc Price
West Desert Project Well Leveraged to Zinc Price Pre-Tax (M $) After-Tax (M $) Zinc Payback Price NPV (5%) NPV (8%) IRR NPV (5%) NPV (8%) IRR (Years) ($/lb) 0.80 312 208 19% 238 146 17% 4.9 1.00 507 357 27% 377 258 23% 3.7 1.20 693 506 34% 507 363 29% 3.0 Note: Base case in bold; US$ TSX-V: IZN 15
Slide 16: Significant Upside Potential
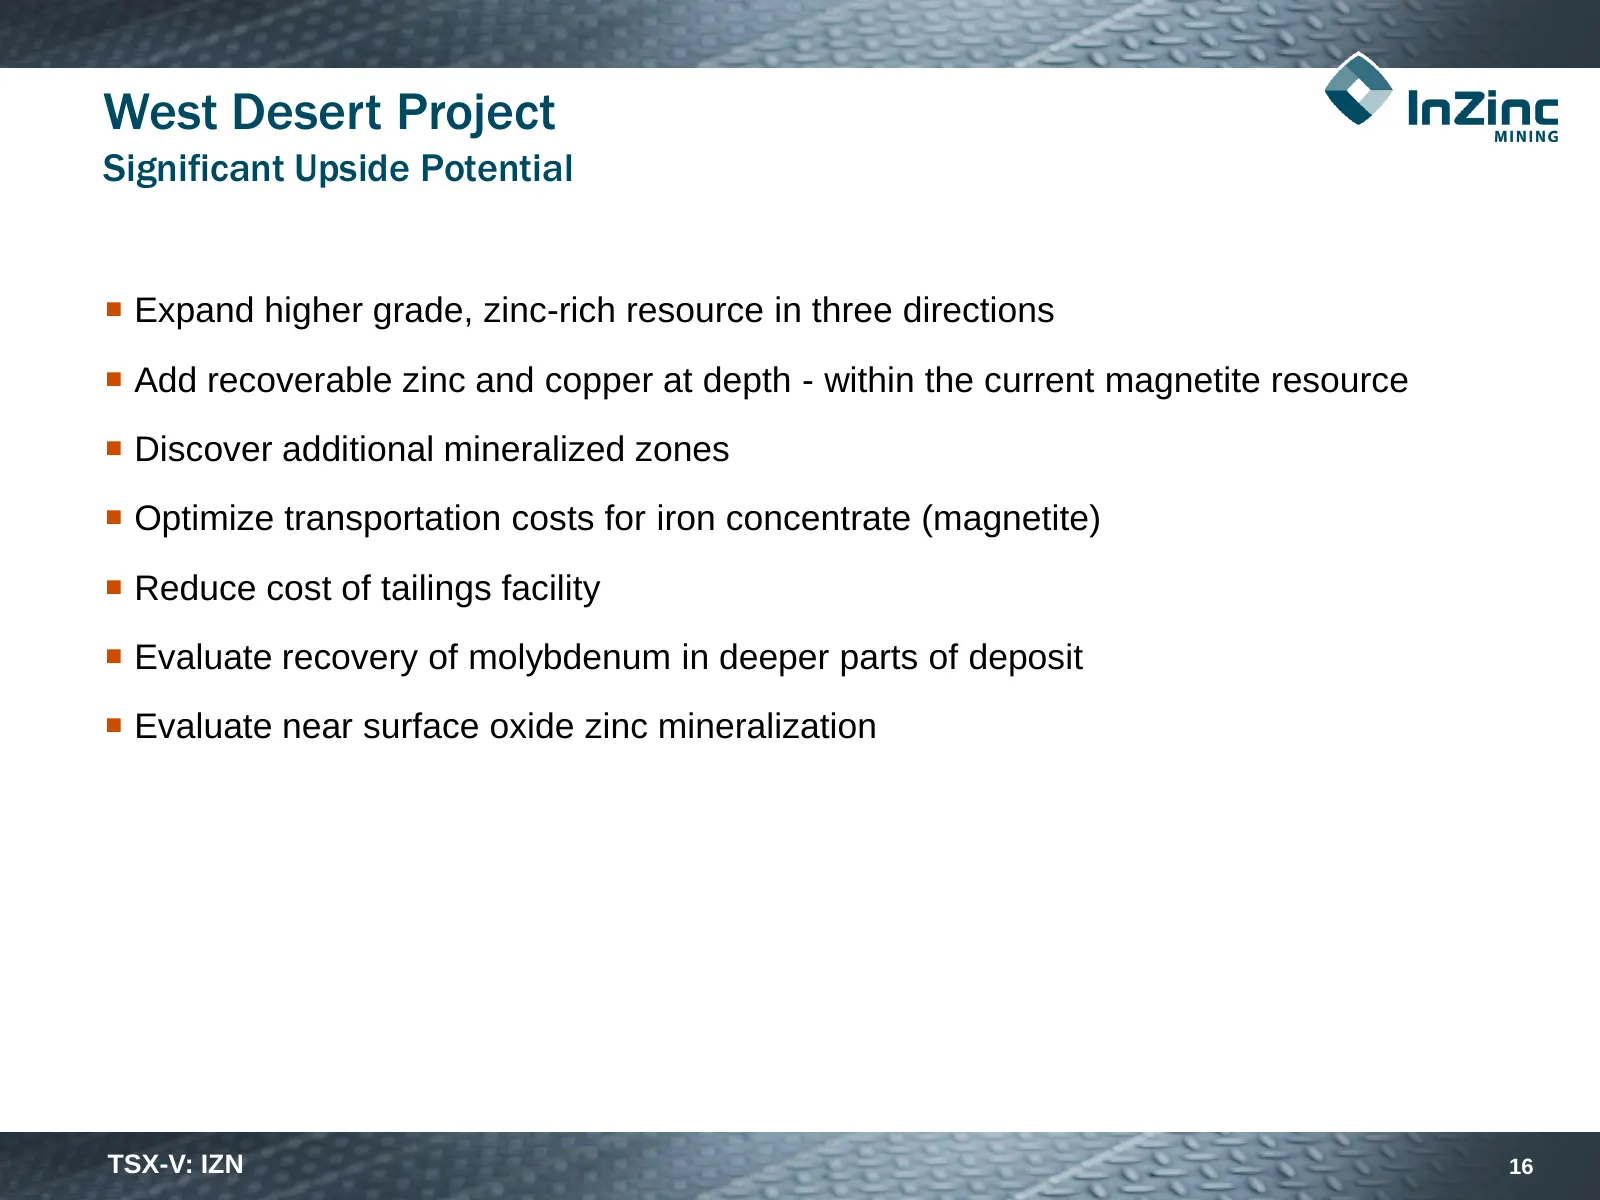
West Desert Project Significant Upside Potential Expand higher grade, zinc-rich resource in three directions Add recoverable zinc and copper at depth - within the current magnetite resource Discover additional mineralized zones Optimize transportation costs for iron concentrate (magnetite)
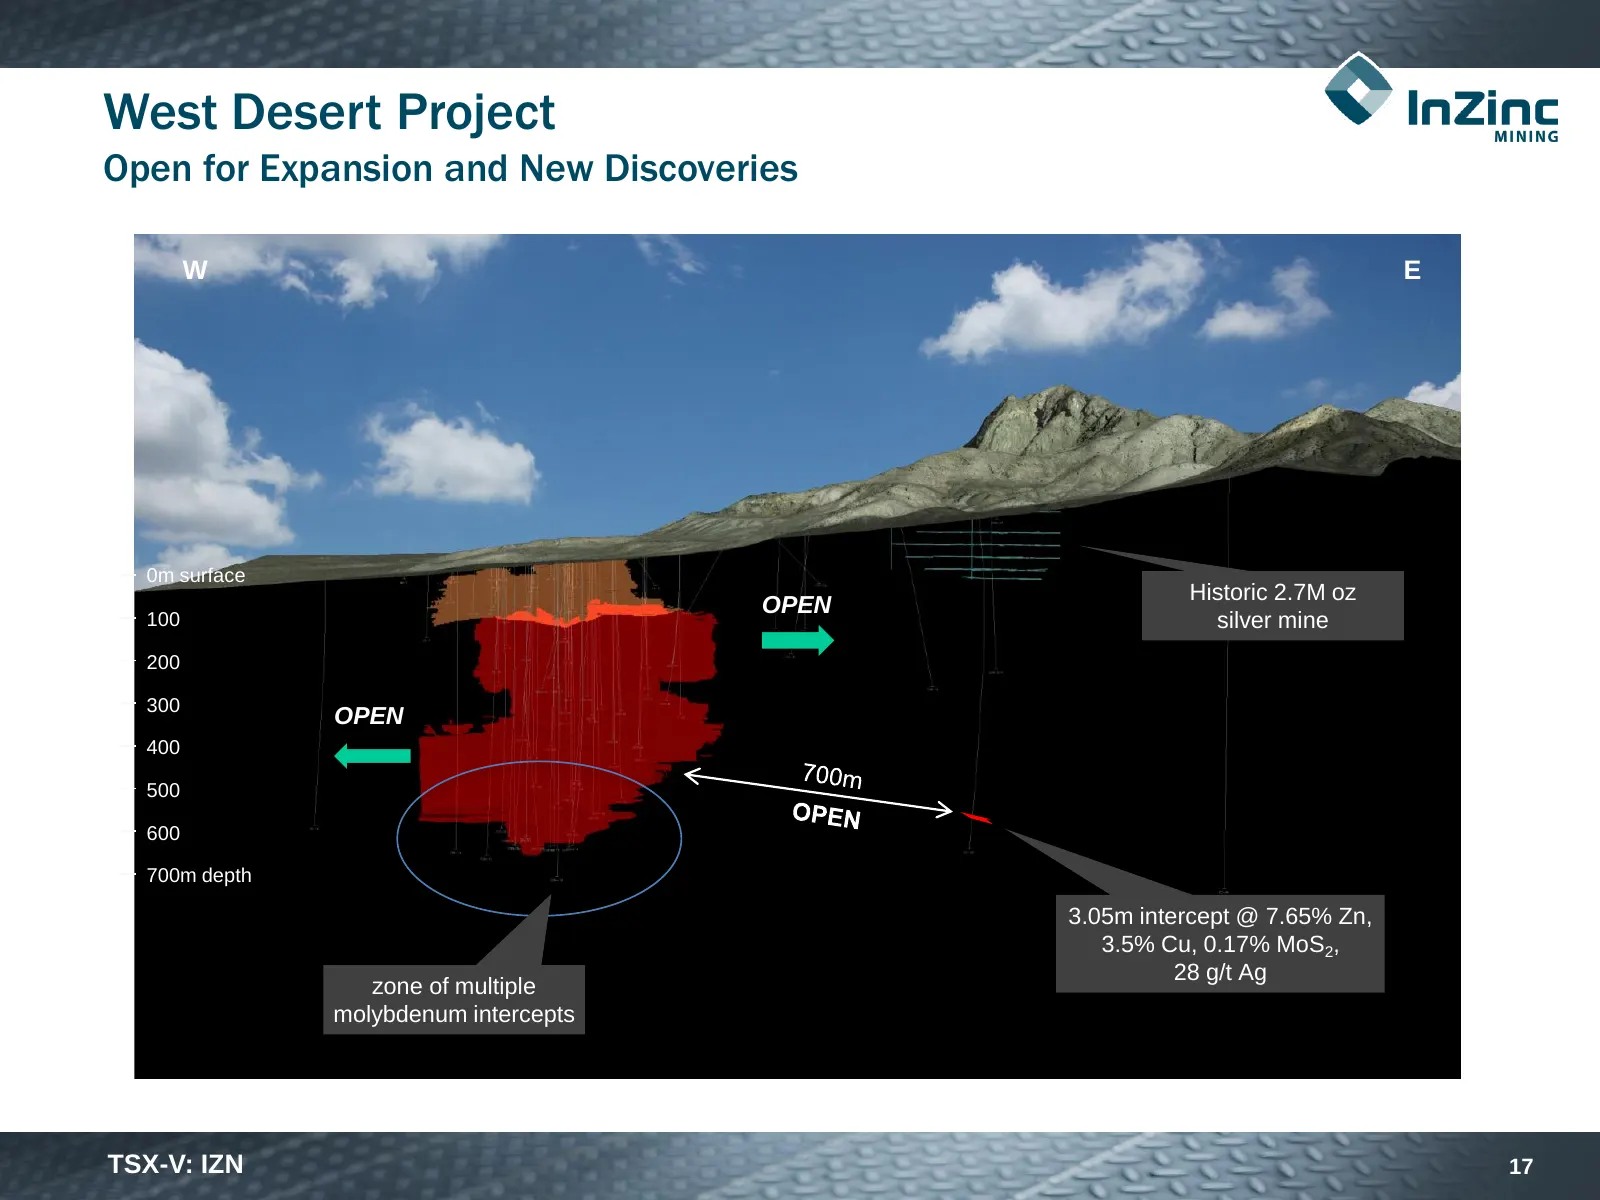
Slide 17: Open for Expansion and New Discoveries
West Desert Project Open for Expansion and New Discoveries W E 0m surface Historic 2.7M oz OPEN 100 silver mine 200 300 OPEN 400 500 600 700m depth 3.05m intercept @ 7.65% Zn, 3.5% Cu, 0.17% MoS2, 28 g/t Ag zone of multiple molybdenum intercepts TSX-V: IZN 17
Slide 18: Next Steps: Continuing to Build Value
West Desert Project Next Steps: Continuing to Build Value Pre-feasibility study to commence with drilling o Phase 1 infill drilling to upgrade resource classification o Phase 2 infill and expansion drilling Additional objectives o Baseline studies for permitting o Build on favourable initial met
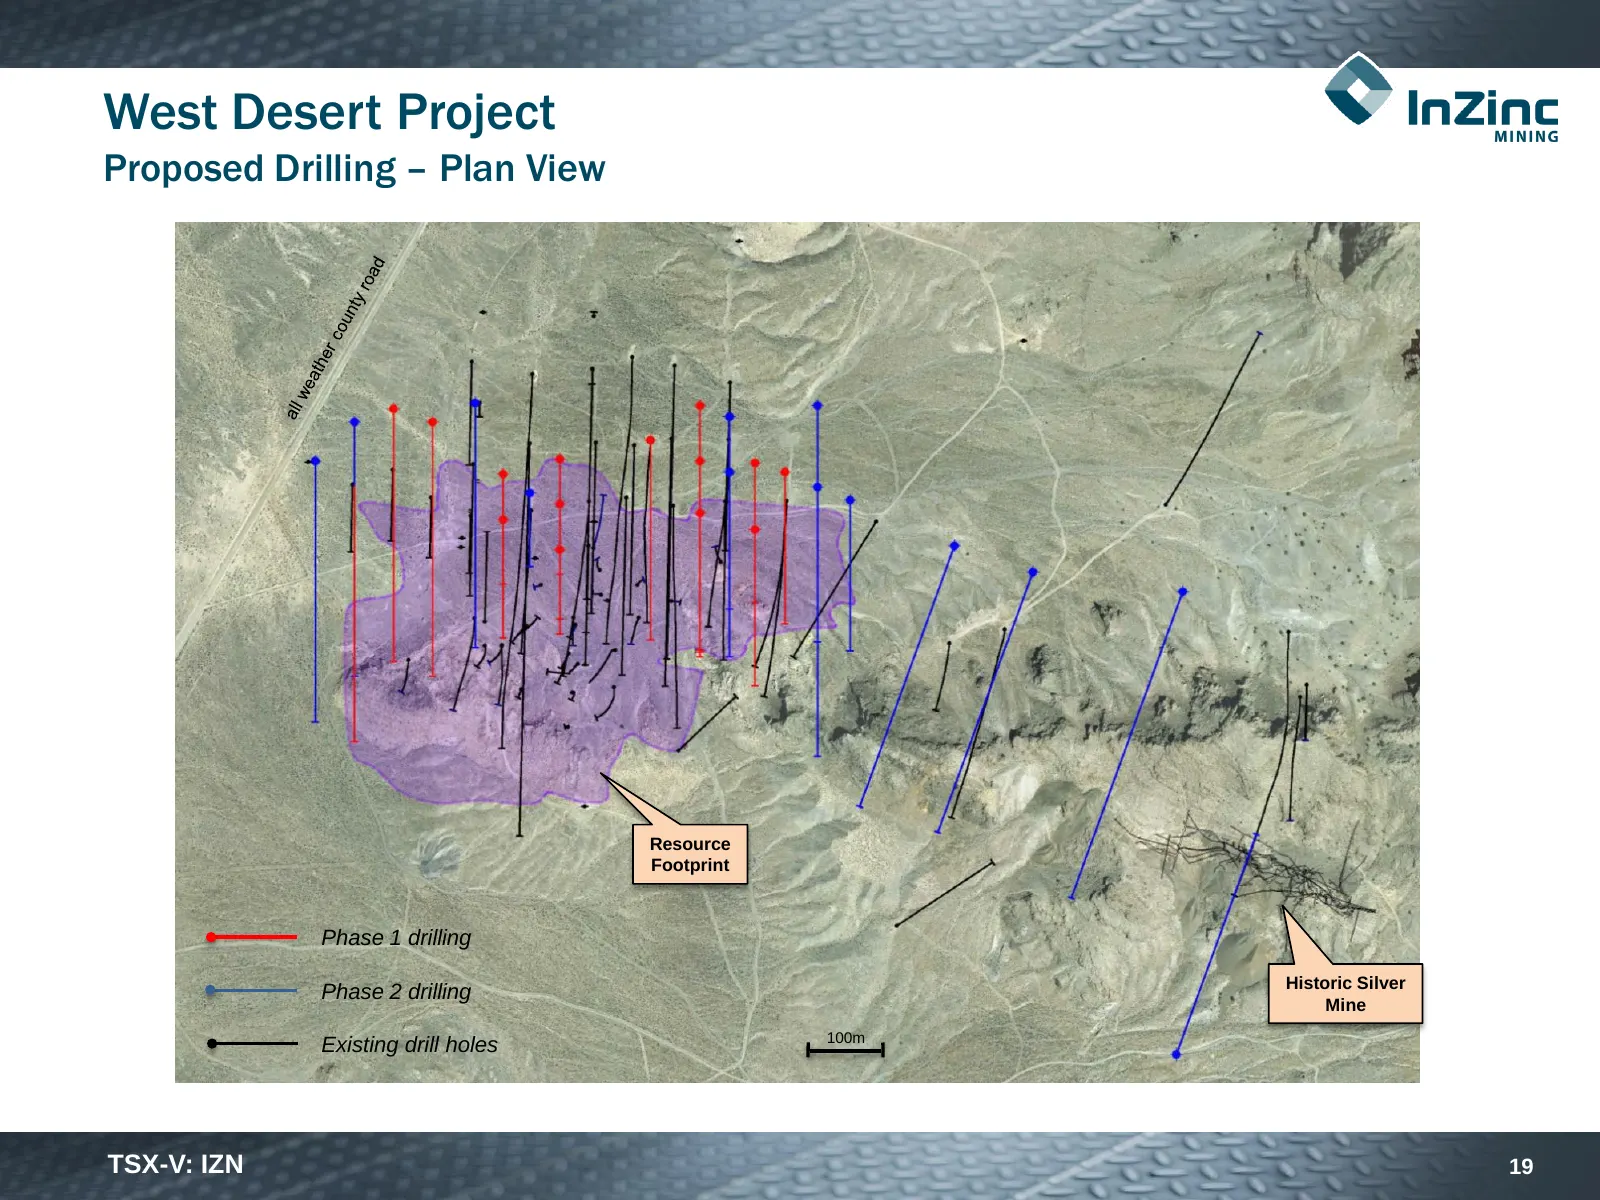
Slide 19: Proposed Drilling – Plan View
West Desert Project Proposed Drilling – Plan View Resource Footprint Phase 1 drilling Historic Silver Phase 2 drilling Mine 100m Existing drill holes TSX-V: IZN 19
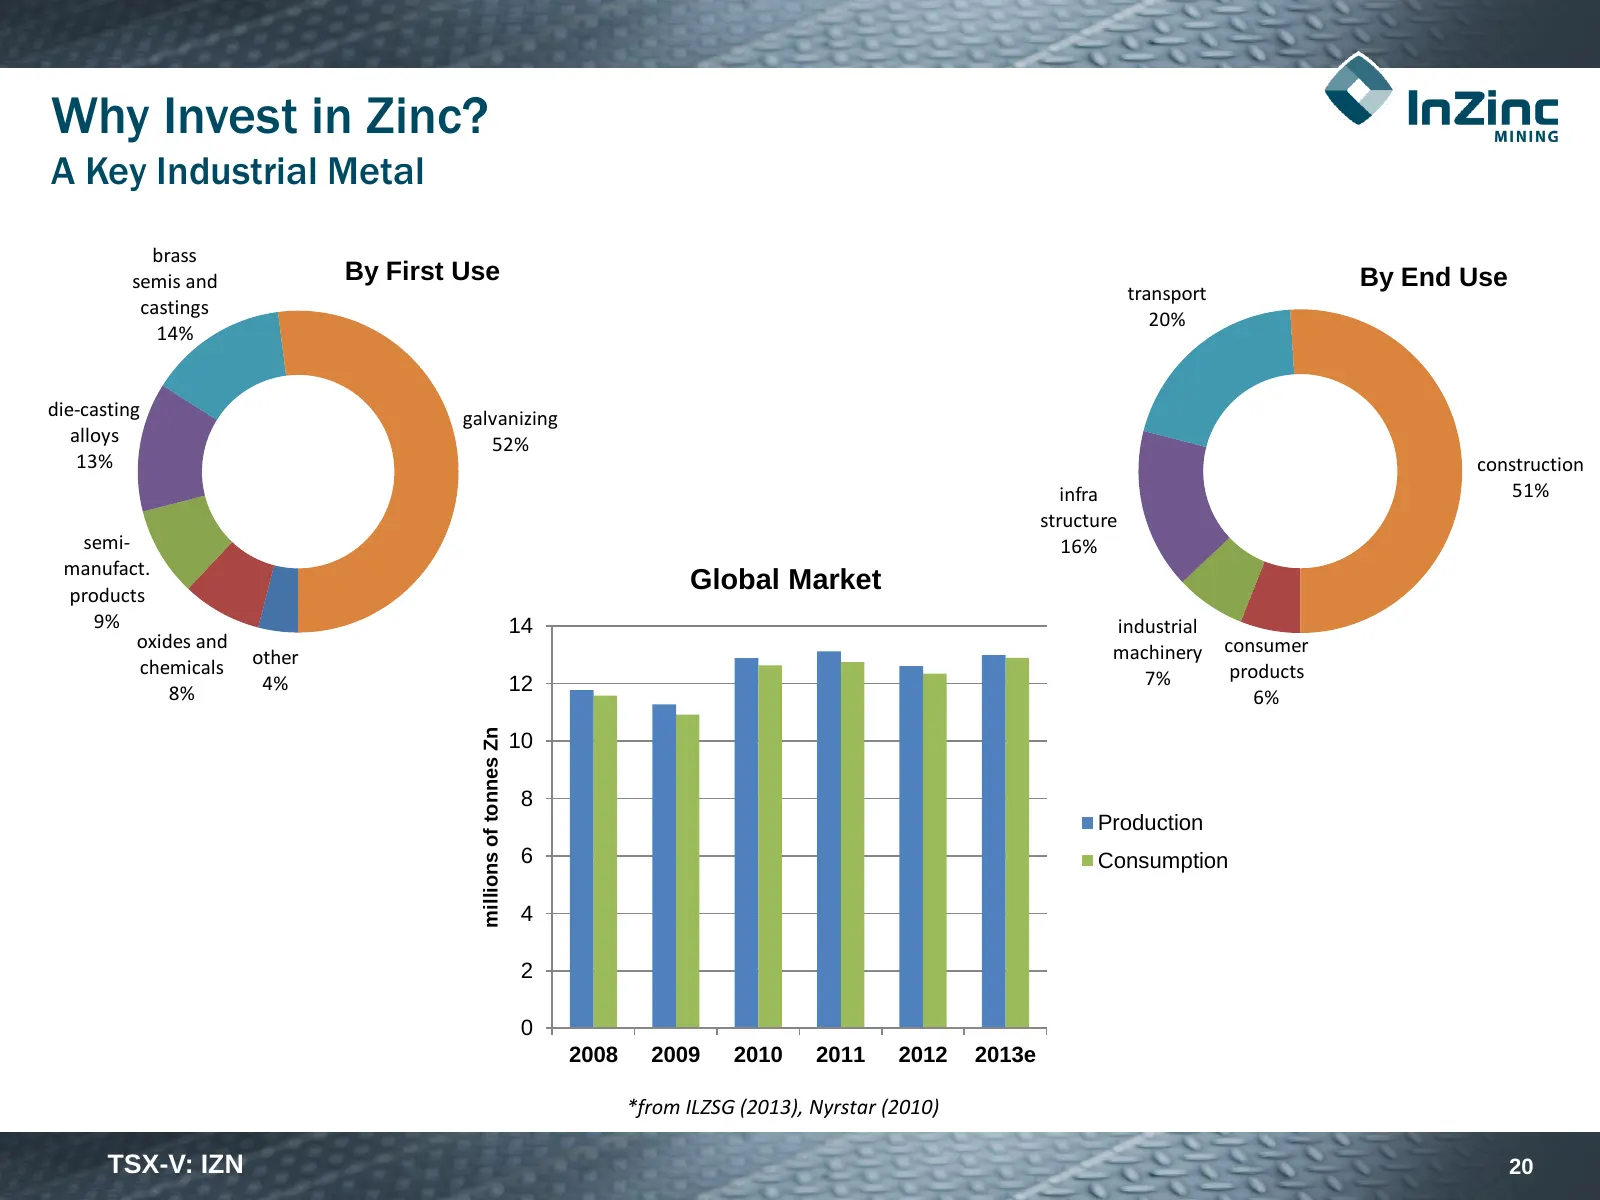
Slide 20: Why Invest in Zinc?
Why Invest in Zinc? A Key Industrial Metal brass semis and By First Use By End Use transport castings 20% 14% die-casting galvanizing alloys 52% 13% construction infra 51% structure semi- 16% manufact. products Global Market 9% 14 industrial oxides and consumer other machinery chemicals products 4%
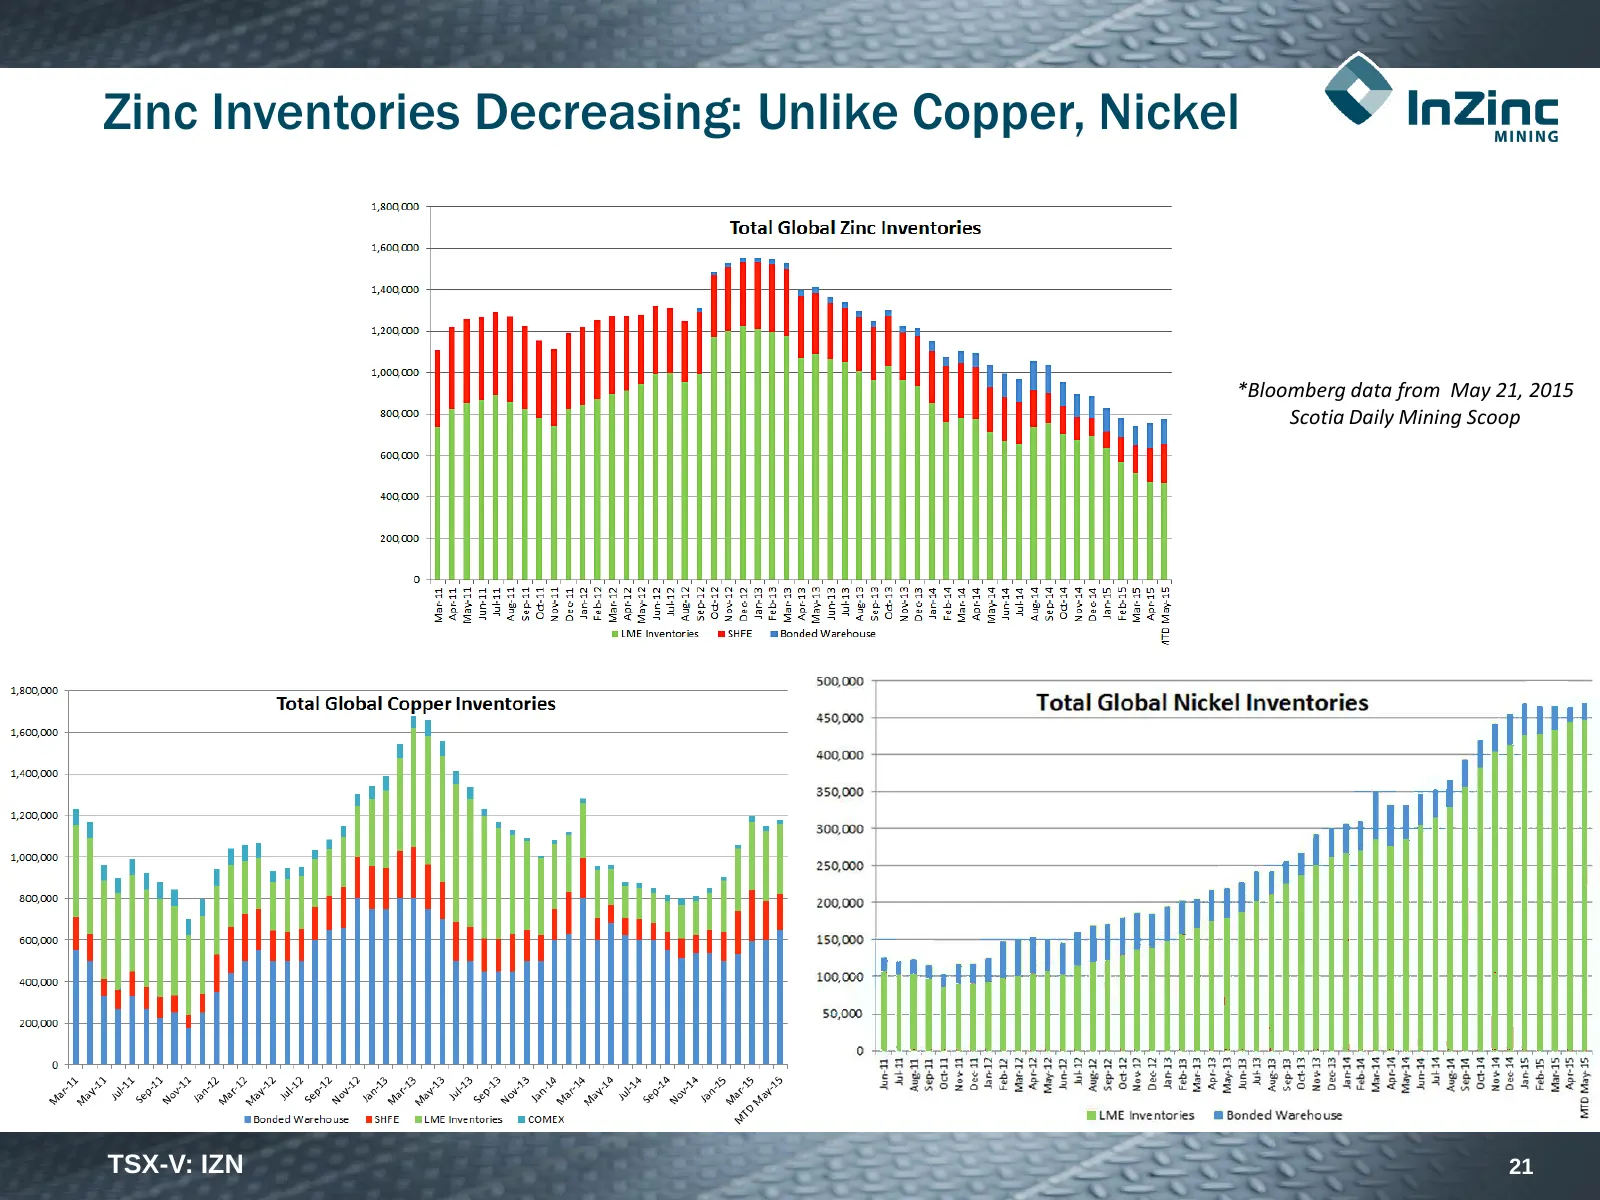
Slide 21: Zinc Inventories Decreasing: Unlike Copper, Nickel
Zinc Inventories Decreasing: Unlike Copper, Nickel *Bloomberg data from May 21, 2015 Scotia Daily Mining Scoop TSX-V: IZN 21
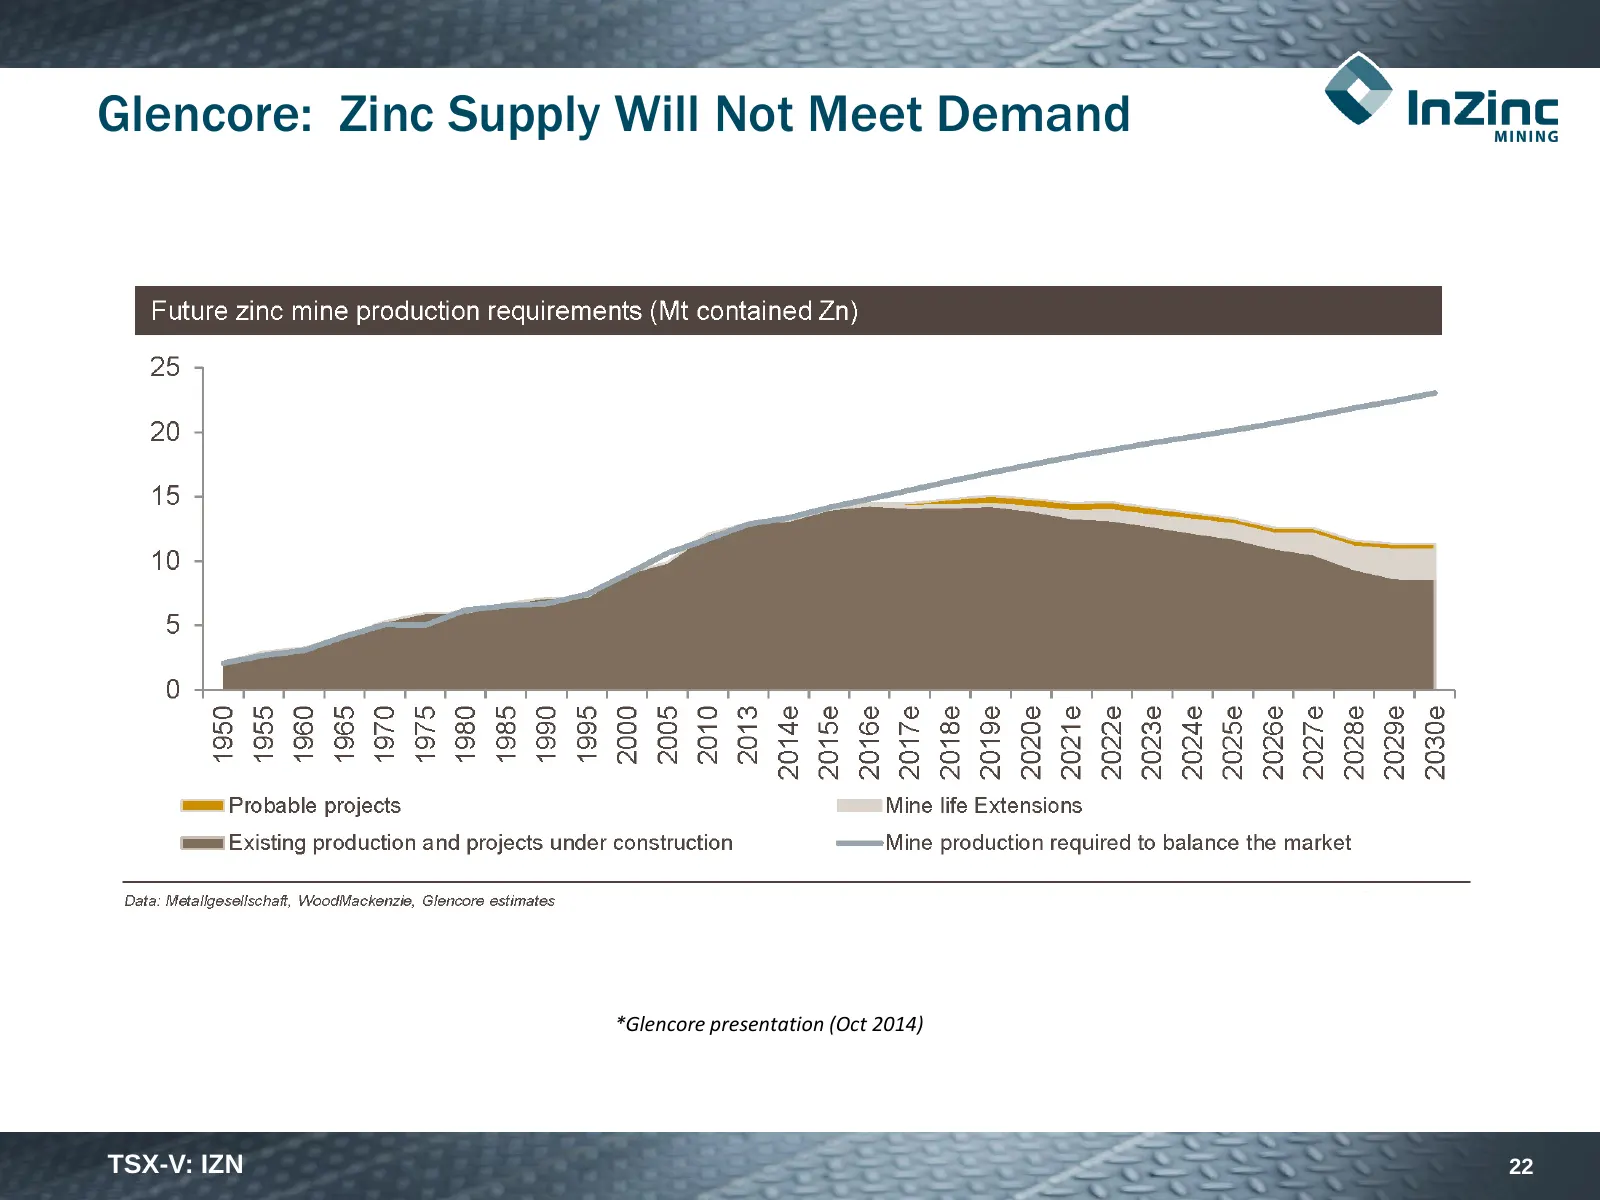
Slide 22: Glencore: Zinc Supply Will Not Meet Demand
Glencore: Zinc Supply Will Not Meet Demand *Glencore presentation (Oct 2014) TSX-V: IZN 22
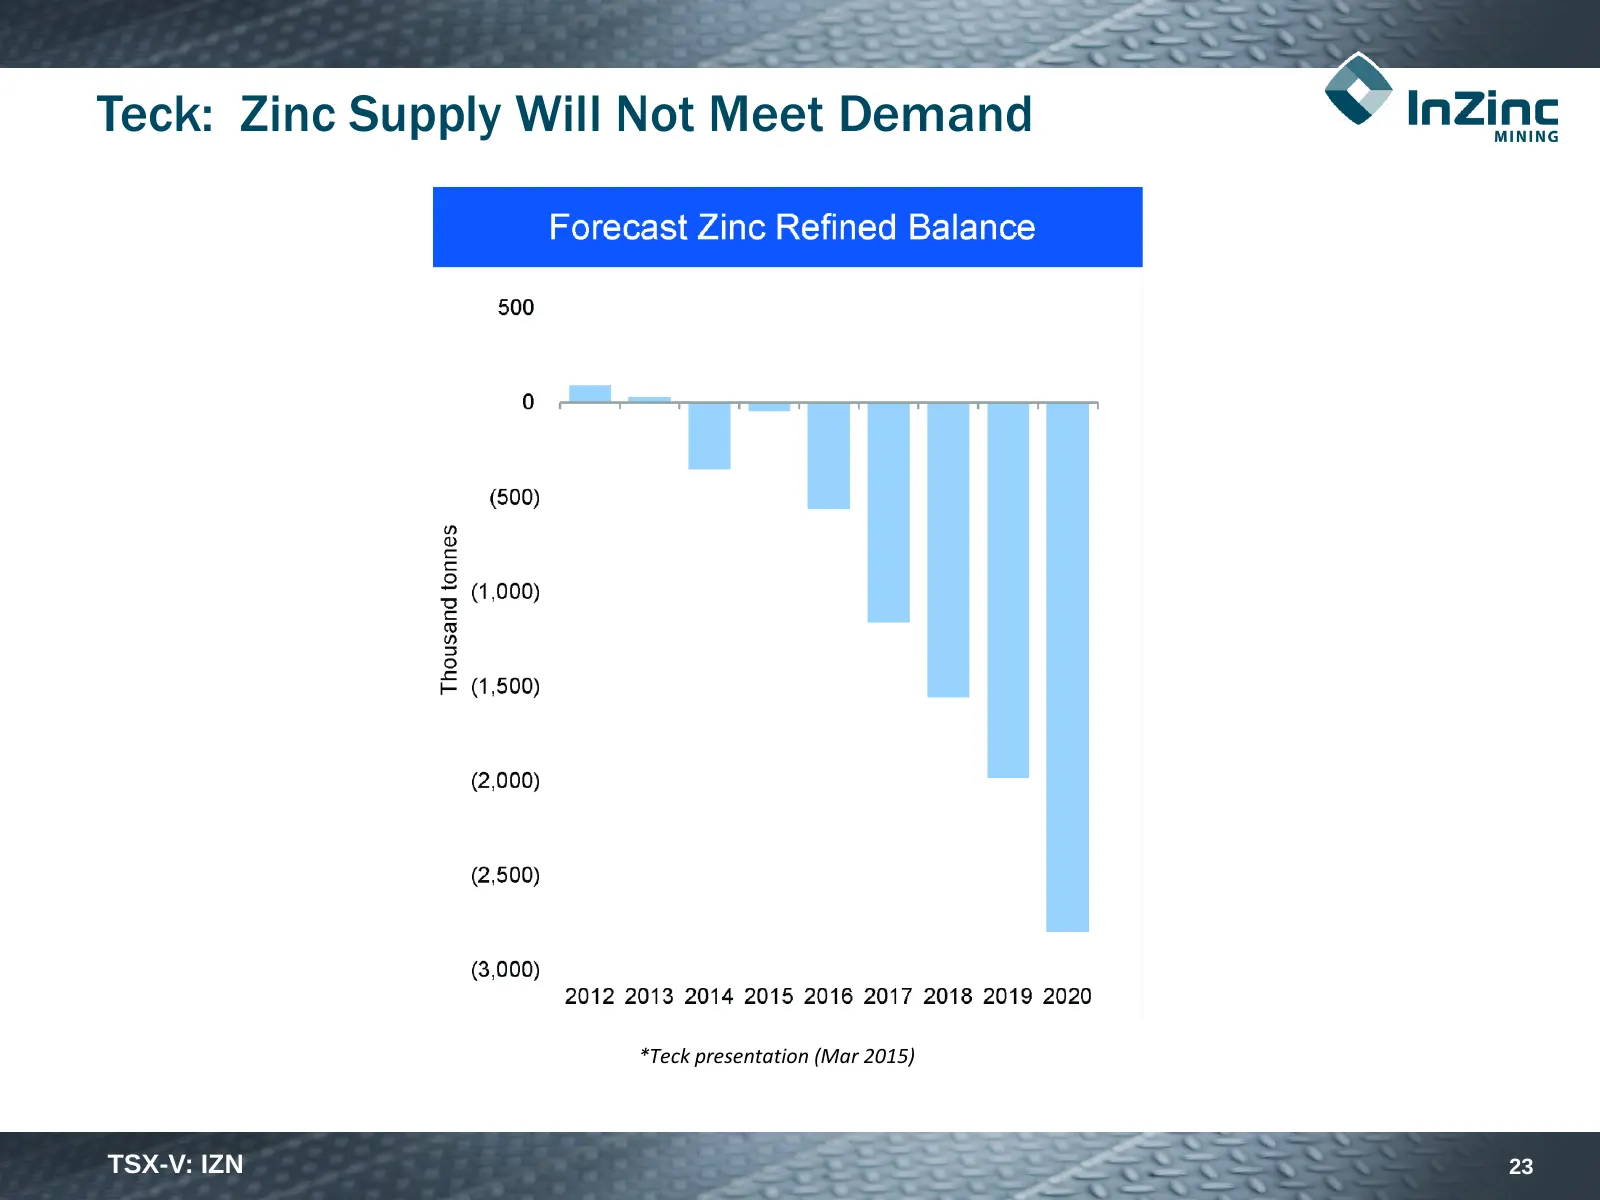
Slide 23: Teck: Zinc Supply Will Not Meet Demand
Teck: Zinc Supply Will Not Meet Demand *Teck presentation (Mar 2015) TSX-V: IZN 23
Slide 24: InZinc Mining: An Emerging Low-Cost Mid-Tier Zinc Producer
InZinc Mining An Emerging Low-Cost Mid-Tier Zinc Producer Mid-tier zinc production potential Important byproduct iron, copper and indium Very favorable location resulting in lower capital requirement and straightforward permitting One of the lowest cost potential producers One of the highe
Slide 25: InZinc Mining Ltd. Contact Information
InZinc Mining Ltd. 912 – 510 West Hastings Street Vancouver, BC Canada V6B 1L8 (604) 687-7211 For further information contact: Joyce Musial, Corporate Communications (604) 317-2728 www.inzincmining.com
Source: Internet Archive copy of inzincmining.com
More decks from InZinc Mining Ltd.
 Investor Presentation (November 2026)27 slides · November 2026
 Corporate Update (August 2026)24 slides · August 2026
 Investor Presentation (May 2026)30 slides · May 2026
 Investor Presentation (September 2025)28 slides · September 2025
 Investor Presentation (June 2024)22 slides · June 2024
 Investor Presentation (July 2022)22 slides · July 2022