William Lyon Homes — Q1 2018 Earnings Presentation
17 slides from William Lyon Homes's earnings presentation, May 8, 2018

Slide 1: Q1 2018 Earnings Call
Board of Directors Meeting Q3 2018 2018 Q1 Earnings Call May 8, 2018, 9:00 am PT Exhibit 99.2
Slide 2: Forward Looking Statements and Non-GAAP Information
Forward Looking Statements and Non-GAAP Information Certain statements contained in this presentation, in the Company’s press release and the accompanying comments during our conference call that are not historical information may constitute “forward-looking statements” as defined by the Private Sec
Slide 3: Management Presenters
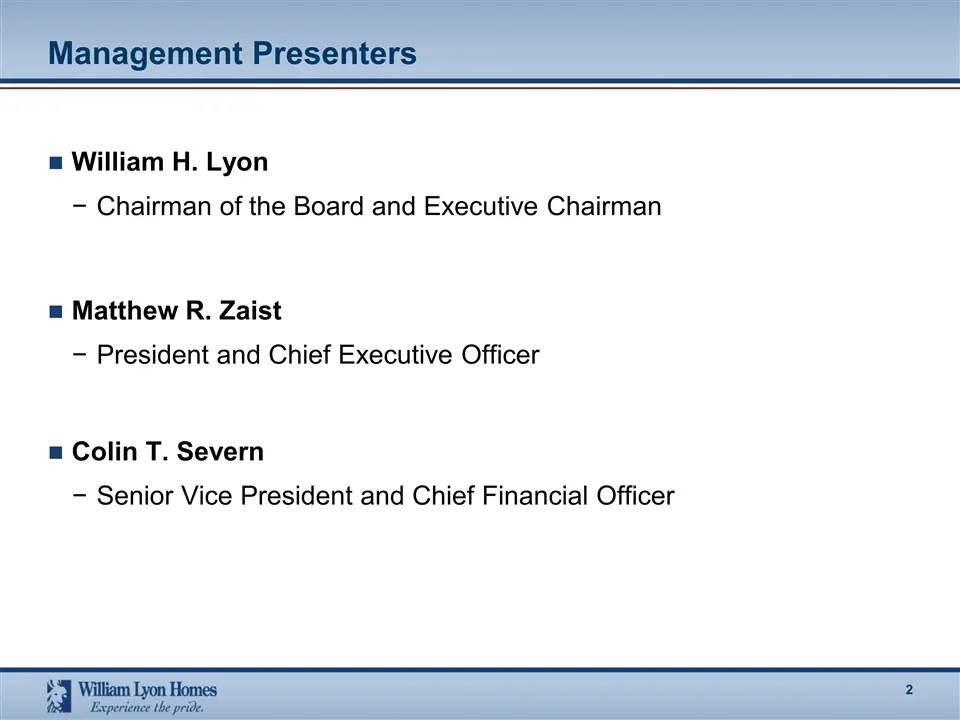
Management Presenters William H. Lyon Chairman of the Board and Executive Chairman Matthew R. Zaist President and Chief Executive Officer Colin T. Severn Senior Vice President and Chief Financial Officer
Slide 4: 2018 Sales Volume – Actual vs. Prior Year
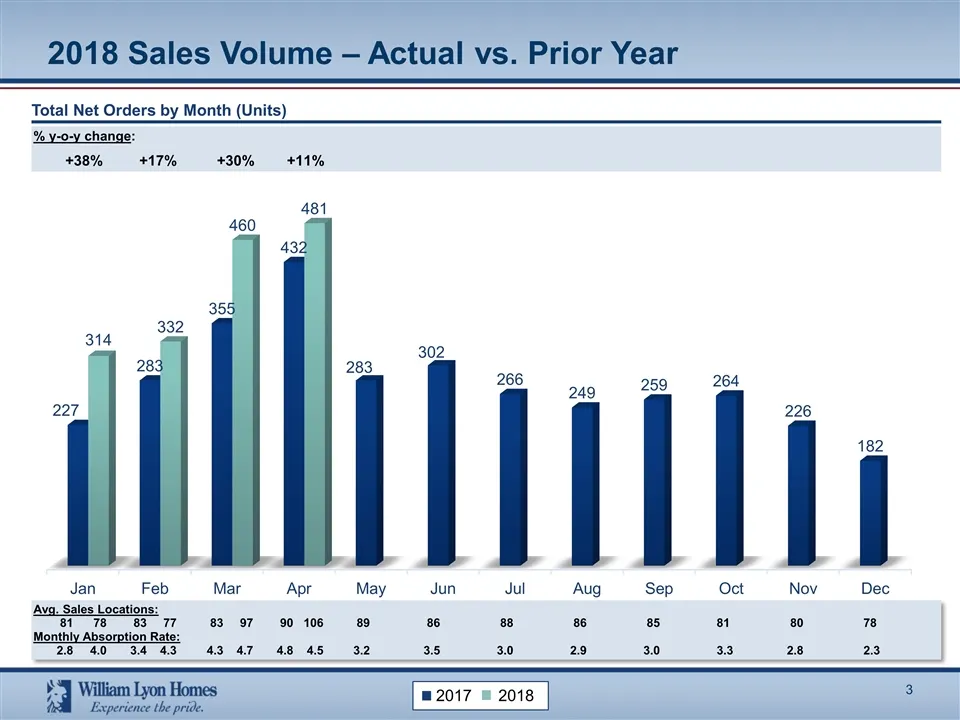
2018 Sales Volume – Actual vs. Prior Year Total Net Orders by Month (Units) % y-o-y change: +38% +17% +30% +11% Avg. Sales Locations: 81 78 83 77 83 97 90 106 89 86 88 86 85 81 80 78 Monthly Absorption Rate: 2.8 4.0 3.4 4.3 4.3 4.7 4.8 4.5 3.2 3.5 3.0 2.9 3.0 3.3 2.8 2.3 2017 2018
Slide 5: Year over Year Comparisons
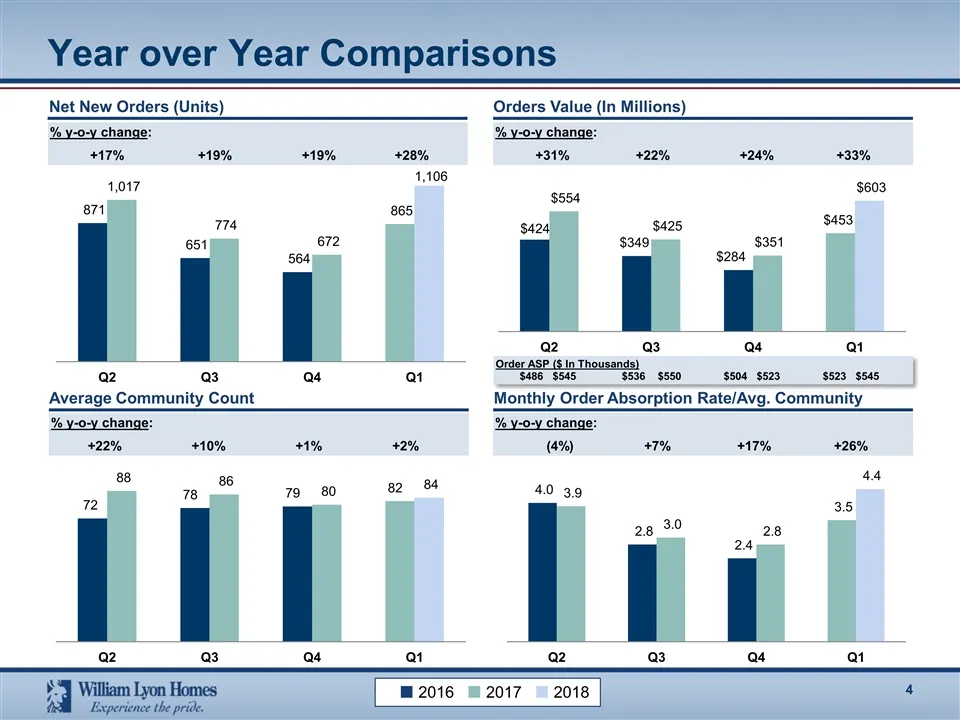
Year over Year Comparisons % y-o-y change: +17% +19% +19% +28% % y-o-y change: +22% +10% +1% +2% % y-o-y change: (4%) +7% +17% +26% Net New Orders (Units) Orders Value (In Millions) Average Community Count Monthly Order Absorption Rate/Avg. Community % y-o-y change: +31% +22% +24% +33% Order ASP ($
Slide 6: Year over Year Comparisons (continued)
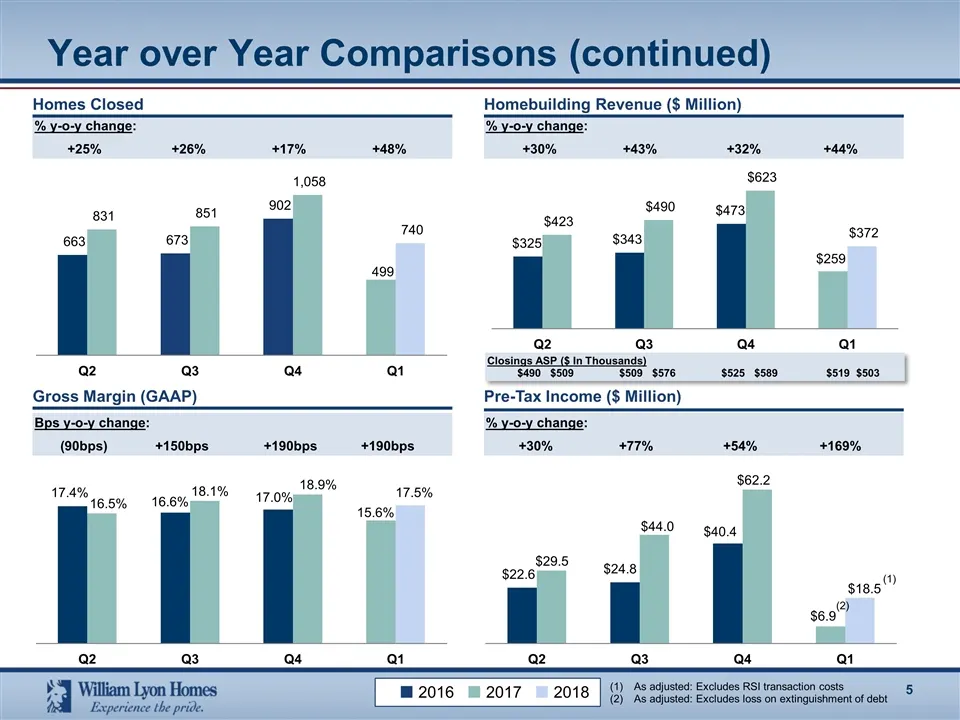
% y-o-y change: +30% +43% +32% +44% Year over Year Comparisons (continued) % y-o-y change: +25% +26% +17% +48% Homes Closed Homebuilding Revenue ($ Million) Bps y-o-y change: (90bps) +150bps +190bps +190bps % y-o-y change: +30% +77% +54% +169% Gross Margin (GAAP) Pre-Tax Income ($ Million) Closings
Slide 7: Q1 2018 Summary Results
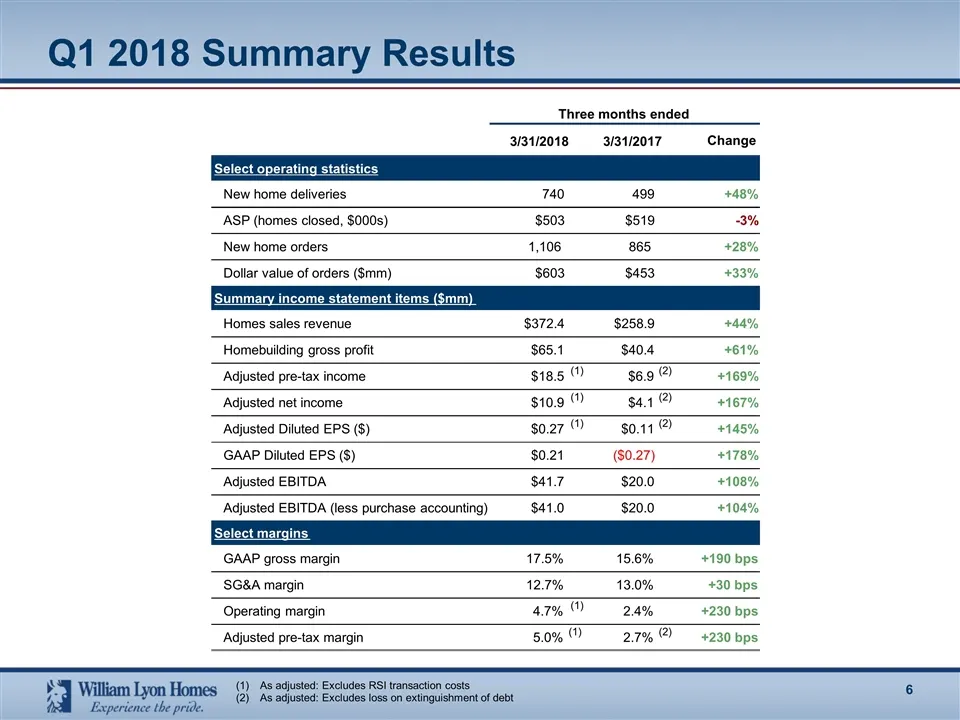
Q1 2018 Summary Results As adjusted: Excludes RSI transaction costs As adjusted: Excludes loss on extinguishment of debt Change Select operating statistics New home deliveries 740 499 +48% ASP (homes closed, $000s) $503 $519 -3% New home orders 1,106 865 +28% Dollar value of orders ($mm) $603 $453 +
Slide 8: Backlog Growth – Year over Year
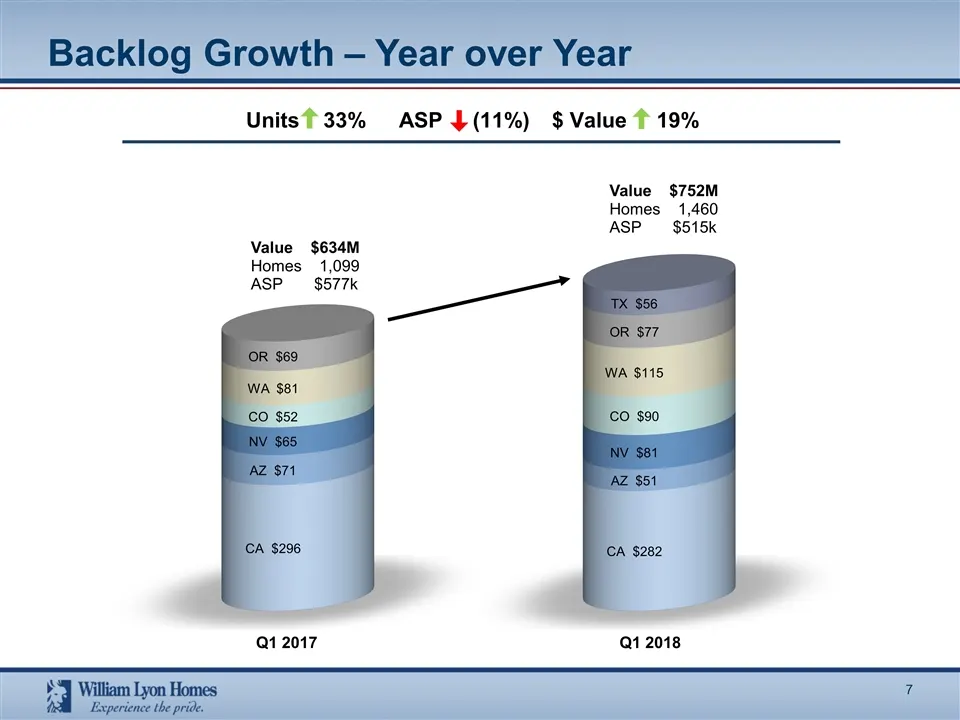
Backlog Growth – Year over Year Q1 2017 Value $752M Homes 1,460 ASP $515k Units 33%ASP (11%)$ Value 19% Q1 2018 Value $634M Homes 1,099 ASP $577k
Slide 9: Backlog Conversion Rate
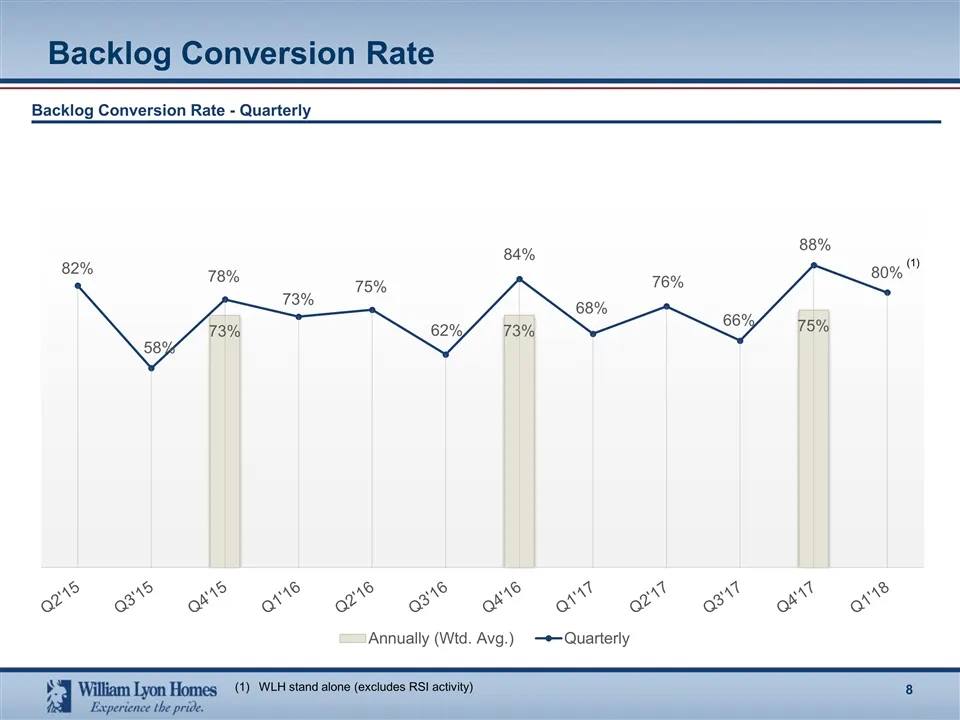
Backlog Conversion Rate Backlog Conversion Rate - Quarterly (1) WLH stand alone (excludes RSI activity)
Slide 10: Buyer Type Segmentation
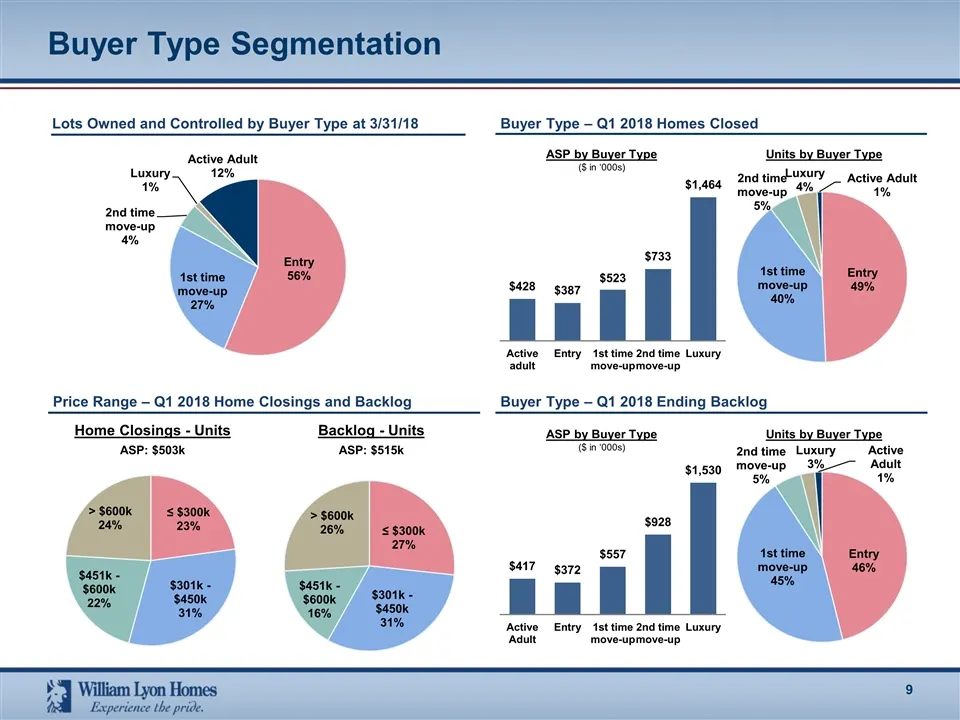
ASP by Buyer Type ($ in ‘000s) Units by Buyer Type Buyer Type Segmentation Buyer Type – Q1 2018 Homes Closed Price Range – Q1 2018 Home Closings and Backlog Home Closings - Units Backlog - Units ASP: $503k ASP: $515k Buyer Type – Q1 2018 Ending Backlog ASP by Buyer Type ($ in ‘000s) Units by Buyer T
Slide 11: Strong New Order Growth – Dollars Trailing Twelve Months
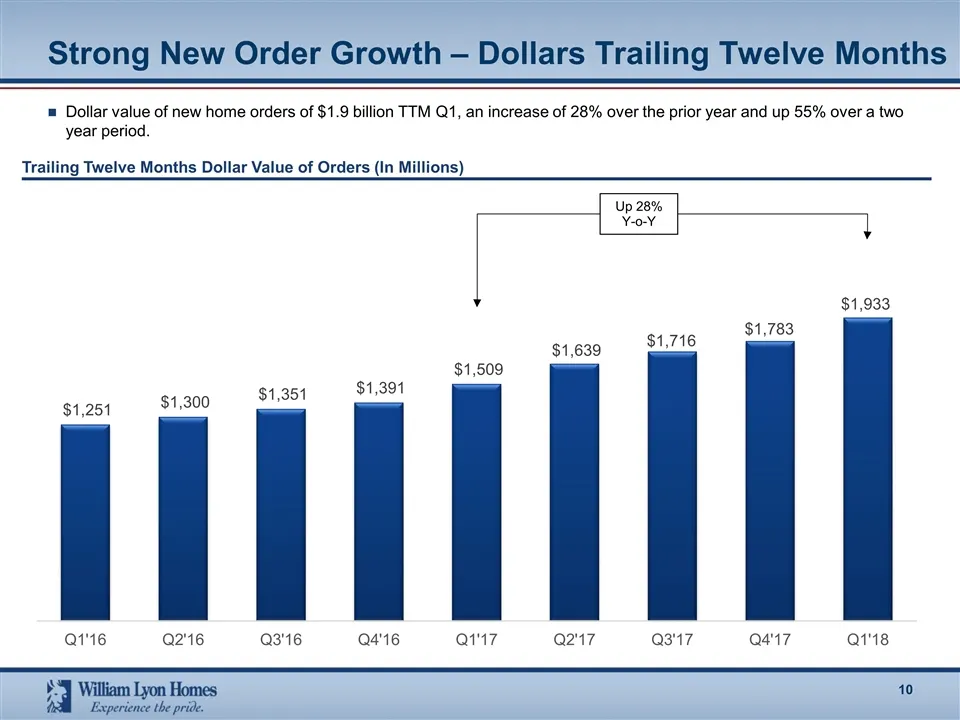
Strong New Order Growth – Dollars Trailing Twelve Months Dollar value of new home orders of $1.9 billion TTM Q1, an increase of 28% over the prior year and up 55% over a two year period. Up 28% Y-o-Y Trailing Twelve Months Dollar Value of Orders (In Millions)
Slide 12: Growth and Operating Leverage – Trailing Twelve Months
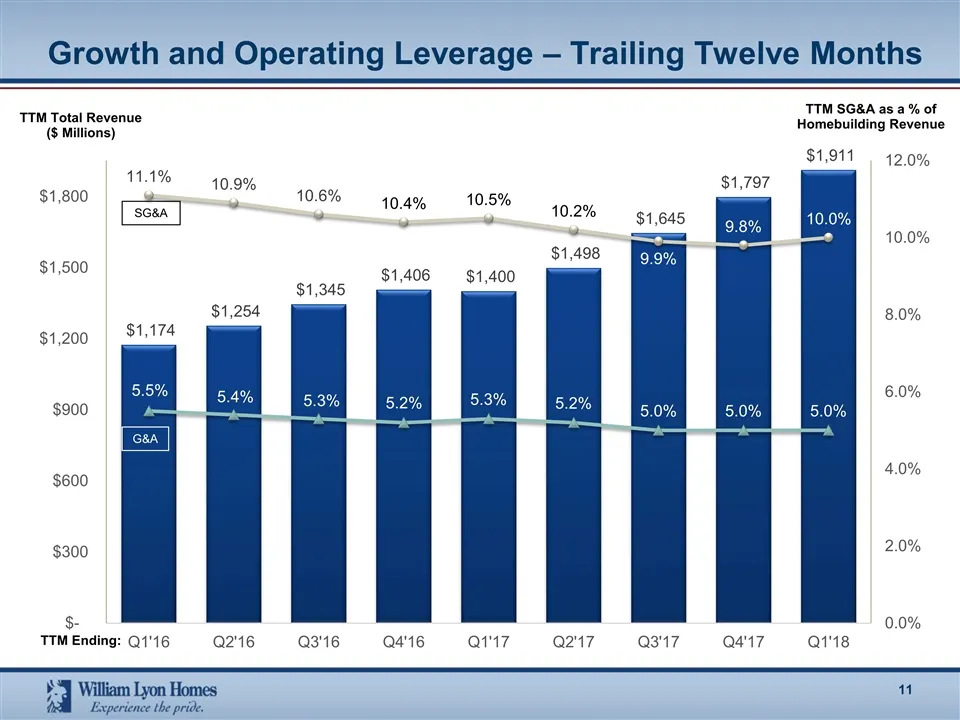
Growth and Operating Leverage – Trailing Twelve Months TTM Total Revenue ($ Millions) TTM Ending: TTM SG&A as a % of Homebuilding Revenue SG&A G&A
Slide 13: Continued Growth and Diversification Through Monetization of Land Positions
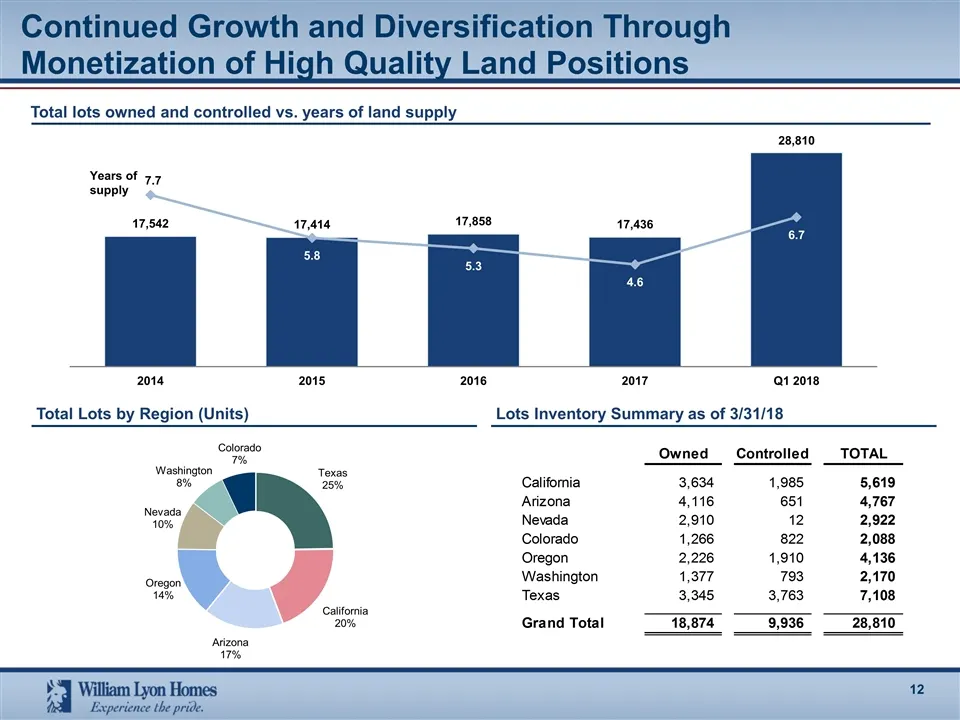
Continued Growth and Diversification Through Monetization of High Quality Land Positions Total Lots by Region (Units) Lots Inventory Summary as of 3/31/18 Total lots owned and controlled vs. years of land supply
Slide 14: Ay ies Leen Hone
Ay ies Leen Hone xe the pride.
Slide 15: Adjusted EBITDA
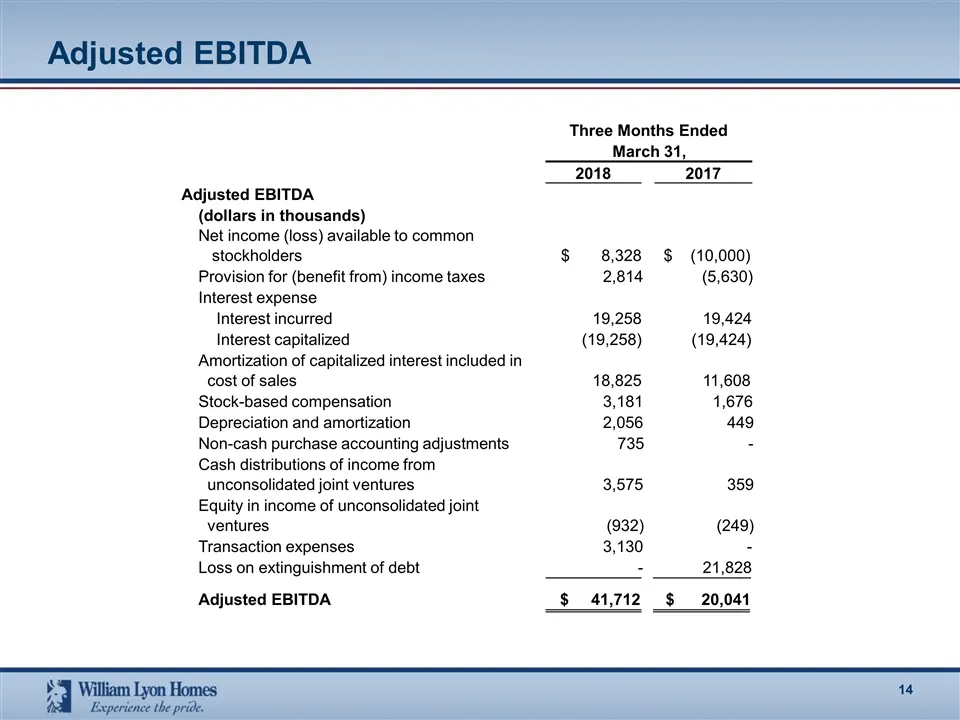
Adjusted EBITDA 2018 2017 (dollars in thousands) Net income (loss) available to common stockholders $ 8,328 $ (10,000) Provision for (benefit from) income taxes 2,814 (5,630) Interest expense aa Interest incurred 19,258 19,424 aa Interest capitalized (19,258) (19,424) Amortization of capitalized int
Slide 16: Adjusted Pre-Tax Income
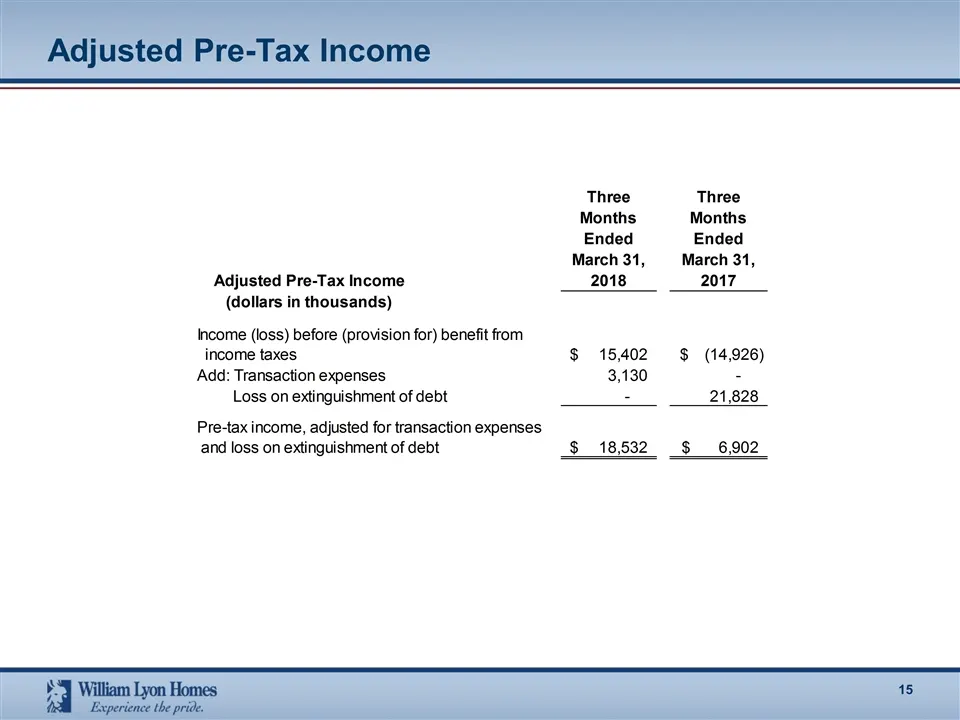
Three Three Months Months Ended Ended March 31, March 31, Adjusted Pre-Tax Income 2018 2017 (dollars in thousands) Income (loss) before (provision for) benefit from income taxes $ 15,402 $ (14,926) Add: Transaction expenses 3,130 - Li fingui : 21,828 Pre-tax i justed for i and loss on extinguishment
Slide 17: Adjusted Net Income and Adjusted Diluted EPS
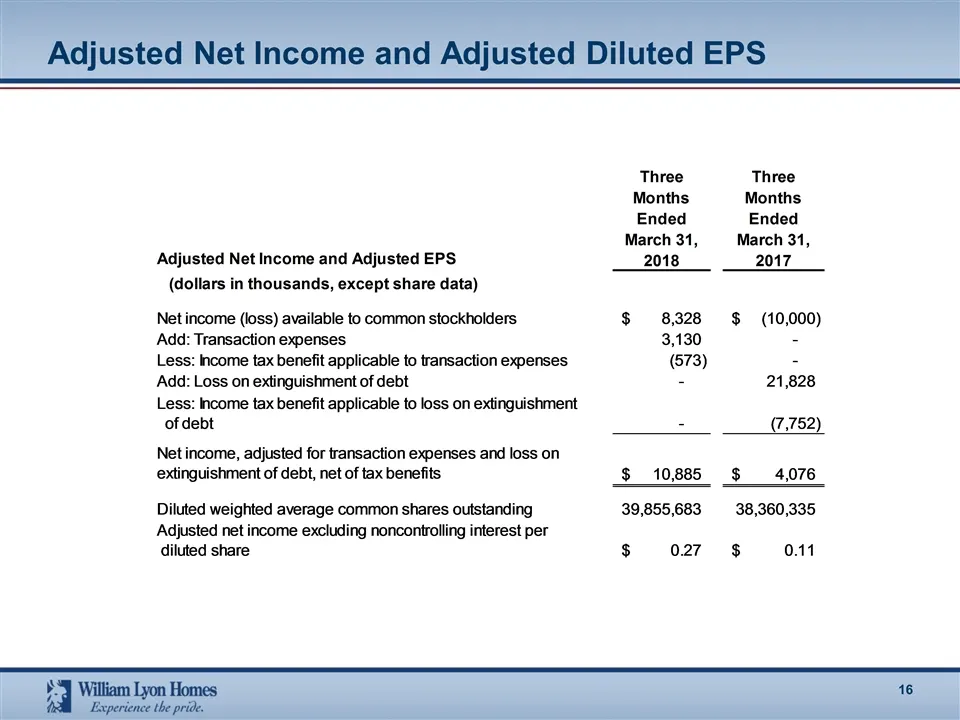
Adjusted Net Income and Adjusted Diluted EPS
Source: SEC EDGAR · 8-K filed May 8, 2018
More decks from William Lyon Homes
 Merger or Acquisition (November 2019)18 slides · Nov 6, 2019
 Q2 2019 Earnings Presentation15 slides · Aug 1, 2019
 Q1 2019 Earnings Presentation14 slides · May 2, 2019
 Q4 2018 Earnings Presentation18 slides · Feb 14, 2019
 Q3 2018 Earnings Presentation17 slides · Oct 30, 2018
 2018 Zelman Housing Summit31 slides · Sep 27, 2018