WashingtonFirst Bankshares Inc
WashingtonFirst Bankshares — Shareholder Meeting (April 2015)
23 slides from WashingtonFirst Bankshares's shareholder meeting presentation, Apr 29, 2015
Slide 1: Annual Shareholder Meeting April 29, 2015
NASDAQ: WFBI Annual Shareholder Meeting April 29, 2015 11:00 a.m. The Tower Club Tysons Corner, Virginia
Slide 2: Disclaimer
NASDAQ: WFBI Disclaimer WashingtonFirst Bankshares, Inc. and Subsidiary (the “Company”) make forward-looking statements in this presentation that are subject to risks and uncertainties. These forward-looking statements include: statements of goals, intentions, earnings expectations, and other expect
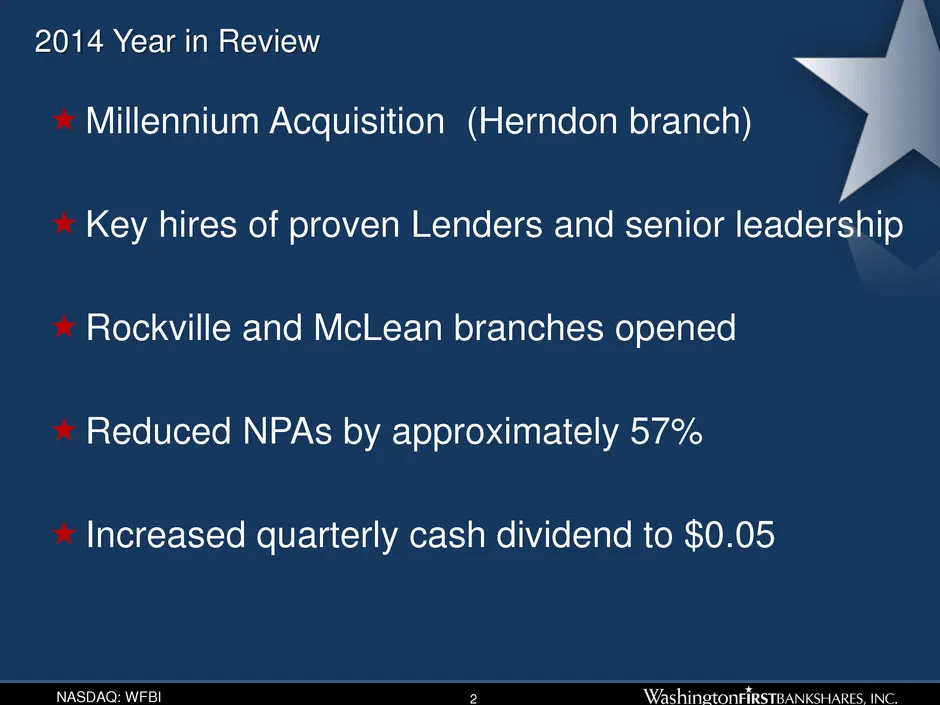
Slide 3: 2014 Year in Review
NASDAQ: WFBI 2014 Year in Review 2 Millennium Acquisition (Herndon branch) Key hires of proven Lenders and senior leadership Rockville and McLean branches opened Reduced NPAs by approximately 57% Increased quarterly cash dividend to $0.05
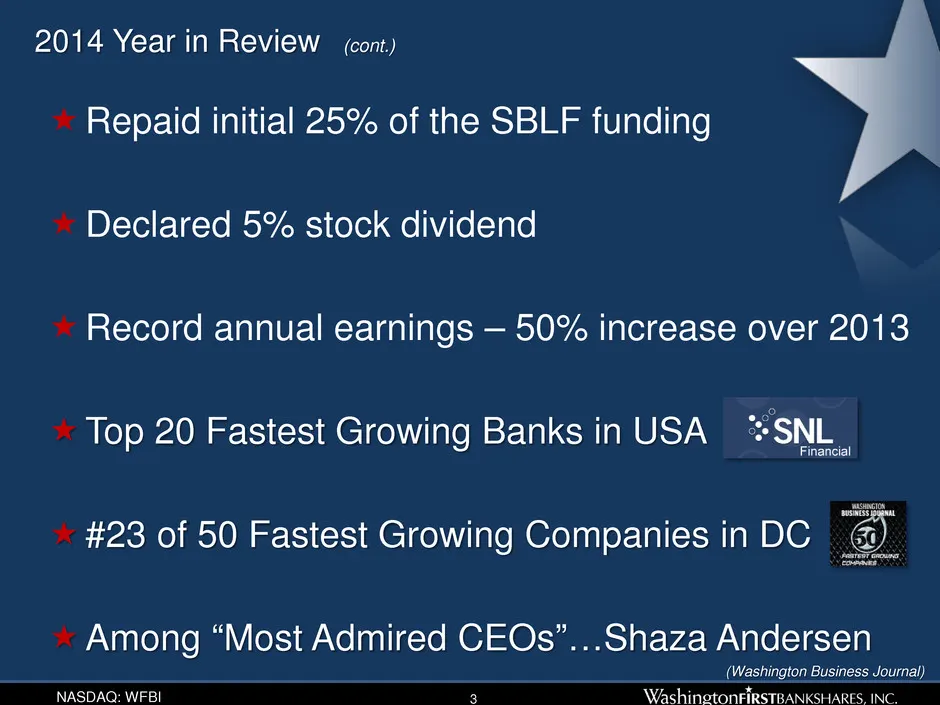
Slide 4: 2014 Year in Review (cont.)
NASDAQ: WFBI 2014 Year in Review (cont.) 3 Repaid initial 25% of the SBLF funding Declared 5% stock dividend Record annual earnings – 50% increase over 2013 Top 20 Fastest Growing Banks in USA #23 of 50 Fastest Growing Companies in DC Among “Most Admired CEOs”…Shaza Andersen (Washington Busine
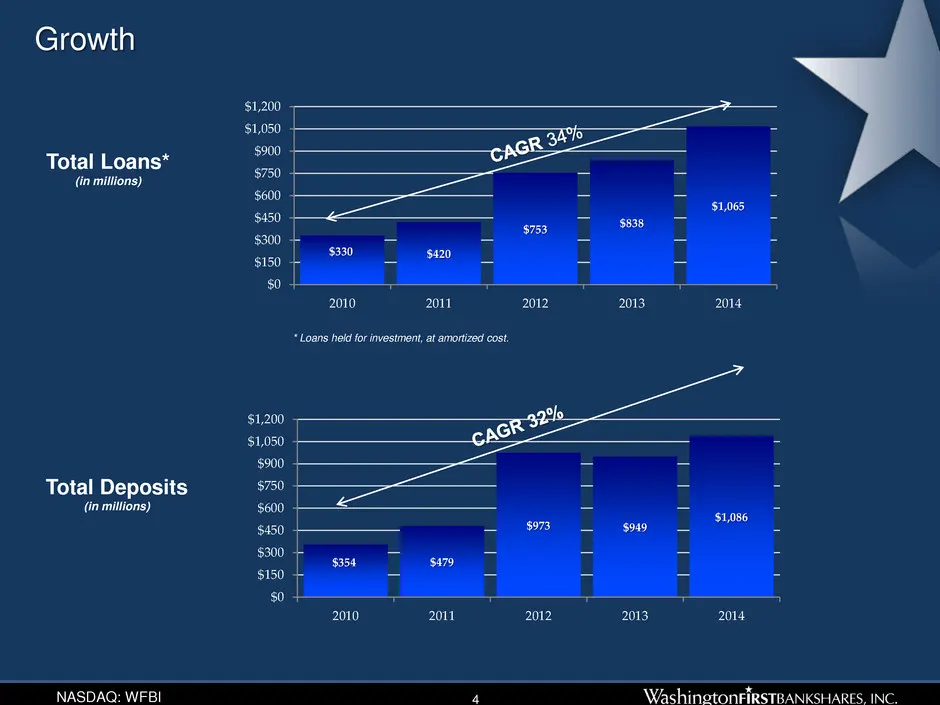
Slide 5: Growth: Total Deposits and Total Loans
NASDAQ: WFBI 4 Growth Total Deposits (in millions) Total Loans* (in millions) $330 $420 $753 $838 $1,065 $0 $150 $300 $450 $600 $750 $900 $1,050 $1,200 2010 2011 2012 2013 2014 * Loans held for investment, at amortized cost. $354 $479 $973 $949 $1,086 $0 $150 $300 $450 $600 $750 $900 $1,050 $1,200 2
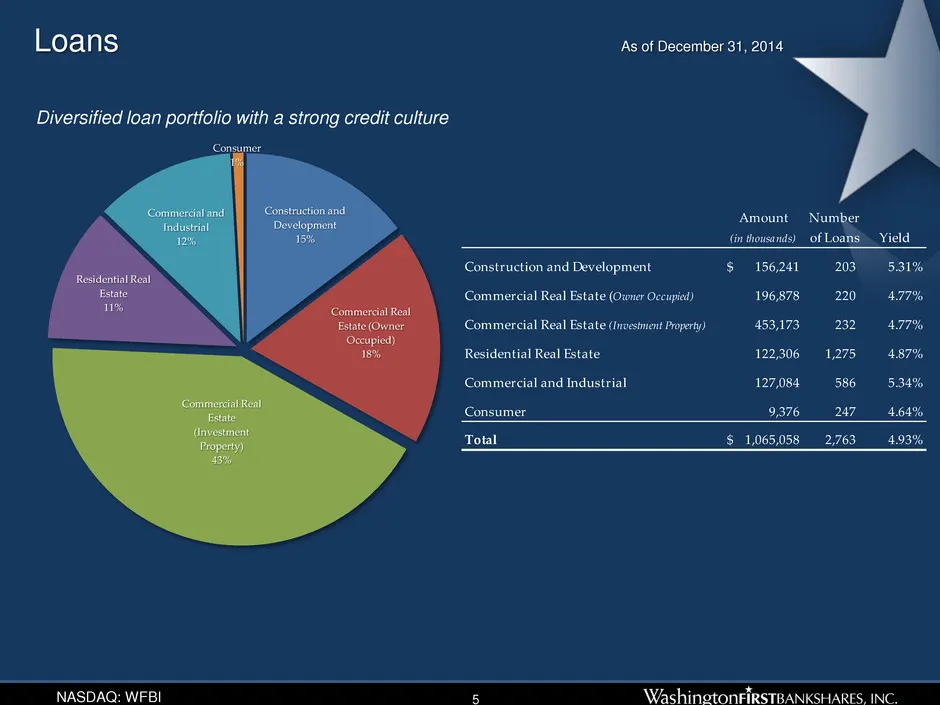
Slide 6: Loans
NASDAQ: WFBI 5 Loans As of December 31, 2014 Diversified loan portfolio with a strong credit culture Construction and Development 15% Commercial Real Estate (Owner Occupied) 18% Commercial Real Estate (Investment Property) 43% Residential Real Estate 11% Commercial and Industrial 12% Consumer 1% Amo
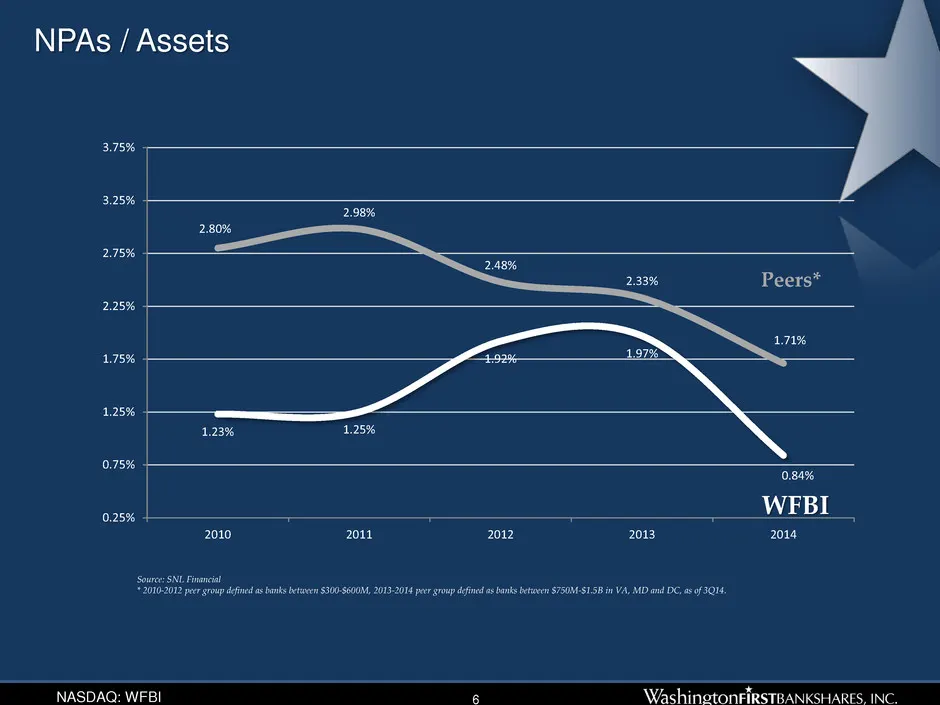
Slide 7: NPAs / Assets
NASDAQ: WFBI 6 NPAs / Assets 1.23% 1.25% 1.92% 1.97% 0.84% 2.80% 2.98% 2.48% 2.33% 1.71% 0.25% 0.75% 1.25% 1.75% 2.25% 2.75% 3.25% 3.75% 2010 2011 2012 2013 2014 WFBI Peers* Source: SNL Financial * 2010-2012 peer group defined as banks between $300-$600M, 2013-2014 peer group defined as banks betwee
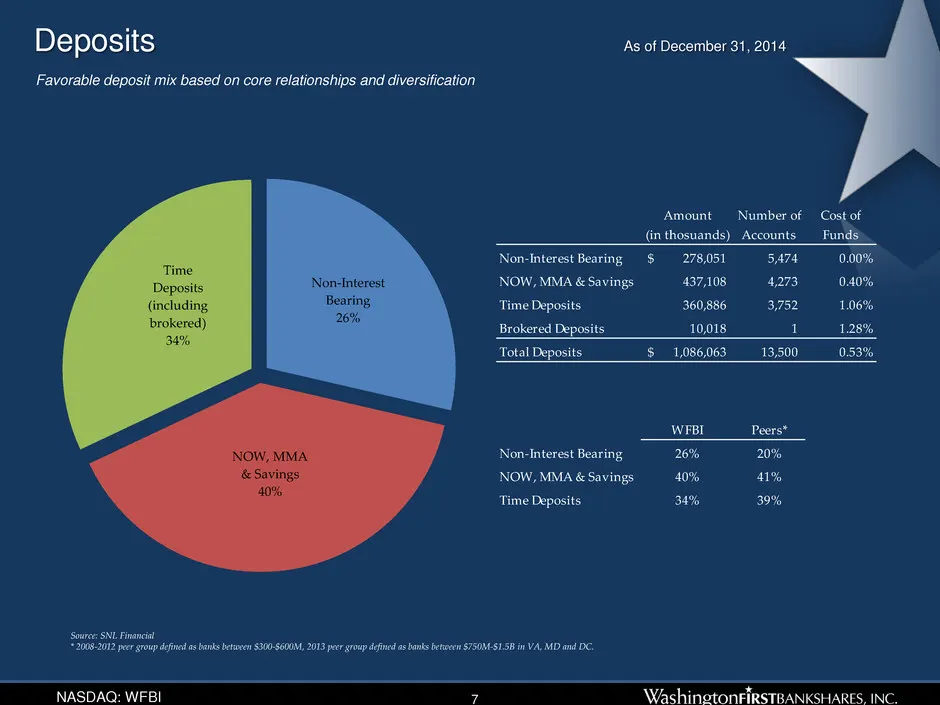
Slide 8: Deposits
NASDAQ: WFBI Non-Interest Bearing 26% NOW, MMA & Savings 40% Time Deposits (including brokered) 34% Amount Number of Cost of (in thosuands) Accounts Funds Non-Interest Bearing 278,051$ 5,474 0.00% NOW, MMA & Savings 437,108 4,273 0.40% Time Deposits 360,886 3,752 1.06% Brokered Deposits 10,018 1 1.2
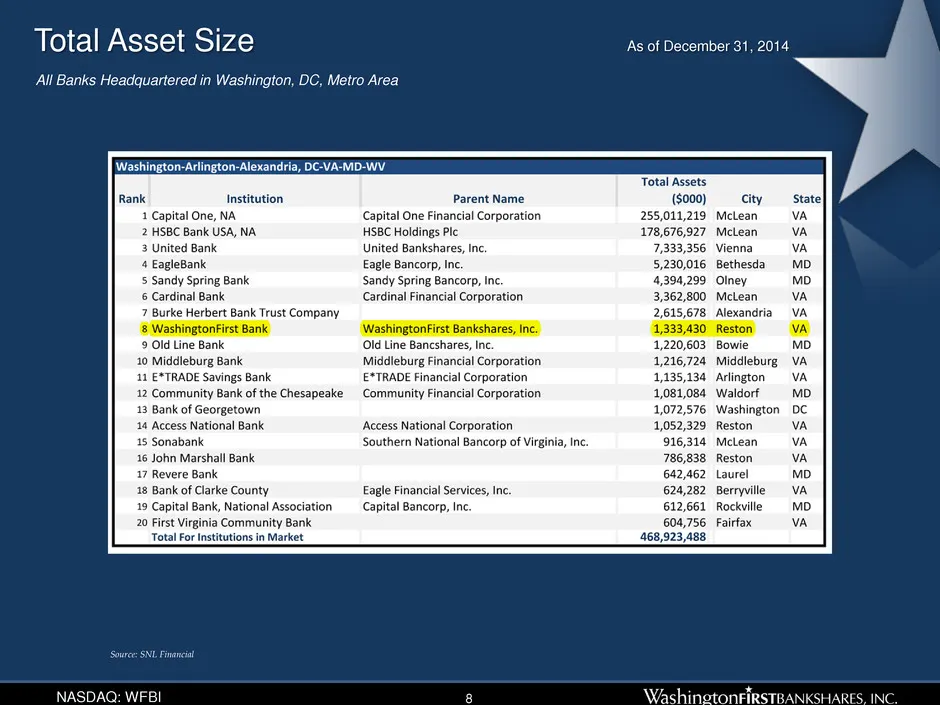
Slide 9: All Banks Headquartered in Washington, DC, Metro Area
NASDAQ: WFBI All Banks Headquartered in Washington, DC, Metro Area Total Asset Size As of December 31, 2014 Source: SNL Financial 8 (Table here)
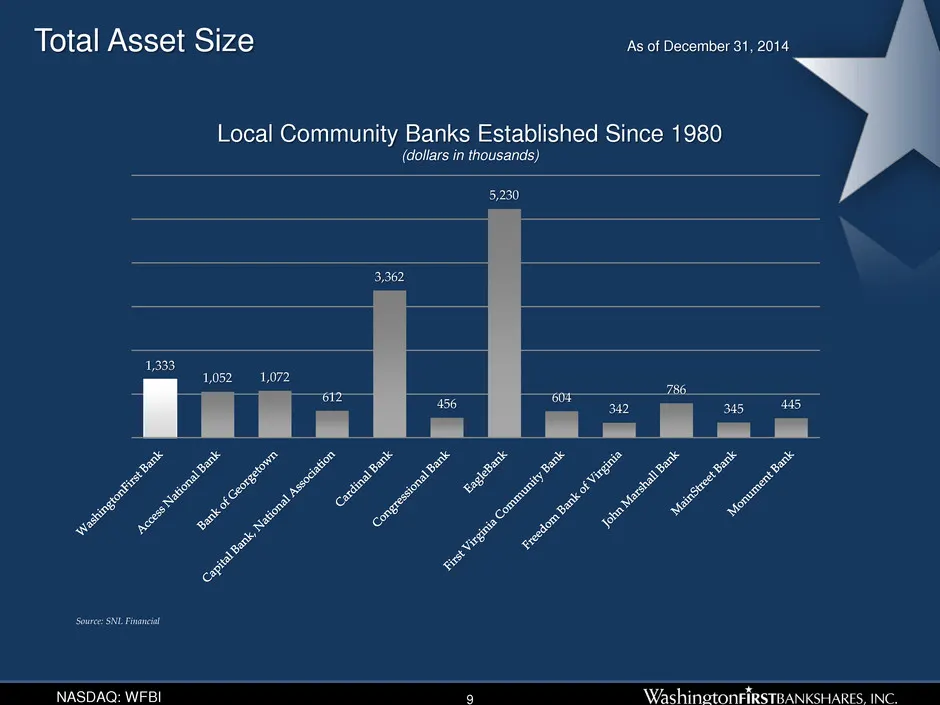
Slide 10: Local Community Banks Established Since 1980
NASDAQ: WFBI Total Asset Size As of December 31, 2014 Source: SNL Financial 9 1,333 1,052 1,072 612 3,362 456 5,230 604 342 786 345 445 Local Community Banks Established Since 1980 (dollars in thousands)
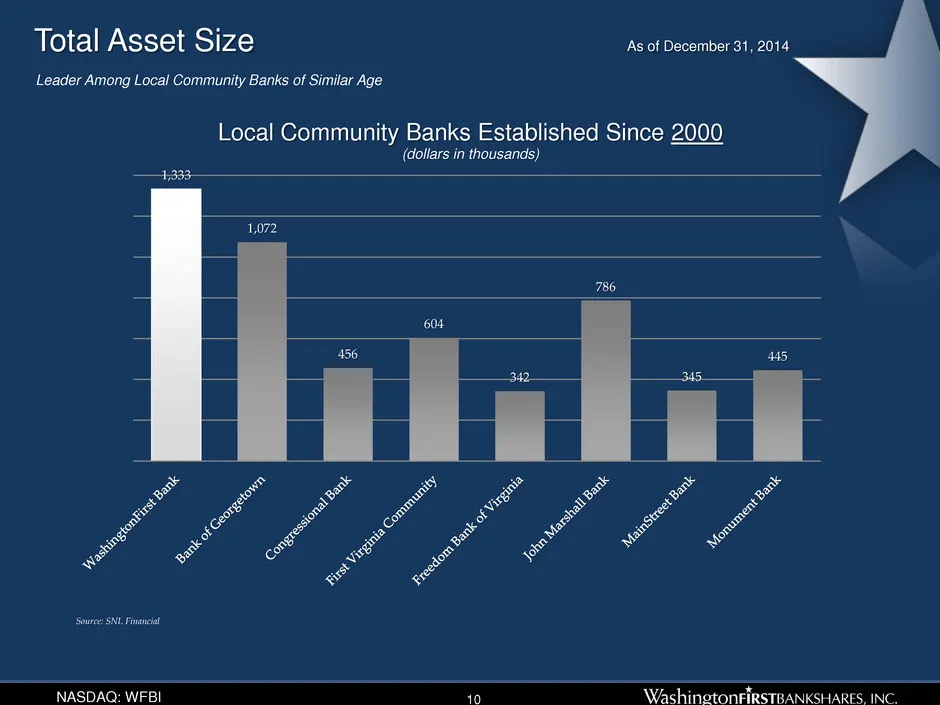
Slide 11: Leader Among Local Community Banks of Similar Age
NASDAQ: WFBI Leader Among Local Community Banks of Similar Age Total Asset Size As of December 31, 2014 Source: SNL Financial 10 1,333 1,072 456 604 342 786 345 445 Local Community Banks Established Since 2000 (dollars in thousands)
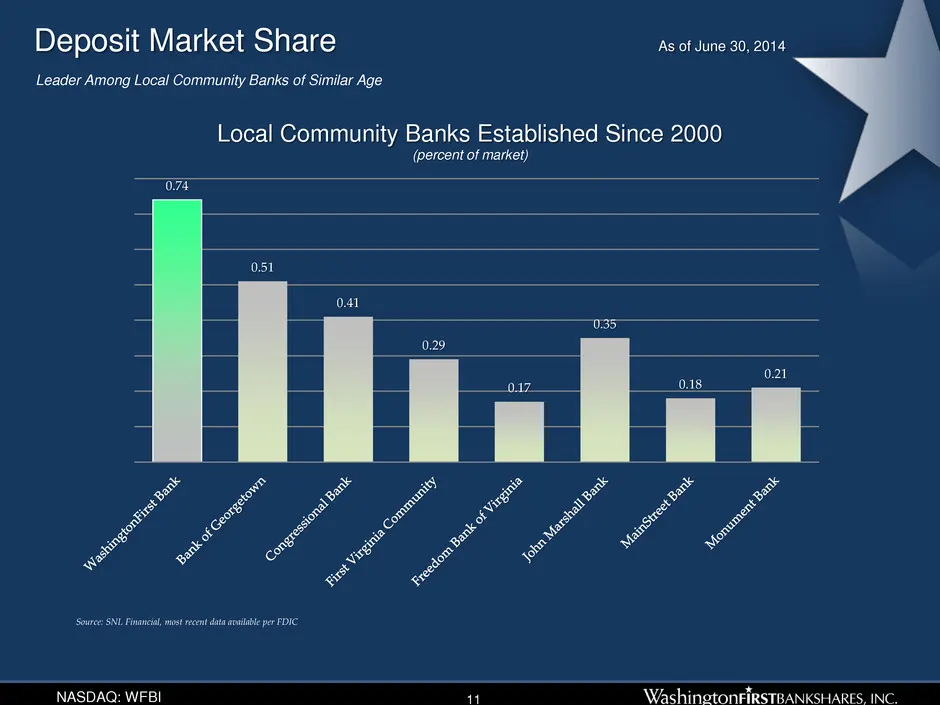
Slide 12: Leader Among Local Community Banks: Deposit Market Share
NASDAQ: WFBI Leader Among Local Community Banks of Similar Age Deposit Market Share As of June 30, 2014 Source: SNL Financial, most recent data available per FDIC 11 0.74 0.51 0.41 0.29 0.17 0.35 0.18 0.21 Local Community Banks Established Since 2000 (percent of market)
Slide 13: Earnings Growth
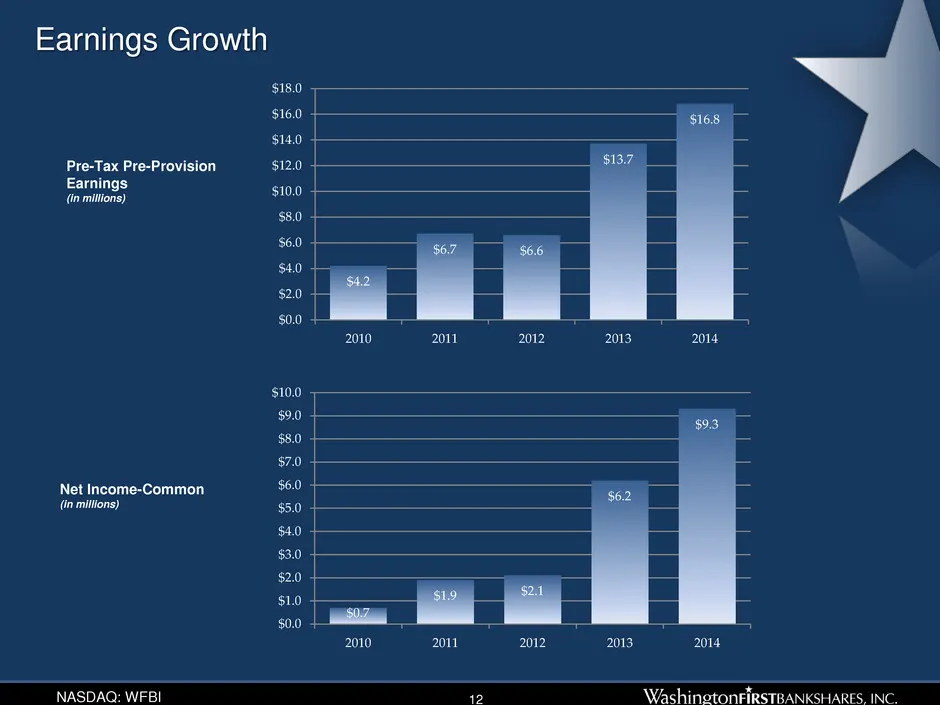
NASDAQ: WFBI 12 Earnings Growth Pre-Tax Pre-Provision Earnings (in millions) $4.2 $6.7 $6.6 $13.7 $16.8 $0.0 $2.0 $4.0 $6.0 $8.0 $10.0 $12.0 $14.0 $16.0 $18.0 2010 2011 2012 2013 2014 Net Income-Common (in millions) $0.7 $1.9 $2.1 $6.2 $9.3 $0.0 $1.0 $2.0 $3.0 $4.0 $5.0 $6.0 $7.0 $8.0 $9.0 $10.0 201
Slide 14: Earnings Trend
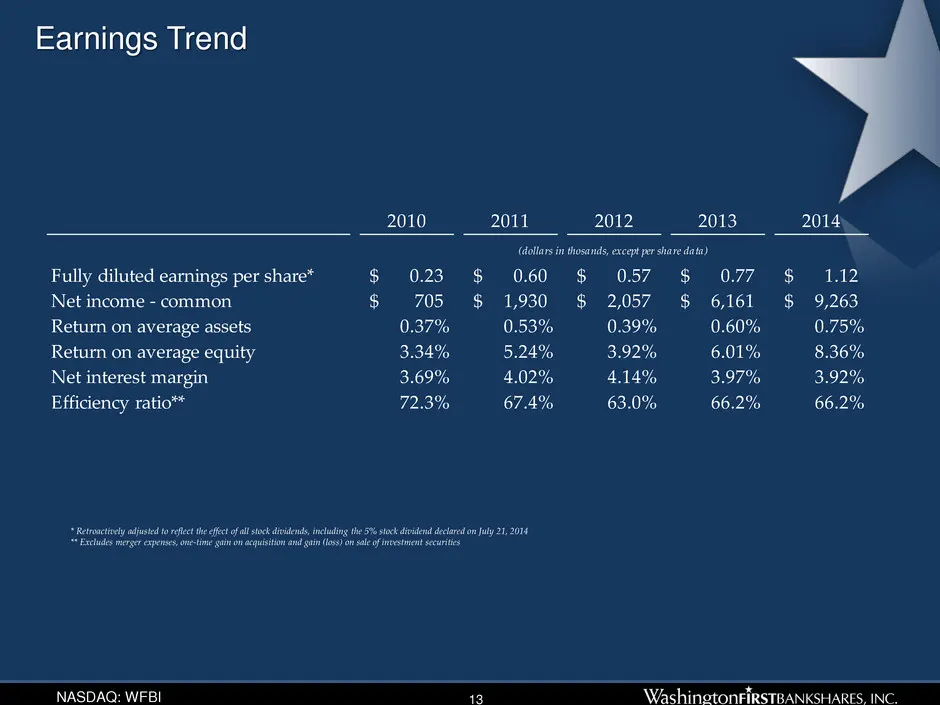
NASDAQ: WFBI 13 Earnings Trend 2010 2011 2012 2013 2014 Fully diluted earnings per share* 0.23$ 0.60$ 0.57$ 0.77$ 1.12$ Net income - common 705$ 1,930$ 2,057$ 6,161$ 9,263$ Return on average assets 0.37% 0.53% 0.39% 0.60% 0.75% Return on average equity 3.34% 5.24% 3.92% 6.01% 8.36% Net interest marg
Slide 15: Net Interest Margin
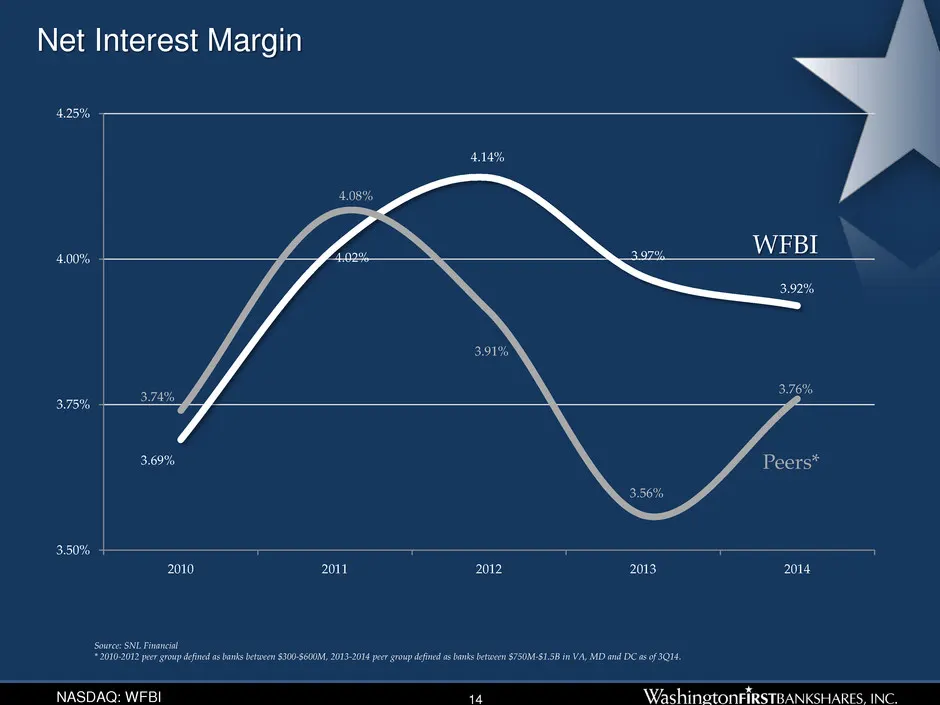
NASDAQ: WFBI Net Interest Margin 3.69% 4.02% 4.14% 3.97% 3.92% 3.74% 4.08% 3.91% 3.56% 3.76% 3.50% 3.75% 4.00% 4.25% 2010 2011 2012 2013 2014 Source: SNL Financial * 2010-2012 peer group defined as banks between $300-$600M, 2013-2014 peer group defined as banks between $750M-$1.5B in VA, MD and DC a
Slide 16: Efficiency Ratio
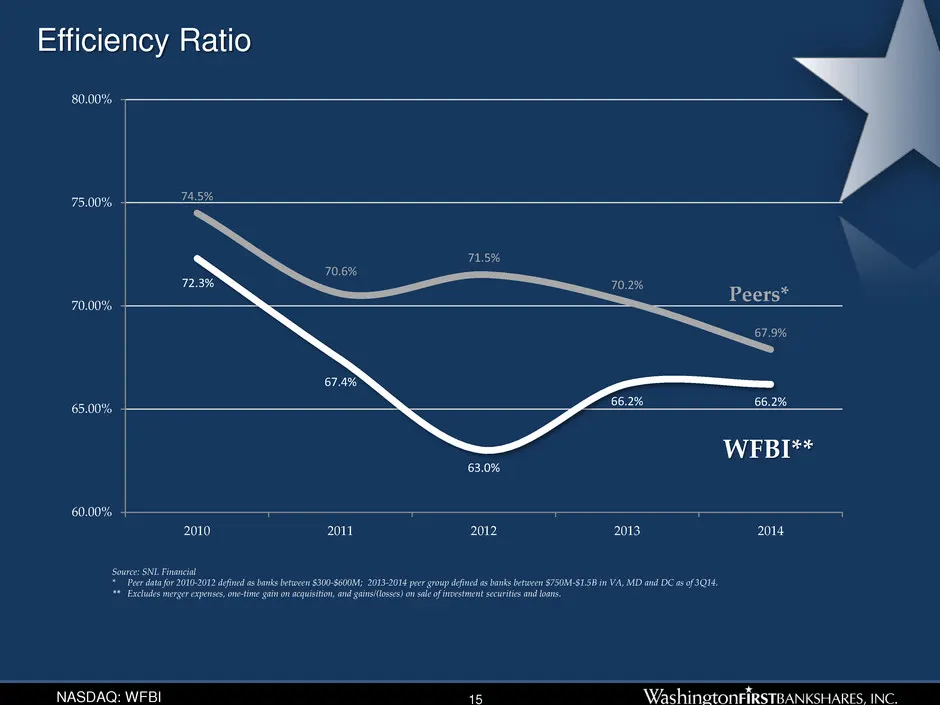
NASDAQ: WFBI Efficiency Ratio 72.3% 67.4% 63.0% 66.2% 66.2% 74.5% 70.6% 71.5% 70.2% 67.9% 60.00% 65.00% 70.00% 75.00% 80.00% 2010 2011 2012 2013 2014 WFBI** Source: SNL Financial * Peer data for 2010-2012 defined as banks between $300-$600M; 2013-2014 peer group defined as banks between $750M-$1.5B
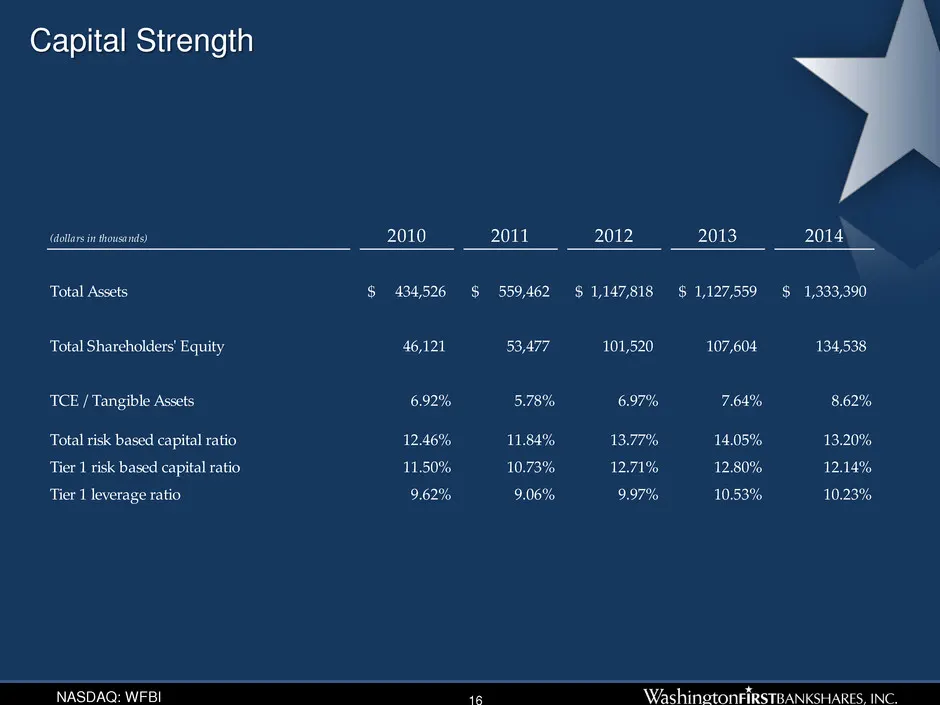
Slide 17: Capital Strength
NASDAQ: WFBI Capital Strength (dollars in thousands) 2010 2011 2012 2013 2014 Total Assets 434,526$ 559,462$ 1,147,818$ 1,127,559$ 1,333,390$ Total Shareholders' Equity 46,121 53,477 101,520 107,604 134,538 TCE / Tangible Assets 6.92% 5.78% 6.97% 7.64% 8.62% Total risk based capital ratio 12.46% 11.
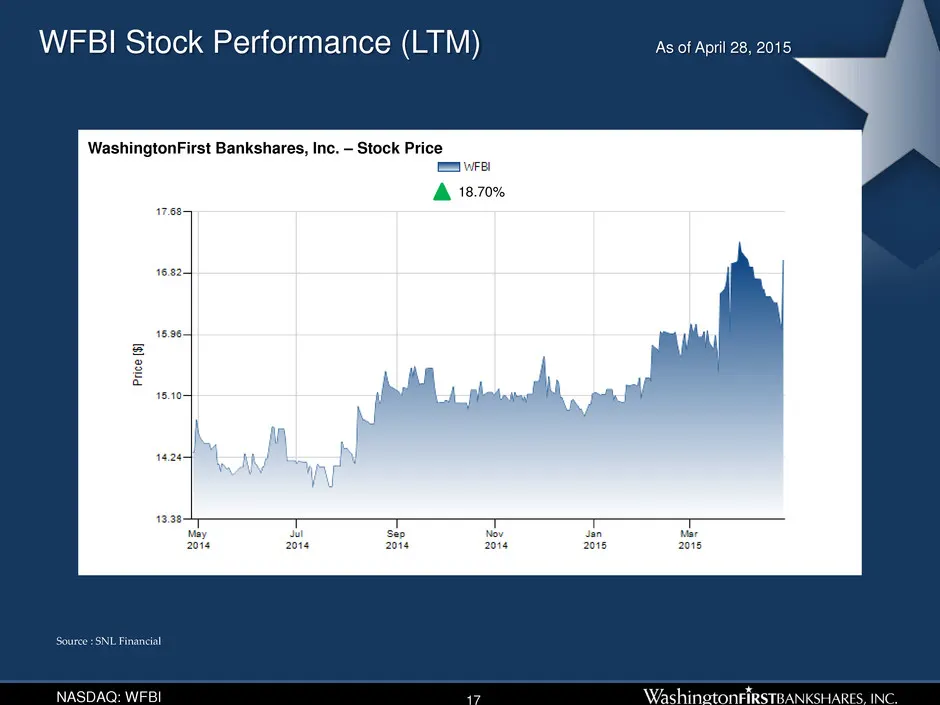
Slide 18: WFBI Stock Performance (LTM)
NASDAQ: WFBI WFBI Stock Performance (LTM) As of April 28, 2015 Source : SNL Financial 17 WashingtonFirst Bankshares, Inc. – Stock Price 18.70%
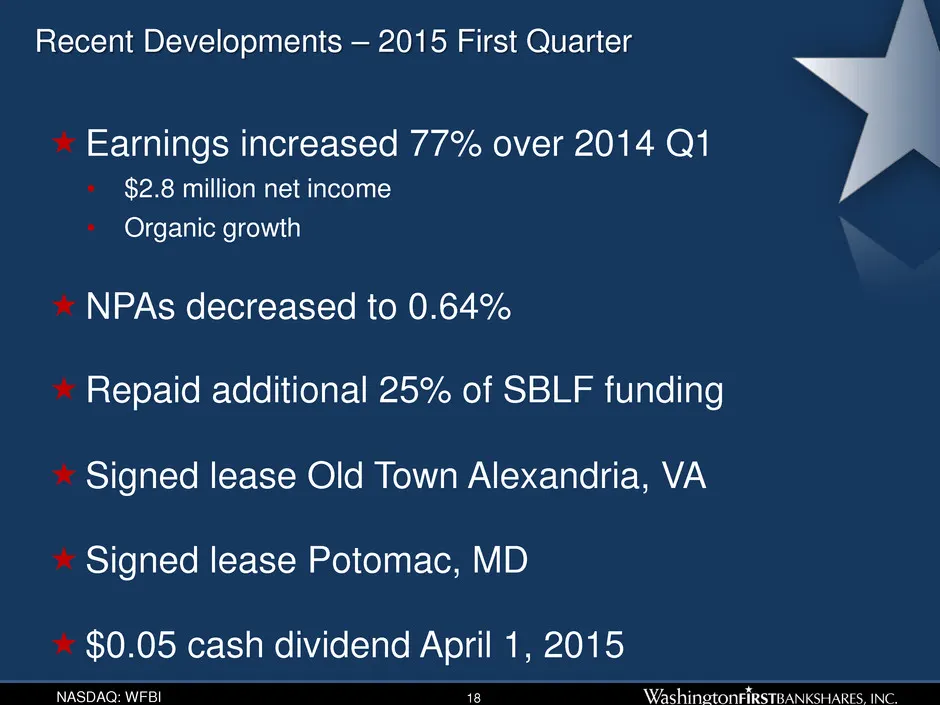
Slide 19: Recent Developments – 2015 First Quarter
NASDAQ: WFBI Recent Developments – 2015 First Quarter Earnings increased 77% over 2014 Q1 • $2.8 million net income • Organic growth NPAs decreased to 0.64% Repaid additional 25% of SBLF funding Signed lease Old Town Alexandria, VA Signed lease Potomac, MD $0.05 cash dividend April 1, 2015 18
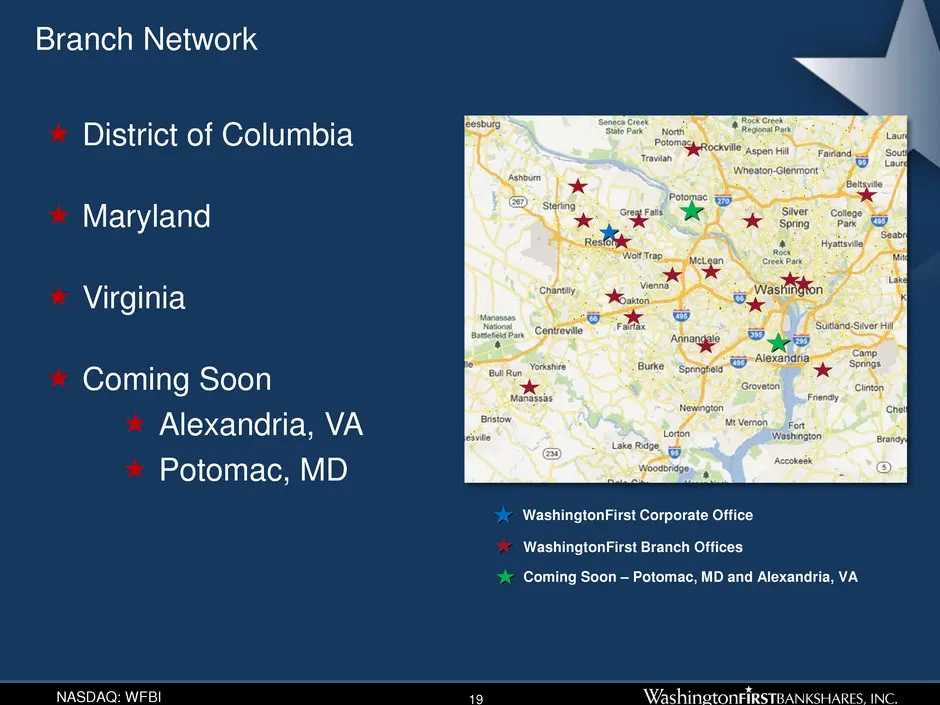
Slide 20: Branch Network
NASDAQ: WFBI 19 Branch Network WashingtonFirst Corporate Office District of Columbia Maryland Virginia Coming Soon Alexandria, VA Potomac, MD WashingtonFirst Branch Offices Coming Soon – Potomac, MD and Alexandria, VA
Slide 21: Our Strategy
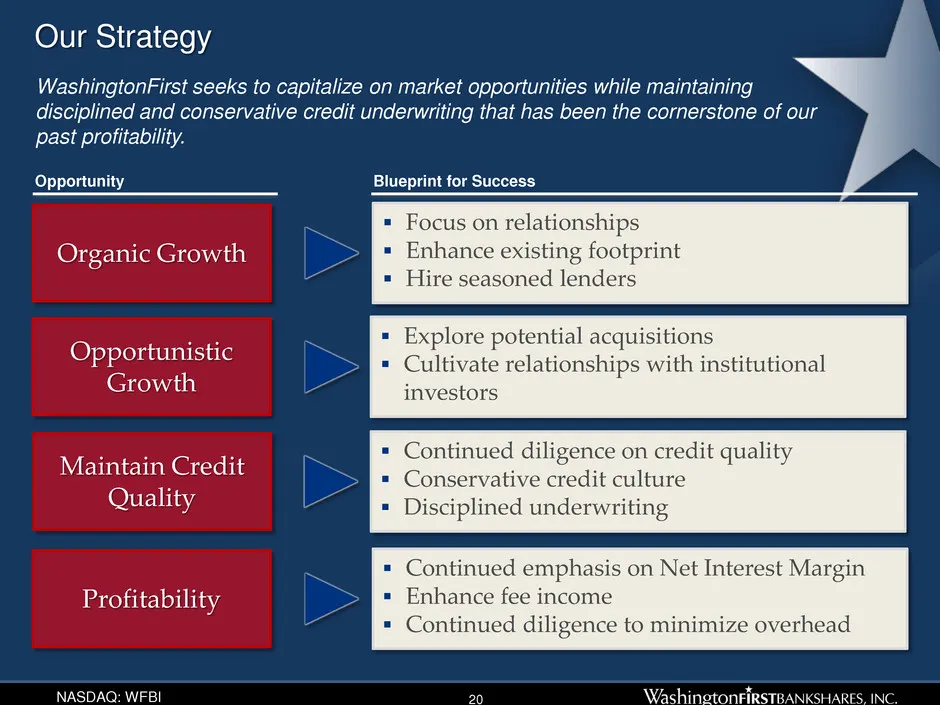
NASDAQ: WFBI 20 Our Strategy WashingtonFirst seeks to capitalize on market opportunities while maintaining disciplined and conservative credit underwriting that has been the cornerstone of our past profitability. Opportunity Organic Growth Focus on relationships Enhance existing footprint Hire
Slide 22: WFYF Golf Invitational
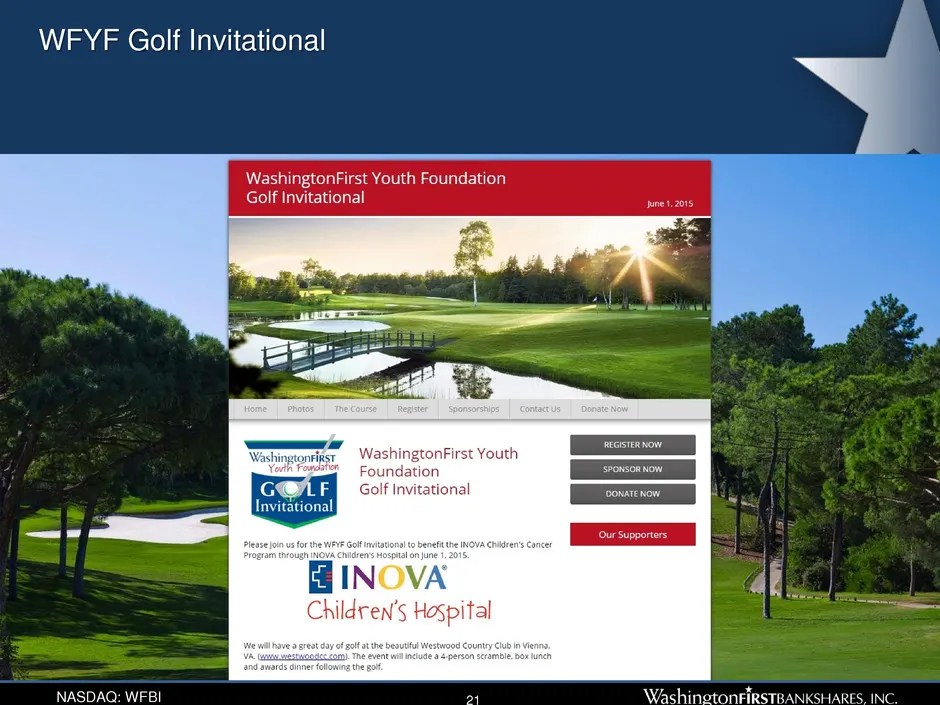
NASDAQ: WFBI WFYF Golf Invitational 21
Slide 23: Thank You
NASDAQ: WFBI NASDAQ: WFBI www.wfbi.com Thank You
Source: SEC EDGAR · 8-K filed Apr 29, 2015
More decks from WashingtonFirst Bankshares Inc
 KBW 2017 Community Bank Investor Conference43 slides · Jul 31, 2017
 Merger or Acquisition (May 2017)15 slides · May 16, 2017
 Shareholder Meeting (April 2017)21 slides · Apr 26, 2017
 Investor Presentation (February 2017)37 slides · Feb 10, 2017
 Investor Presentation (September 2016)31 slides · Sep 6, 2016
 Investor Presentation (August 2016)31 slides · Aug 17, 2016