EuroDry Ltd. · NASDAQ:EDRY
EuroDry — Q3 2026 Earnings Presentation
18 slides from EuroDry's earnings presentation, Nov 11, 2026
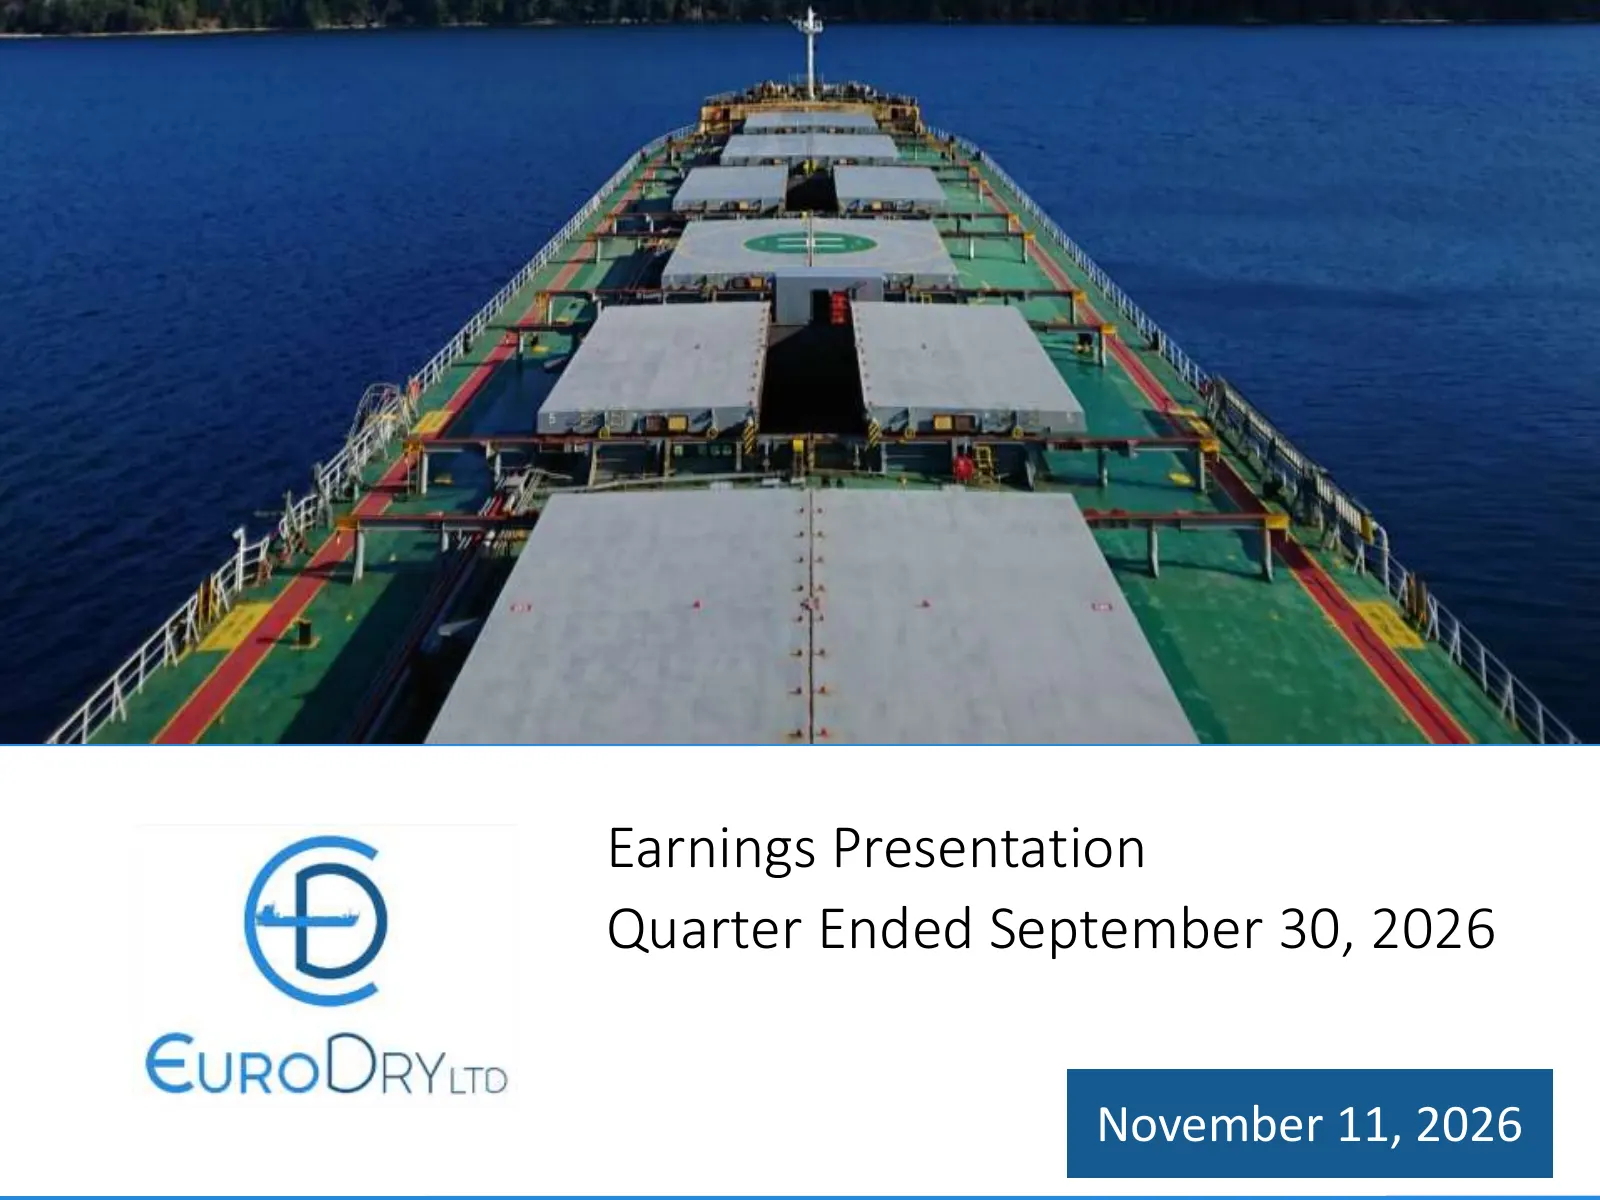
Slide 1: Earnings Presentation Quarter Ended September 30, 2026
Earnings Presentation Quarter Ended September 30, 2026 November 11, 2026 1
Slide 2: Forward-Looking Statements
Forward/Looking Statements Statements in this presentation may be "forward/looking statements" within the meaning of federal securities laws. The matters discussed herein that are forward/looking statements are based on current management expectations that involve risks and uncertainties that may re
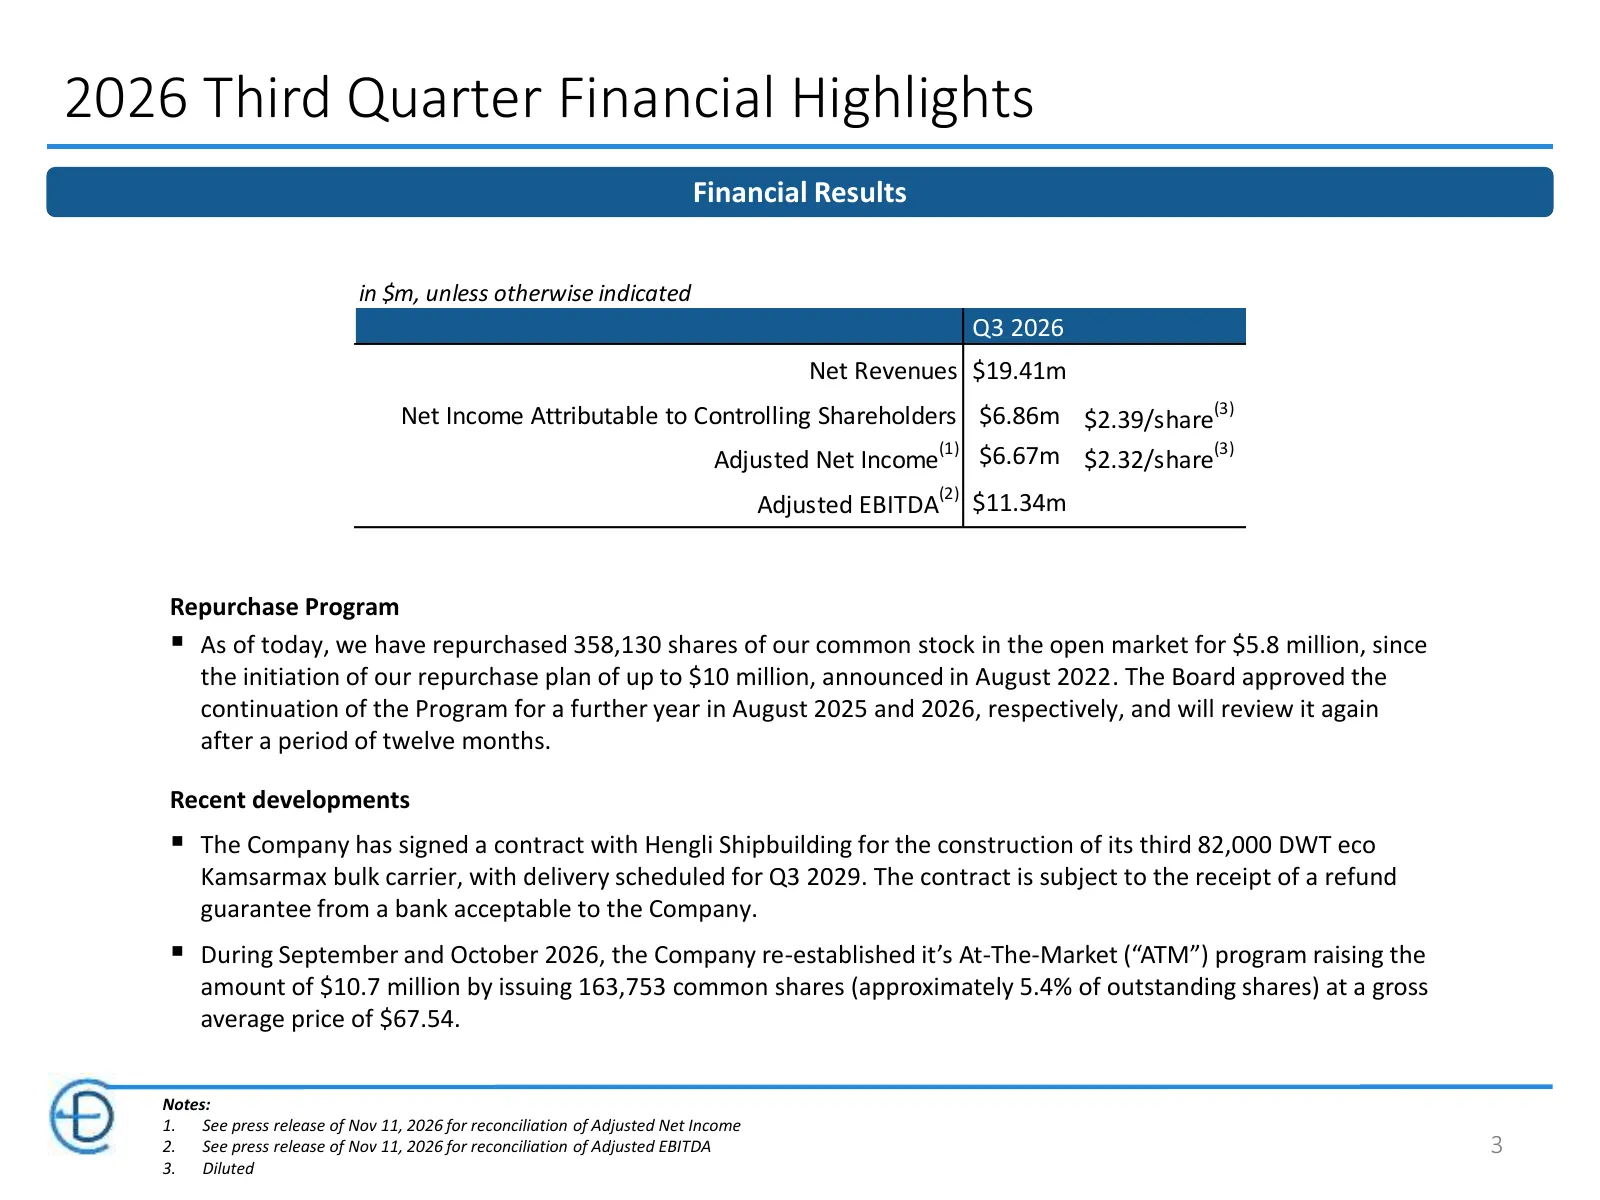
Slide 3: 2026 Third Quarter Financial Highlights
2026 Third Quarter Financial Highlights Financial Results in $m, unless otherwise indicated Q3 2026 Net Revenues $19.41m Net Income Attributable to Controlling Shareholders $6.86m $2.39/share(3) (1) Adjusted Net Income $6.67m $2.32/share(3) Adjusted EBITDA(2) $11.34m Repurchase Program ▪ As of today
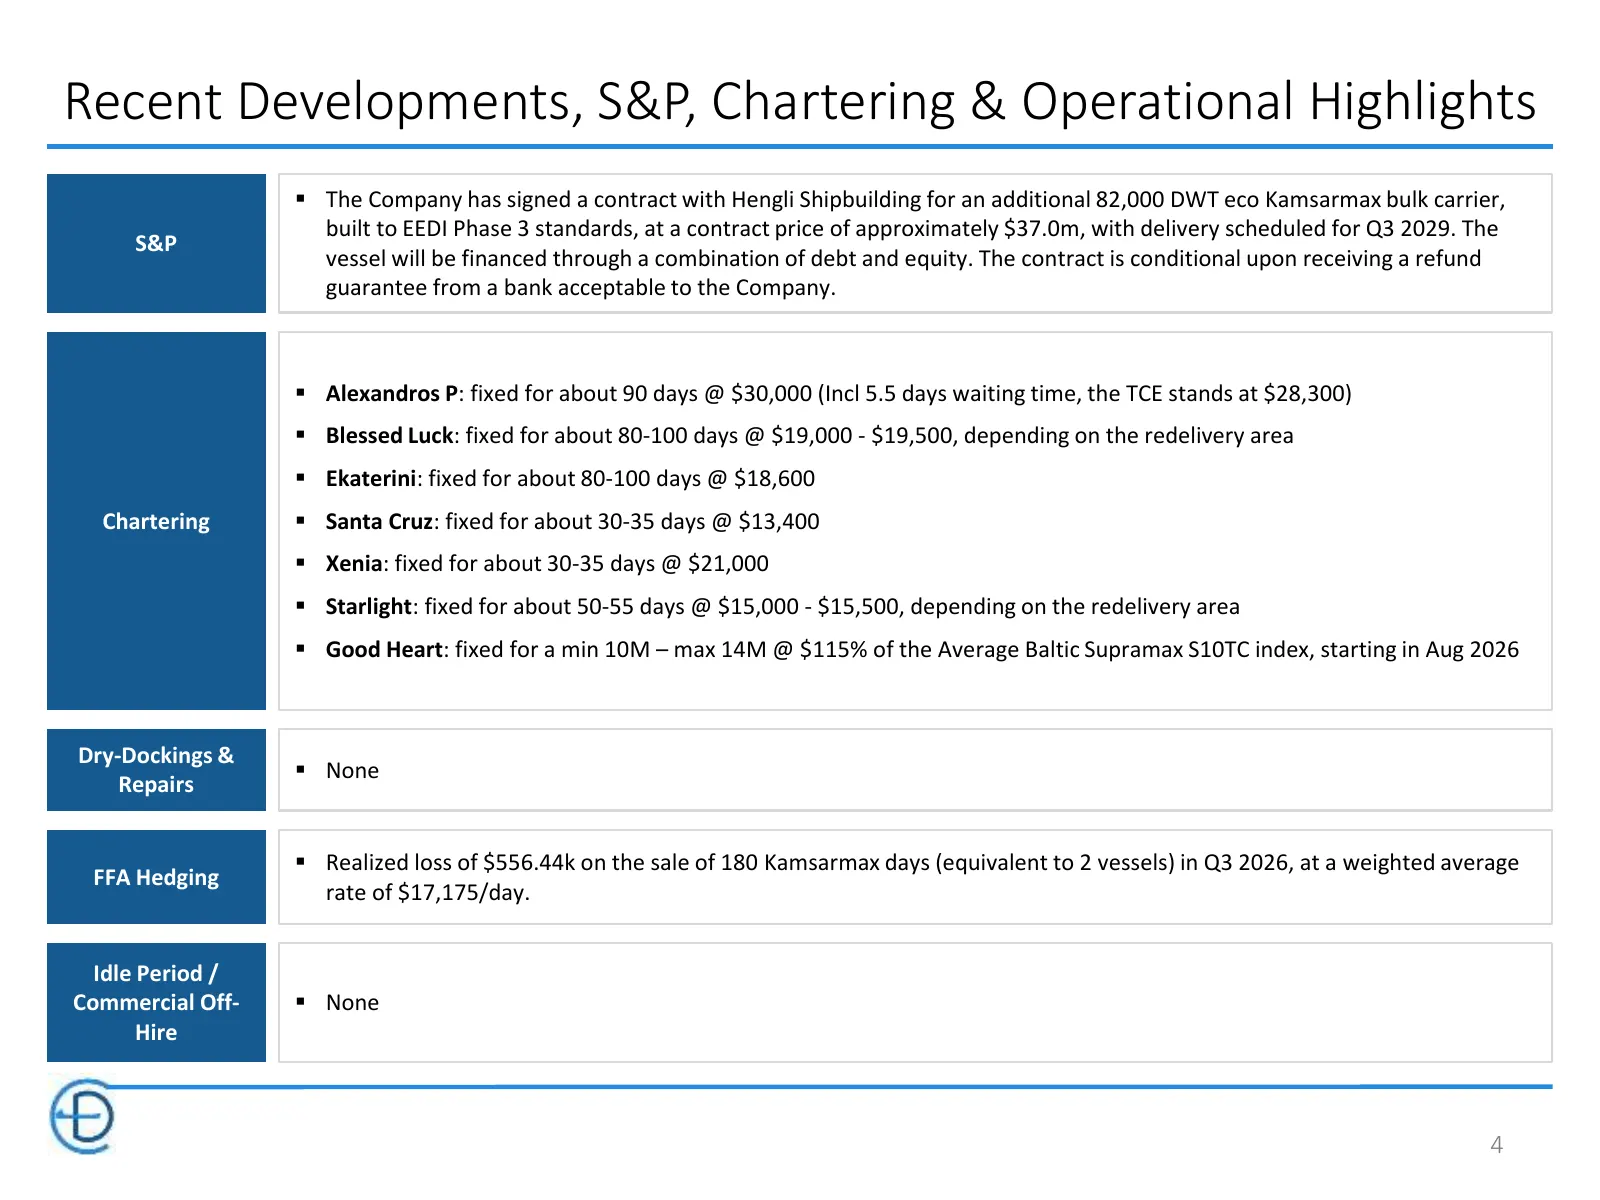
Slide 4: Recent Developments, S&P, Chartering & Operational Highlights
Recent Developments, S&P, Chartering & Operational Highlights ▪ The Company has signed a contract with Hengli Shipbuilding for an additional 82,000 DWT eco Kamsarmax bulk carrier, built to EEDI Phase 3 standards, at a contract price of approximately $37.0m, with delivery scheduled for Q3 2029. The S
Slide 5: Fleet Profile
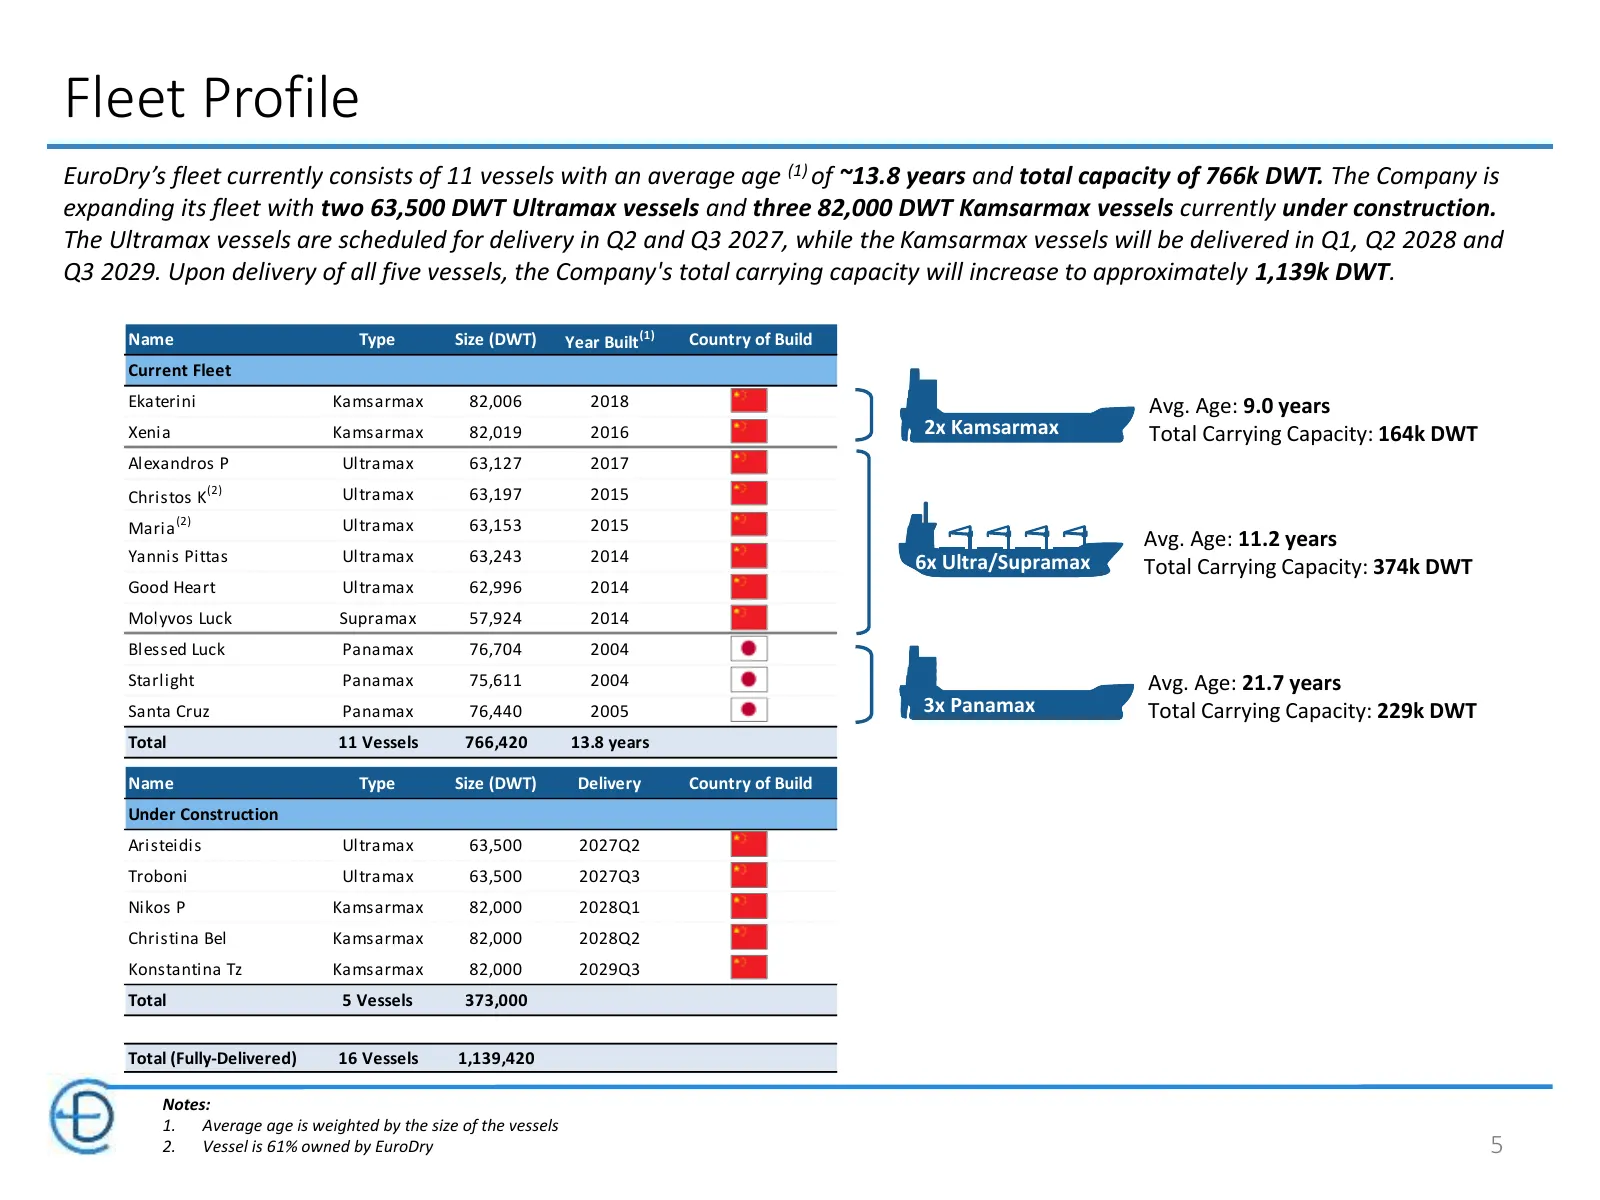
Fleet Profile EuroDry’s fleet currently consists of 11 vessels with an average age (1) of ~13.8 years and total capacity of 766k DWT. The Company is expanding its fleet with two 63,500 DWT Ultramax vessels and three 82,000 DWT Kamsarmax vessels currently under construction. The Ultramax vessels are
Slide 6: Current Fleet Employment Profile
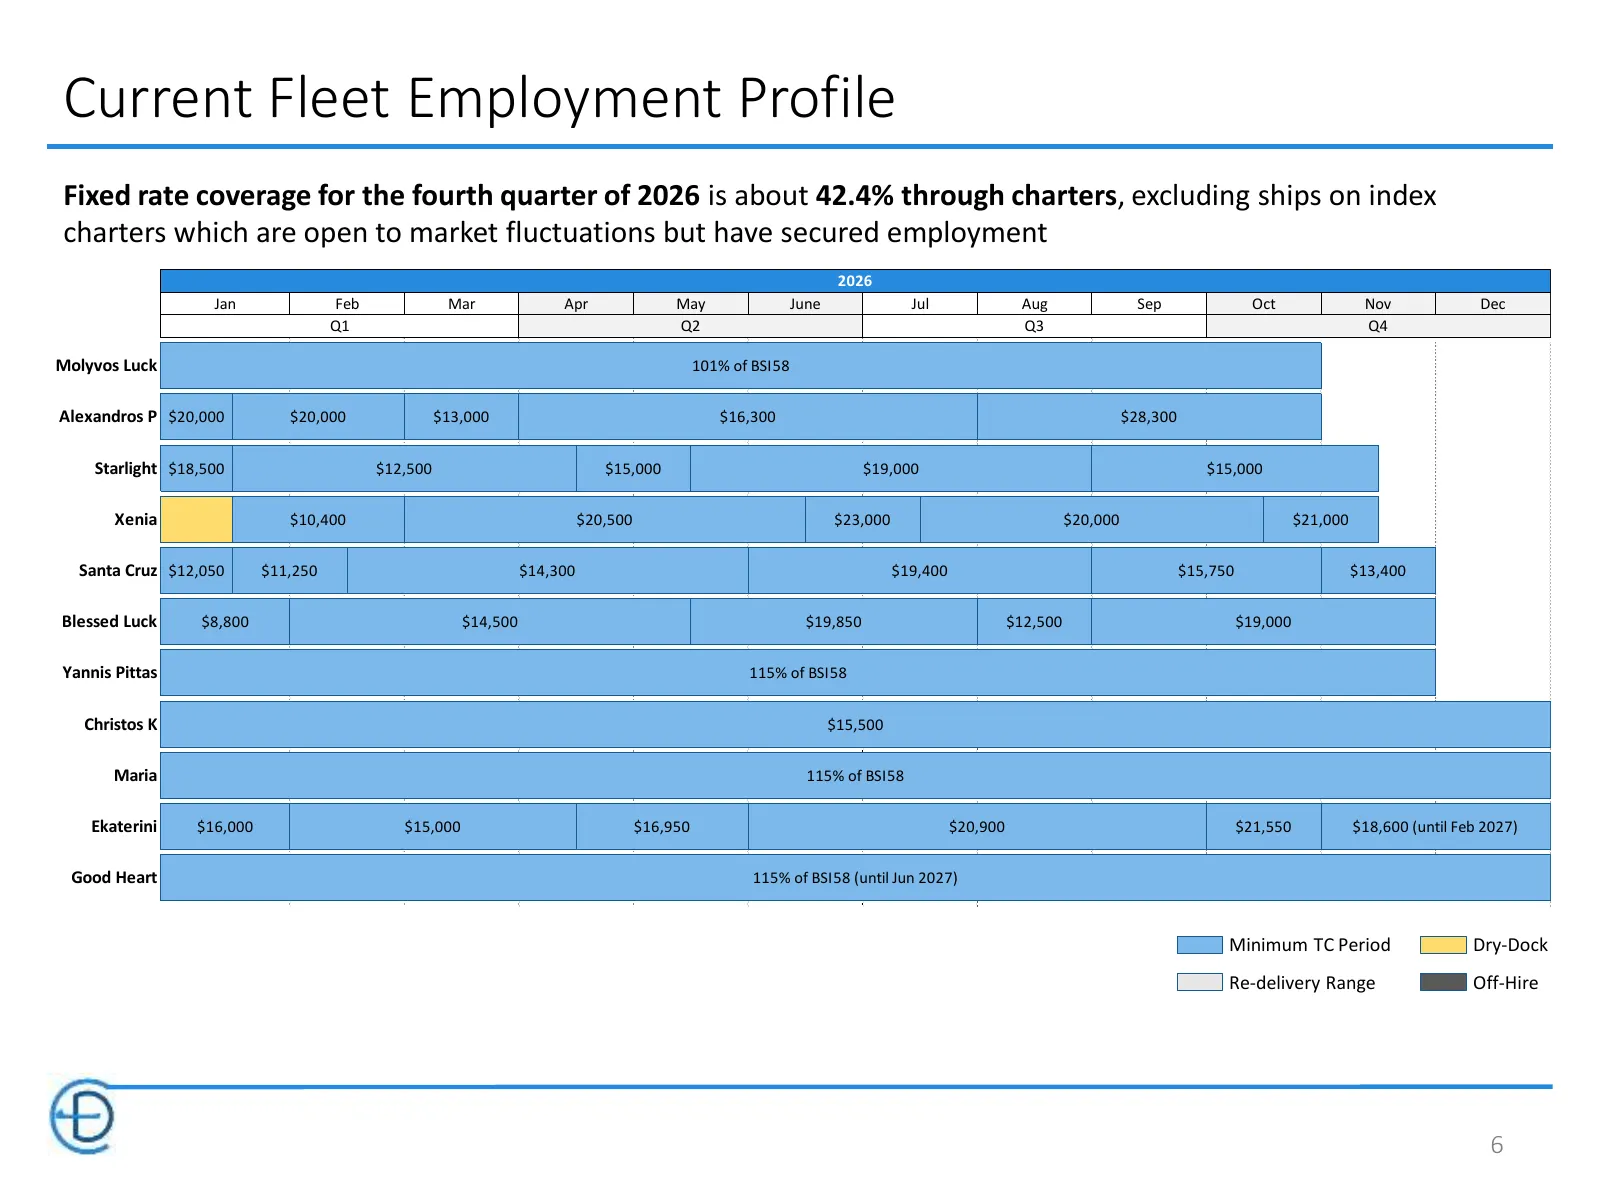
Current Fleet Employment Profile Fixed rate coverage for the fourth quarter of 2026 is about 42.4% through charters, excluding ships on index charters which are open to market fluctuations but have secured employment 2026 Jan Feb Mar Apr May June Jul Aug Sep Oct Nov Dec J Q1 Q2 Q3 Q4 Molyvos Luck 10

Slide 7: Market Overview
Market Overview 7
Slide 8: Market Highlights 2026 Q3
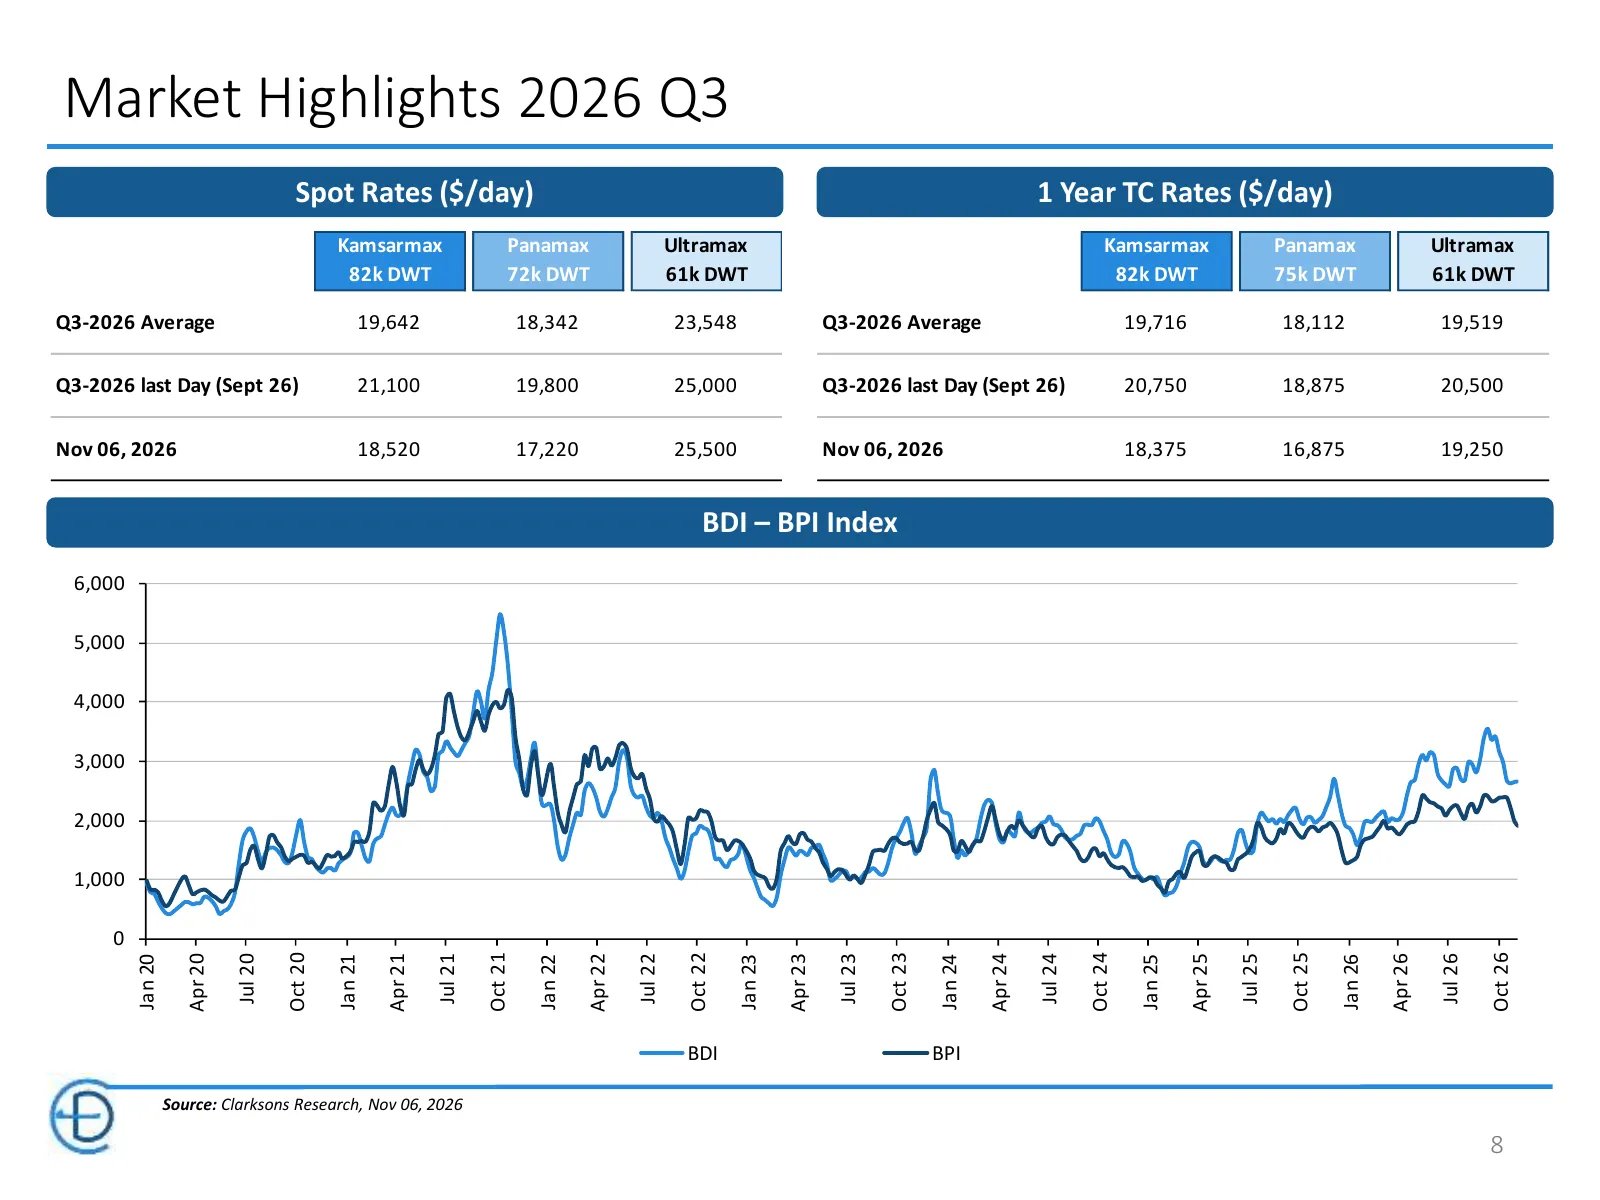
Market Highlights 2026 Q3 Spot Rates ($/day) 1 Year TC Rates ($/day) Kamsarmax Panamax Ultramax Kamsarmax Panamax Ultramax 82k DWT 72k DWT 61k DWT 82k DWT 75k DWT 61k DWT Q3-2026 Average 19,642 18,342 23,548 Q3-2026 Average 19,716 18,112 19,519 Q3-2026 last Day (Sept 26) 21,100 19,800 25,000 Q3-2026
Slide 9: World GDP & Shipping Demand Growth
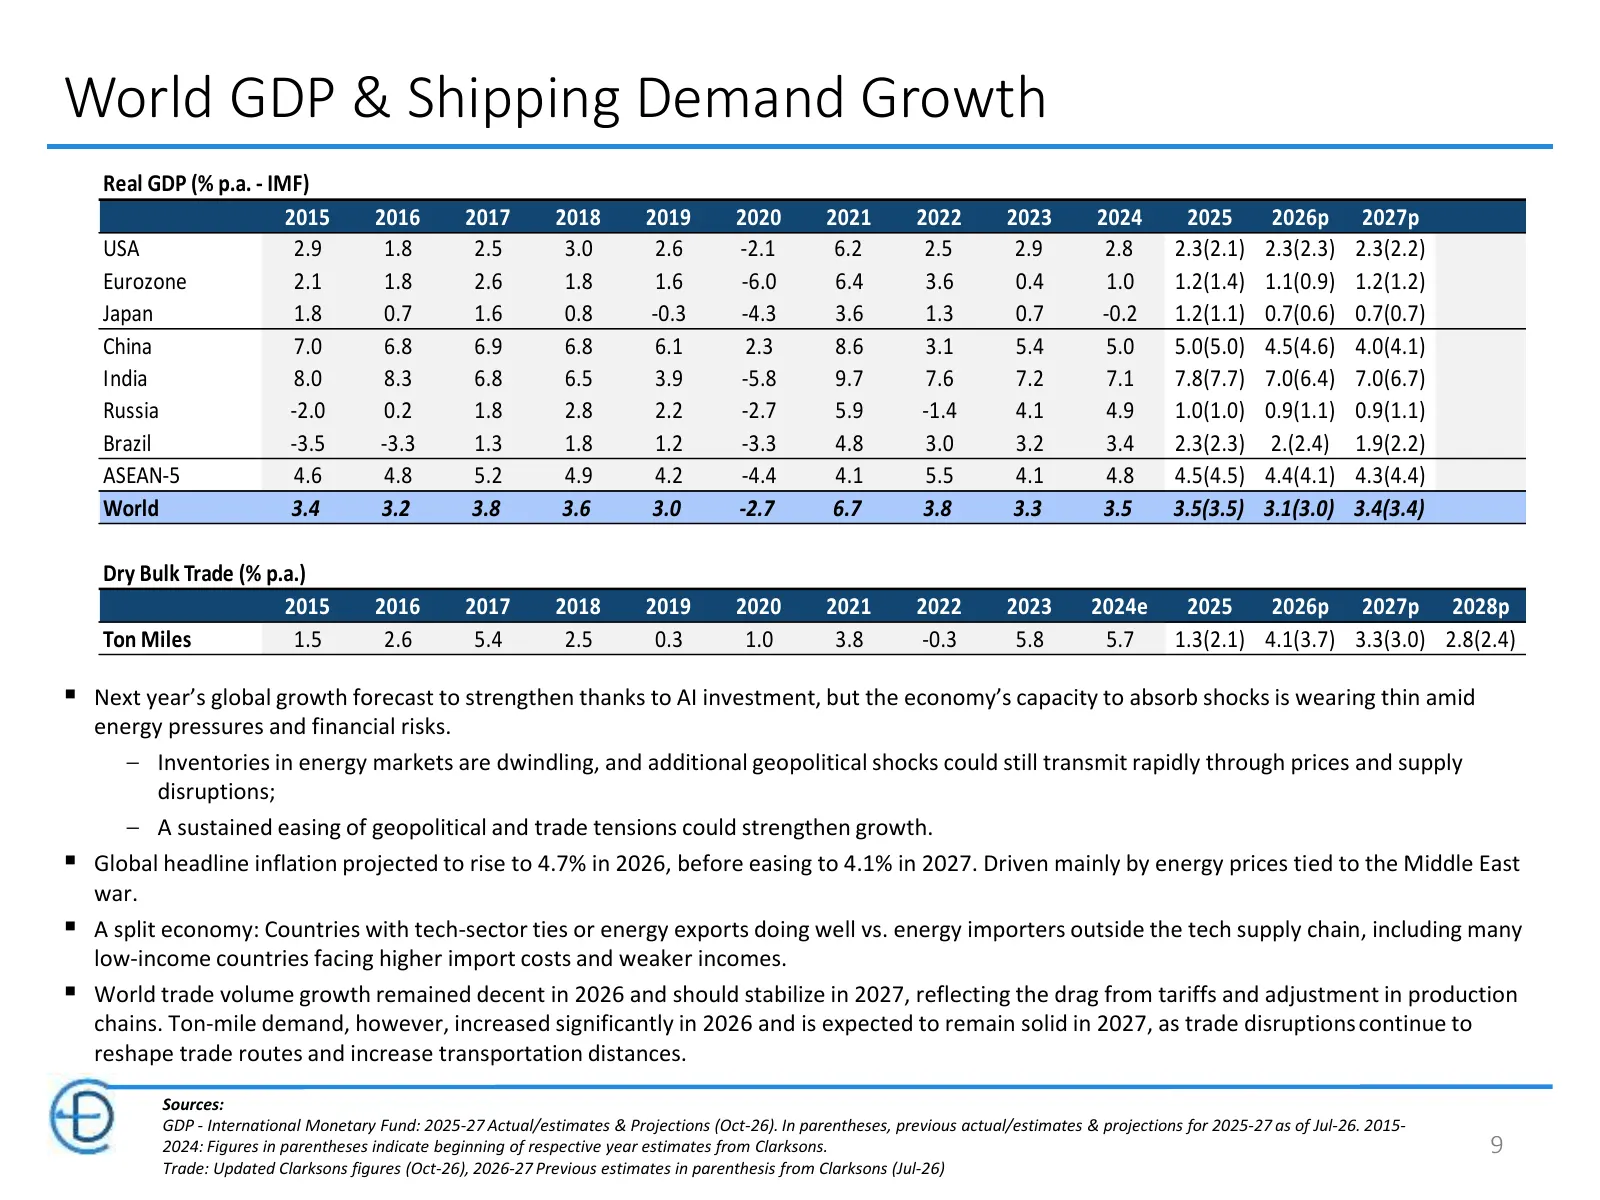
World GDP & Shipping Demand Growth Real GDP (% p.a. - IMF) 2015 2016 2017 2018 2019 2020 2021 2022 2023 2024 2025 2026p 2027p USA 2.9 1.8 2.5 3.0 2.6 -2.1 6.2 2.5 2.9 2.8 2.3(2.1) 2.3(2.3) 2.3(2.2) Eurozone 2.1 1.8 2.6 1.8 1.6 -6.0 6.4 3.6 0.4 1.0 1.2(1.4) 1.1(0.9) 1.2(1.2) Japan 1.8 0.7 1.6 0.8 -0.
Slide 10: Vessel Orderbook
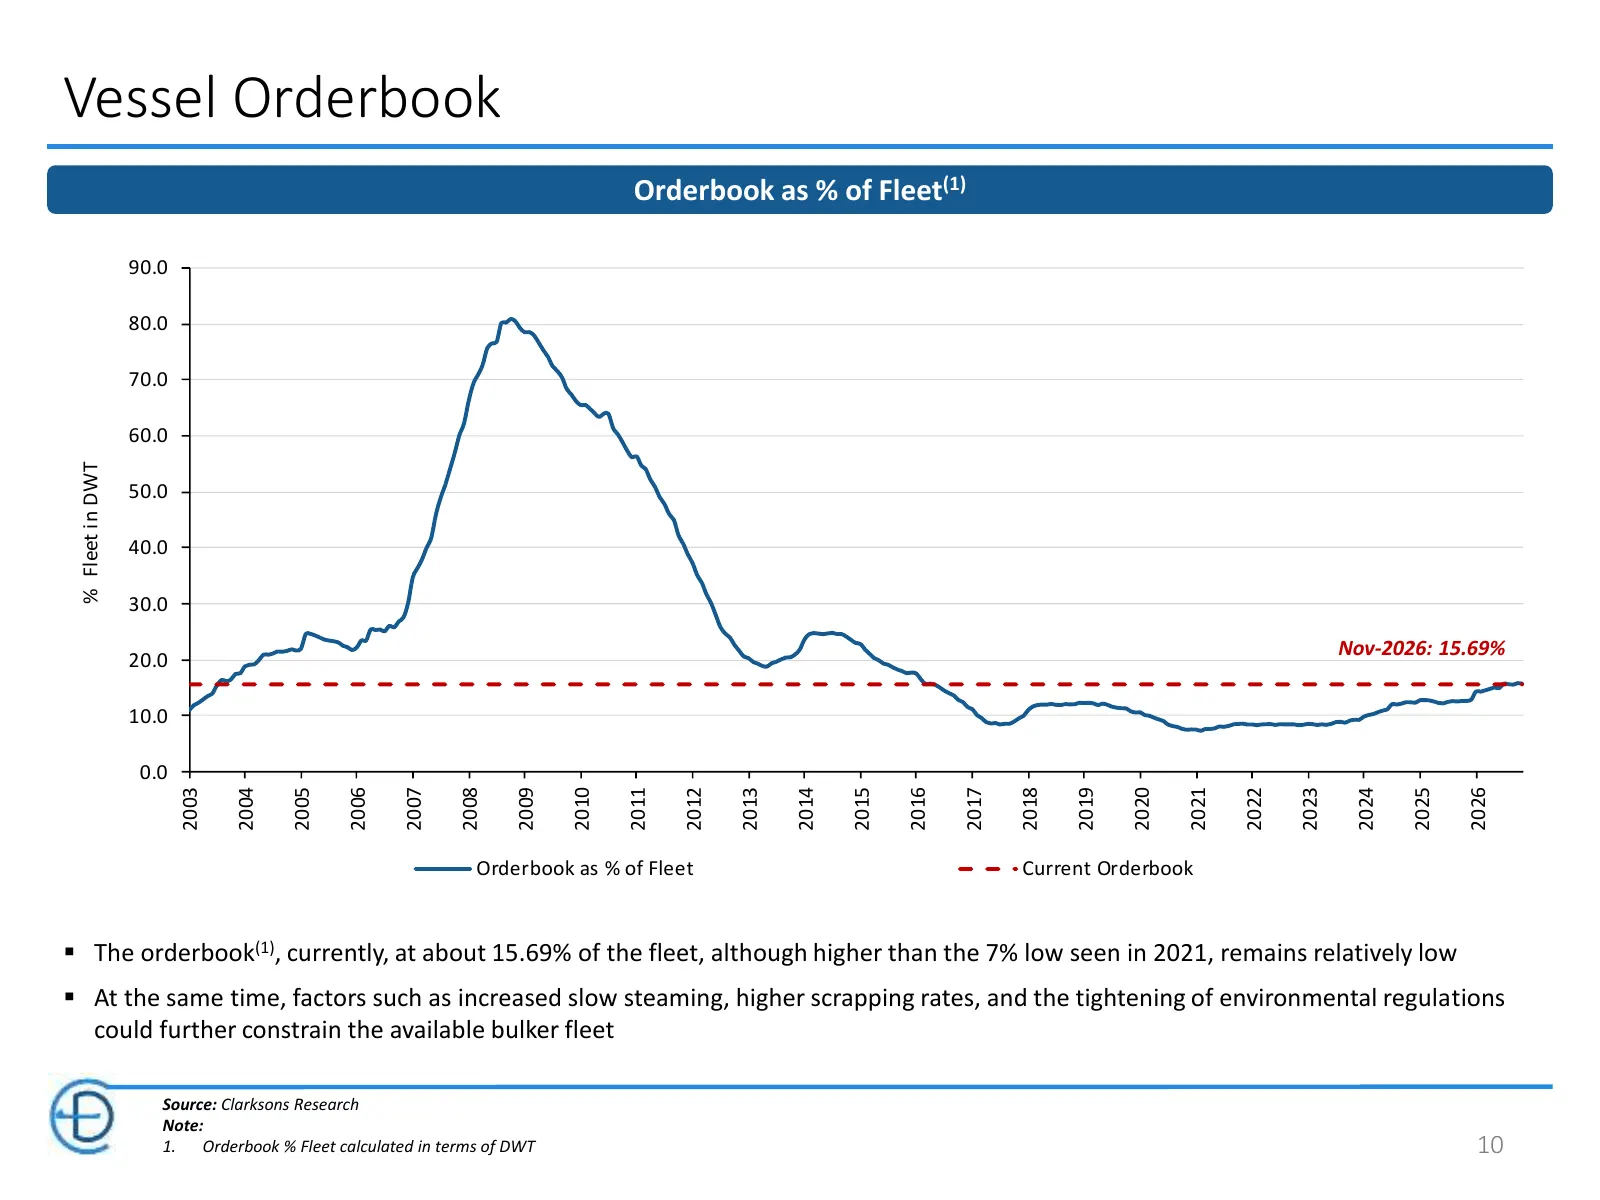
Vessel Orderbook Orderbook as % of Fleet(1) 90.0 80.0 70.0 60.0 % Fleet in DWT 50.0 40.0 30.0 Nov-2026: 15.69% 20.0 10.0 0.0 2004 2006 2008 2010 2014 2015 2019 2021 2023 2025 2003 2005 2007 2009 2011 2012 2013 2016 2017 2018 2020 2022 2024 2026 Orderbook as % of Fleet Current Orderbook ▪ The orderbo
Slide 11: Dry Bulk Fleet Overview
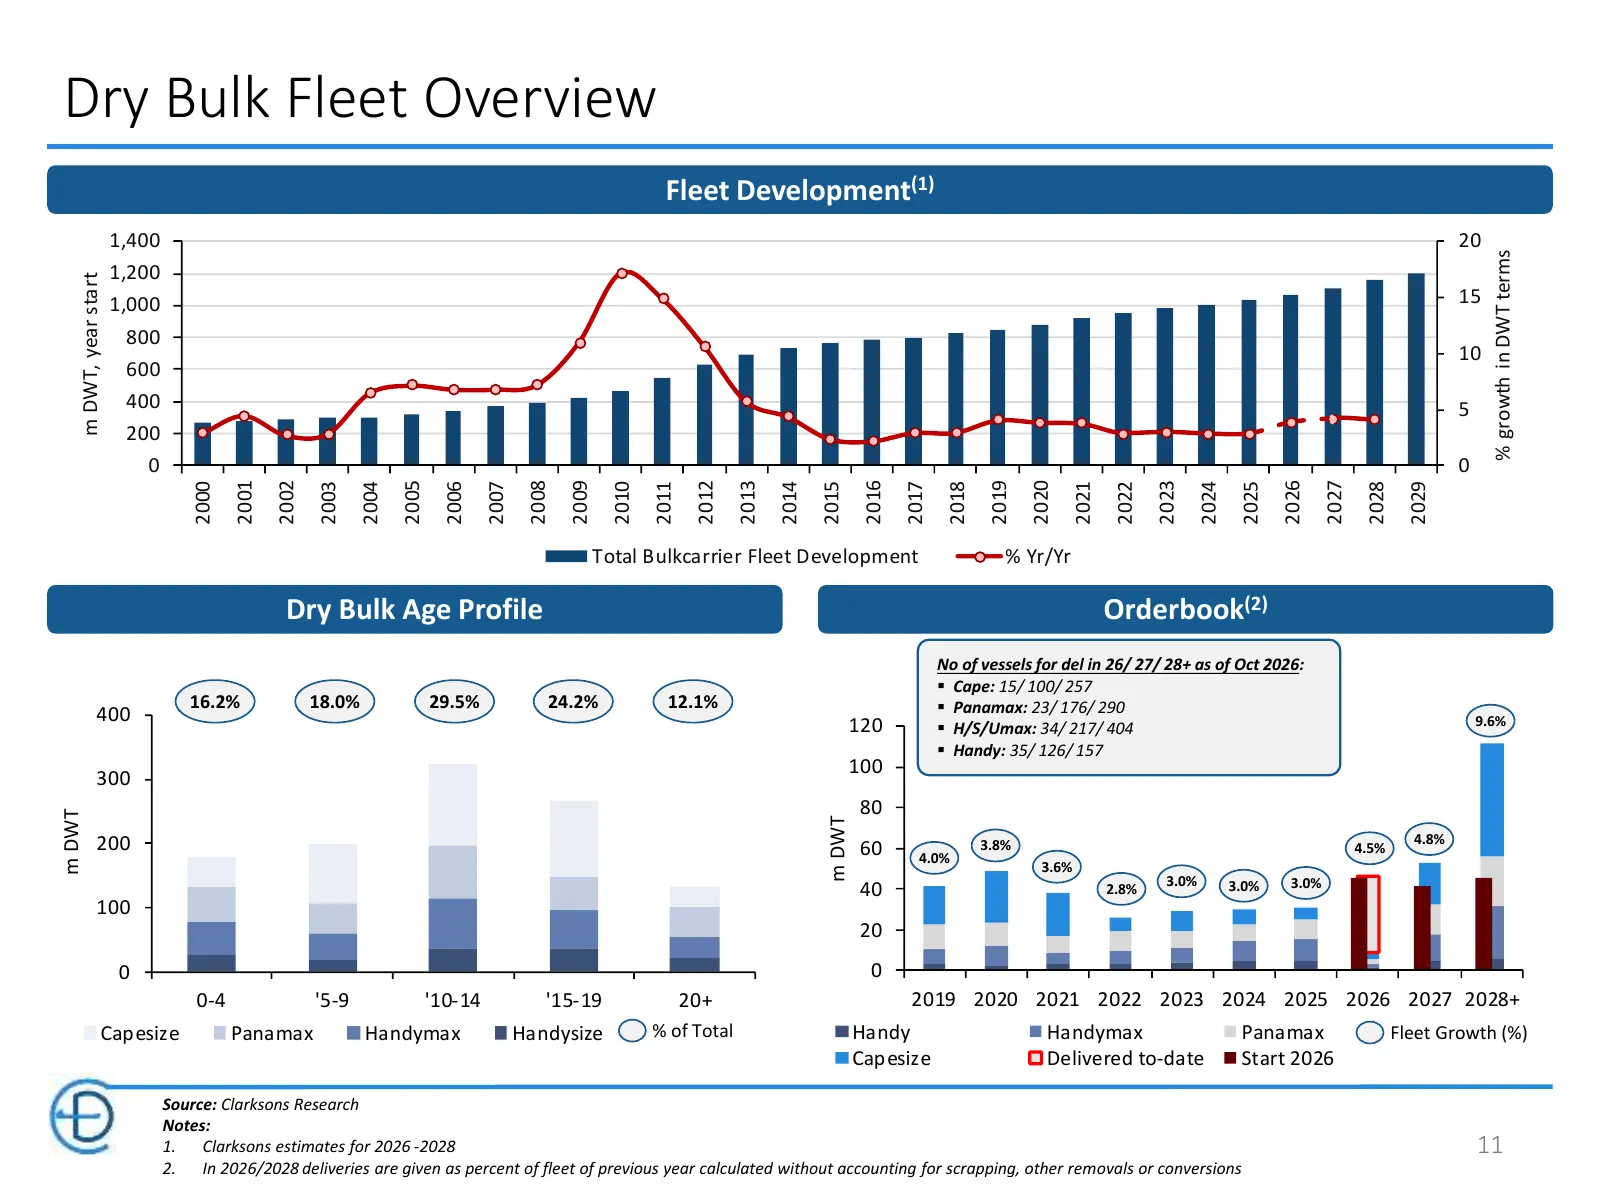
Dry Bulk Fleet Overview Fleet Development(1) 1,400 20 % growth in DWT terms 1,200 m DWT, year start 1,000 15 800 10 600 400 5 200 0 0 2001 2002 2005 2008 2009 2012 2013 2016 2019 2020 2023 2026 2027 2000 2003 2004 2006 2007 2010 2011 2014 2015 2017 2018 2021 2022 2024 2025 2028 2029 Total Bulkcarrie
Slide 12: Position on the Dry Bulk Market Cycle
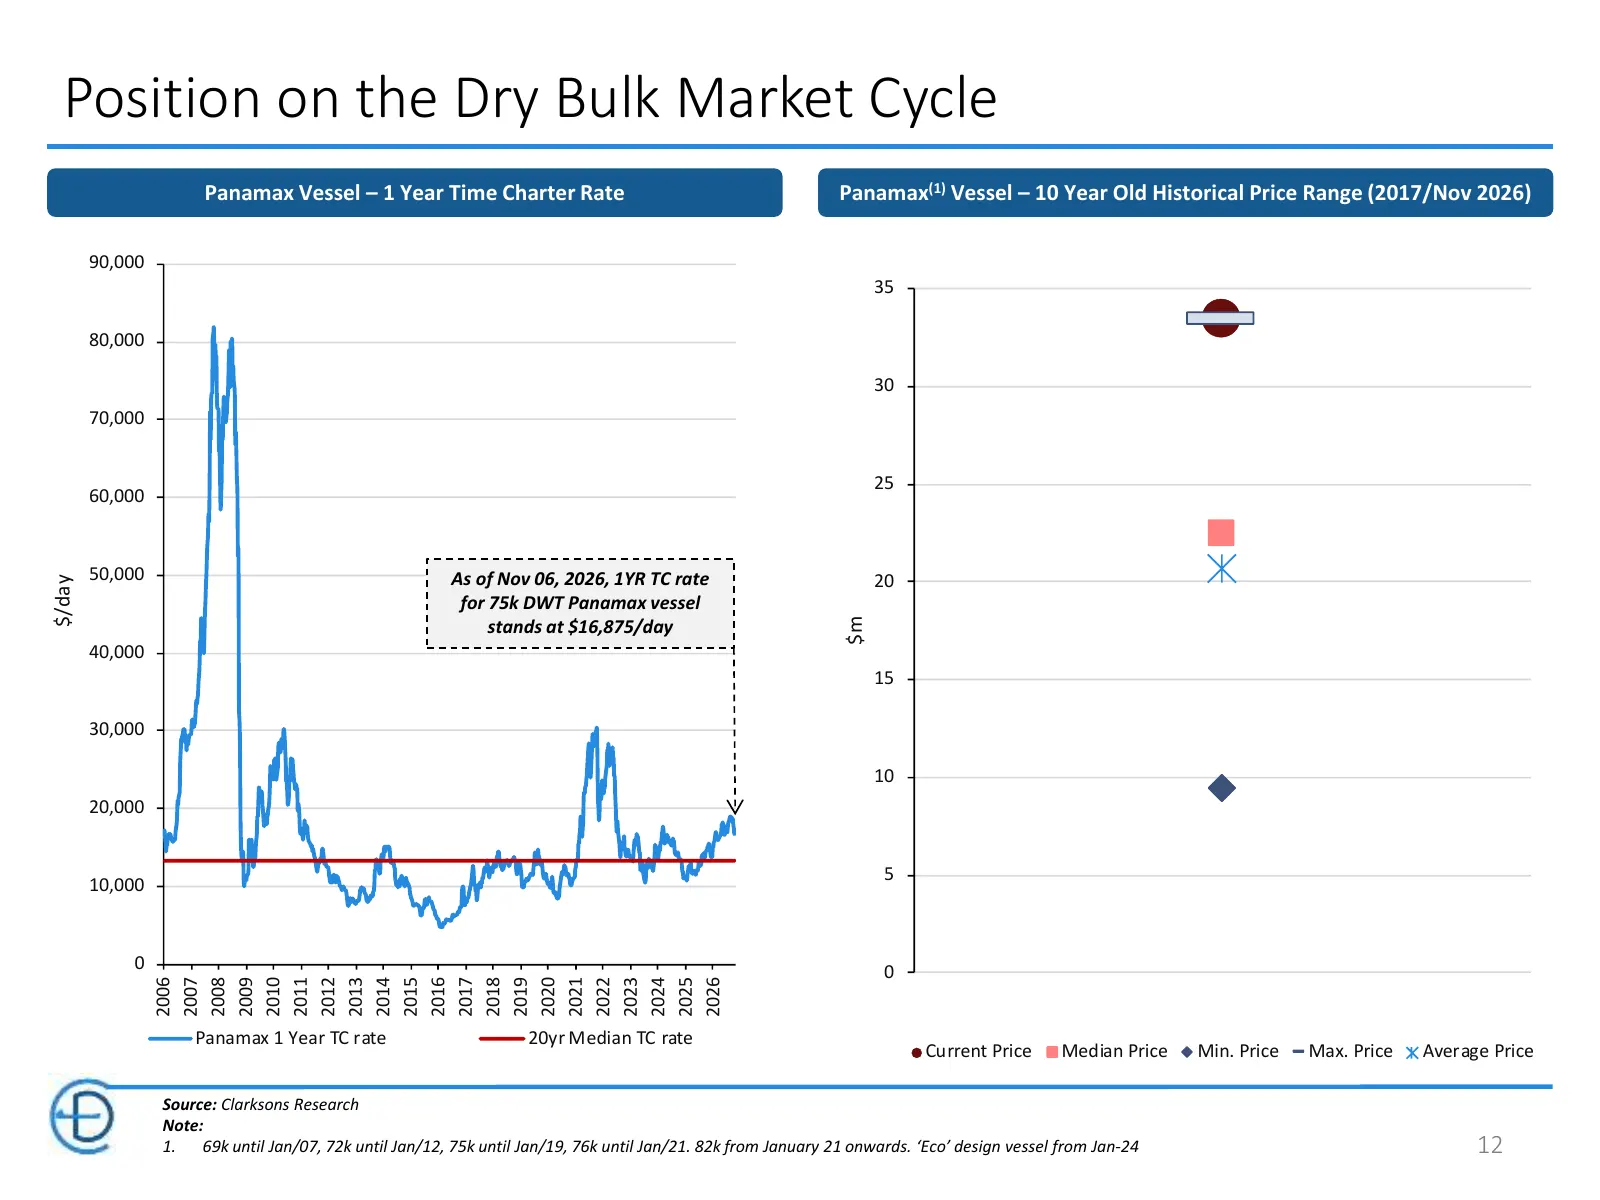
Position on the Dry Bulk Market Cycle Panamax Vessel – 1 Year Time Charter Rate Panamax(1) Vessel – 10 Year Old Historical Price Range (2017/Nov 2026) 90,000 35 80,000 30 70,000 25 60,000 50,000 As of Nov 06, 2026, 1YR TC rate 20 $/day for 75k DWT Panamax vessel $m stands at $16,875/day 40,000 15 30

Slide 13: Financial Overview
Financial Overview 13
Slide 14: Financial Highlights: Q3 and 9M of 2025 and 2026
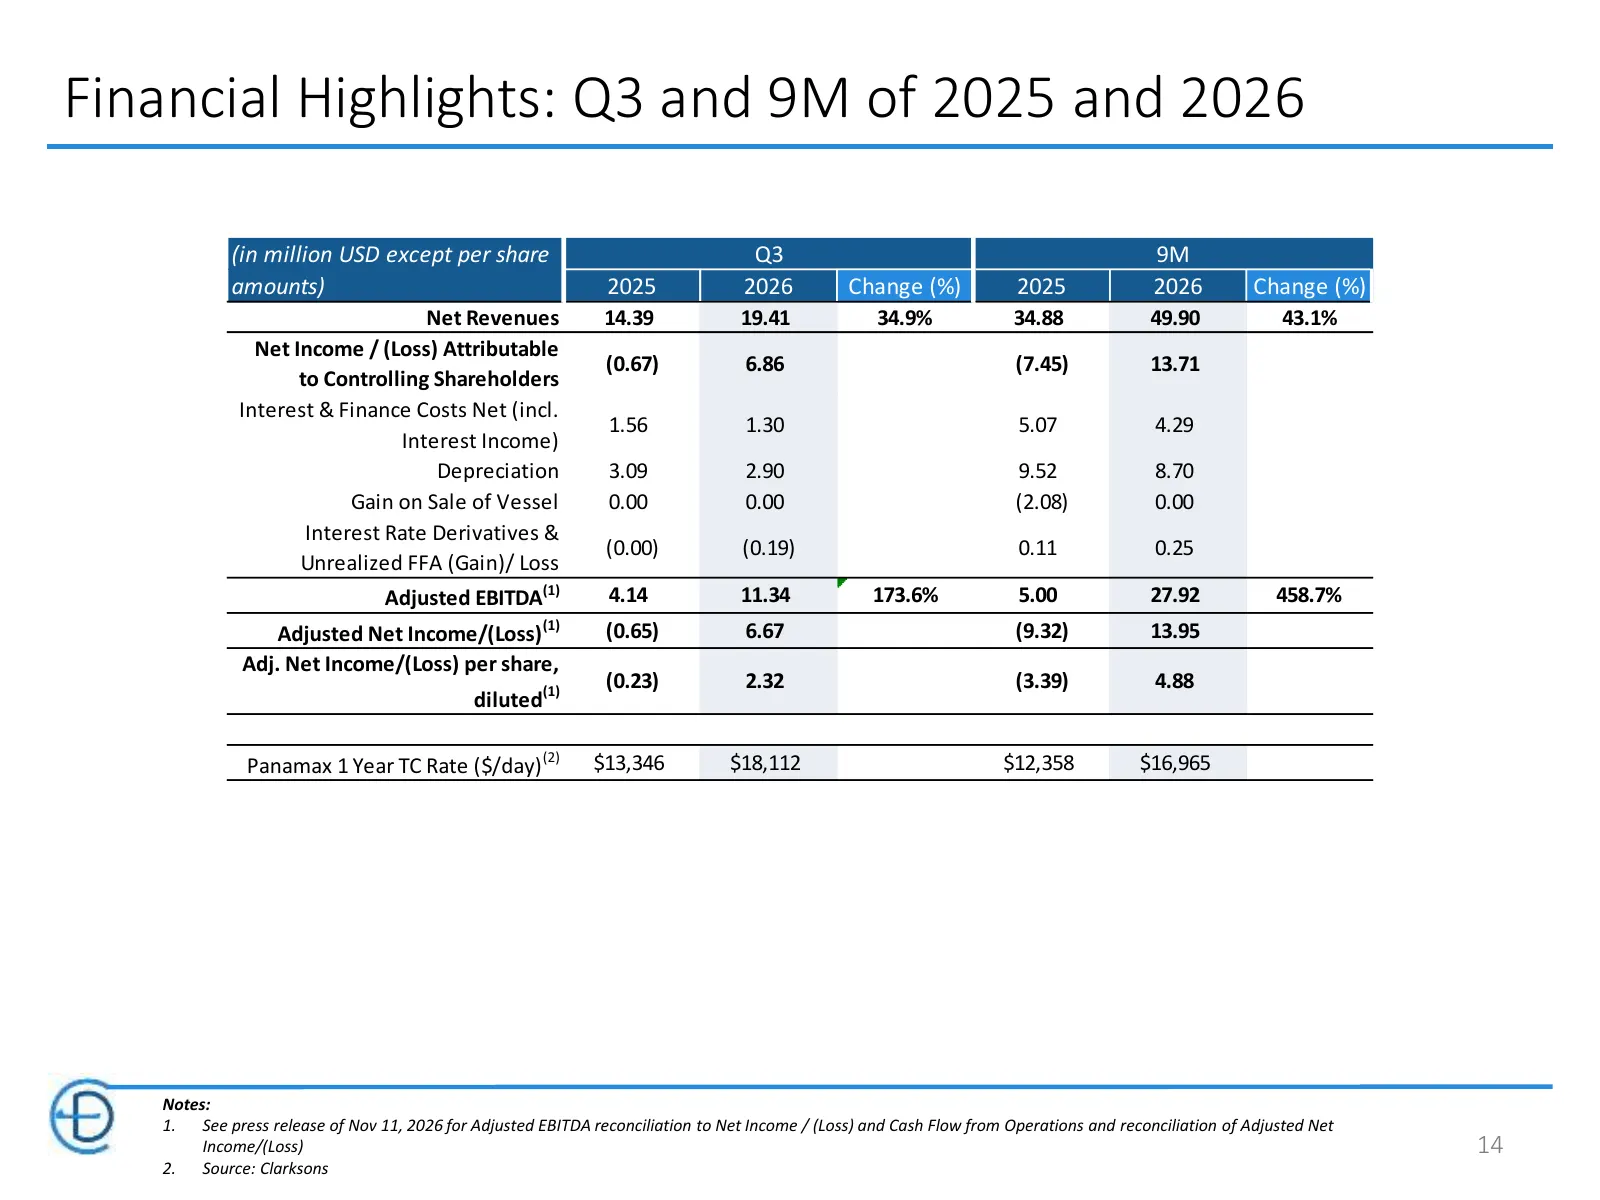
Financial Highlights: Q3 and 9M of 2025 and 2026 (in million USD except per share Q3 9M amounts) 2025 2026 Change (%) 2025 2026 Change (%) Net Revenues 14.39 19.41 34.9% 34.88 49.90 43.1% Net Income / (Loss) Attributable (0.67) 6.86 (7.45) 13.71 to Controlling Shareholders Interest & Finance Costs N
Slide 15: Fleet Data: Q3 and 9M of 2025 and 2026
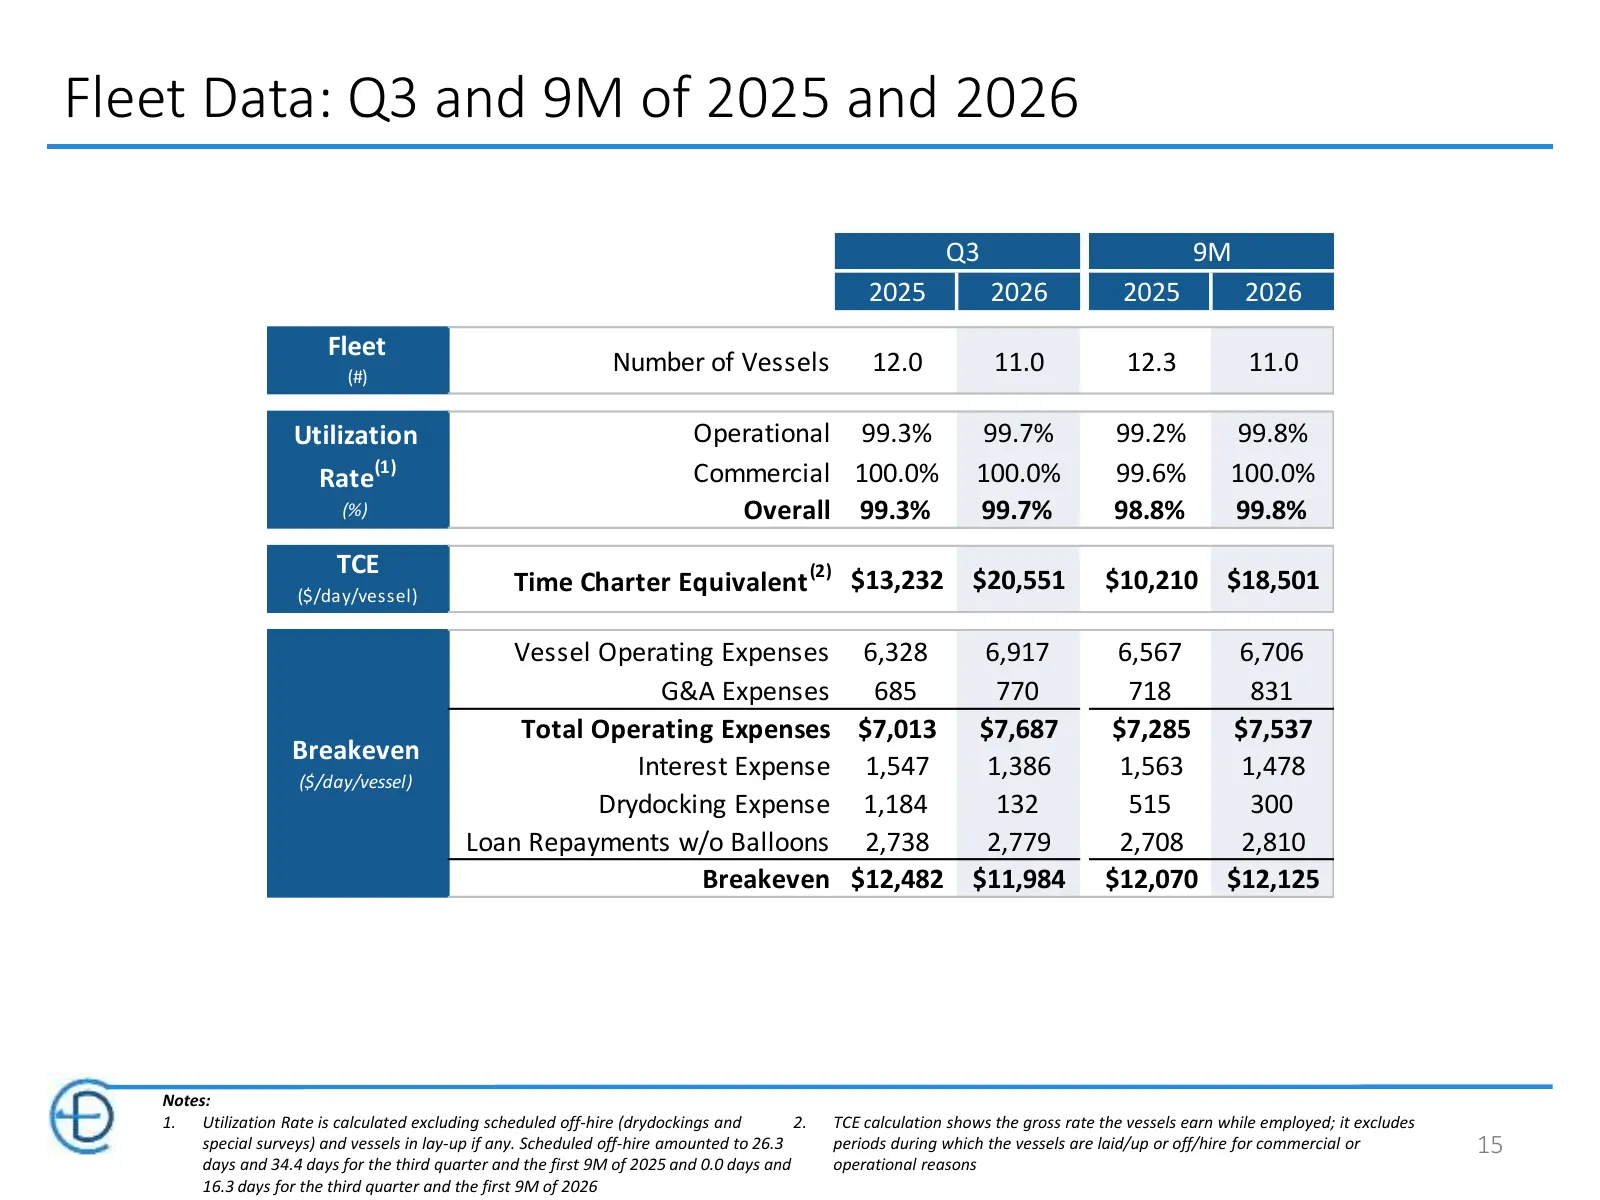
Fleet Data: Q3 and 9M of 2025 and 2026 Q3 9M 2025 2026 2025 2026 Fleet (#) Number of Vessels 12.0 11.0 12.3 11.0 Utilization Operational 99.3% 99.7% 99.2% 99.8% Rate(1) Commercial 100.0% 100.0% 99.6% 100.0% (%) Overall 99.3% 99.7% 98.8% 99.8% TCE (2) ($/day/vessel) Time Charter Equivalent $13,232 $2
Slide 16: Debt Repayment Profile
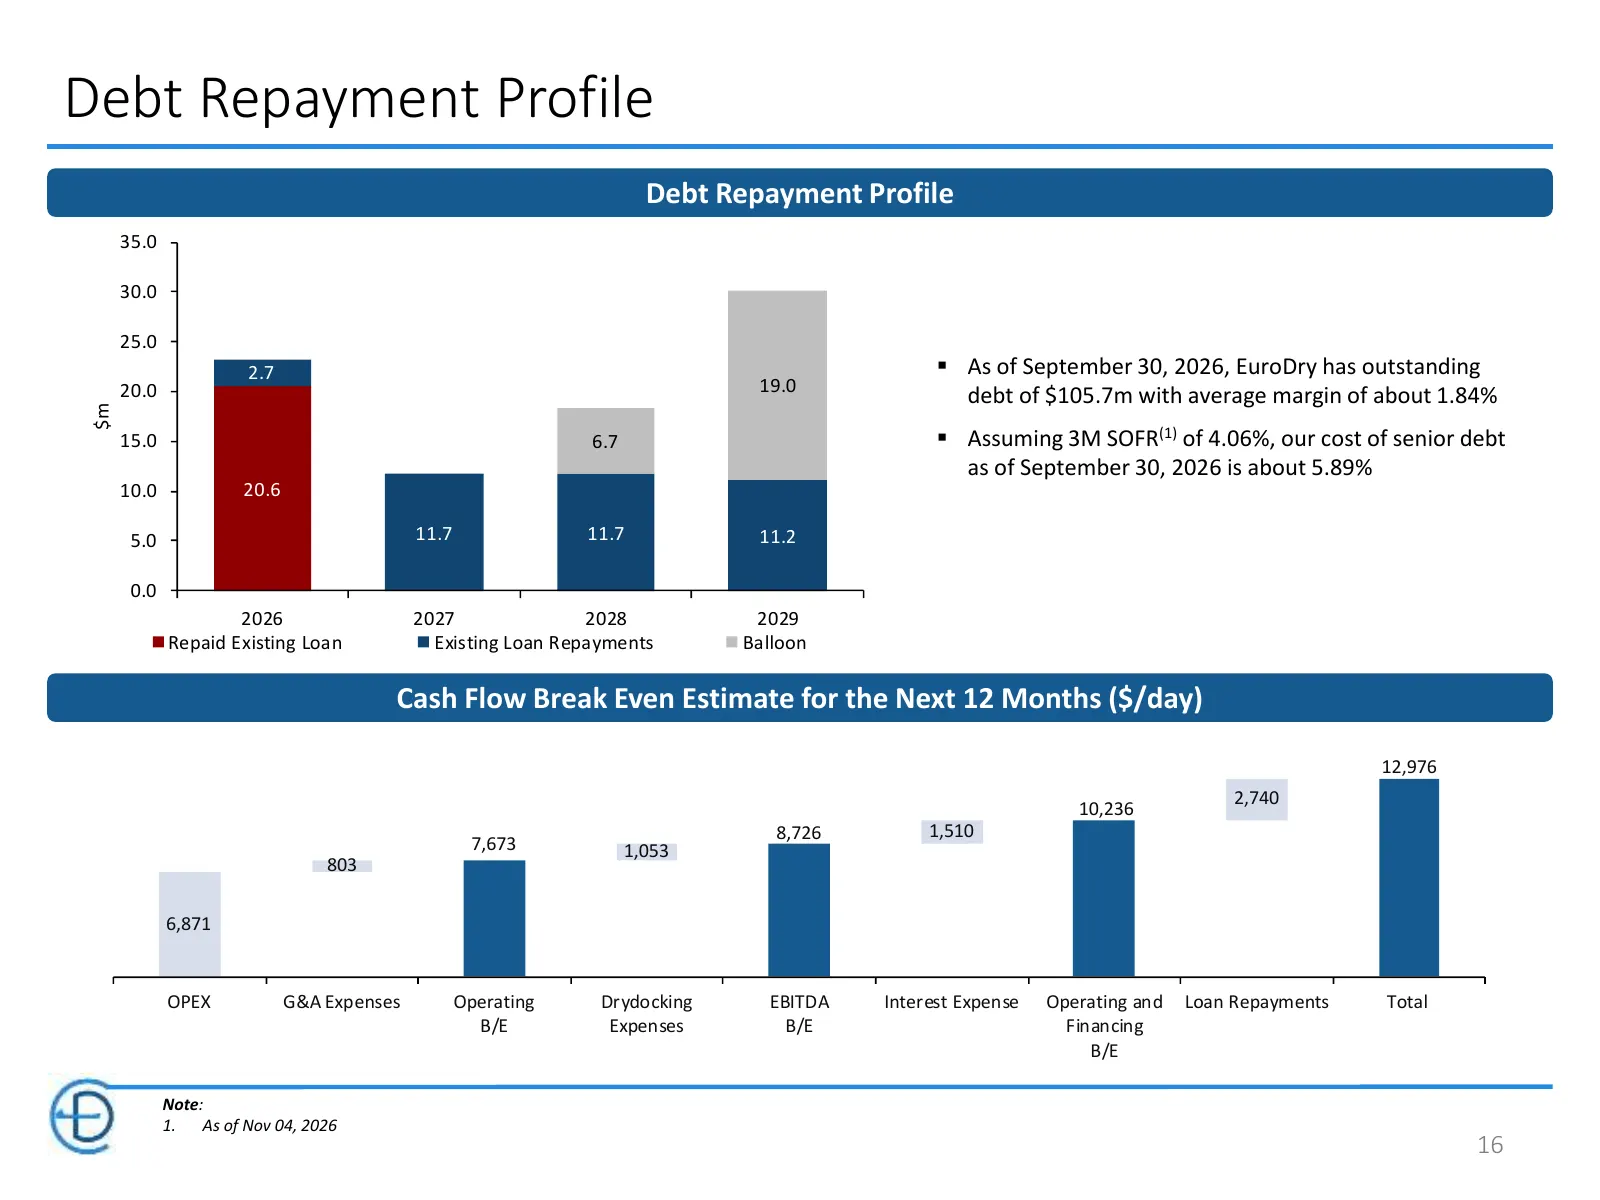
Debt Repayment Profile Debt Repayment Profile 35.0 30.0 25.0 2.7 ▪ As of September 30, 2026, EuroDry has outstanding 20.0 19.0 debt of $105.7m with average margin of about 1.84% $m 15.0 6.7 ▪ Assuming 3Μ SOFR(1) of 4.06%, our cost of senior debt as of September 30, 2026 is about 5.89% 10.0 20.6 5.0
Slide 17: Balance Sheet Highlights
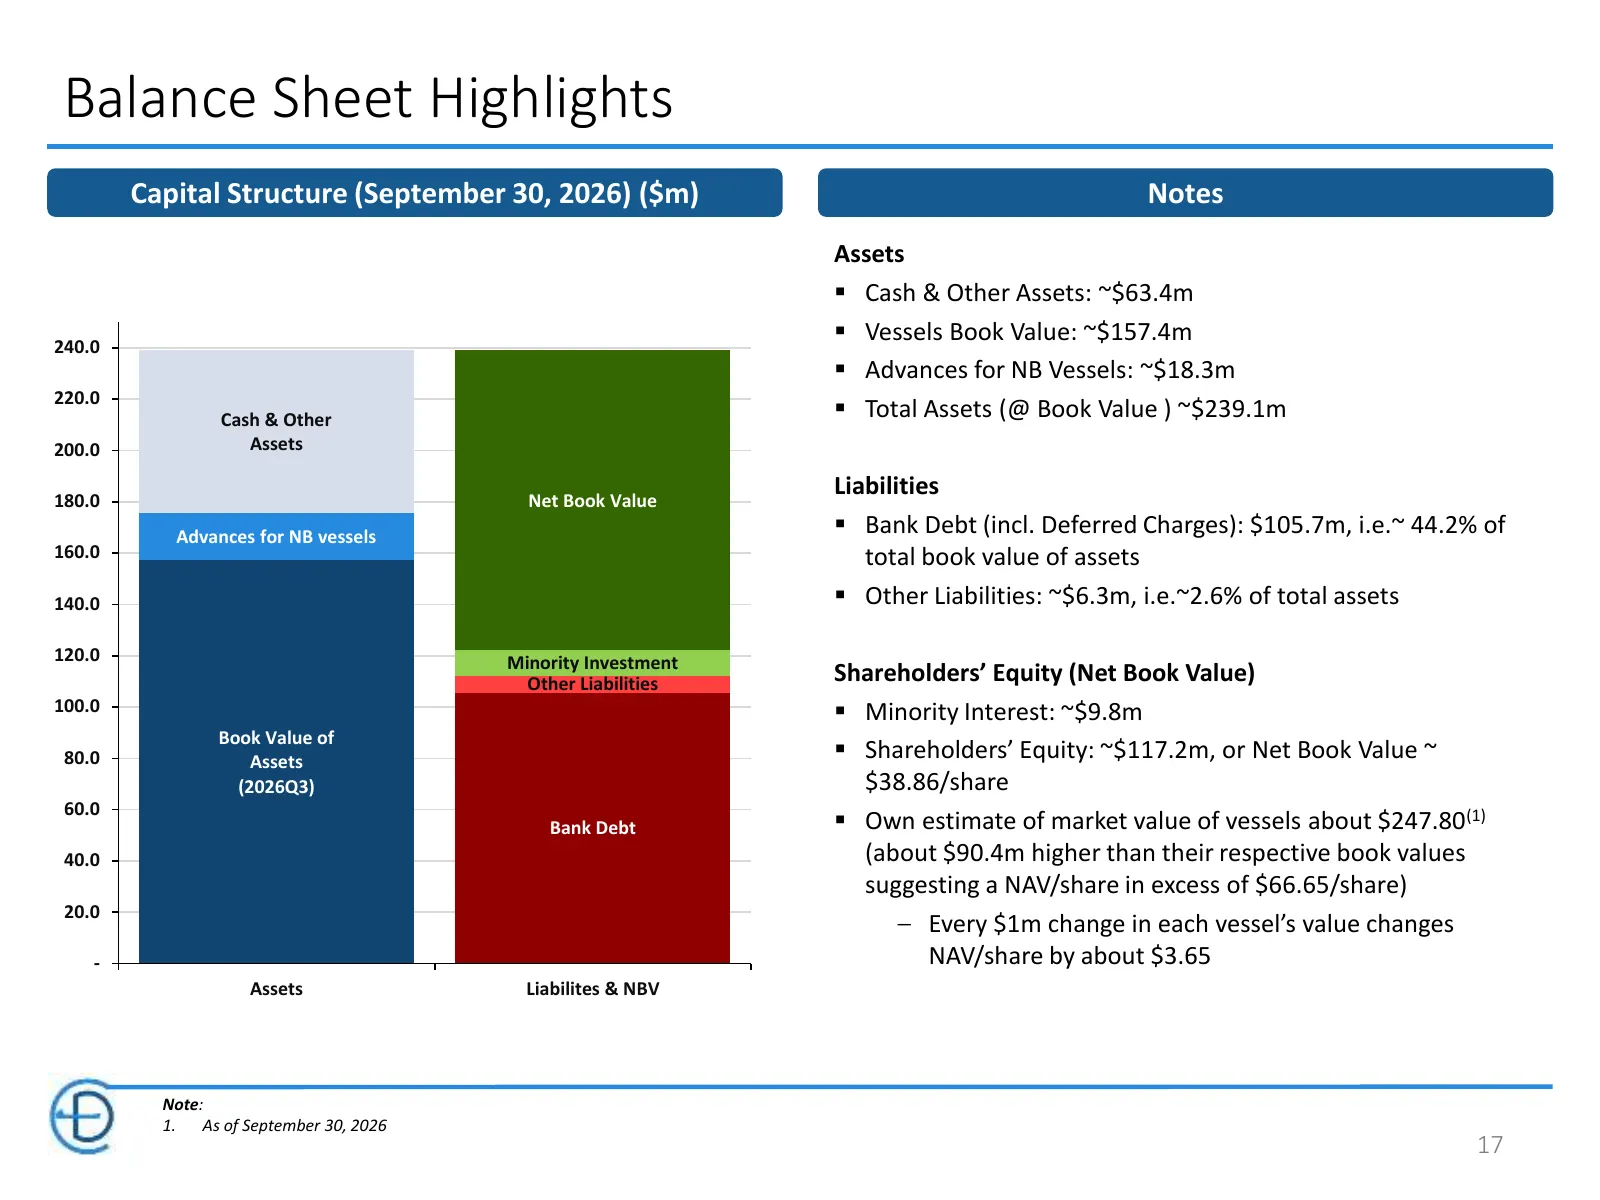
Balance Sheet Highlights Capital Structure (September 30, 2026) ($m) Notes Assets ▪ Cash & Other Assets: ~$63.4m ▪ Vessels Book Value: ~$157.4m 240.0 ▪ Advances for NB Vessels: ~$18.3m 220.0 Cash & Other ▪ Total Assets (@ Book Value ) ~$239.1m 200.0 Assets 180.0 Net Book Value Liabilities Advances f
Slide 18: EuroDry Contacts
EuroDry Contacts EuroDry Ltd. c/o Eurobulk Ltd 4, Messogiou & Evropis Street 151 24 Maroussi, Greece www.eurodry.gr info@eurodry.gr Tel. +30/211/1804005 Fax.+30/211/1804097 Tasos Aslidis Nicolas Bornozis/Markella Kara Chief Financial Officer Investor Relations EuroDry Ltd. Capital Link, Inc. 11 Cant
Source: company website
More decks from EuroDry Ltd.
 Q2 2026 Earnings Presentation20 slides · Aug 6, 2026
 Q1 2026 Earnings Presentation20 slides · May 20, 2026
 Q1 2026 Earnings Presentation6 slides · May 20, 2026
 Q4 2025 Earnings Presentation19 slides · Feb 20, 2026
 Q3 2025 Earnings Presentation19 slides · Nov 13, 2025
 Q2 2025 Earnings Presentation19 slides · Aug 11, 2025