Cytec Industries — Q2 2013 Earnings Presentation
15 slides from Cytec Industries's earnings presentation, Jul 19, 2013
Slide 1: Second Quarter 2013 Earnings Review
Second Quarter 2013 Earnings Review July 19, 2013 Shane Fleming – Chairman, President and CEO Dave Drillock – Vice President and CFO
Slide 2: Forward Looking Statement
Forward Looking Statement During the course of this meeting we may make forward‐looking statements. All statements that address expectations or projections about the future are forward‐looking statements. Some of these statements include words such as “expects”, “anticipates,” “plans,” “intends,” “p
Slide 3: Results Overview
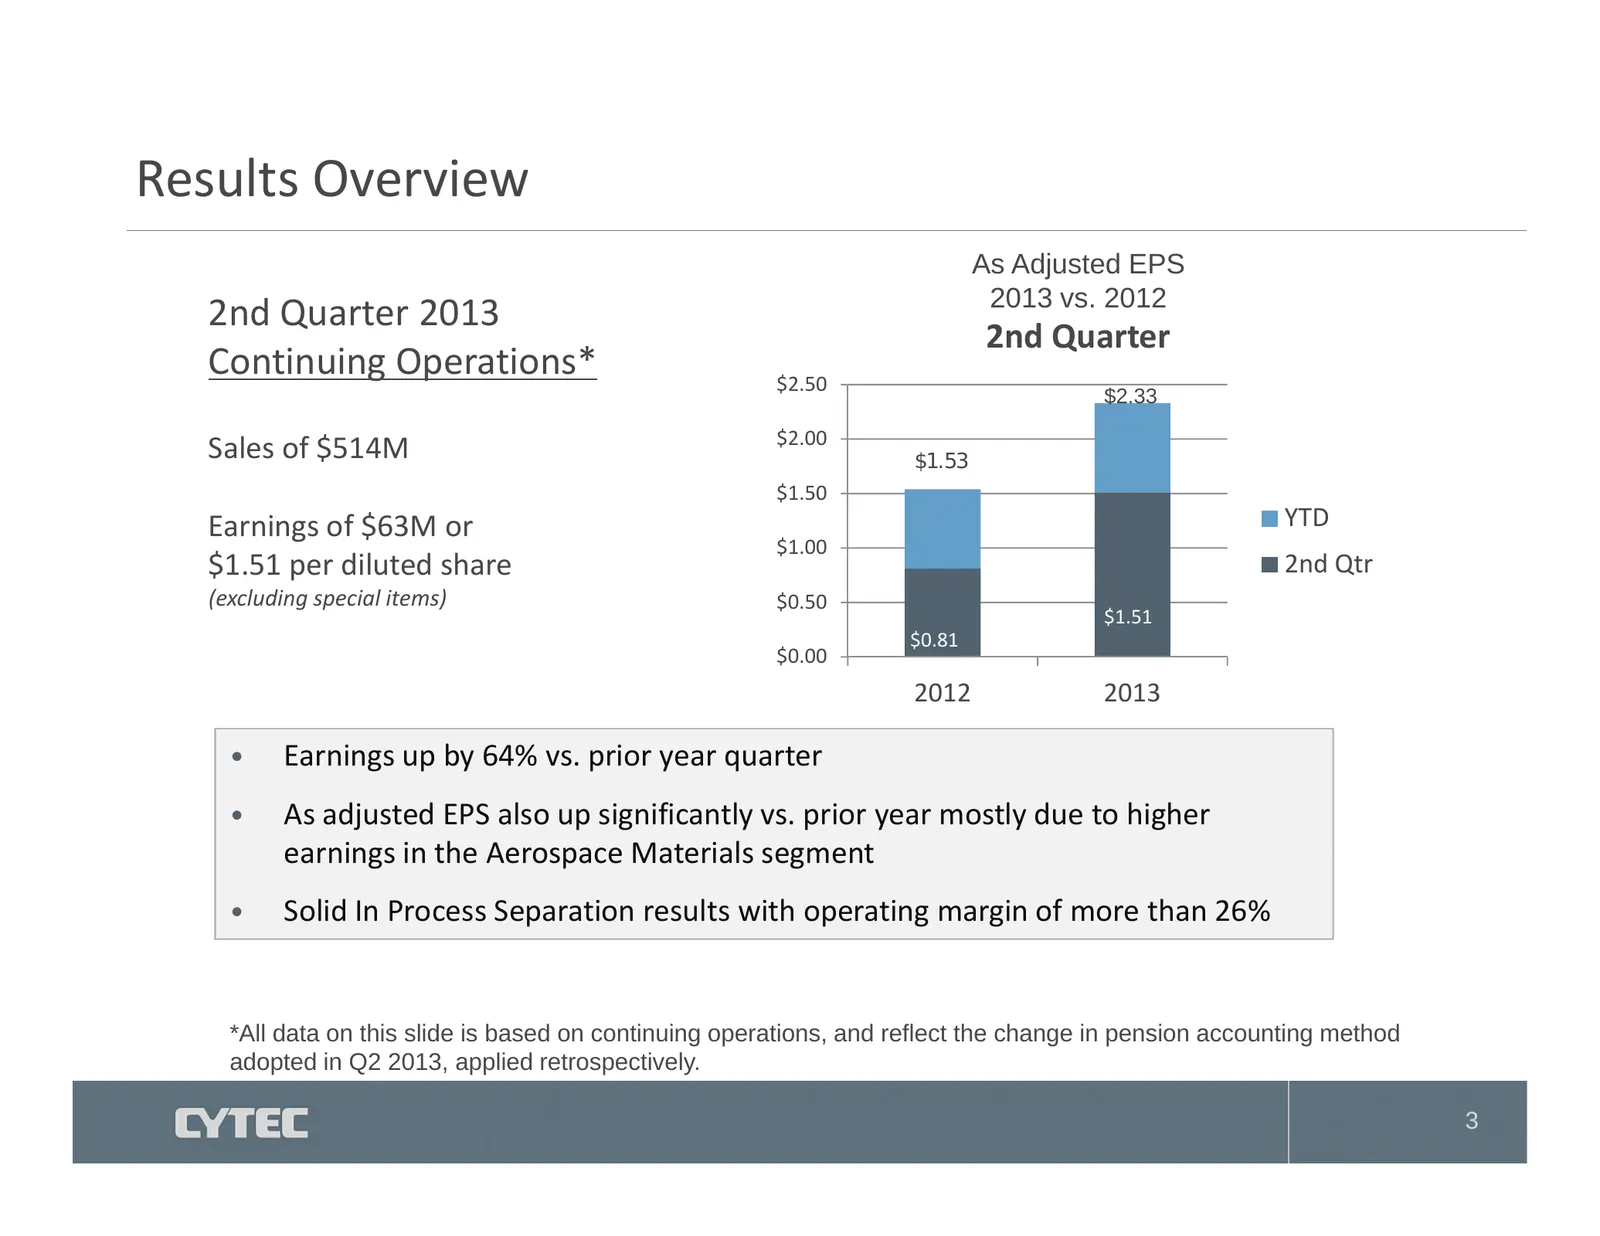
Results Overview As Adjusted EPS 2013 vs. 2012 2nd Quarter 2013 2nd Quarter Continuing Operations* $2 50 $2.50 $2.33 $2.00 Sales of $514M $1.53 $1.50 Earnings g of $63M $ or YTD $ $1.00 $1.51 per diluted share 2nd Qtr (excluding special items) $0.50 $1.51 $0.81 $0.00 2012 2013 • Earnings up by 64% v
Slide 4: Business Segment Results – Aerospace Materials
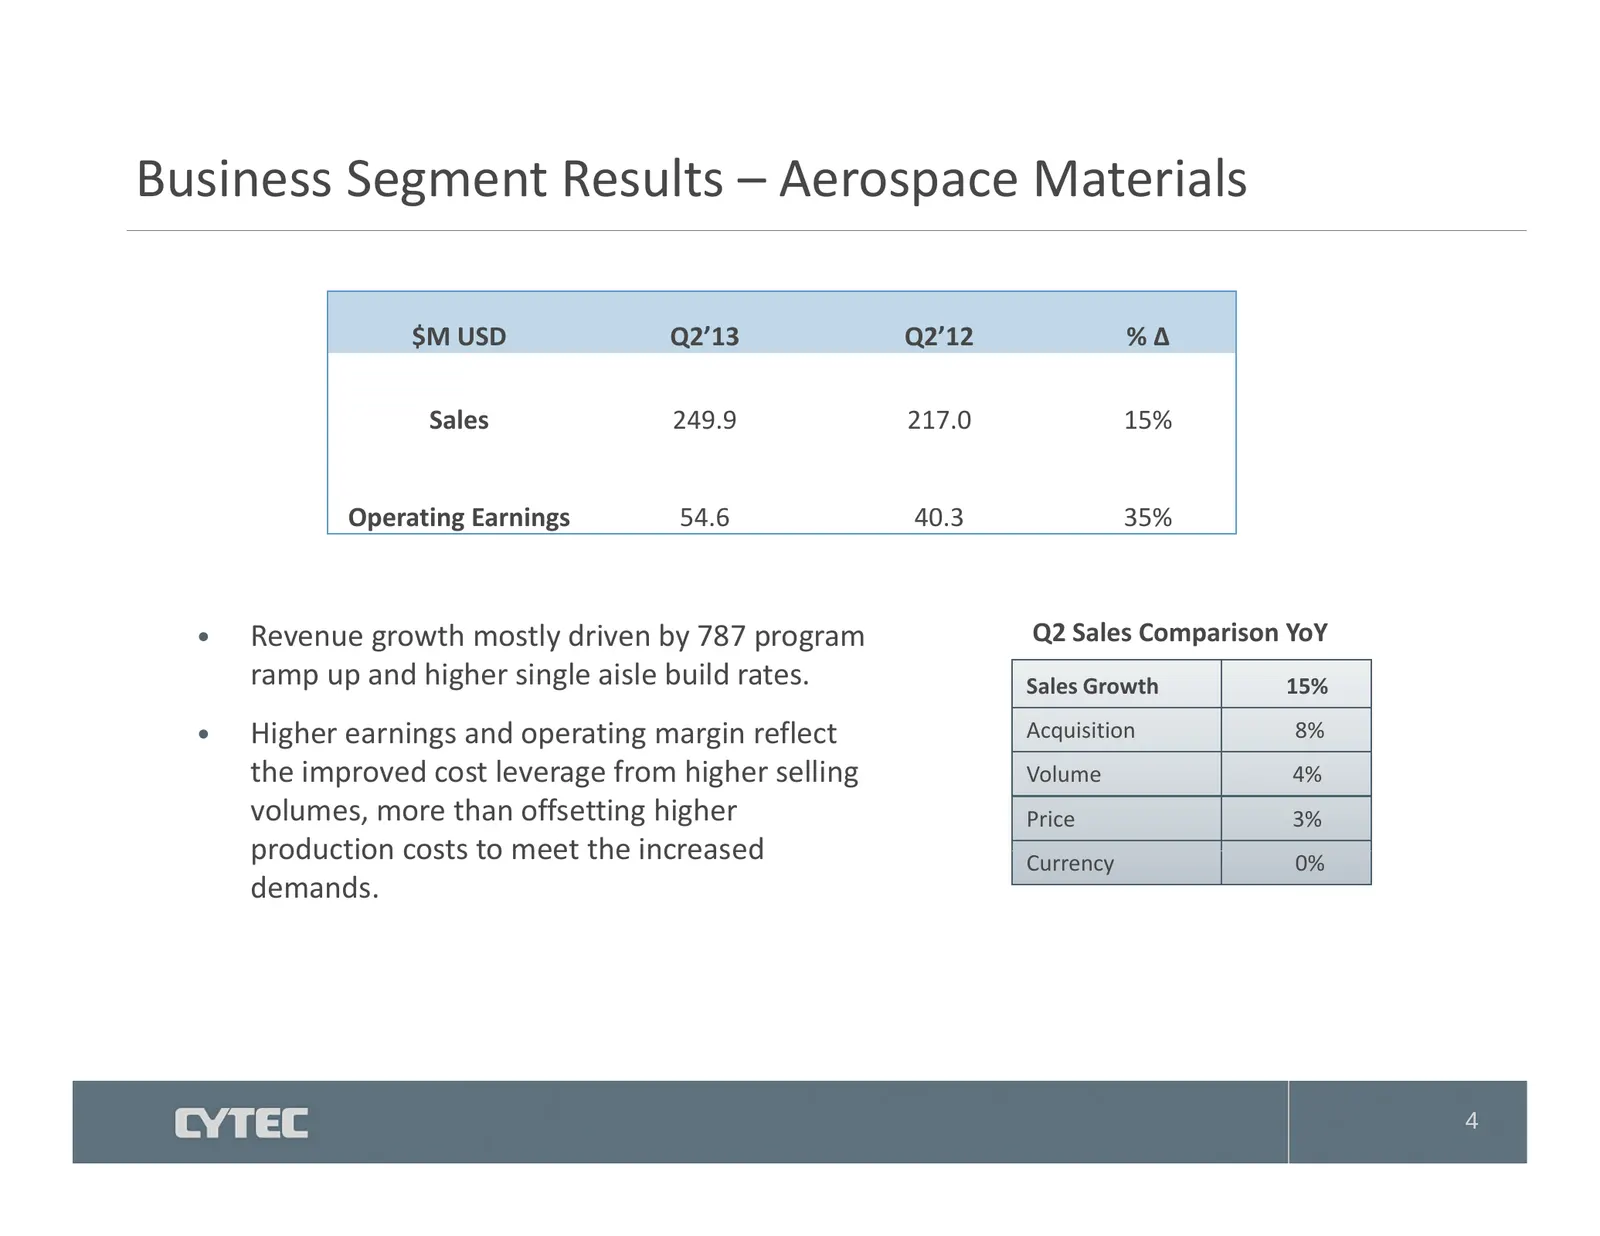
Business Segment Results – Aerospace Materials $M USD Q2’13 Q2’12 %Δ Sales 249.9 217.0 15% Operating Earnings 54.6 40.3 35% • Revenue growth mostly driven by 787 program Q2 Sales Comparison YoY ramp up and higher single aisle build rates. Sales Growth 15% • Higher earnings and operating margin refle
Slide 5: Business Segment Results – Industrial Materials
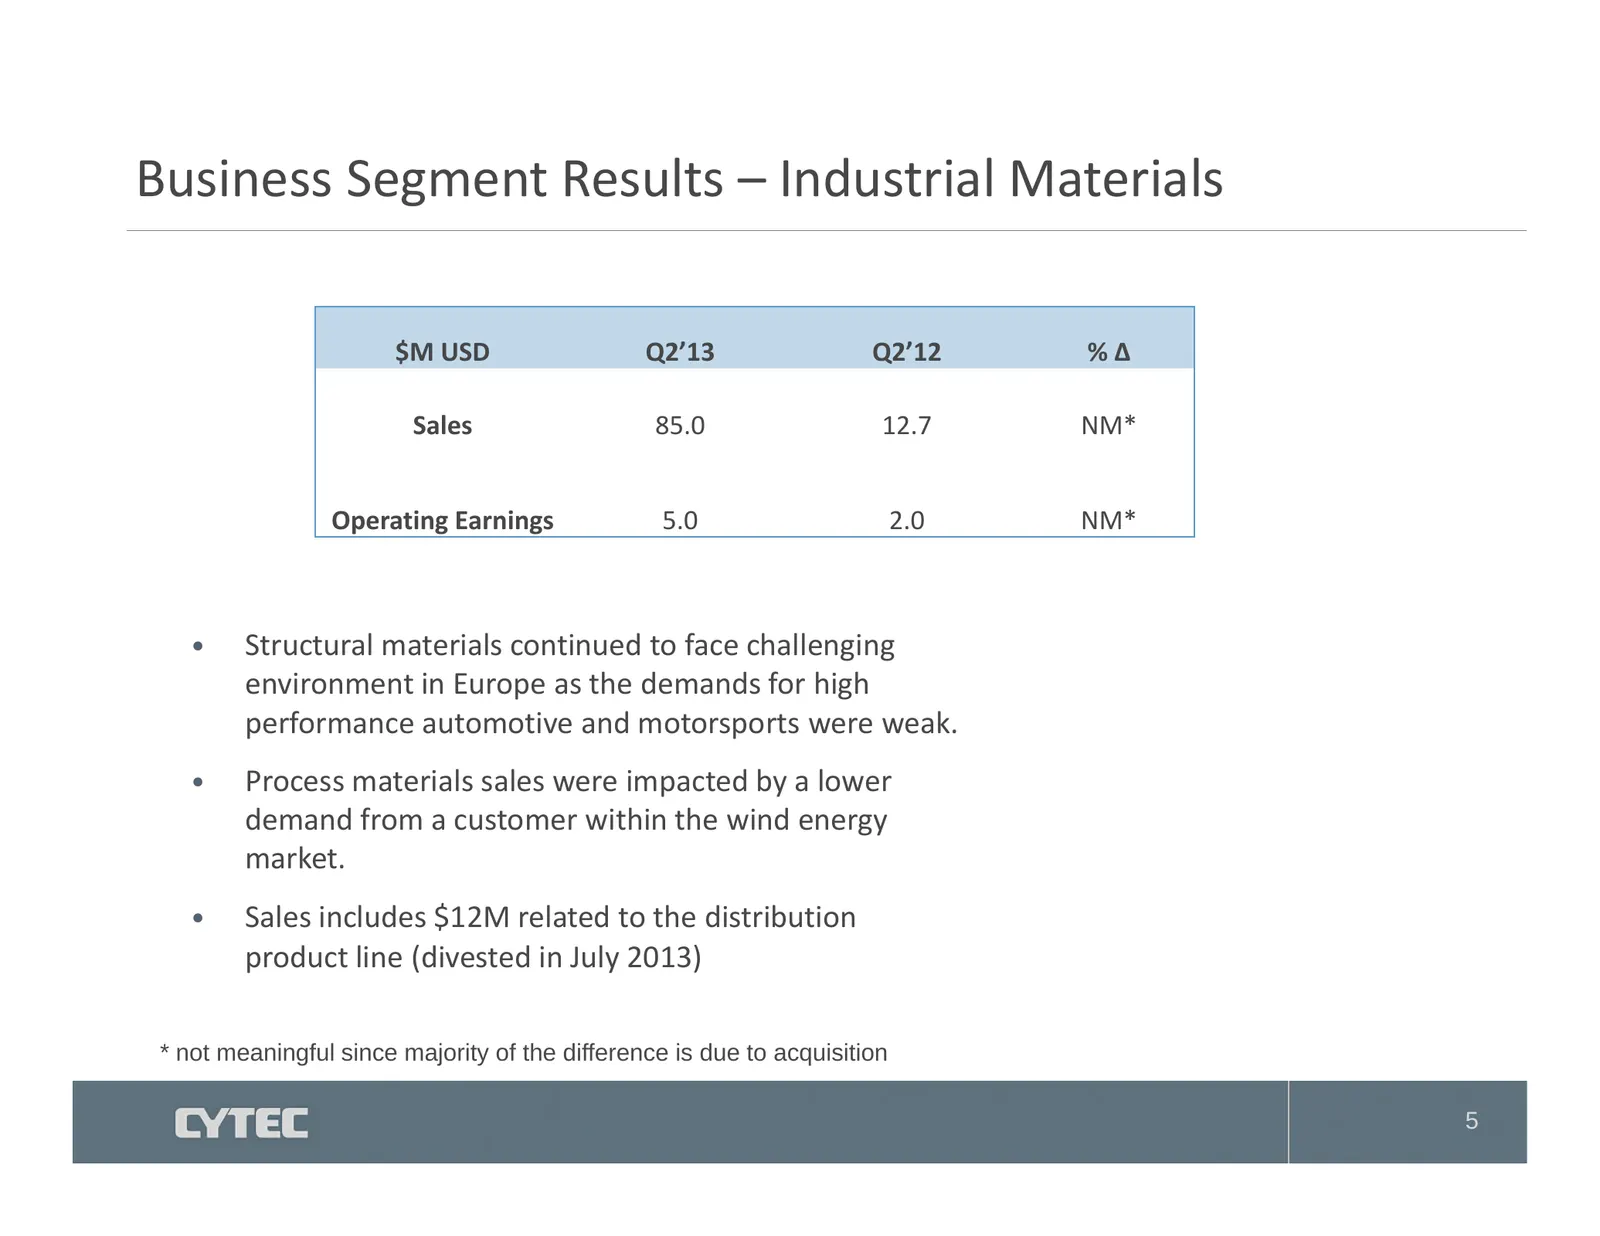
Business Segment Results – Industrial Materials $M USD Q2’13 Q2’12 %Δ Sales 85.0 12.7 NM* Operating Earnings 5.0 2.0 NM* • Structural materials continued to face challenging environment in Europep as the demands for highg performance automotive and motorsports were weak. • Process materials sales we
Slide 6: Business Segment Results – In Process Separation
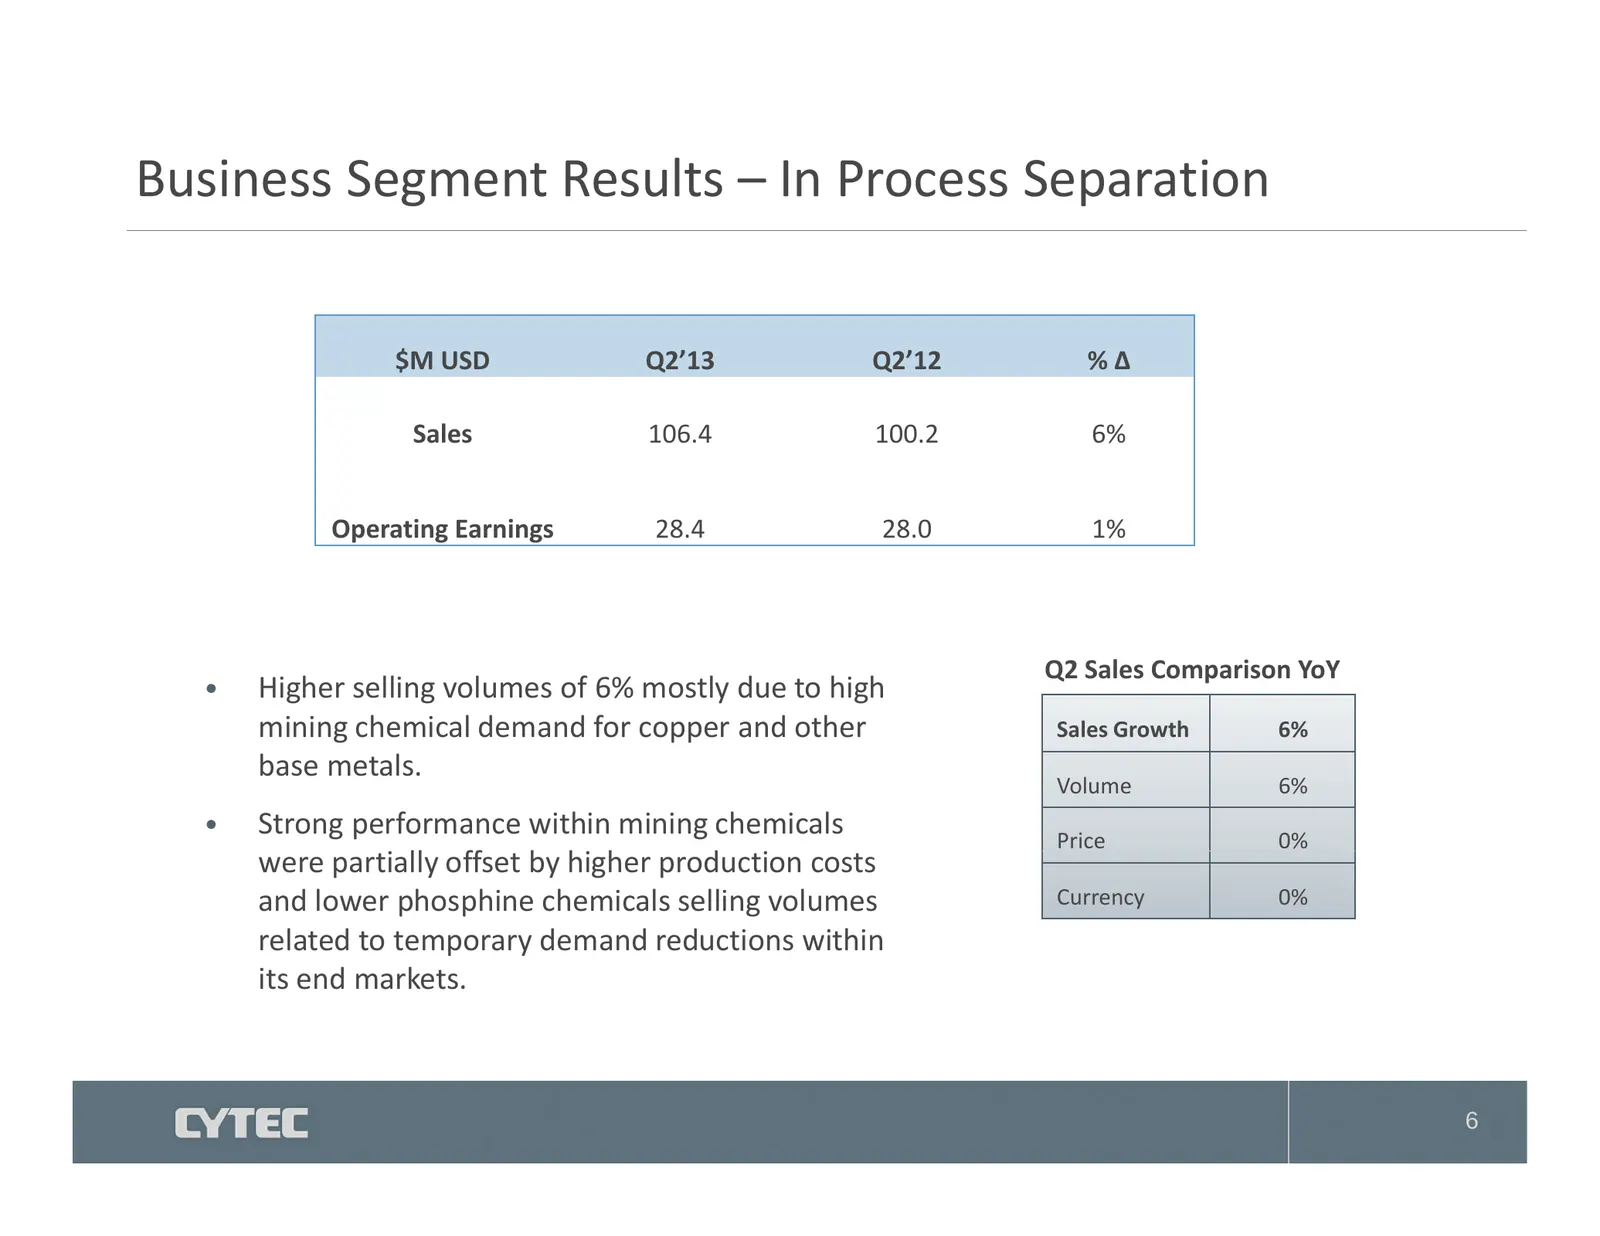
Business Segment Results – In Process Separation $M USD Q2’13 Q2’12 %Δ Sales 106.4 100.2 6% Operating p g Earnings g 28.4 28.0 1% Q2 Sales Comparison YoY • Higher selling volumes of 6% mostly due to high mining chemical demand for copper and other Sales Growth 6% base metals. Volume 6% • Strong perf
Slide 7: Business Segment Results – Additive Technologies
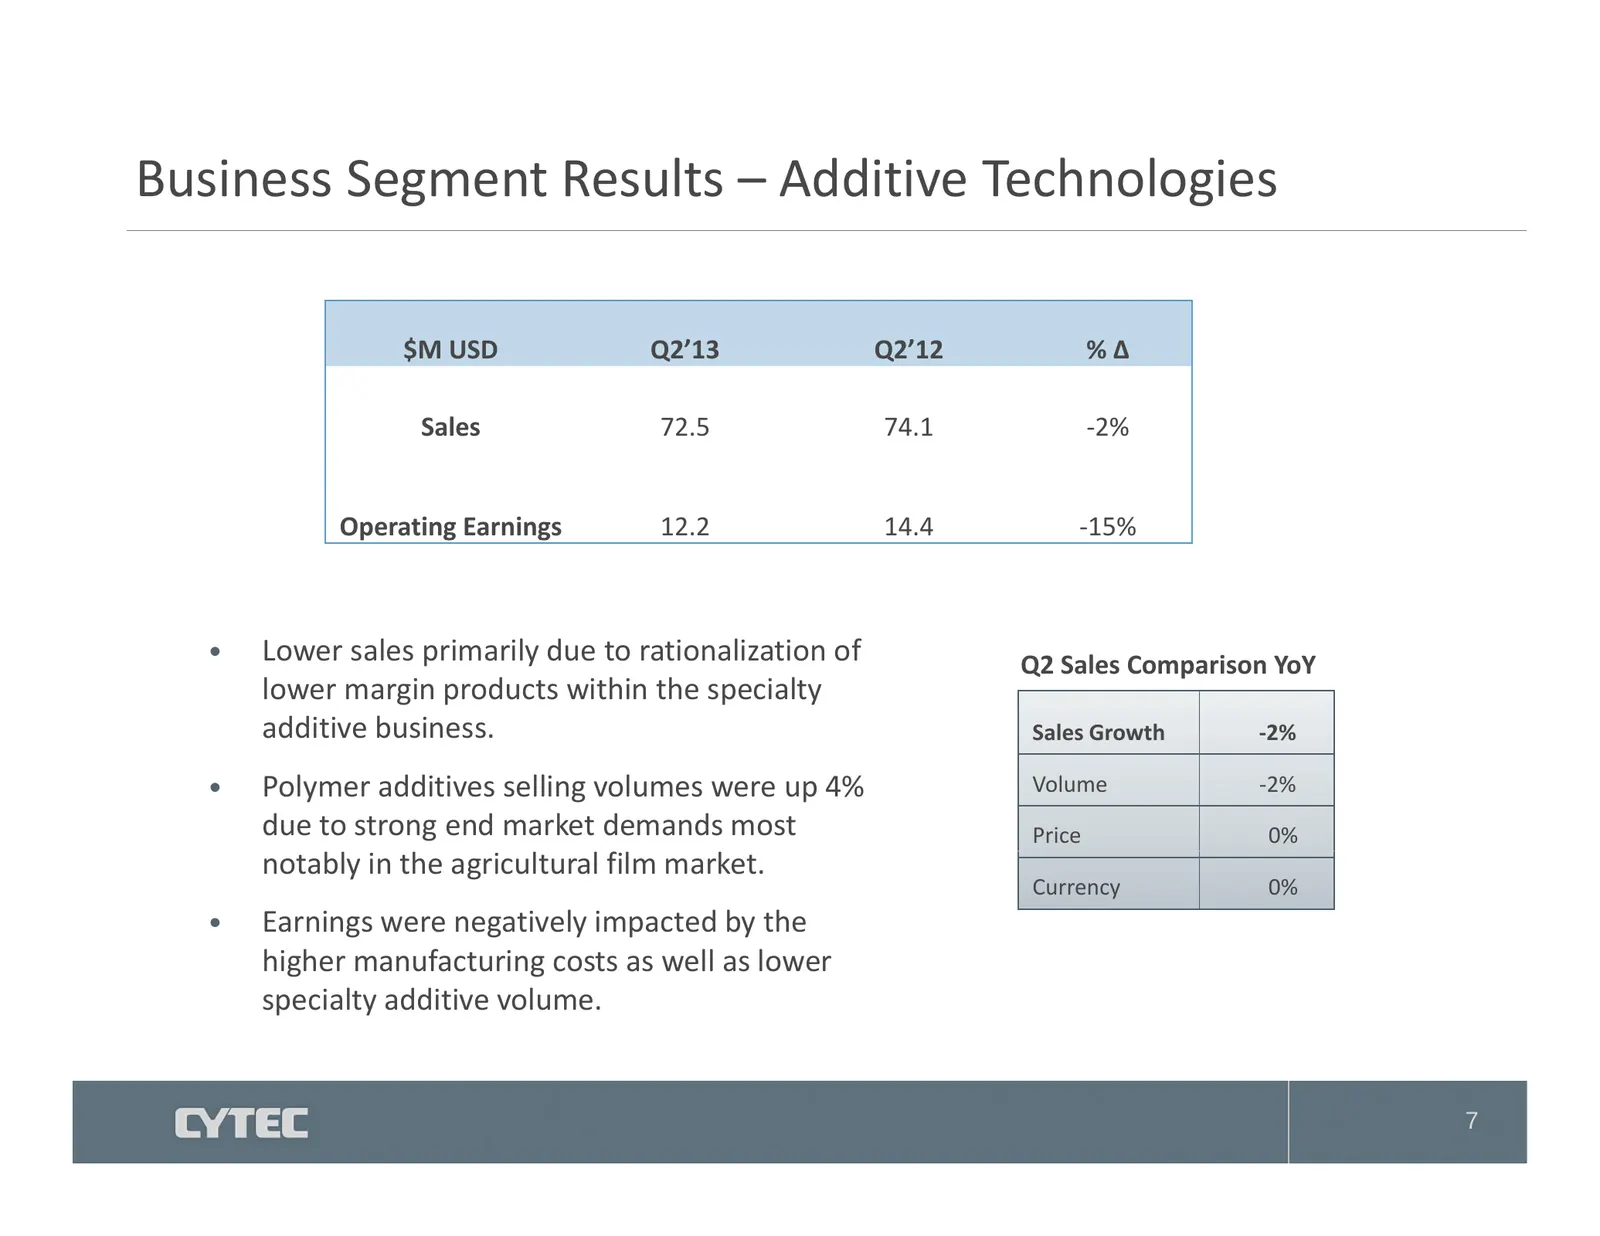
Business Segment Results – Additive Technologies $M USD Q2’13 Q2’12 %Δ Sales 72.5 74.1 ‐2% p g Earnings Operating g 12.2 14.4 ‐15% • Lower sales primarily due to rationalization of Q2 Sales Comparison YoY lower margin products within the specialty additive business. Sales Growth ‐2% • Polymer additi
Slide 8: Special Items – Second Quarter 2013
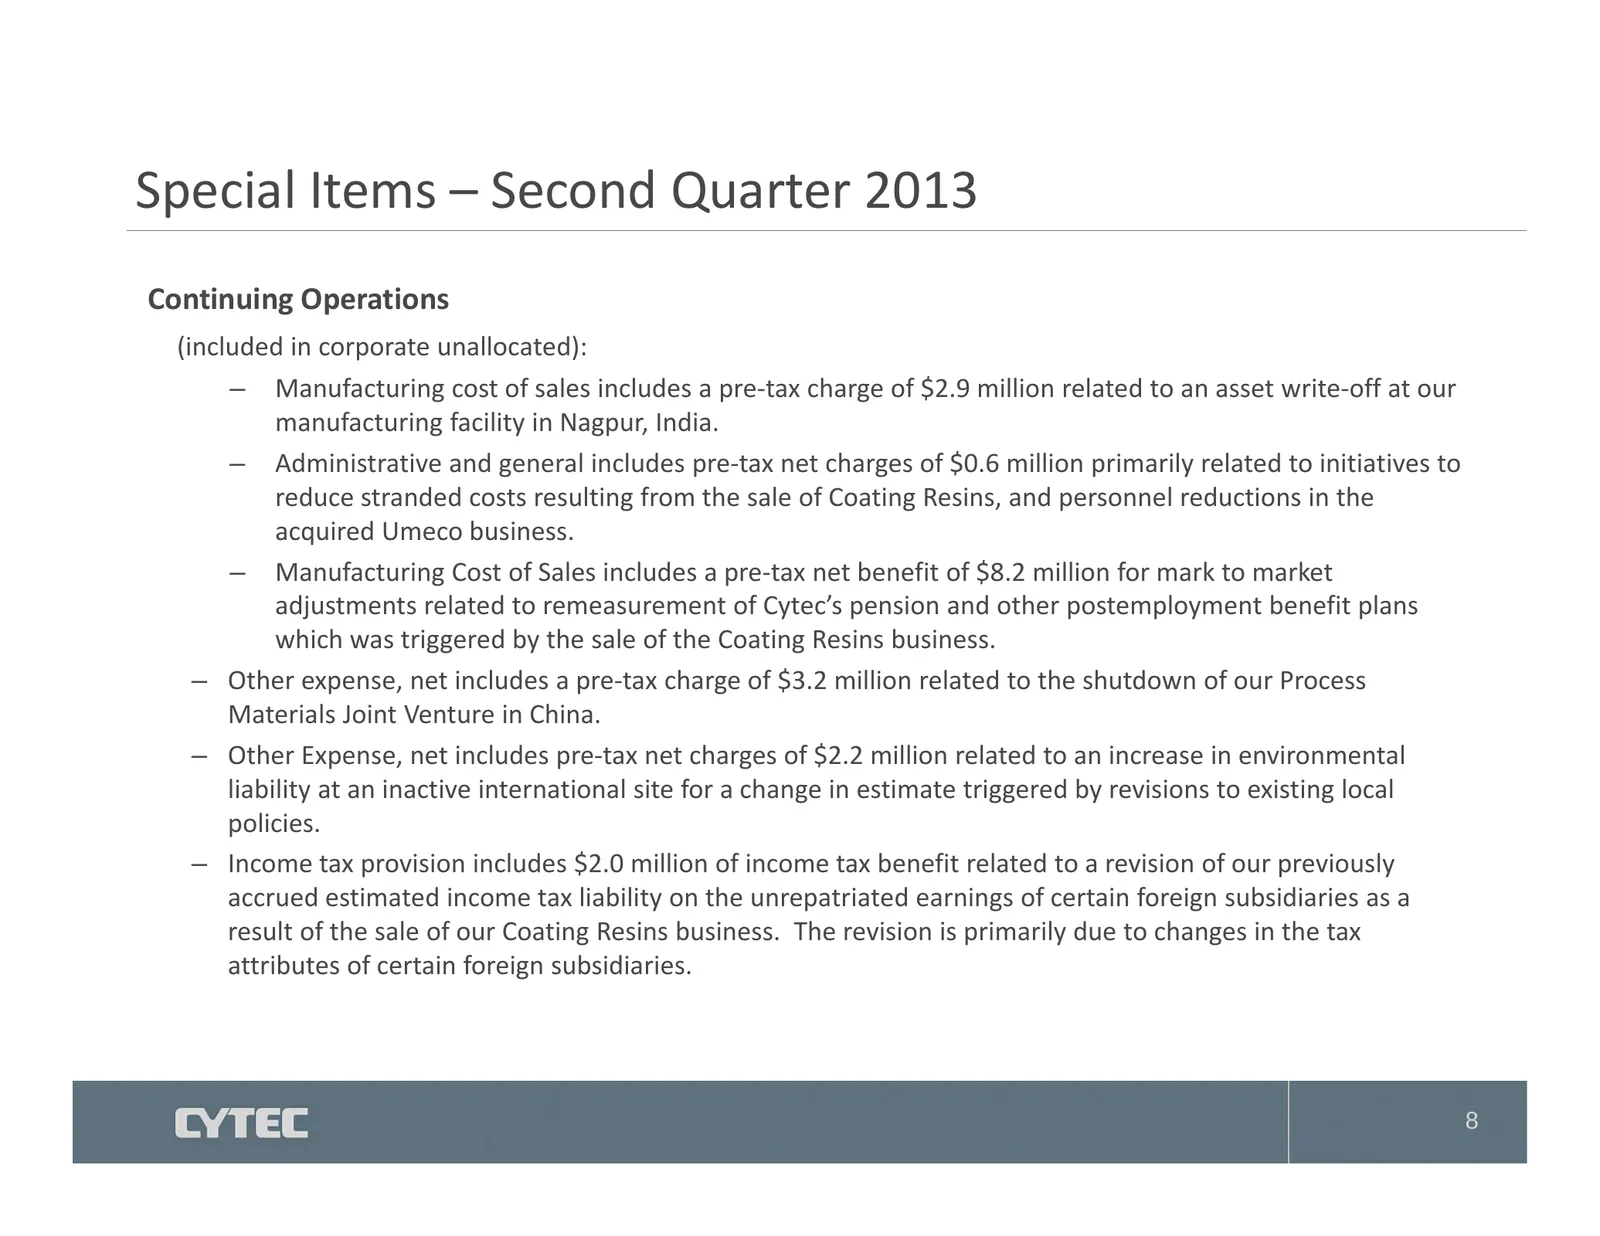
Special Items – Second Quarter 2013 Continuing Operations (included in corporate unallocated): – Manufacturing M f t i costt off sales l iincludes l d a pre‐taxt charge h off $2.9 $2 9 million illi related l t d to t an assett write‐off it ff att our manufacturing facility in Nagpur, India. – Admini
Slide 9: Financial Results – Second Quarter 2013
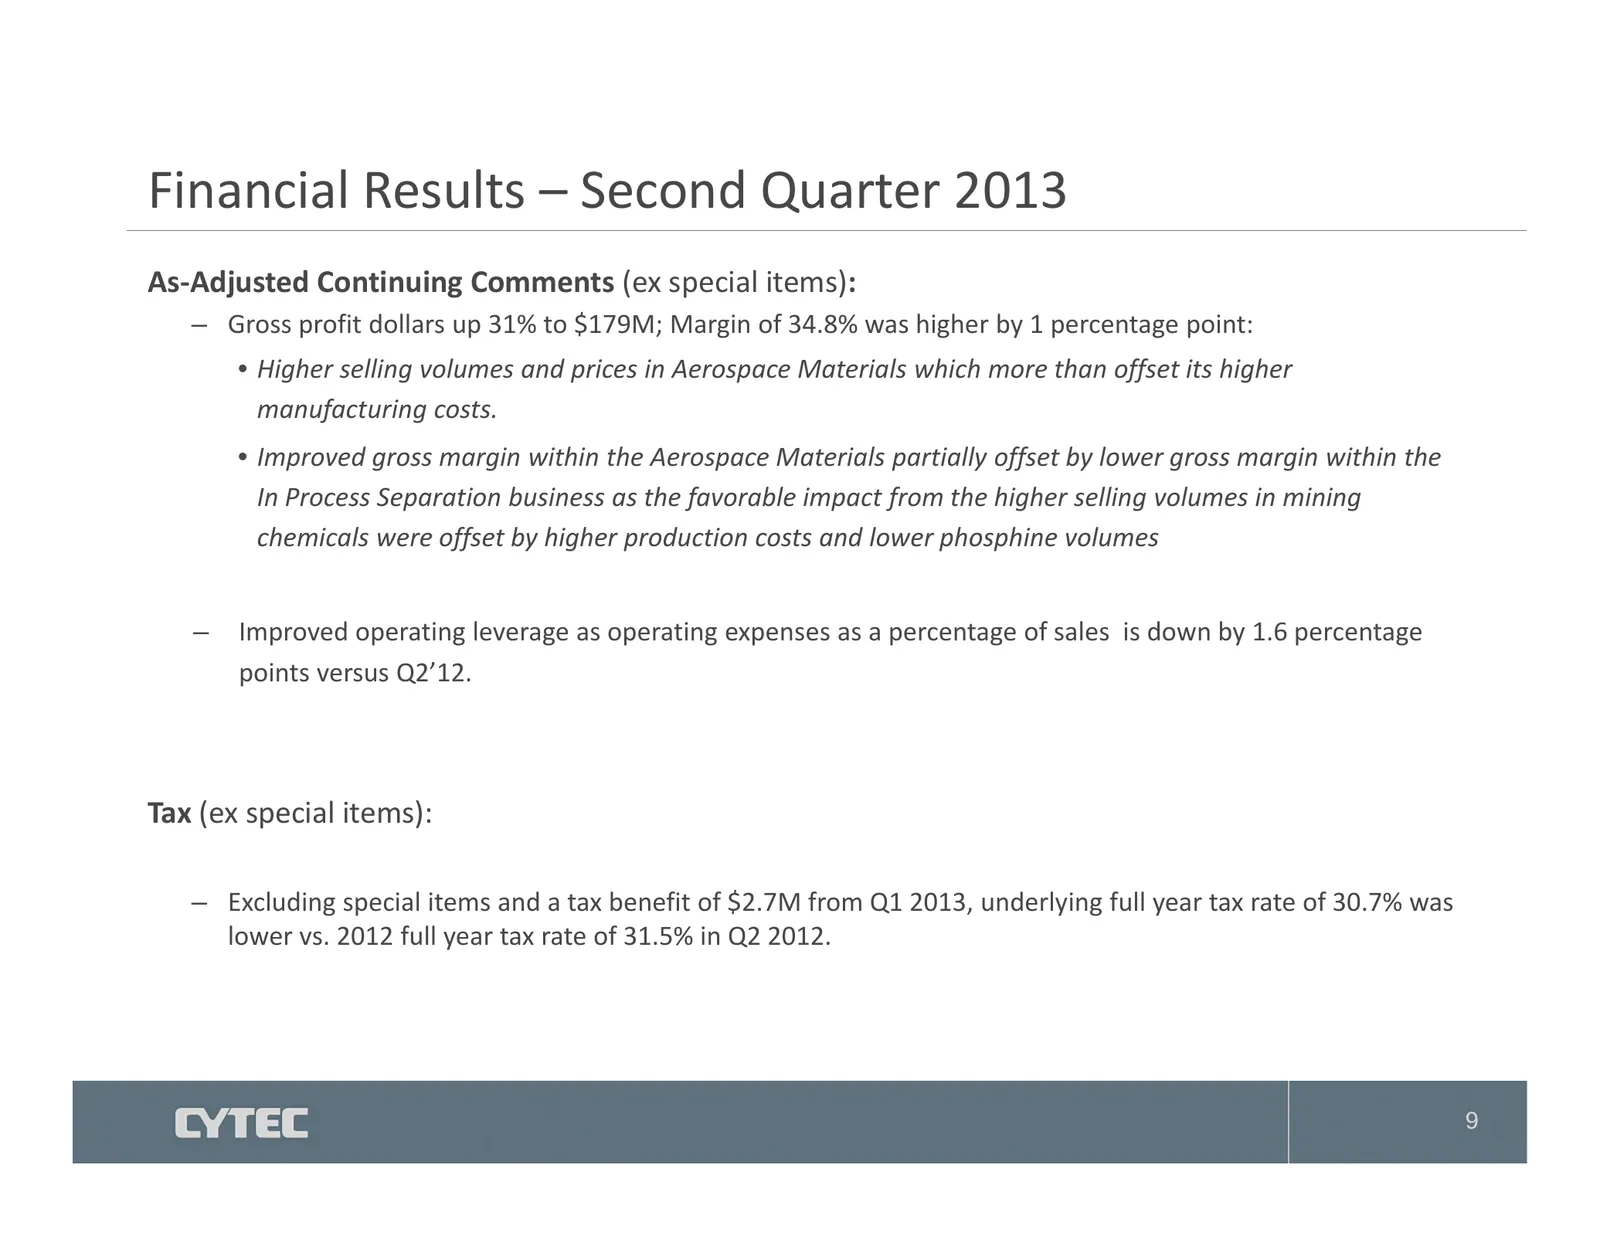
Financial Results – Second Quarter 2013 As‐Adjusted Continuing Comments (ex special items): – Gross profit dollars up 31% to $179M; Margin of 34.8% was higher by 1 percentage point: • Higher selling volumes and prices in Aerospace Materials which more than offset its higher manufacturing costs. • Im
Slide 10: Cash Flow (continuing only)
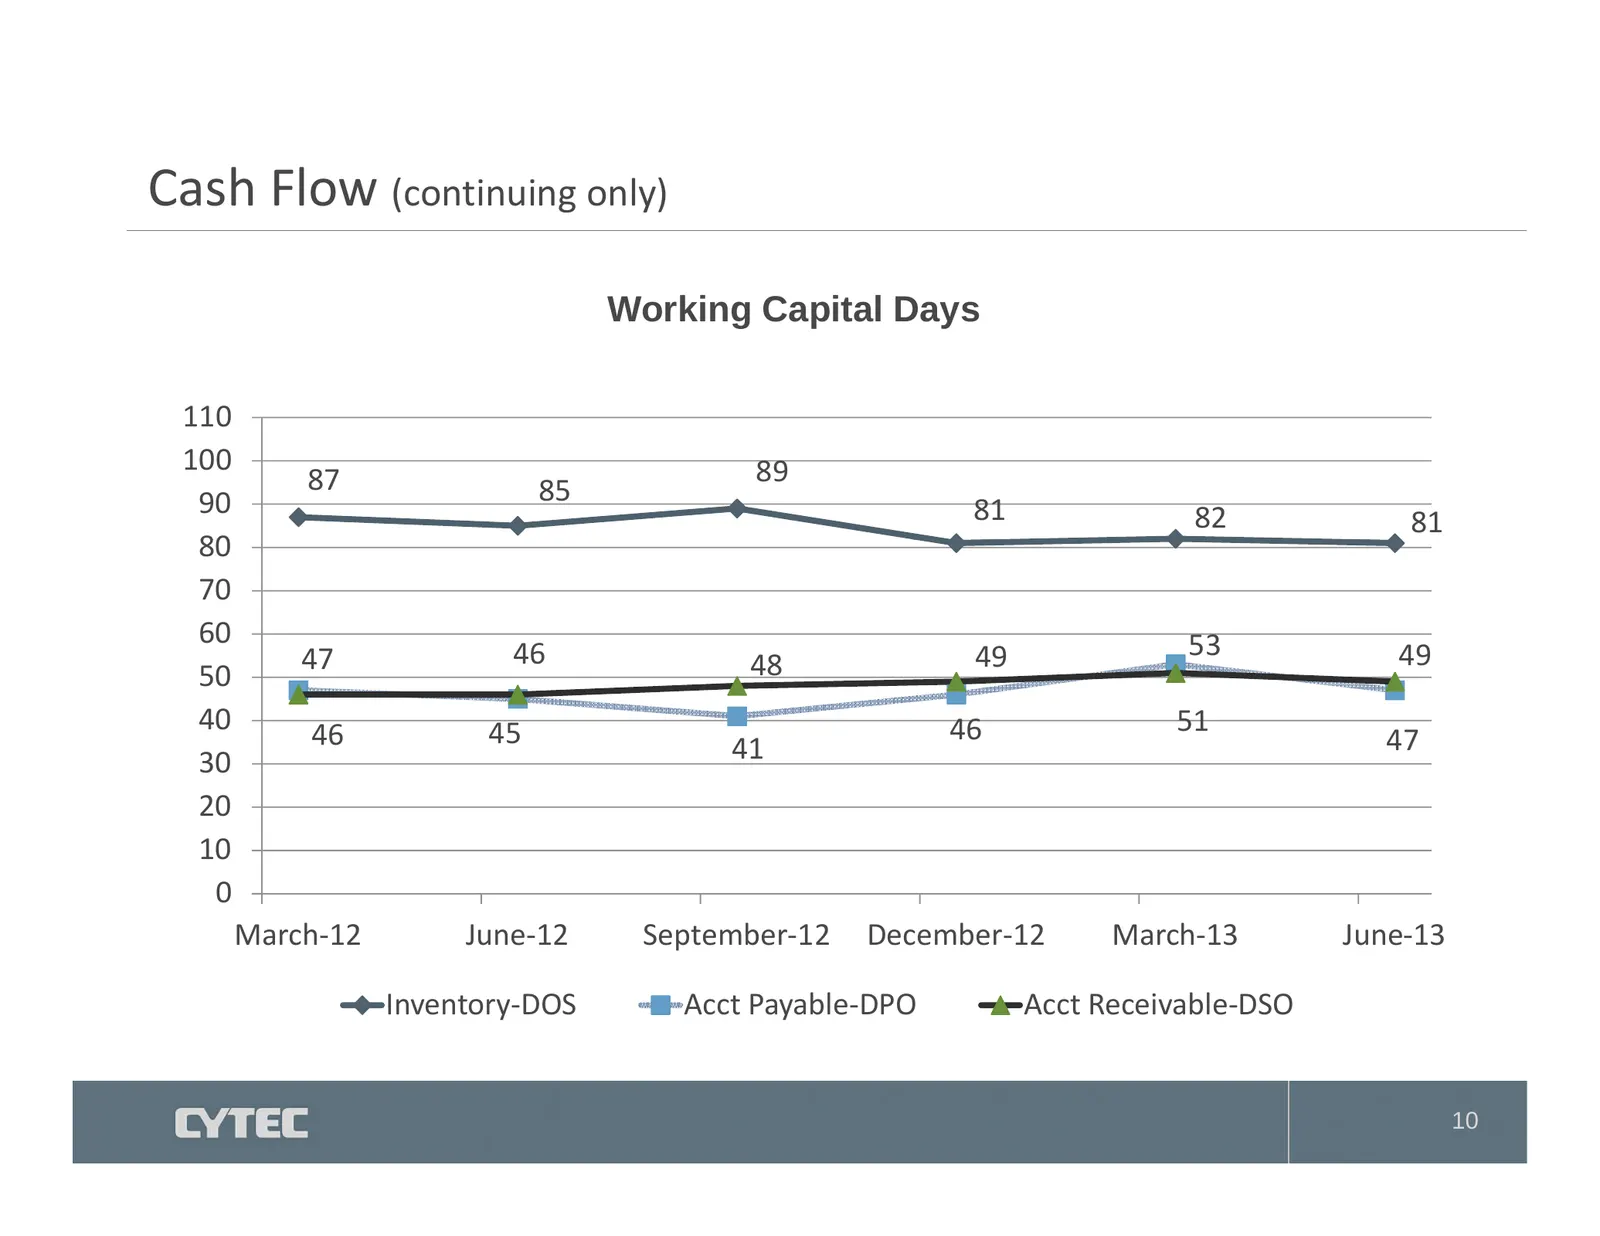
Cash Flow (continuing only) Working Capital Days 110 100 89 87 85 90 81 82 81 80 70 60 53 47 46 48 49 49 50 40 46 45 46 51 41 47 30 20 10 0 March‐12 June‐12 September‐12 December‐12 March‐13 June‐13 Inventory‐DOS Acct Payable‐DPO Acct Receivable‐DSO 10
Slide 11: Balance Sheet – Maintaining Liquidity
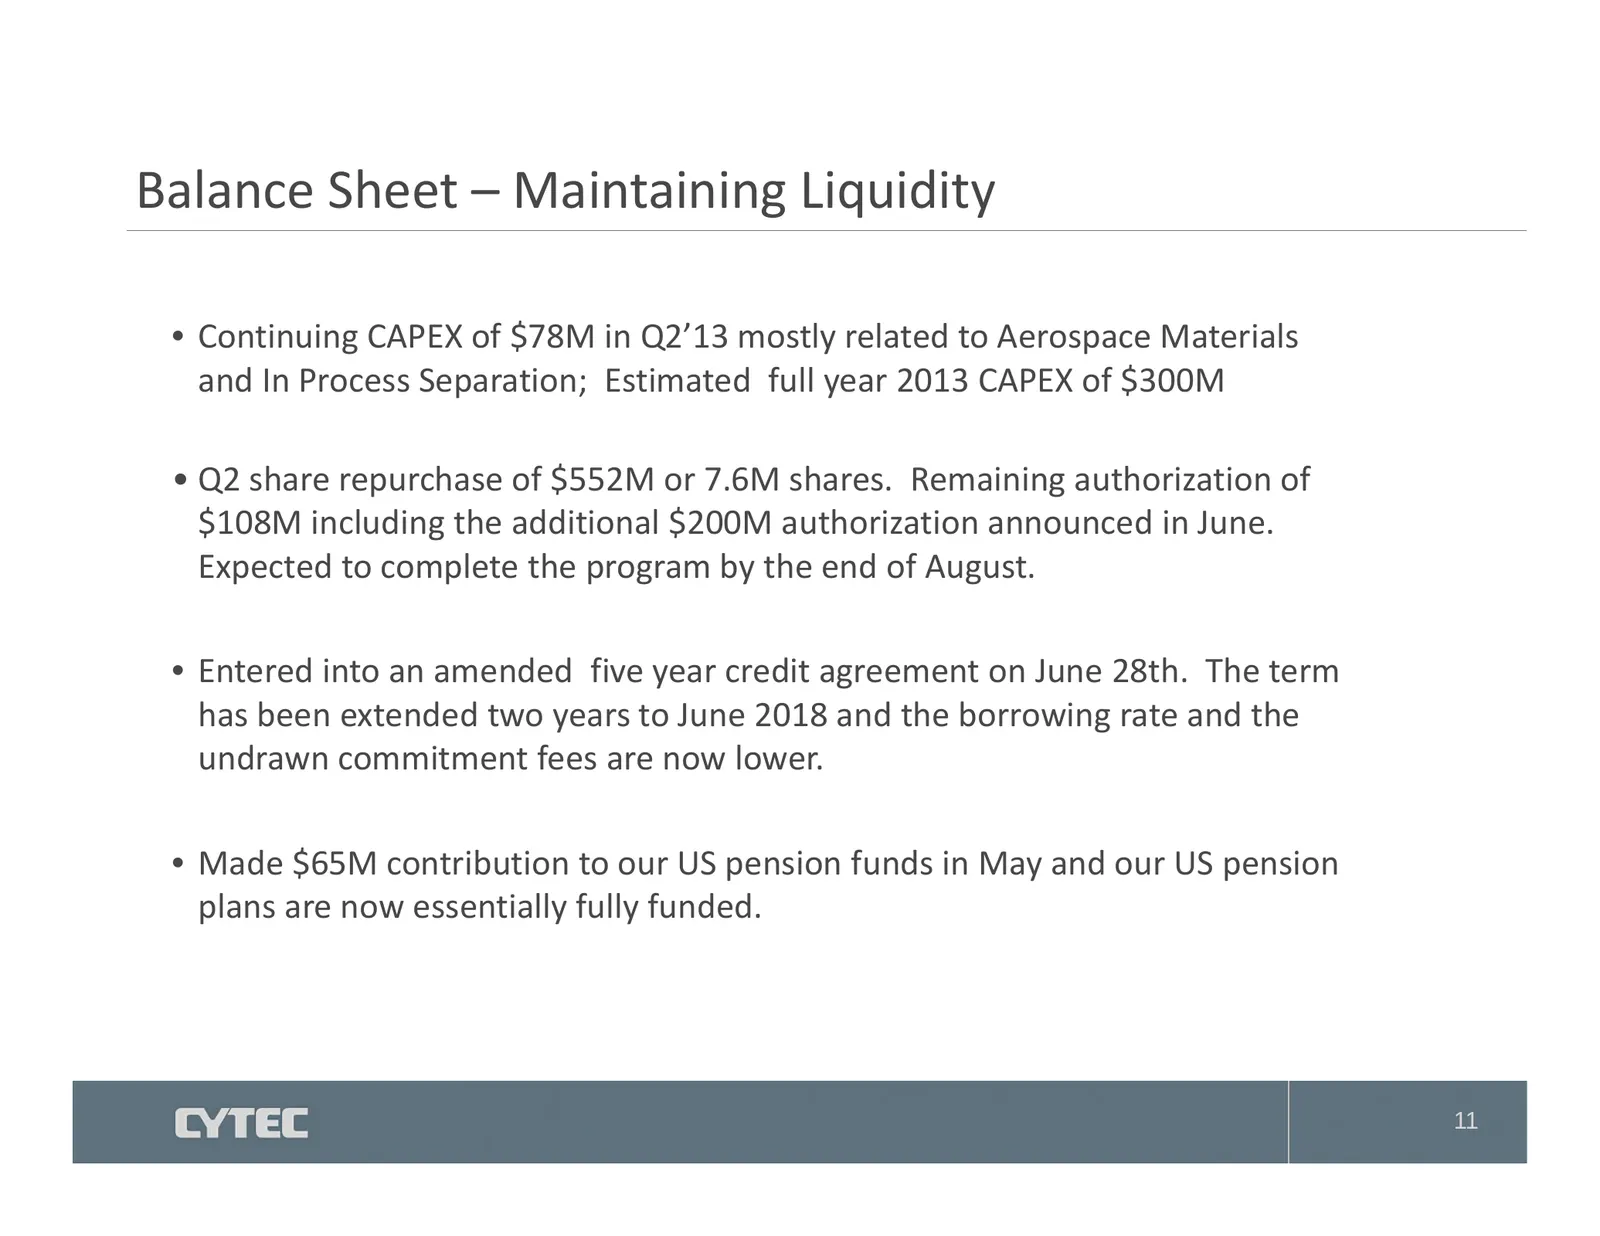
Balance Sheet – Maintaining Liquidity • Continuing CAPEX of $78M in Q2’13 mostly related to Aerospace Materials and In Process Separation; Estimated full year 2013 CAPEX of $300M • Q2 share repurchase of $552M or 7.6M shares. Remaining authorization of $108M includingg the additional $200M authoriza
Slide 12: 2013 Outlook
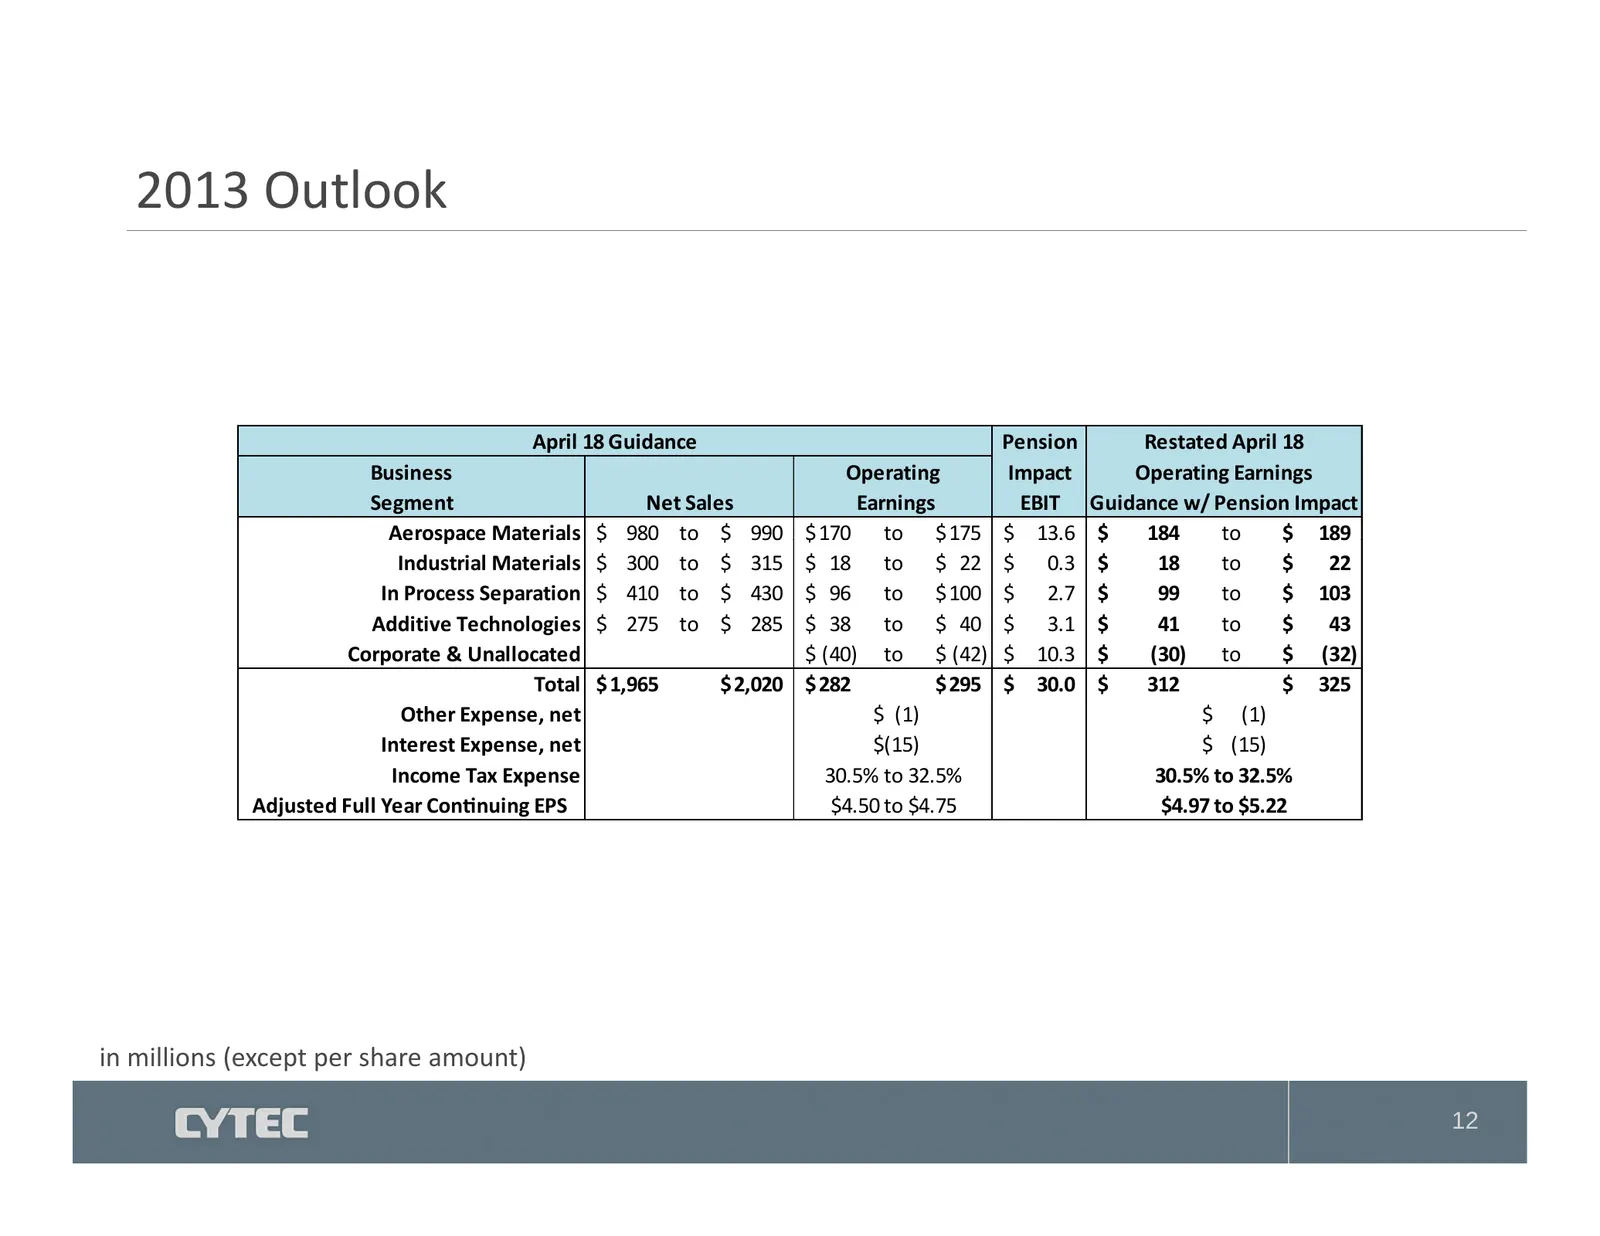
2013 Outlook April 18 Guidance Pension Restated April 18 Business Operating Impact Operating Earnings Segment Net Sales Earnings EBIT Guidance w/ Pension Impact Aerospace Materials $ 980 to $ 990 $ 170 to $ 175 $ 13.6 $ 184 to $ 189 Industrial Materials $ 300 to $ 315 $ 18 to $ 22 $ 0.3 $ 18 to $ 22
Slide 13: 2013 Outlook - continued
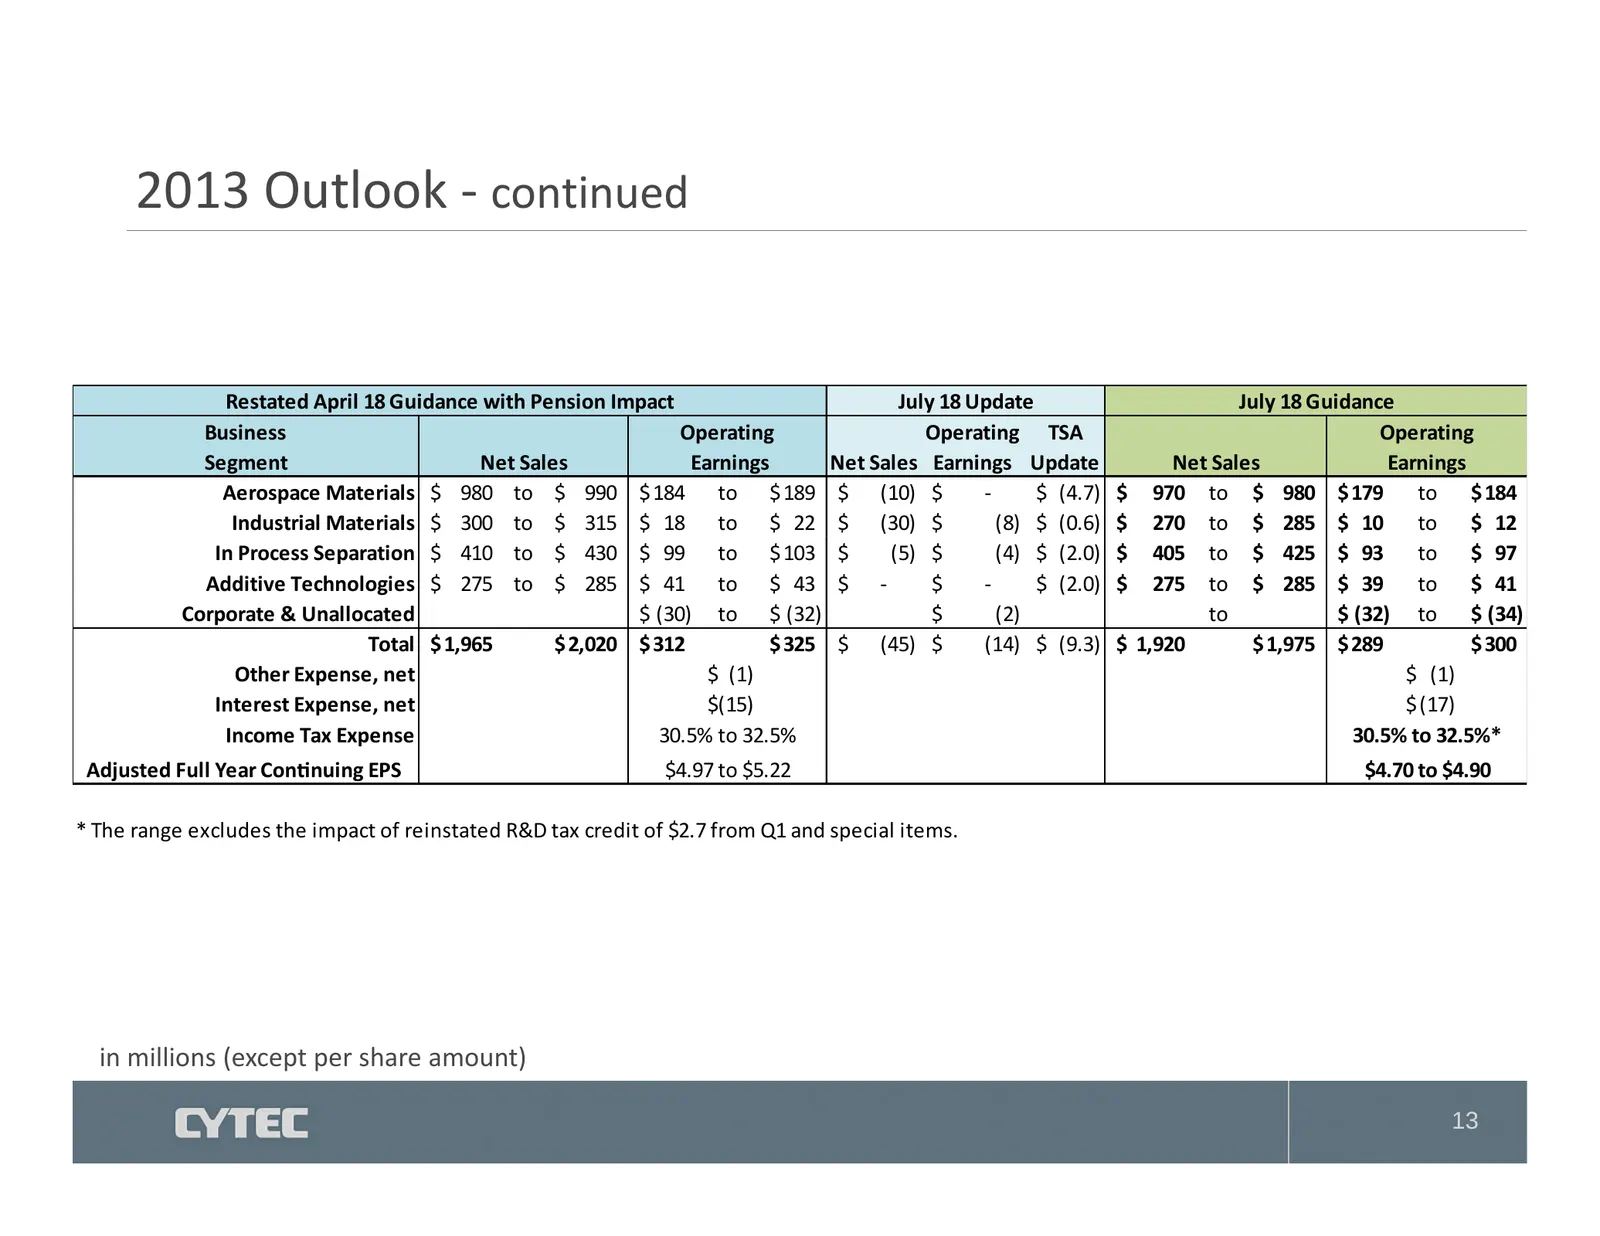
2013 Outlook ‐ continued Restated April 18 Guidance with Pension Impact July 18 Update July 18 Guidance Business Operating Operating TSA Operating Segment Net Sales Earnings Net Sales Earnings Update Net Sales Earnings Aerospace Materials $ 980 to $ 990 $ 184 to $ 189 $ (10) $ ‐ $ (4.7) $ 970 to $ 9
Slide 14: Cytec – Delivering Technology Beyond Our Customers' Imagination
CYTEC Delivering Technology Beyond Our Customers’ Imagination™ NYSE: CYT [iene See Se ee
Slide 15: Appendix: Reconciliation of Non-GAAP Measures to GAAP Measures
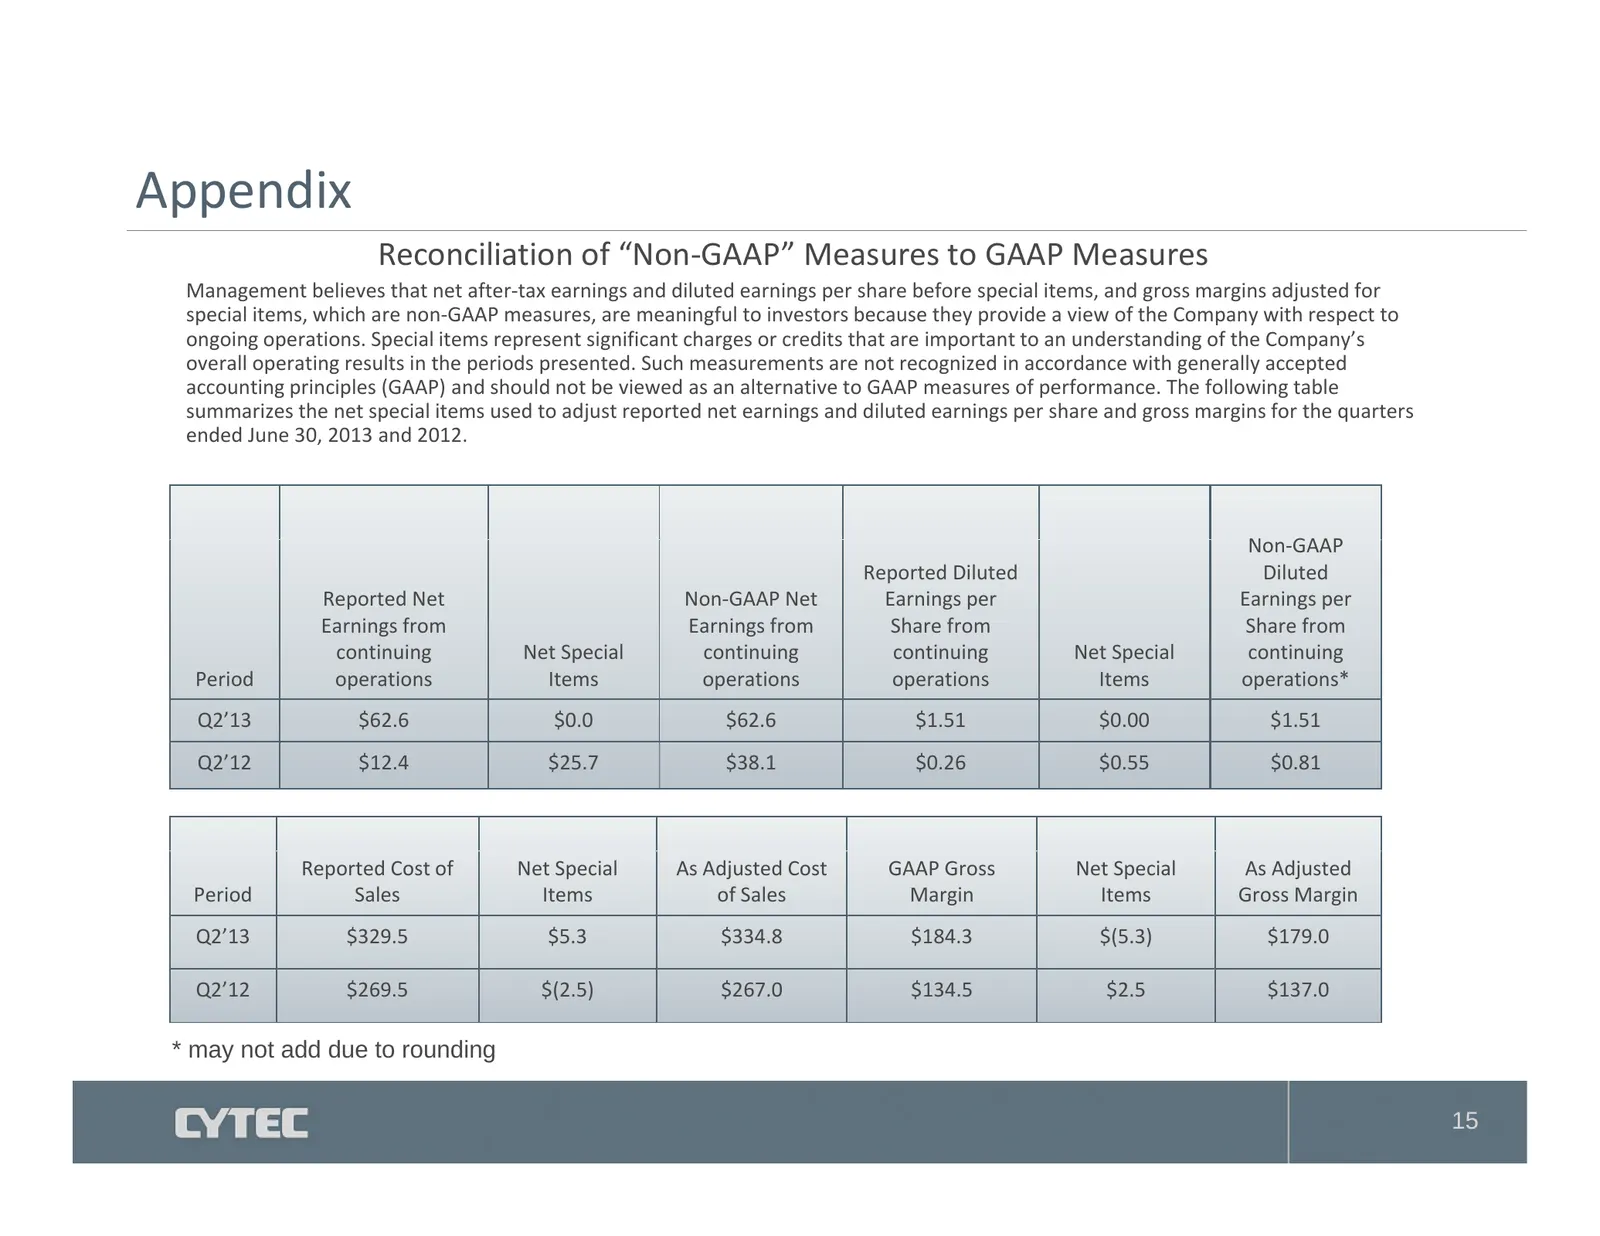
Appendix Reconciliation of “Non‐GAAP” Measures to GAAP Measures Management believes that net after‐tax earnings and diluted earnings per share before special items, and gross margins adjusted for special items, which are non‐GAAP measures, are meaningful to investors because they provide a view of t
Source: Internet Archive copy of solvay.com
More decks from Cytec Industries Inc
 Q2 2015 Earnings Presentation12 slides · Jul 17, 2015
 Q1 2015 Earnings Presentation12 slides · April 2015
 Q4 2014 Earnings Presentation14 slides · Jan 28, 2015
 Q3 2014 Earnings Presentation14 slides · Oct 17, 2014
 Q2 2014 Earnings Presentation14 slides · Jul 18, 2014
 Q1 2014 Earnings Presentation13 slides · Apr 23, 2014