Corner Growth Acquisition Corp
Corner Growth Acquisition — SPAC Merger (April 2024)
35 slides from Corner Growth Acquisition's SPAC merger presentation, Apr 4, 2024
Slide 1: Investor Presentation 2024
Exhibit 99.3 Investor Presentation 2024
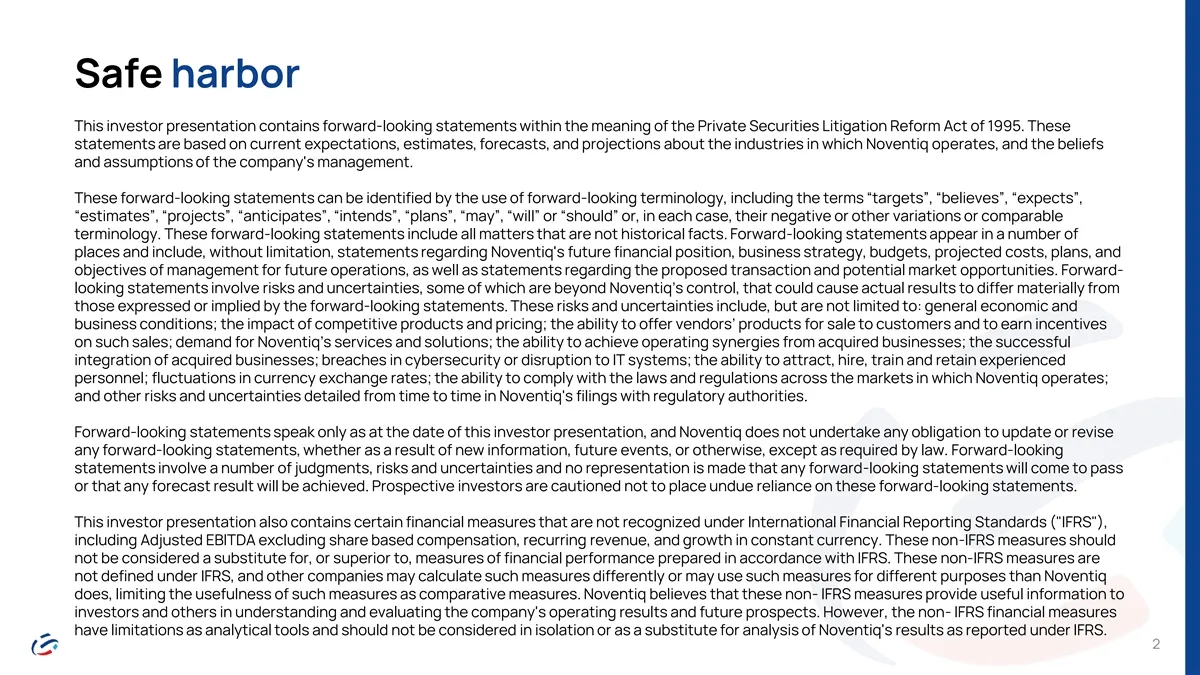
Slide 2: Safe harbor
Safe harbor This investor presentation contains forward-looking statements within the meaning of the Private Securities Litigation Reform Act of 1995. These statements are based on current expectations, estimates, forecasts, and projections about the industries in which Noventiq operates, and the be
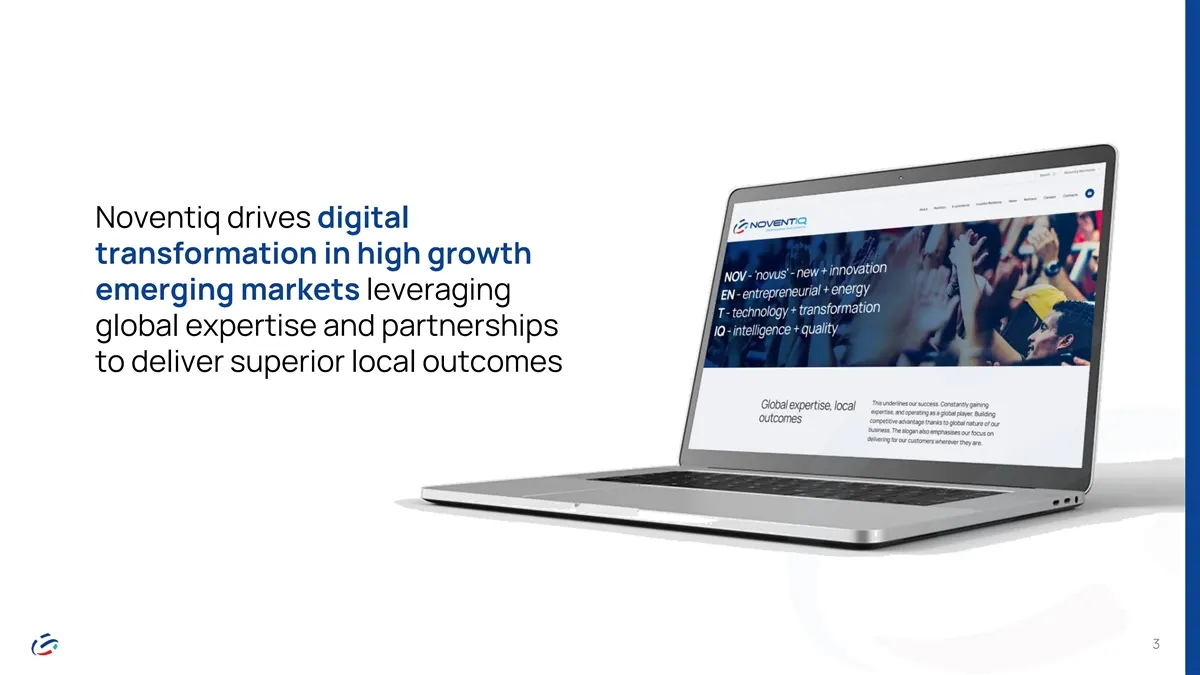
Slide 3: Noventiq drives digital transformation in high growth emerging markets
Noventiq drives digital transformation in high growth emerging markets leveraging global expertise and partnerships to deliver superior local outcomes 3
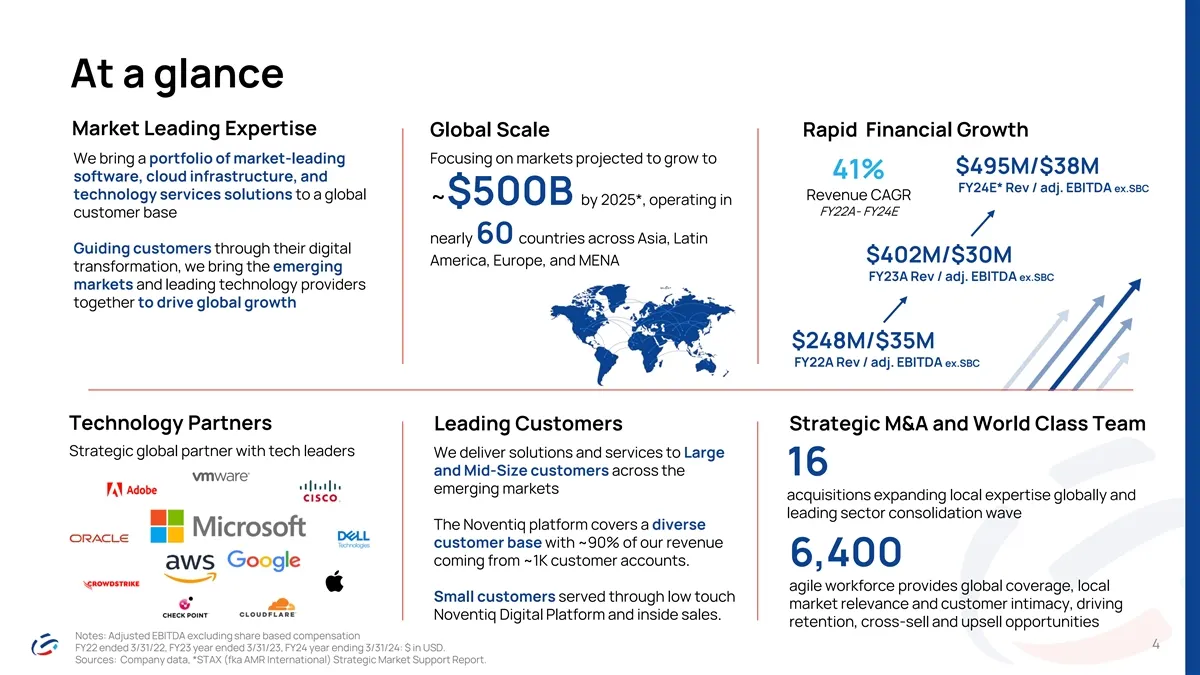
Slide 4: At a glance
At a glance Market Leading Expertise Global Scale Rapid Financial Growth We bring a portfolio of market-leading Focusing on markets projected to grow to $495M/$38M 41% software, cloud infrastructure, and FY24E* Rev / adj. EBITDA ex.SBC technology services solutions to a global Revenue CAGR ~$500B by
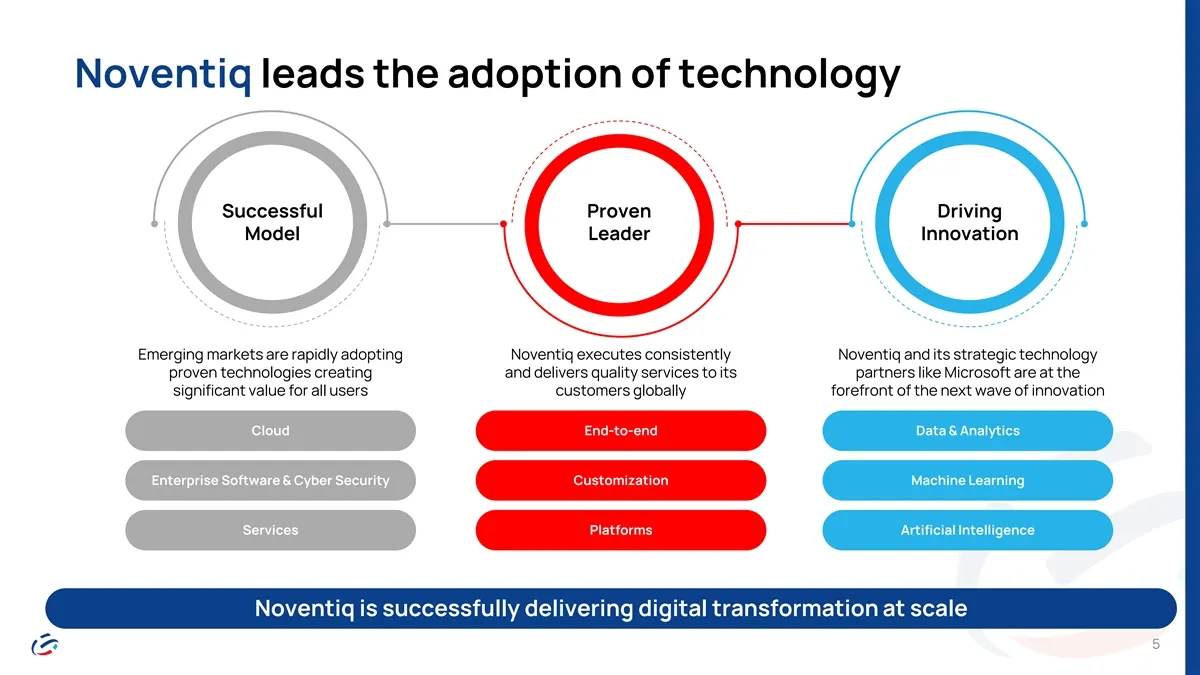
Slide 5: Noventiq leads the adoption of technology
Noventiq leads the adoption of technology Successful Proven Driving Model Leader Innovation Emerging markets are rapidly adopting Noventiq executes consistently Noventiq and its strategic technology proven technologies creating and delivers quality services to its partners like Microsoft are at the
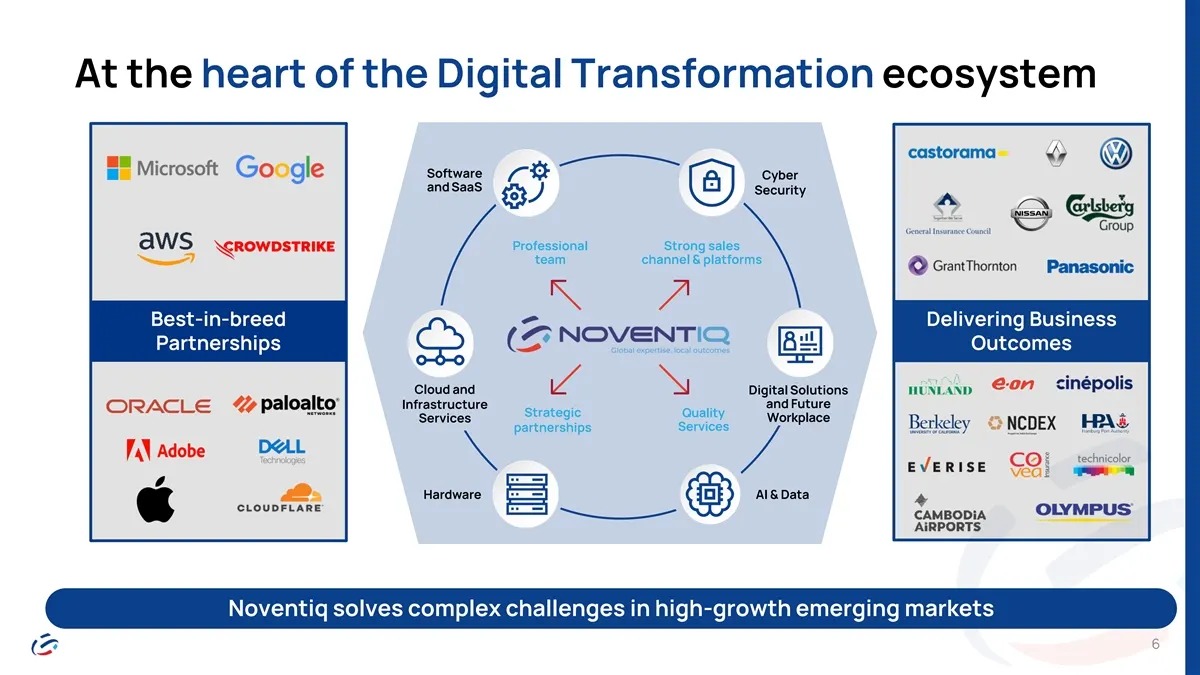
Slide 6: At the heart of the Digital Transformation ecosystem
At the heart of the Digital Transformation ecosystem Software Cyber and SaaS Security Professional Strong sales team channel & platforms Best-in-breed Delivering Business Partnerships Outcomes Cloud and Digital Solutions Infrastructure and Future Strategic Quality Services Workplace Services partner
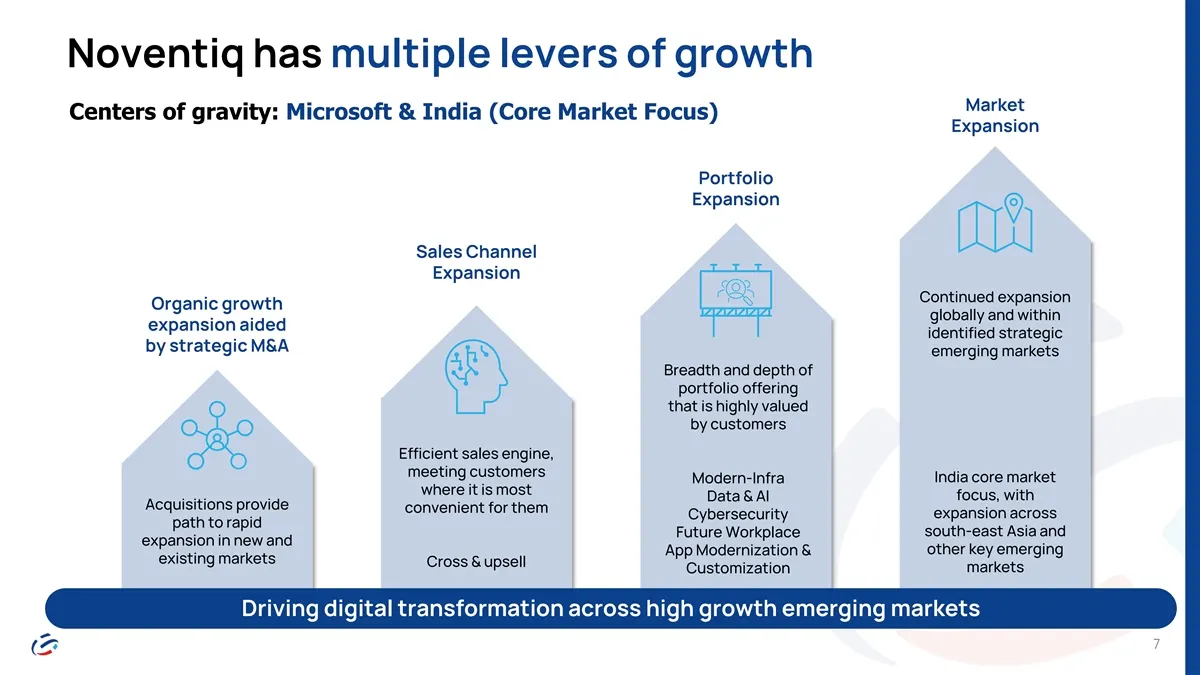
Slide 7: Noventiq has multiple levers of growth
Noventiq has multiple levers of growth Market Centers of gravity: Microsoft & India (Core Market Focus) Expansion Portfolio Expansion Sales Channel Expansion Continued expansion Organic growth globally and within expansion aided identified strategic by strategic M&A emerging markets Breadth and dept
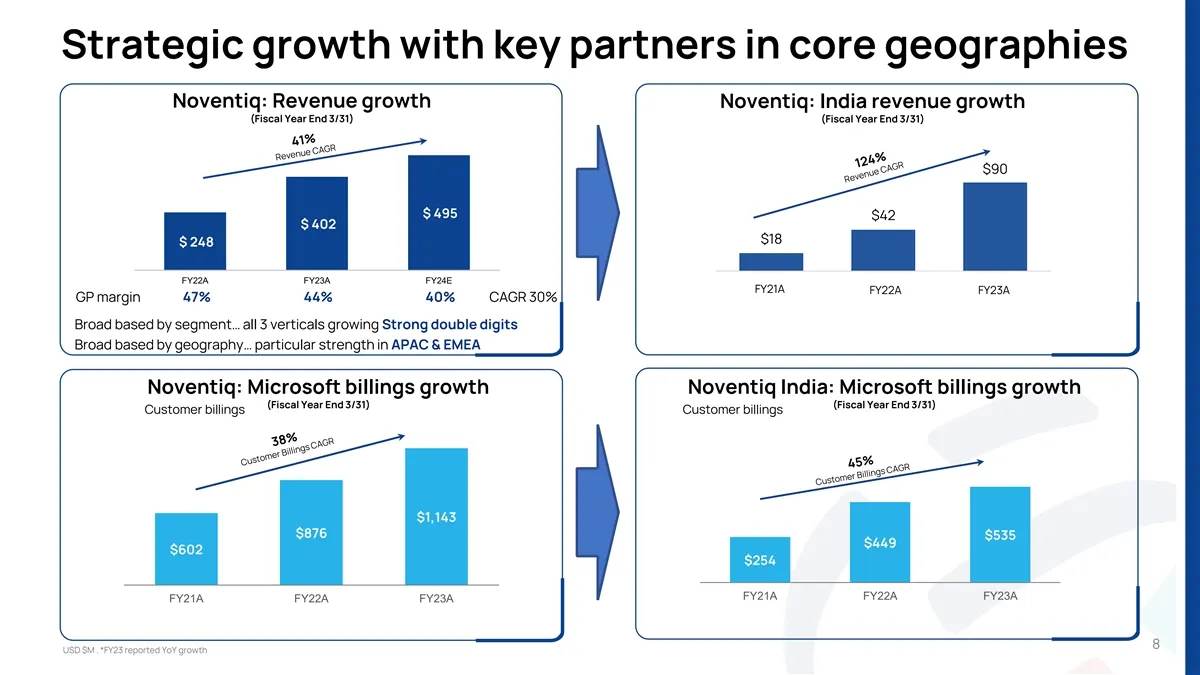
Slide 8: Strategic growth with key partners in core geographies
Strategic growth with key partners in core geographies Noventiq: Revenue growth Noventiq: India revenue growth (Fiscal Year End 3/31) (Fiscal Year End 3/31) $90 $ 495 $42 $ 402 $18 $ 248 FY22A FY23A FY24E FY21A FY22A FY23A GP margin 47% 44% 40% CAGR 30% Broad based by segment… all 3 verticals growin
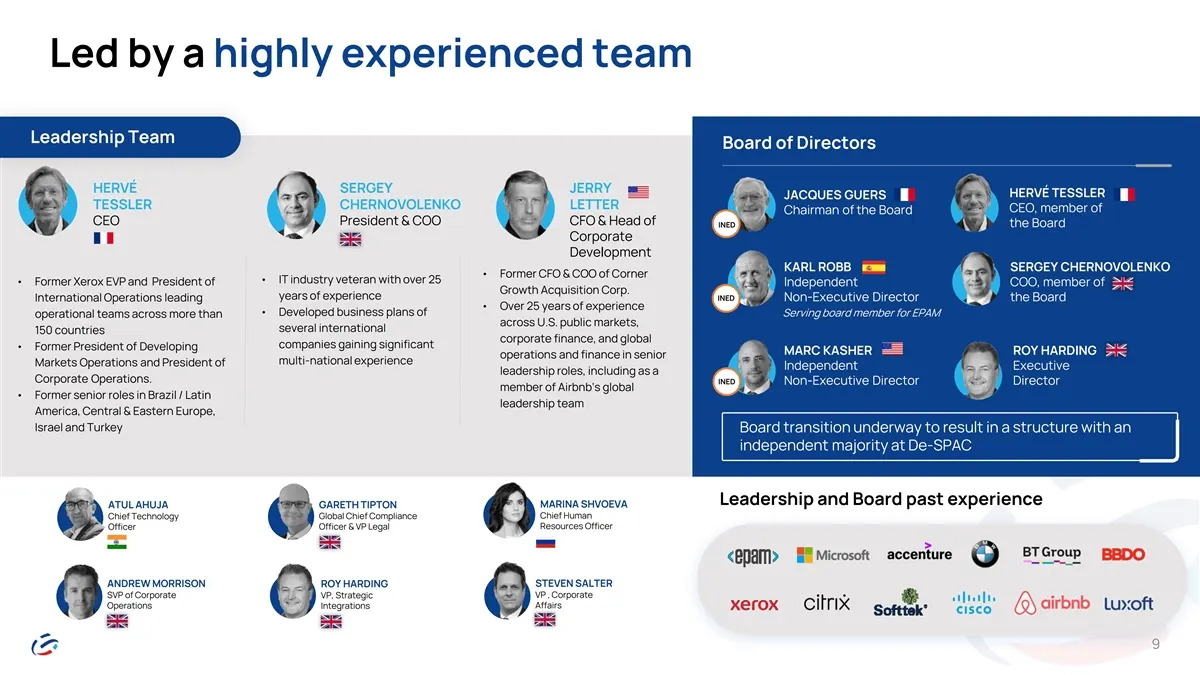
Slide 9: Led by a highly experienced team
Led by a highly experienced team Leadership Team Board of Directors HERVÉ SERGEY JERRY HERVÉ TESSLER JACQUES GUERS TESSLER CHERNOVOLENKO LETTER CEO, member of Chairman of the Board CEO President & COO CFO & Head of INED the Board Corporate Development KARL ROBB SERGEY CHERNOVOLENKO • Former CFO & CO
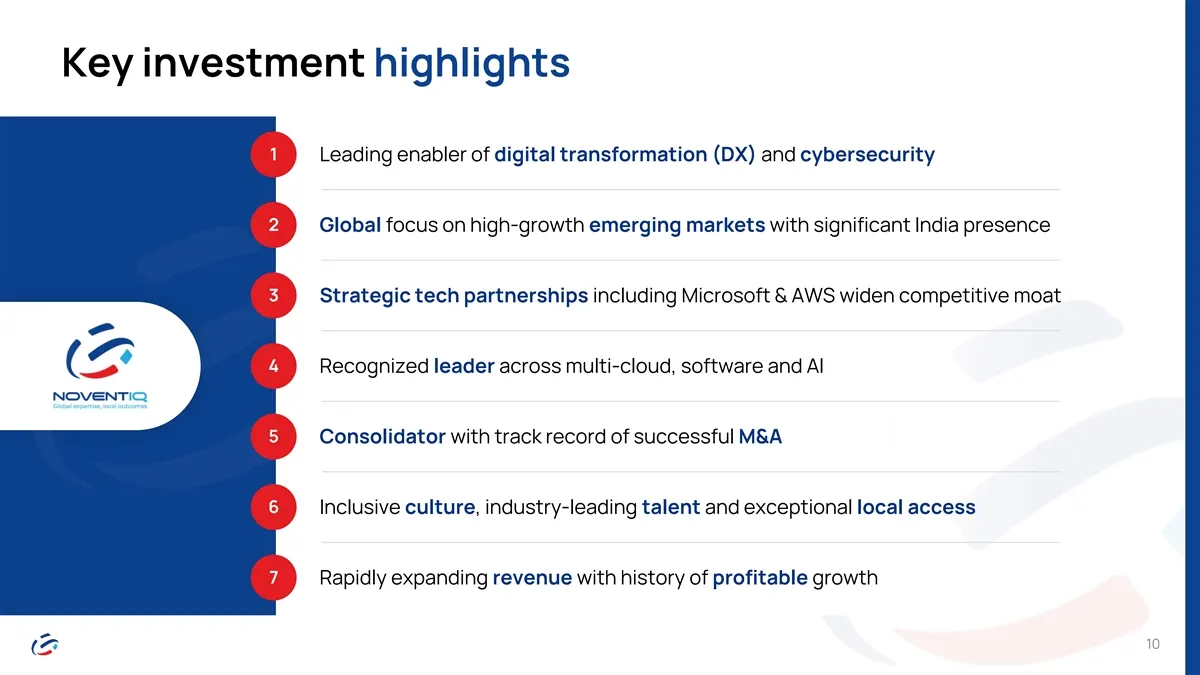
Slide 10: Key investment highlights
Key investment highlights 1 Leading enabler of digital transformation (DX) and cybersecurity 2 Global focus on high-growth emerging markets with significant India presence 3 Strategic tech partnerships including Microsoft & AWS widen competitive moat 4 Recognized leader across multi-cloud, software

Slide 11: Global Capabilities
— GLOBAL CAPABILITIES
Slide 12: Noventiq end-to-end solutions & services portfolio
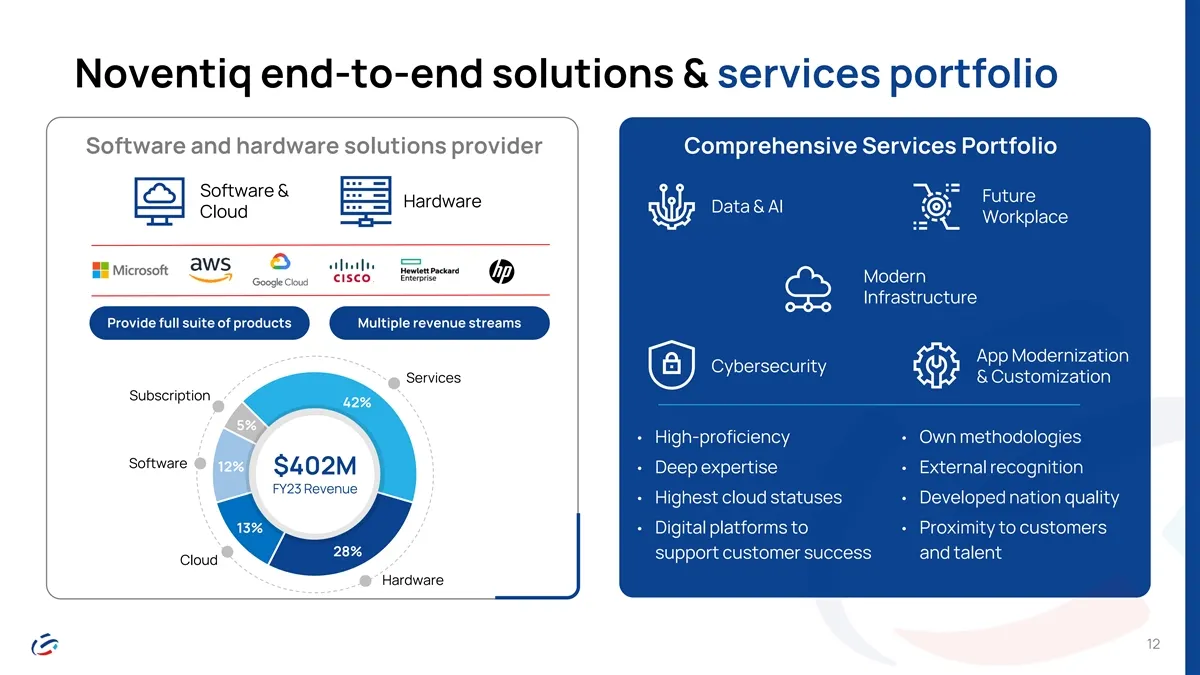
Noventiq end-to-end solutions & services portfolio Software and hardware solutions provider Comprehensive Services Portfolio Software & Future Hardware Data & AI Cloud Workplace Modern Infrastructure Provide full suite of products Multiple revenue streams App Modernization Cybersecurity Services & C
Slide 13: Market opportunity in global emerging markets
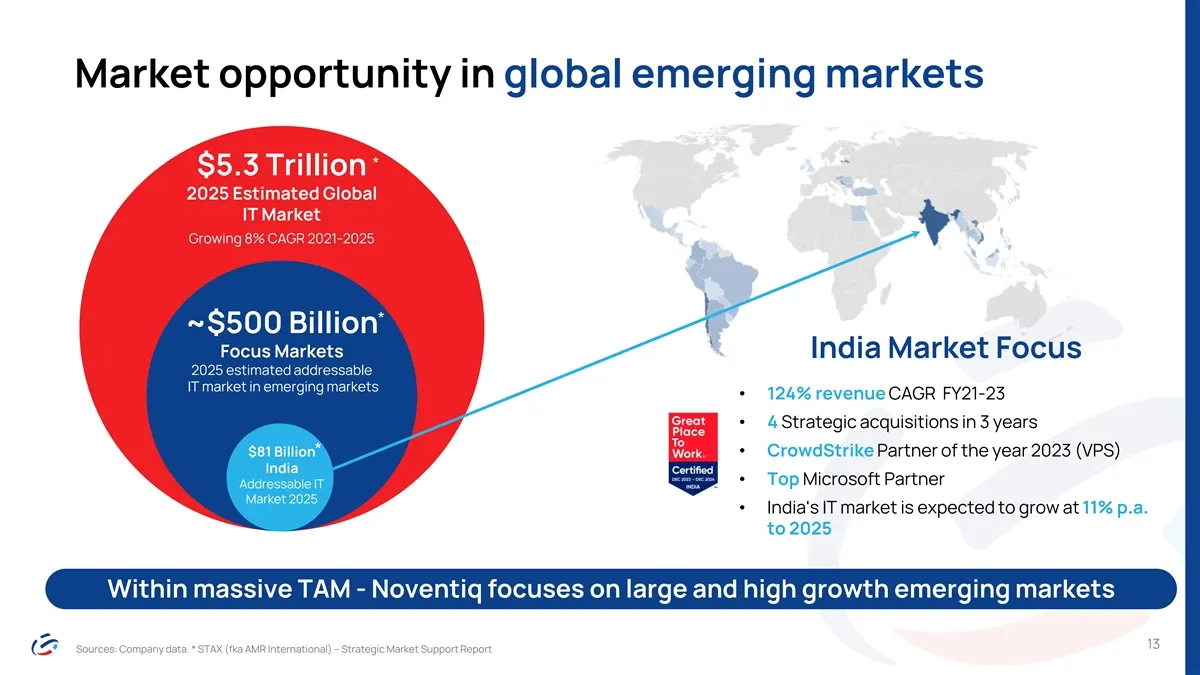
Market opportunity in global emerging markets * $5.3 Trillion 2025 Estimated Global IT Market Growing 8% CAGR 2021-2025 * ~$500 Billion Focus Markets India Market Focus 2025 estimated addressable IT market in emerging markets • 124% revenue CAGR FY21-23 • 4 Strategic acquisitions in 3 years $81 Bill
Slide 14: Large and growing emerging market opportunity
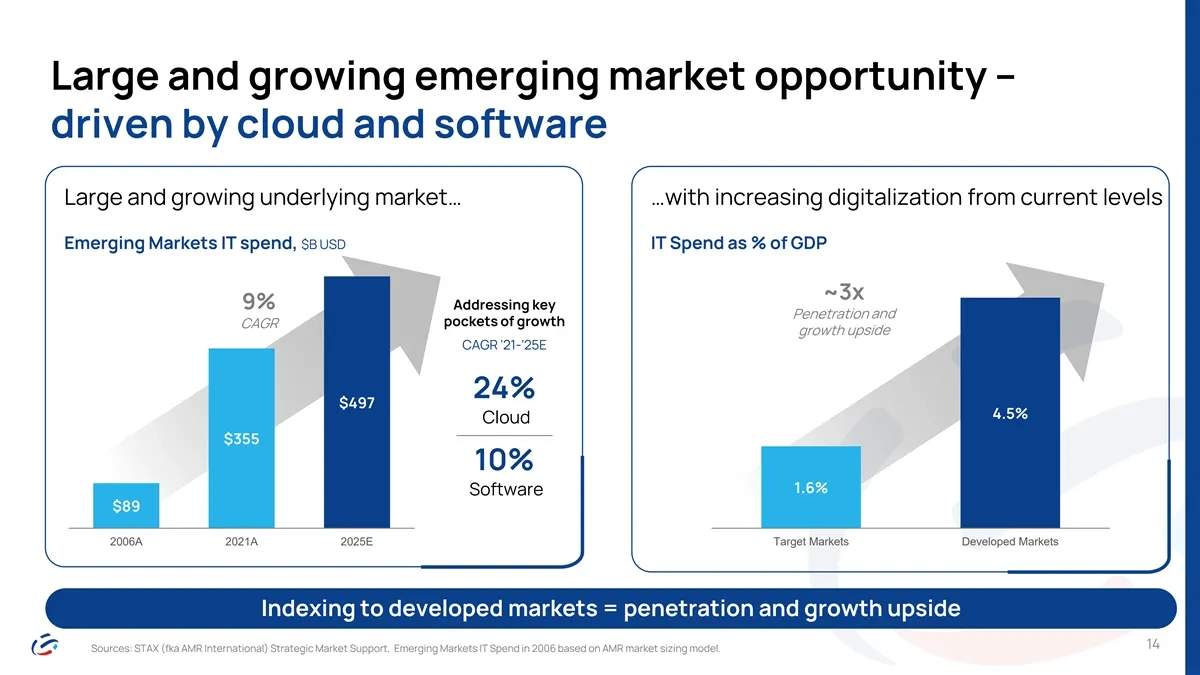
Large and growing emerging market opportunity – driven by cloud and software Large and growing underlying market… …with increasing digitalization from current levels Emerging Markets IT spend, $B USD IT Spend as % of GDP Addressing key pockets of growth CAGR ’21-’25E 24% $497 4.5% Cloud $355 10% 1.6
Slide 15: Microsoft and Noventiq – key strategic partners
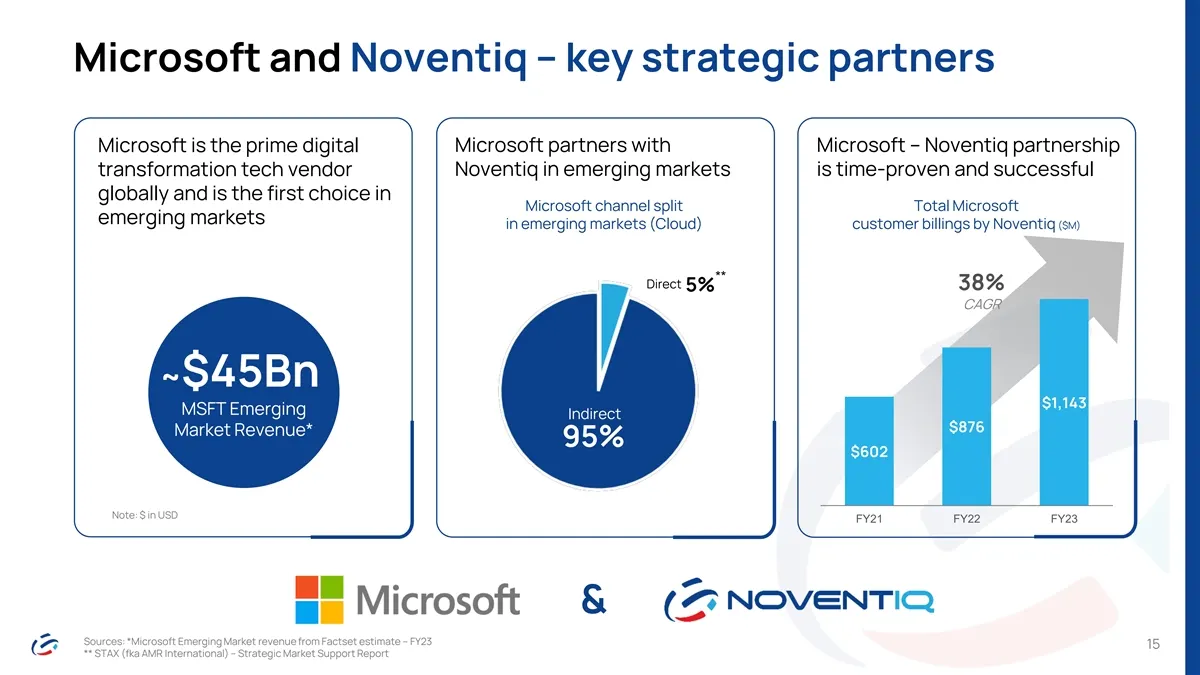
Microsoft and Noventiq – key strategic partners Microsoft is the prime digital Microsoft partners with Microsoft – Noventiq partnership transformation tech vendor Noventiq in emerging markets is time-proven and successful globally and is the first choice in Microsoft channel split Total Microsoft em
Slide 16: Cloud adoption drives demand for solutions and services
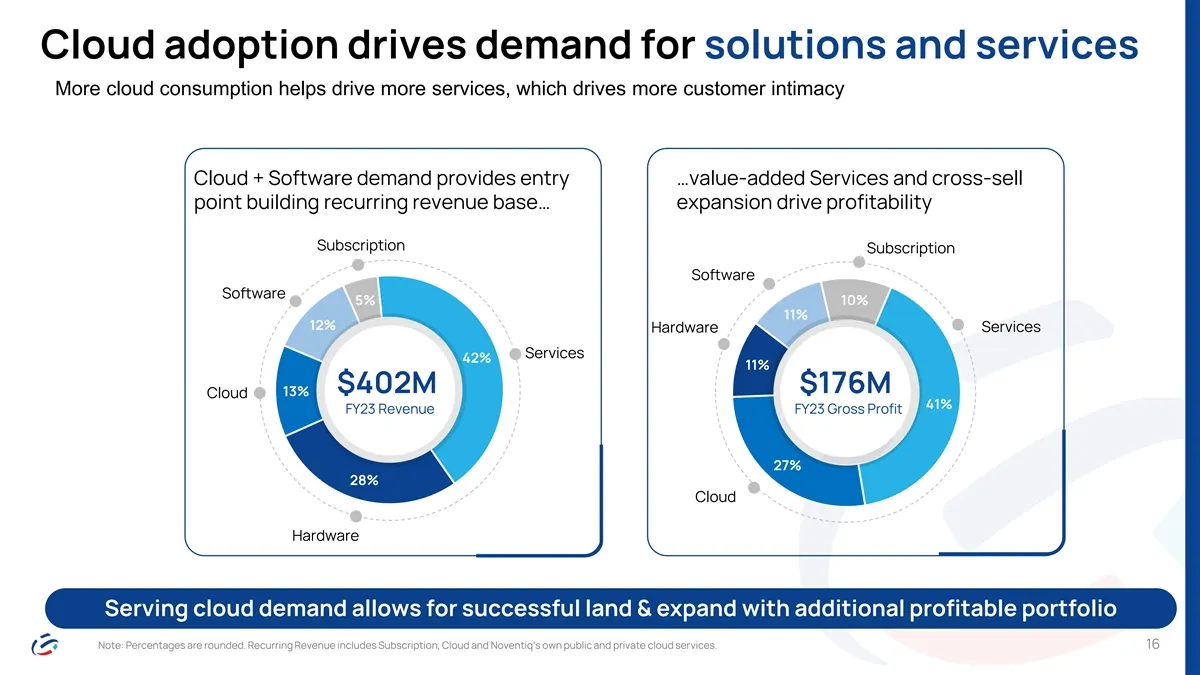
Cloud adoption drives demand for solutions and services More cloud consumption helps drive more services, which drives more customer intimacy Cloud + Software demand provides entry …value-added Services and cross-sell point building recurring revenue base… expansion drive profitability Subscription
Slide 17: Comprehensive portfolio: Cloud
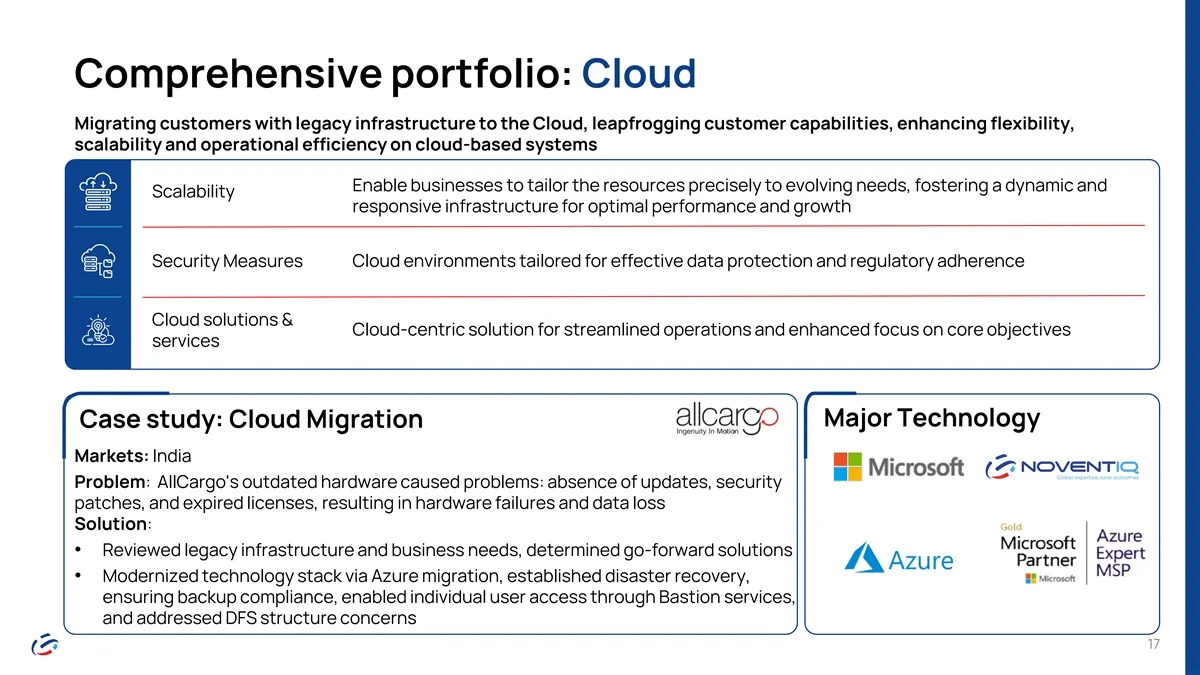
Comprehensive portfolio: Cloud Migrating customers with legacy infrastructure to the Cloud, leapfrogging customer capabilities, enhancing flexibility, scalability and operational efficiency on cloud-based systems Enable businesses to tailor the resources precisely to evolving needs, fostering a dyna
Slide 18: Comprehensive portfolio: Digital transformation
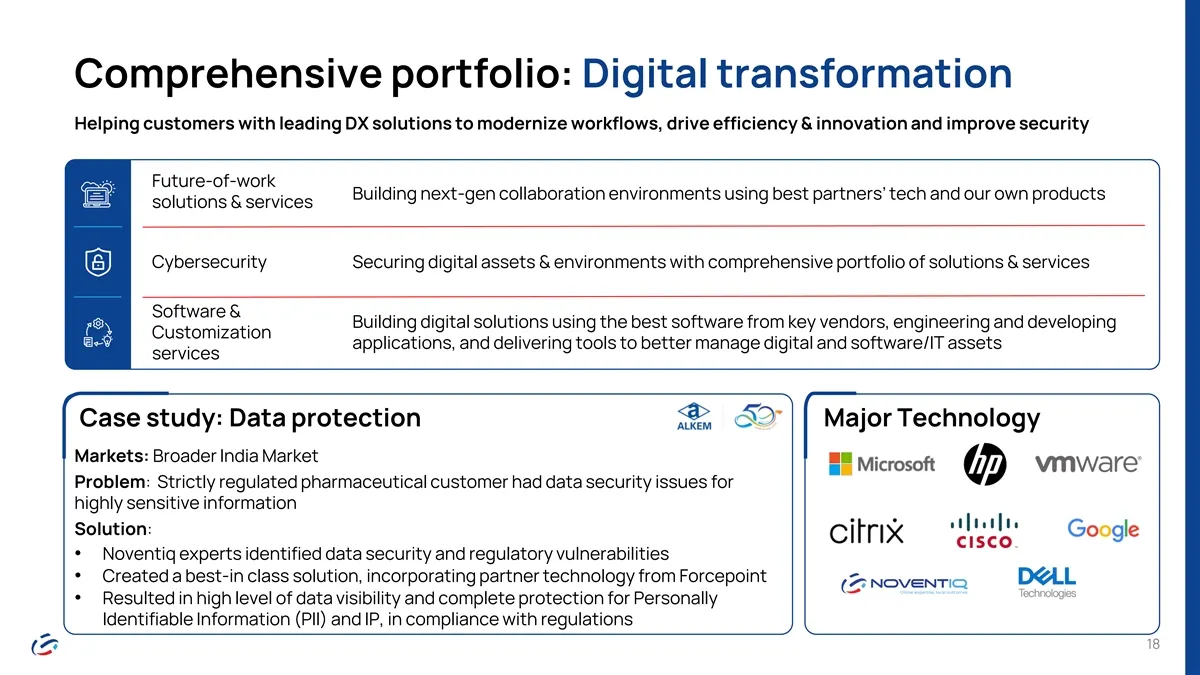
Comprehensive portfolio: Digital transformation Helping customers with leading DX solutions to modernize workflows, drive efficiency & innovation and improve security Future-of-work Building next-gen collaboration environments using best partners’ tech and our own products solutions & services Cyber
Slide 19: Comprehensive portfolio: Artificial Intelligence
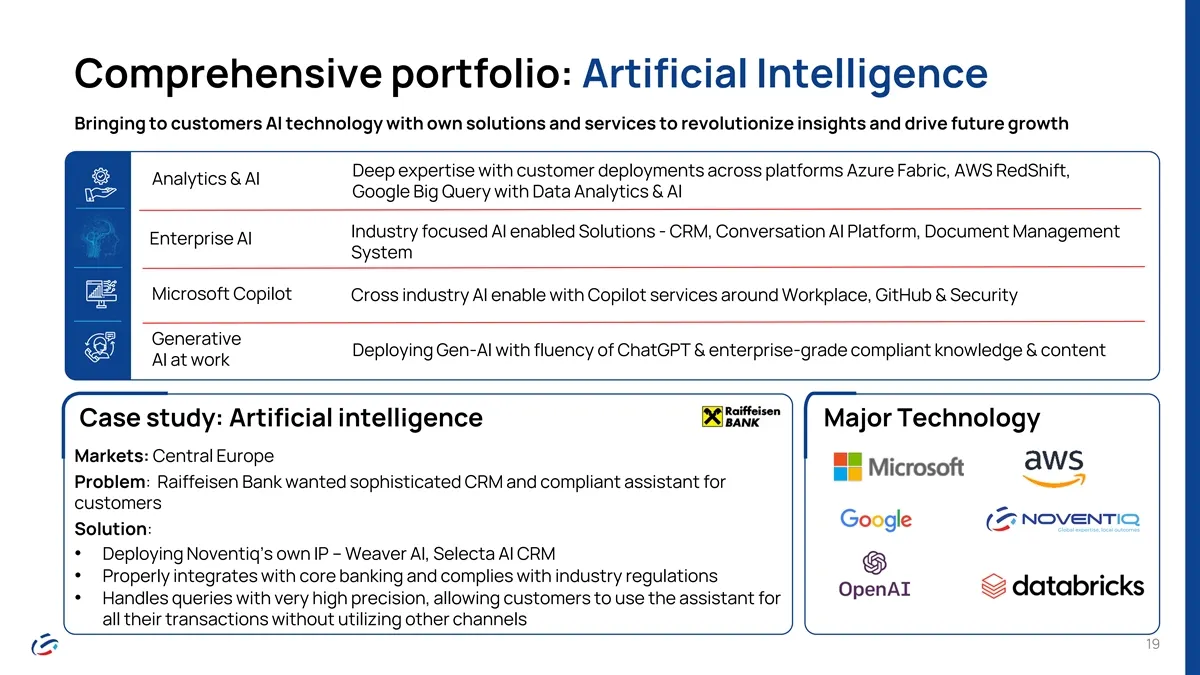
Comprehensive portfolio: Artificial Intelligence Bringing to customers AI technology with own solutions and services to revolutionize insights and drive future growth Deep expertise with customer deployments across platforms Azure Fabric, AWS RedShift, Analytics & AI Google Big Query with Data Analy
Slide 20: Proven ability to inspire corporate change
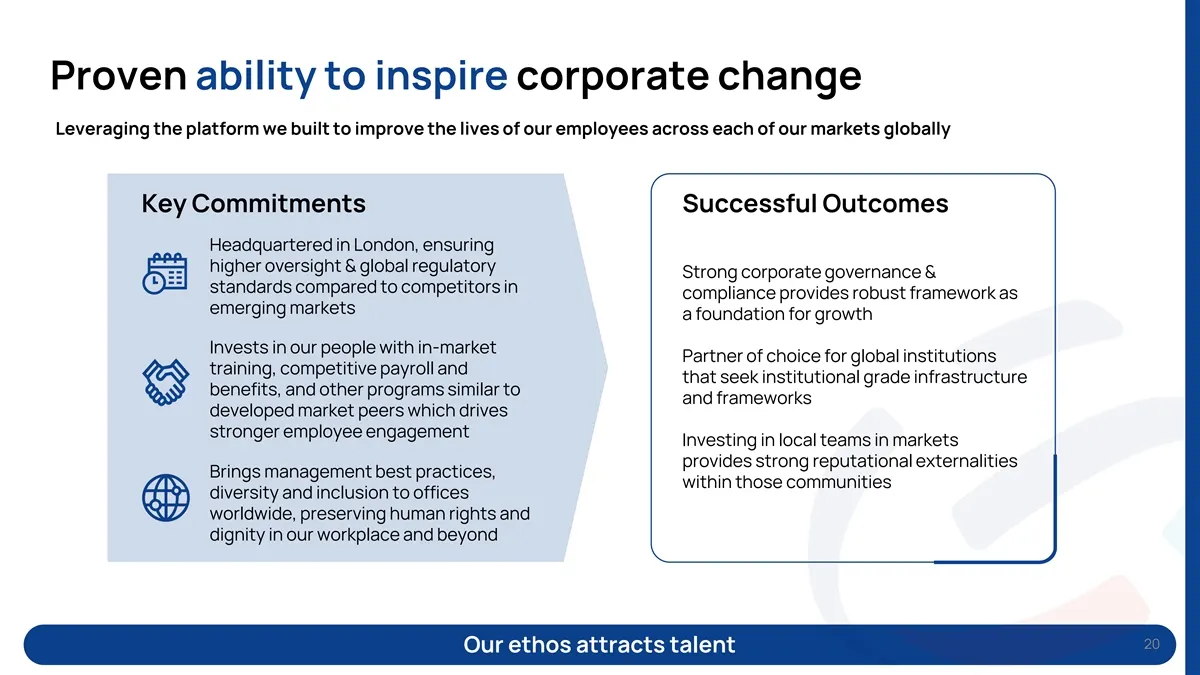
Proven ability to inspire corporate change Leveraging the platform we built to improve the lives of our employees across each of our markets globally Key Commitments Successful Outcomes Headquartered in London, ensuring higher oversight & global regulatory Strong corporate governance & standards com
Slide 21: Our team is our competitive advantage
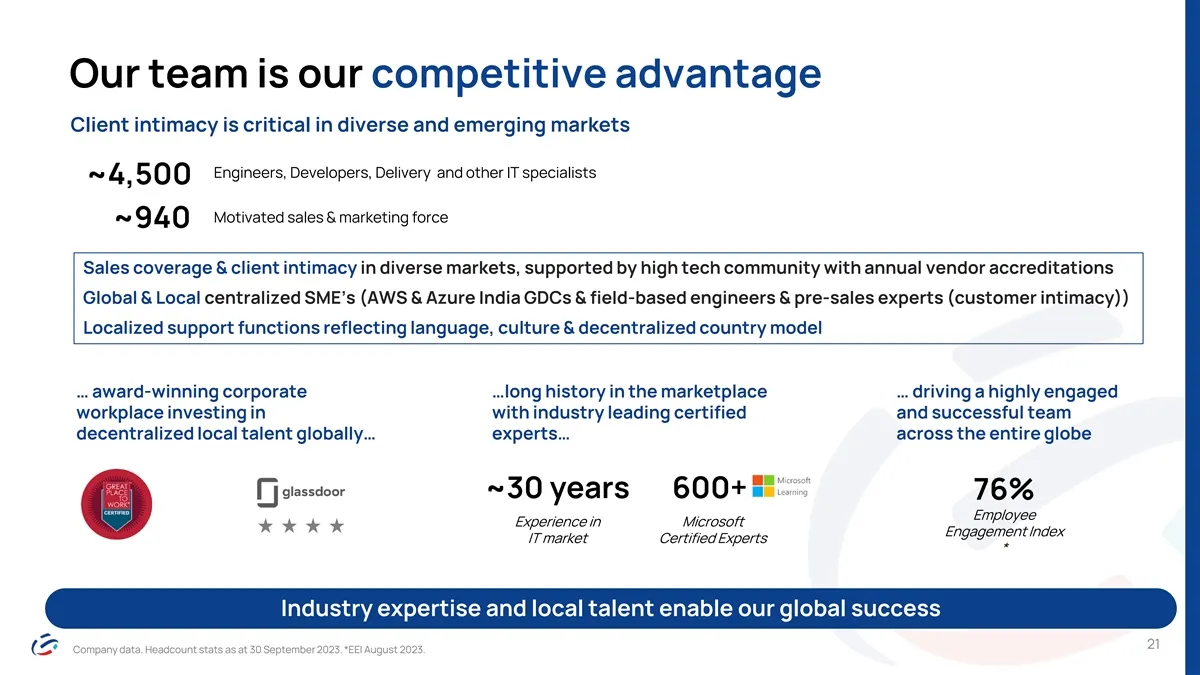
Our team is our competitive advantage Client intimacy is critical in diverse and emerging markets Engineers, Developers, Delivery and other IT specialists ~4,500 Motivated sales & marketing force ~940 Sales coverage & client intimacy in diverse markets, supported by high tech community with annual v
Slide 22: Market Expansion
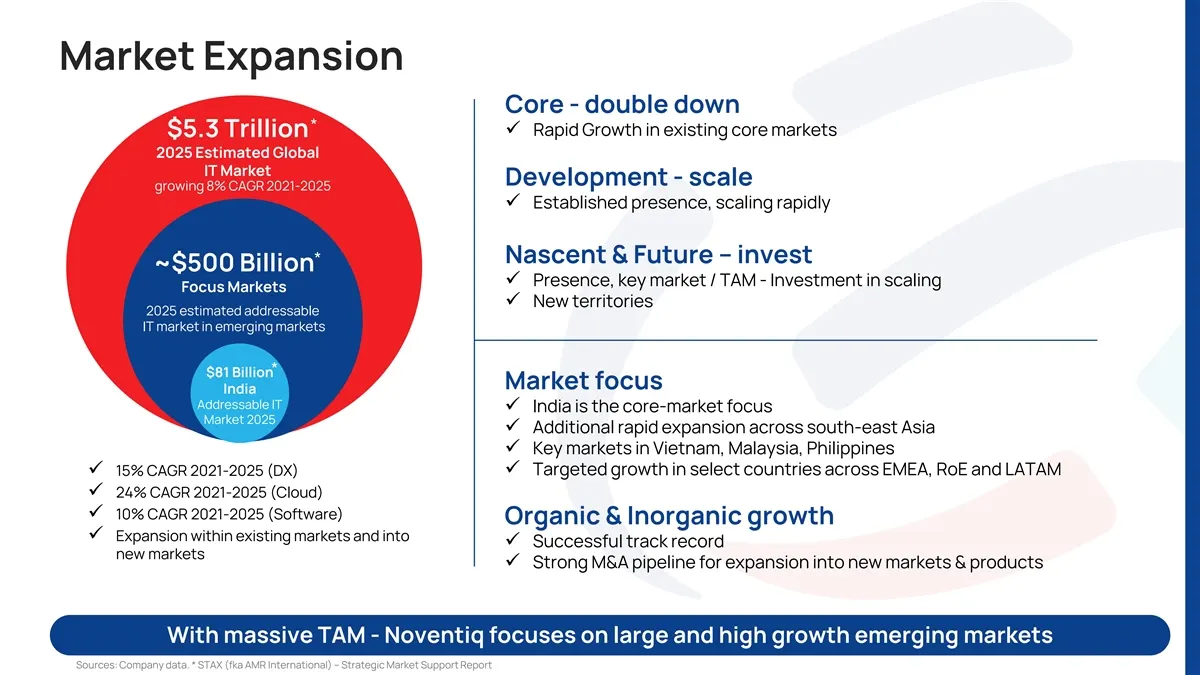
Market Expansion Core - double down * * ✓ Rapid Growth in existing core markets $5.3 Trillion 2025 Estimated Global IT Market Development - scale growing 8% CAGR 2021-2025 ✓ Established presence, scaling rapidly Nascent & Future – invest * ~$500 Billion ✓ Presence, key market / TAM - Investment in s
Slide 23: Established track record of successful acquisitions
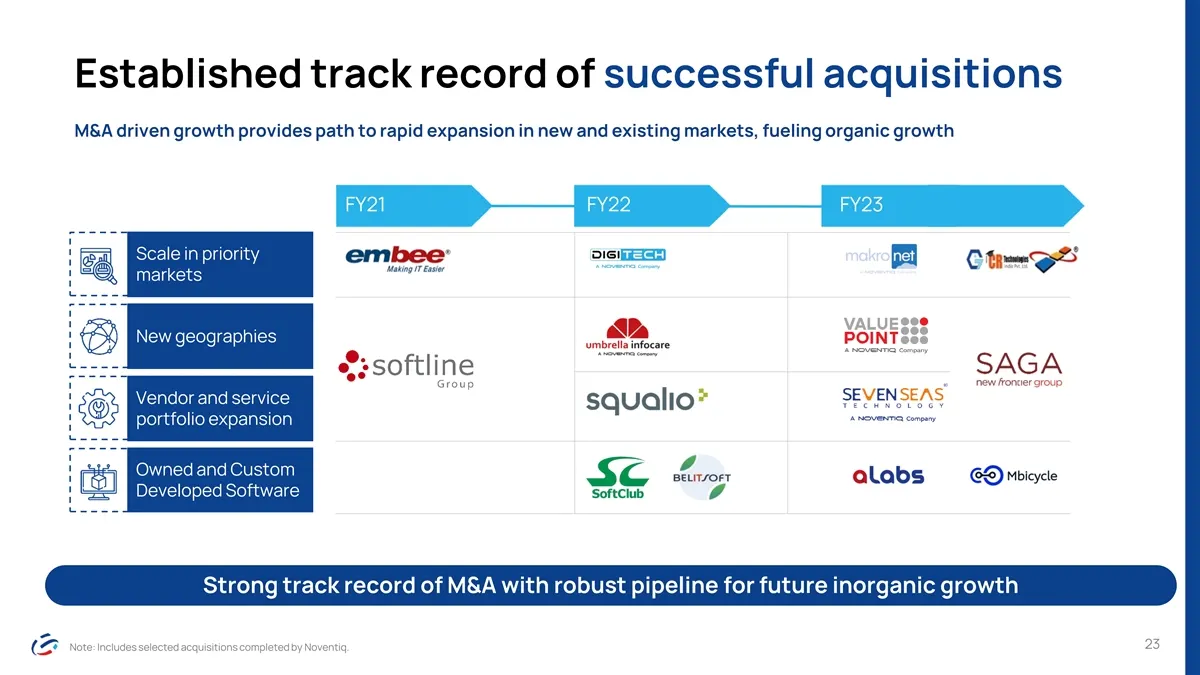
Established track record of successful acquisitions M&A driven growth provides path to rapid expansion in new and existing markets, fueling organic growth FY21 FY22 FY23 Scale in priority markets New geographies Vendor and service portfolio expansion Owned and Custom Developed Software Strong track
Slide 24: Organic growth accelerated by acquisitions
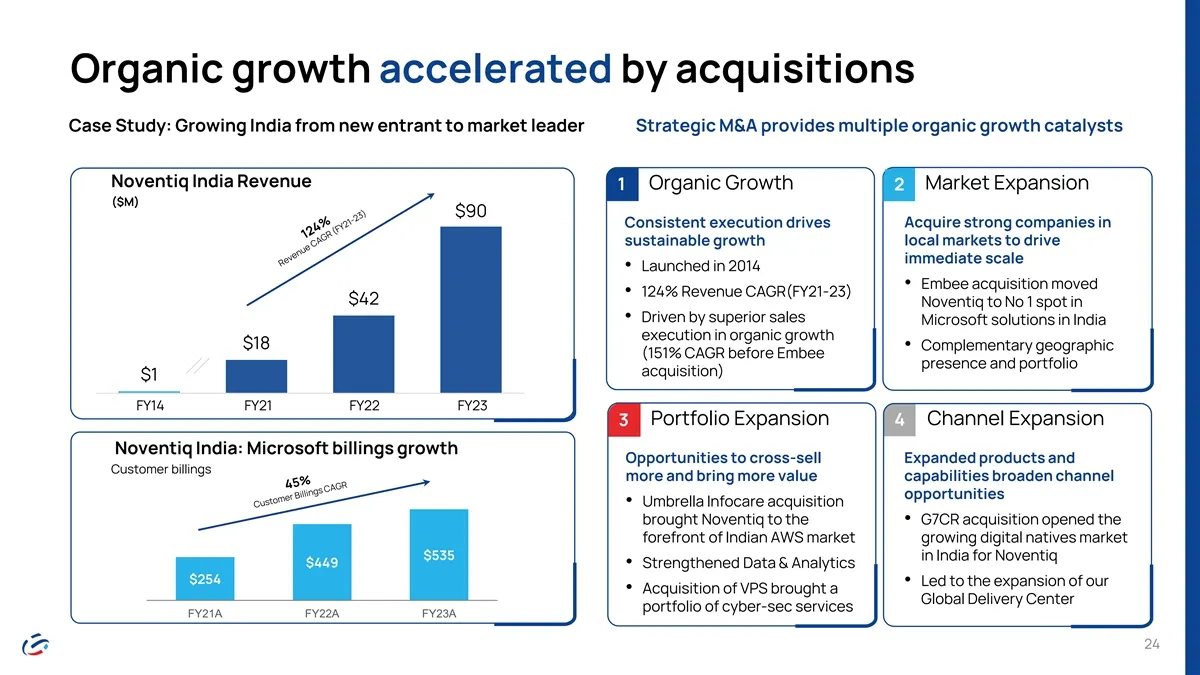
Organic growth accelerated by acquisitions Case Study: Growing India from new entrant to market leader Strategic M&A provides multiple organic growth catalysts Noventiq India Revenue 1 Organic Growth Market Expansion 2 ($M) $90 Consistent execution drives Acquire strong companies in sustainable grow

Slide 25: Financials
— FINANCIALS
Slide 26: Proven ability to grow rapidly in emerging markets
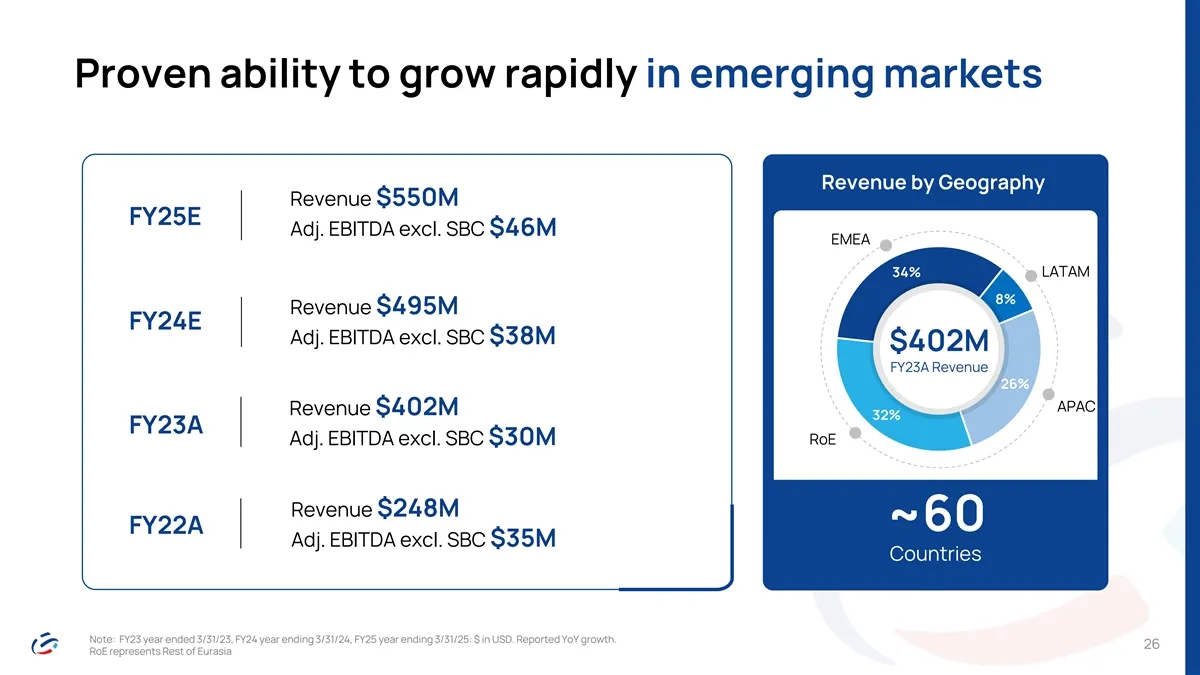
Proven ability to grow rapidly in emerging markets Revenue by Geography Revenue $550M FY25E Adj. EBITDA excl. SBC $46M EMEA 34% LATAM 8% Revenue $495M FY24E Adj. EBITDA excl. SBC $38M $402M FY23A Revenue 26% APAC Revenue $402M 32% FY23A Adj. EBITDA excl. SBC $30M RoE Revenue $248M ~60 FY22A Adj. EBI
Slide 27: Demonstrating fast growth and profitability at scale
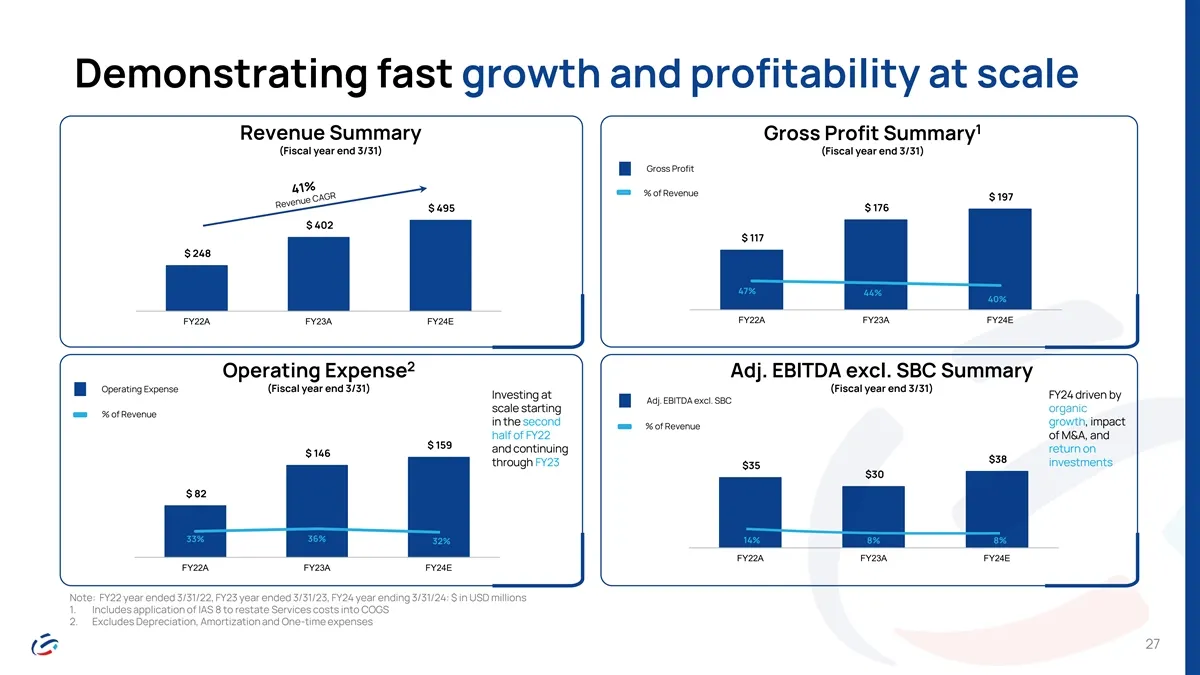
Demonstrating fast growth and profitability at scale 1 Revenue Summary Gross Profit Summary (Fiscal year end 3/31) (Fiscal year end 3/31) Gross Profit % of Revenue $ 197 $ 176 $ 495 $ 402 $ 117 $ 248 47% 44% 40% FY22A FY23A FY24E FY22A FY23A FY24E 2 Operating Expense Adj. EBITDA excl. SBC Summary Op
Slide 28: Supporting FY24 Adj. EBITDA excl. SBC forecast
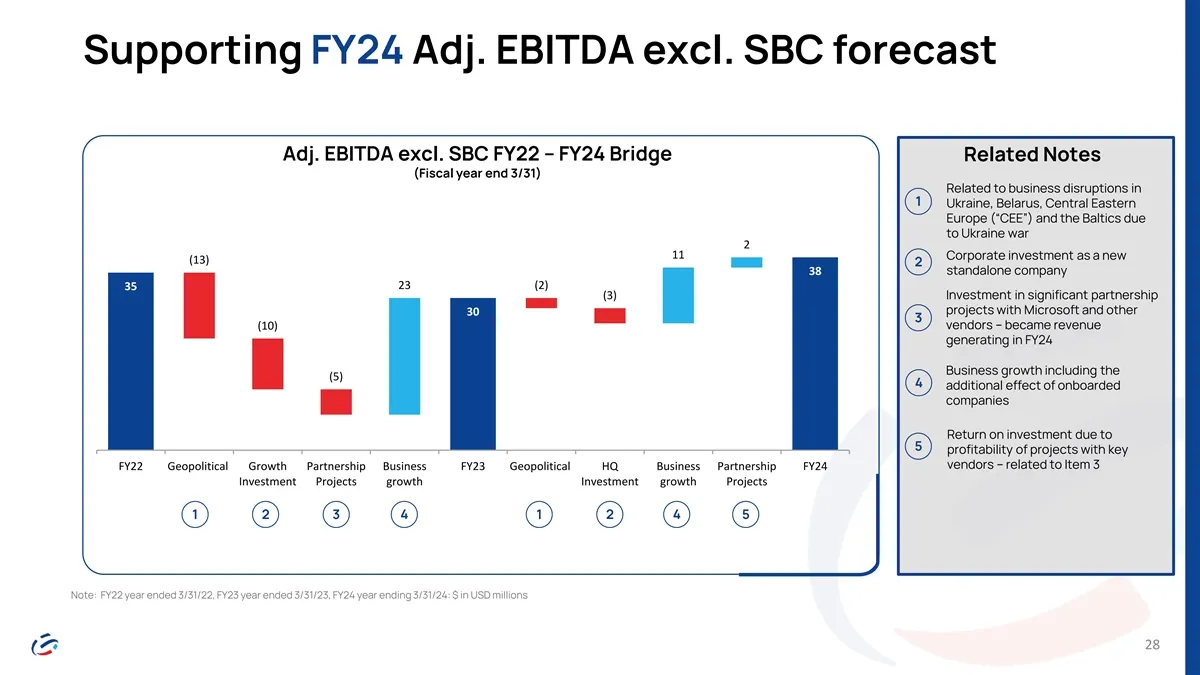
Supporting FY24 Adj. EBITDA excl. SBC forecast Adj. EBITDA excl. SBC FY22 – FY24 Bridge Related Notes (Fiscal year end 3/31) Related to business disruptions in 1 Ukraine, Belarus, Central Eastern Europe (“CEE”) and the Baltics due to Ukraine war 2 11 Corporate investment as a new (13) 2 38 standalon
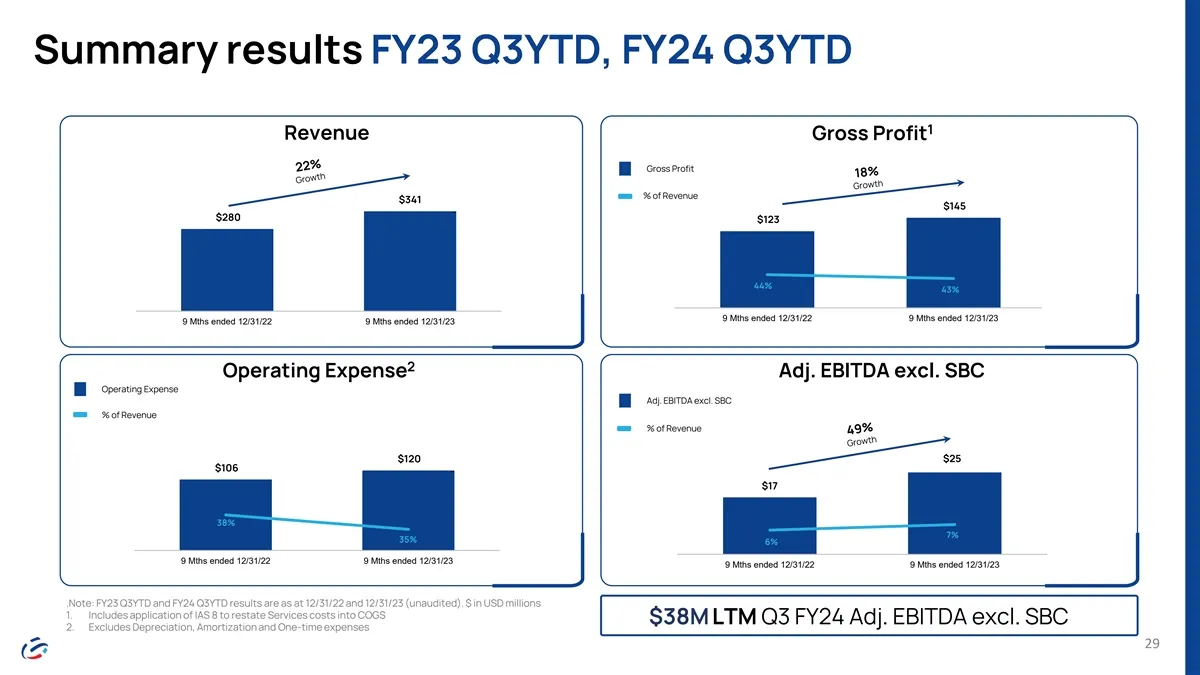
Slide 29: Summary results FY23 Q3YTD, FY24 Q3YTD
Summary results FY23 Q3YTD, FY24 Q3YTD 1 Revenue Gross Profit Gross Profit % of Revenue $341 $145 – 65.0% $280 $123 60.0% 55.0% 50.0% 45.0% 44% 40.0% 43% 35.0% 30.0% 9 Mths ended 12/31/22 9 Mths ended 12/31/23 9 Mths ended 12/31/22 9 Mths ended 12/31/23 2 Operating Expense Adj. EBITDA excl. SBC Oper
Slide 30: Key investment highlights
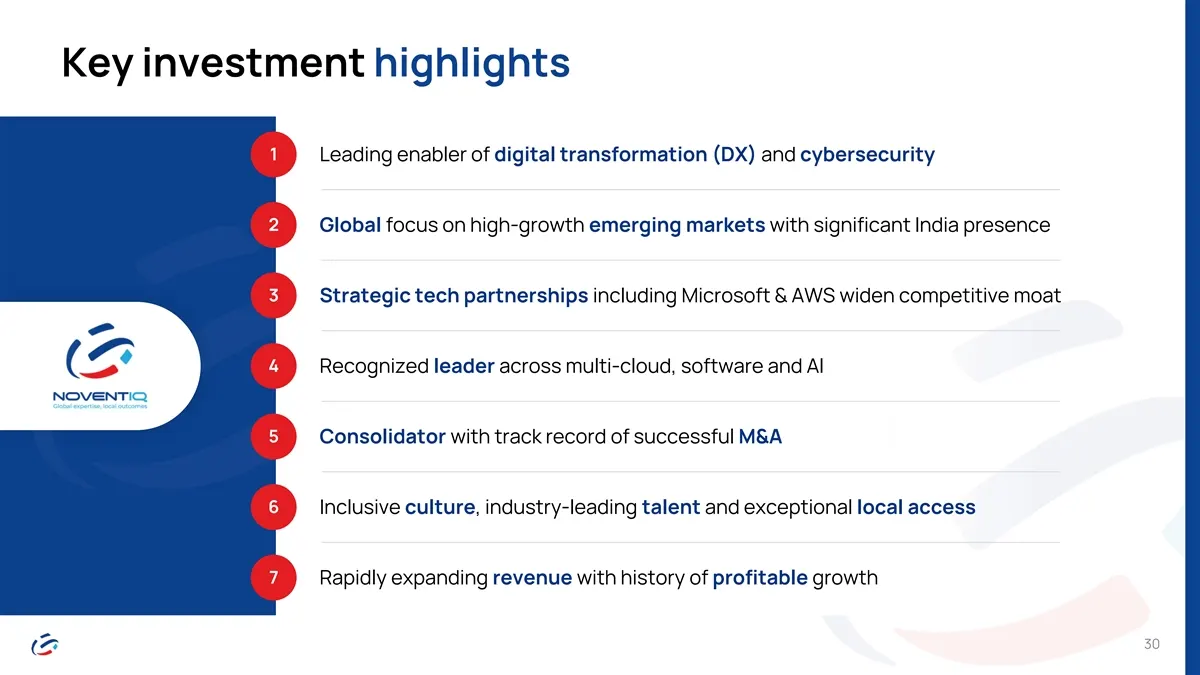
Key investment highlights 1 Leading enabler of digital transformation (DX) and cybersecurity 2 Global focus on high-growth emerging markets with significant India presence 3 Strategic tech partnerships including Microsoft & AWS widen competitive moat 4 Recognized leader across multi-cloud, software

Slide 31: Transaction Structure
— TRANSACTION STRUCTURE
Slide 32: Transaction summary
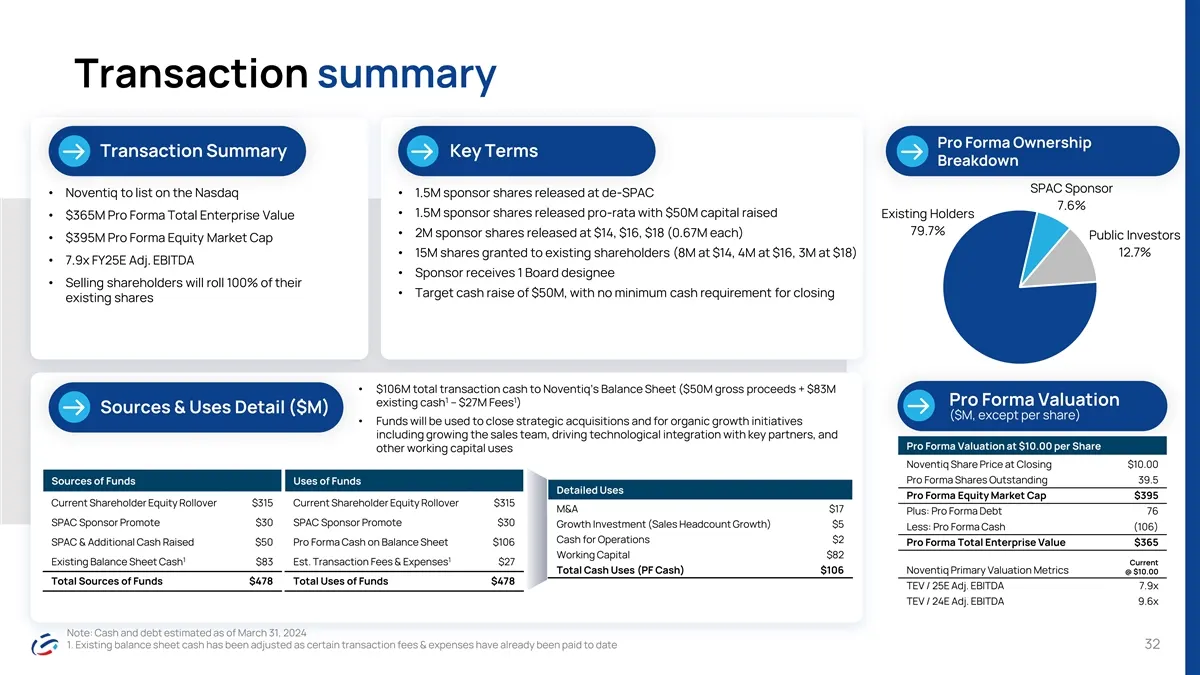
Transaction summary Pro Forma Ownership Transaction Summary Key Terms Breakdown SPAC Sponsor • Noventiq to list on the Nasdaq• 1.5M sponsor shares released at de-SPAC 7.6% • 1.5M sponsor shares released pro-rata with $50M capital raised Existing Holders • $365M Pro Forma Total Enterprise Value 79.7%
Slide 33: Key market comparables
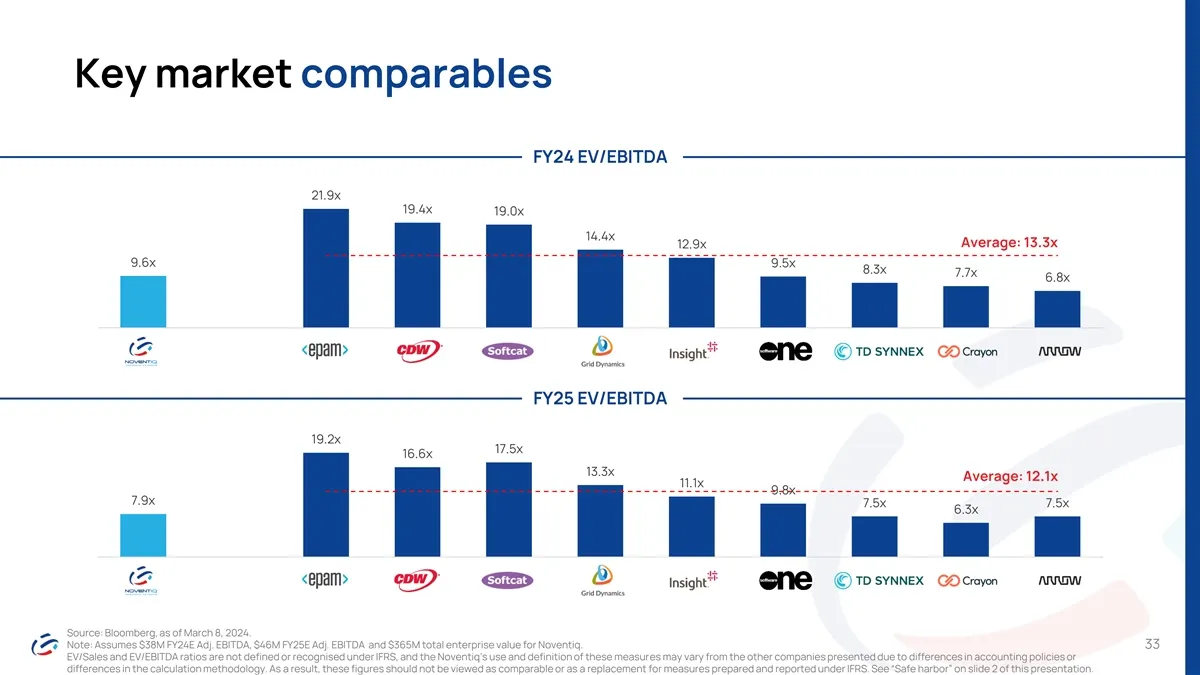
Key market comparables FY24 EV/EBITDA 21.9x 19.4x 19.0x 14.4x Average: 13.3x 12.9x 9.6x 9.5x 8.3x 7.7x 6.8x FY25 EV/EBITDA 19.2x 17.5x 16.6x 13.3x Average: 12.1x 11.1x 9.8x 7.9x 7.5x 7.5x 6.3x Source: Bloomberg, as of March 8, 2024. Note: Assumes $38M FY24E Adj. EBITDA, $46M FY25E Adj. EBITDA and $3
Slide 34: Believe in Noventiq
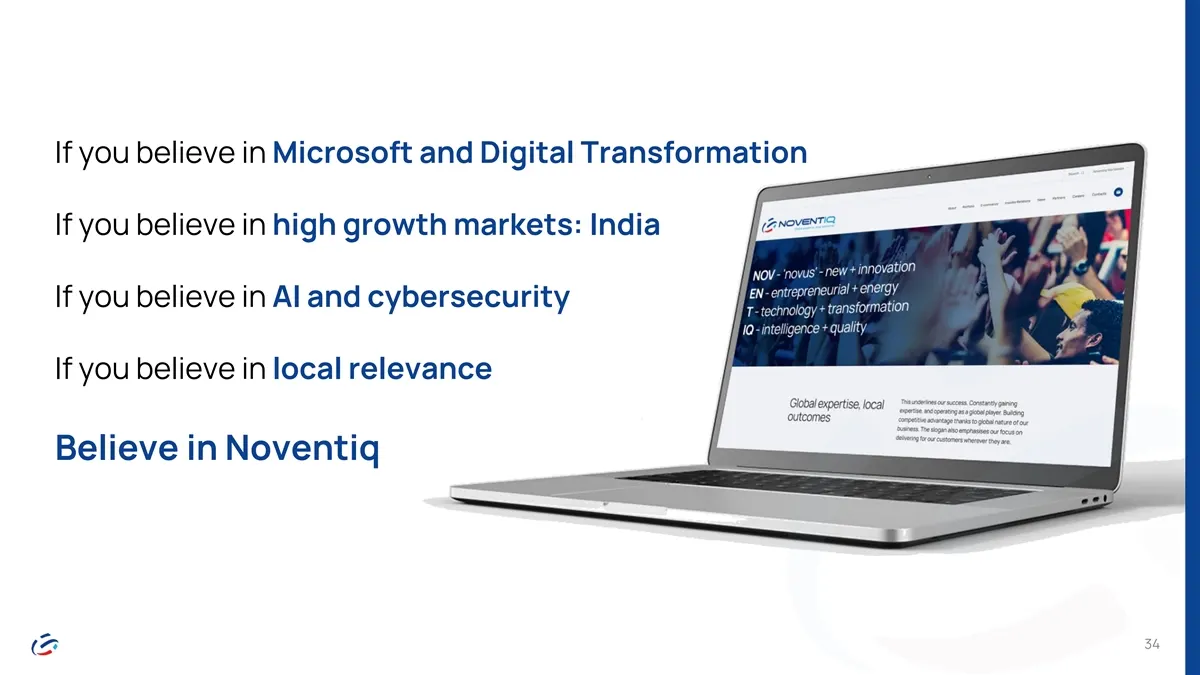
If you believe in Microsoft and Digital Transformation If you believe in high growth markets: India If you believe in AI and cybersecurity If you believe in local relevance Believe in Noventiq 34

Slide 35: Thank you
__ THANK YOU (BNOVENTIQ
Source: SEC EDGAR · 8-K filed Apr 4, 2024