Symrise AG · XETR:SY1
Symrise — Investor Presentation (June 2019)
28 slides from Symrise's investor presentation, June 2019
Slide 1: Symrise Investor Presentation
DISCLAIMER: ”The following document contains protected and confidential information from Symrise and must be kept in confidence. This information may not be used by anyone who obtains it if Symrise has not granted written permission to do so.” Symrise Investor Presentation Olaf Klinger (CFO) – June
Slide 2: Agenda
Agenda Overview — 1 Who is Symrise? 2 Financials 3 Investment Highlights 4 Outlook 5 Appendix — 2
Slide 3: Who is Symrise?
/ Kae ay 3 .. at a WI IO IS symrise ?
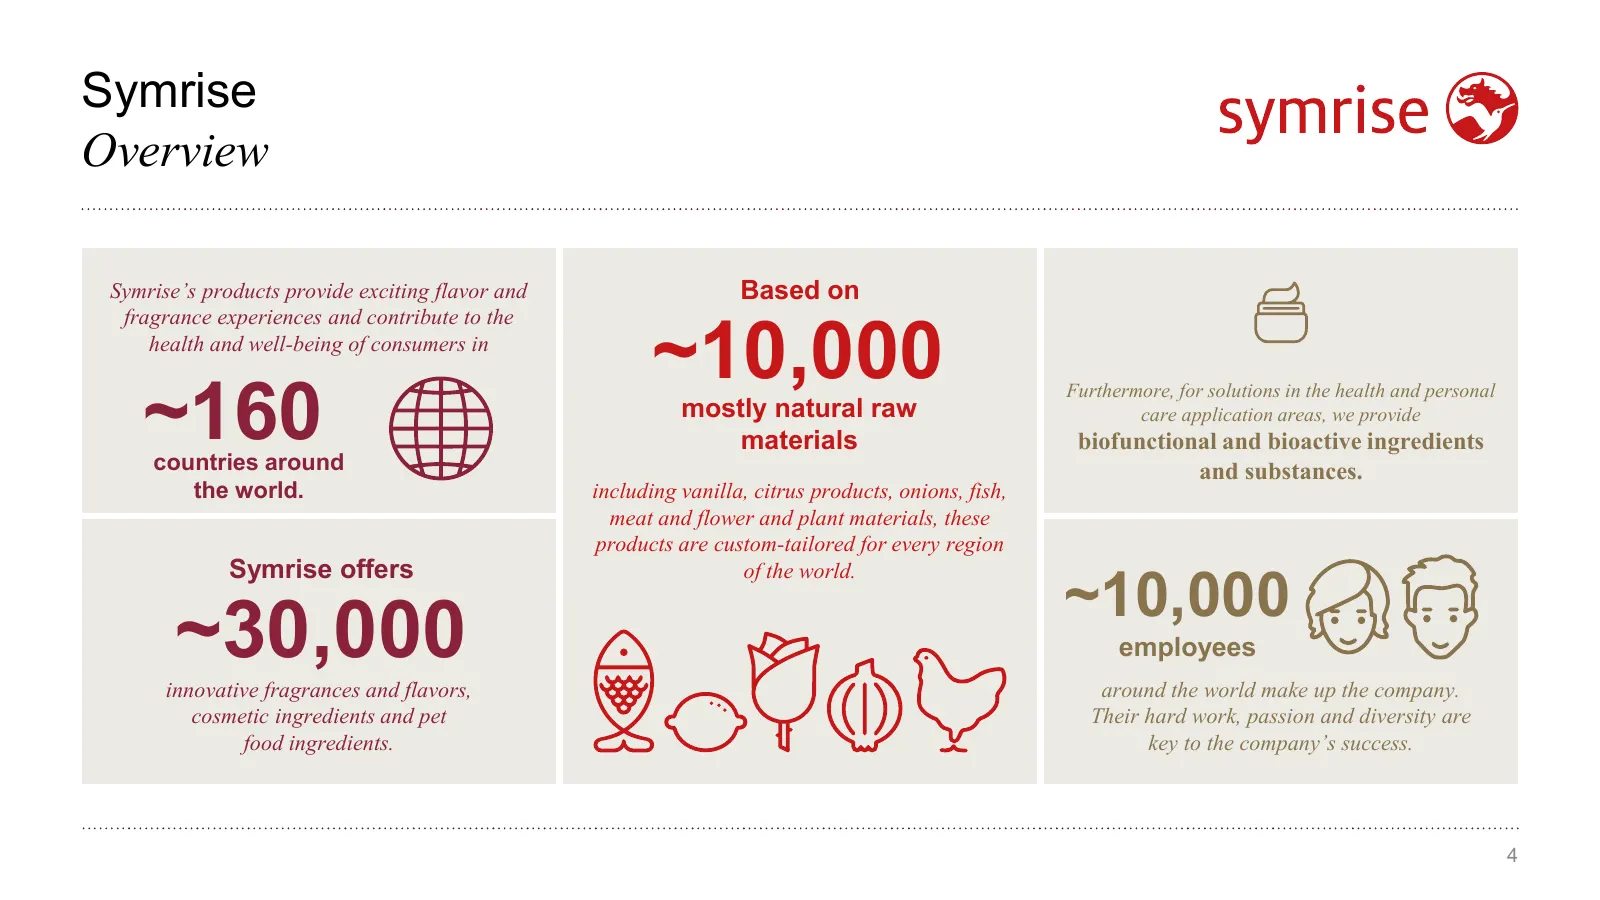
Slide 4: Symrise Overview
Symrise Overview Symrise’s products provide exciting flavor and Based on ~10,000 fragrance experiences and contribute to the health and well-being of consumers in ~160 Furthermore, for solutions in the health and personal mostly natural raw care application areas, we provide materials biofunctional
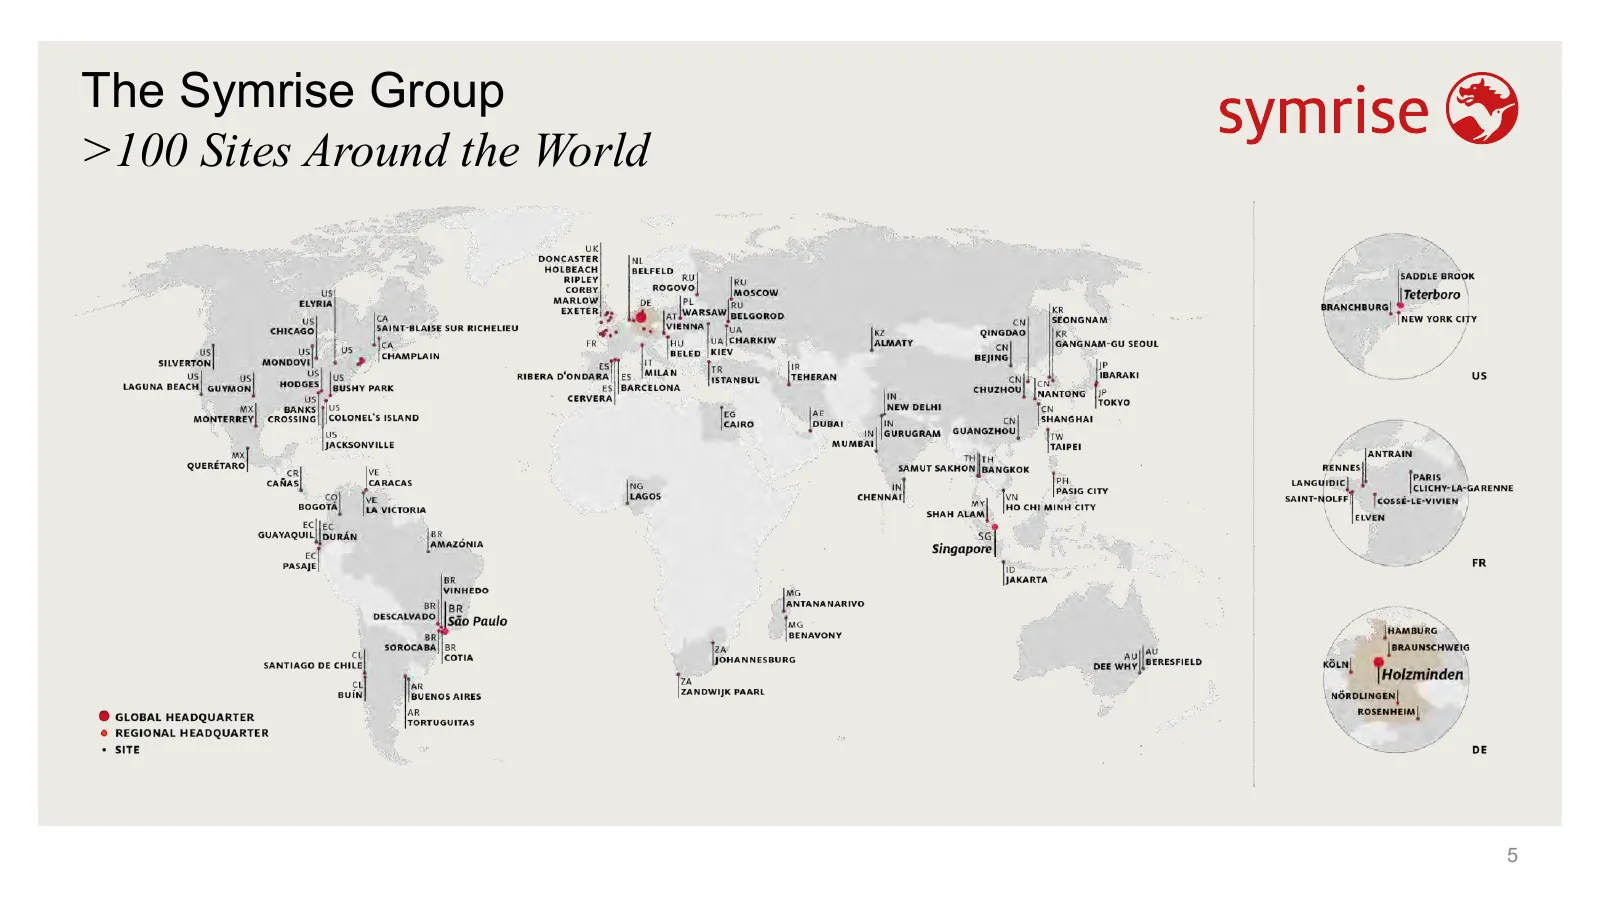
Slide 5: The Symrise Group >100 Sites Around the World
The Symrise Group >100 Sites Around the World 5
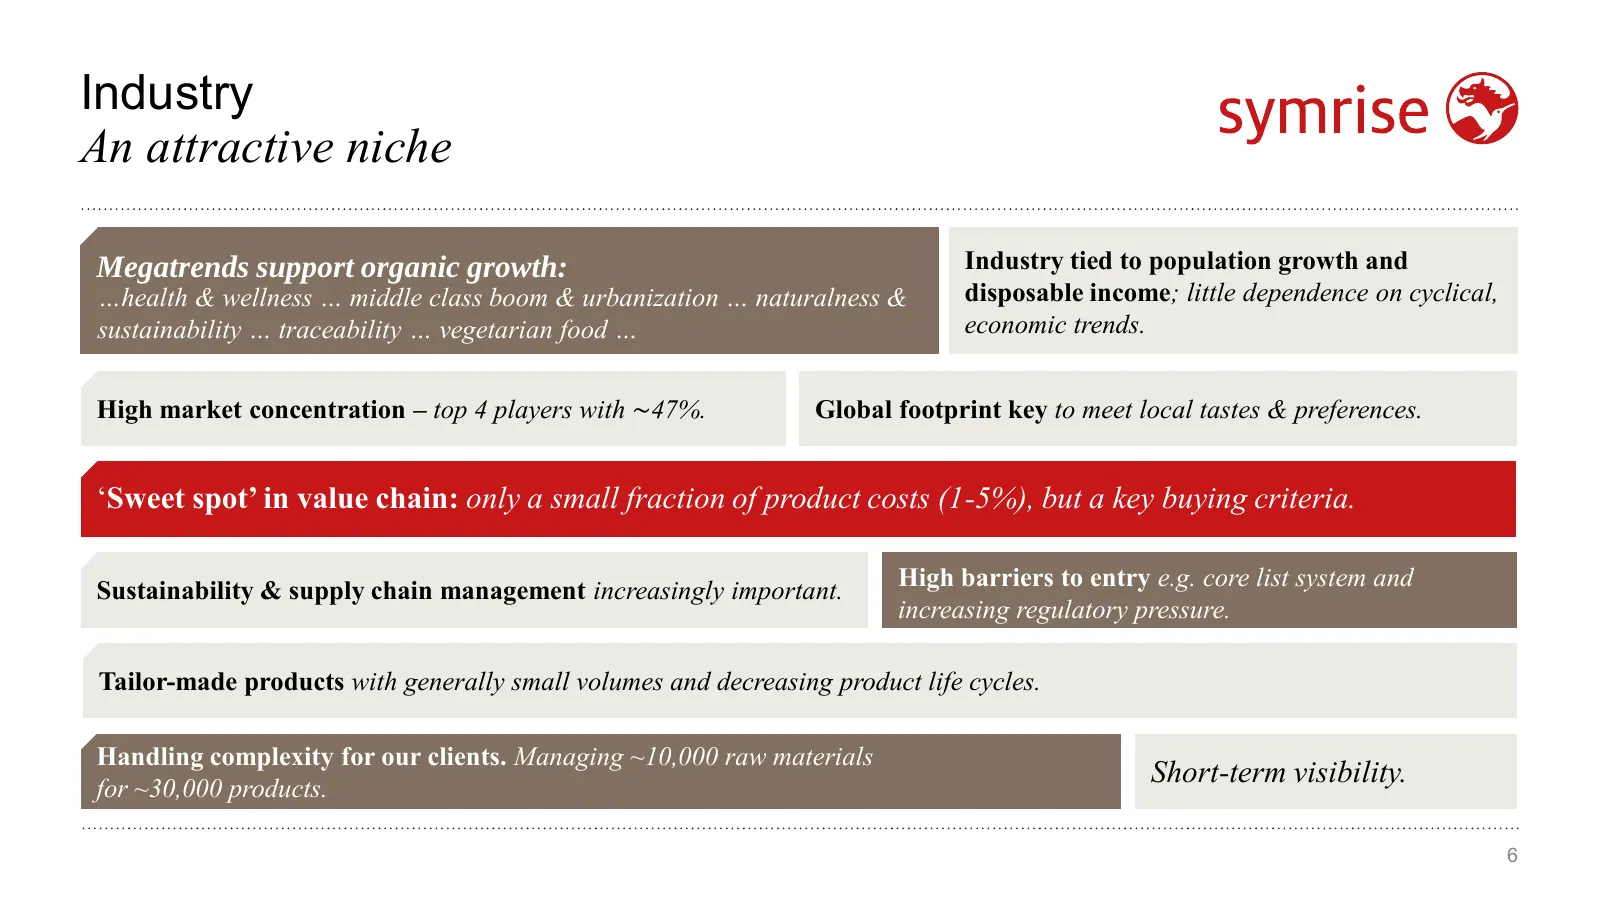
Slide 6: Industry: An attractive niche
Industry An attractive niche Megatrends support organic growth: Industry tied to population growth and …health & wellness … middle class boom & urbanization … naturalness & disposable income; little dependence on cyclical, sustainability … traceability … vegetarian food … economic trends. High marke
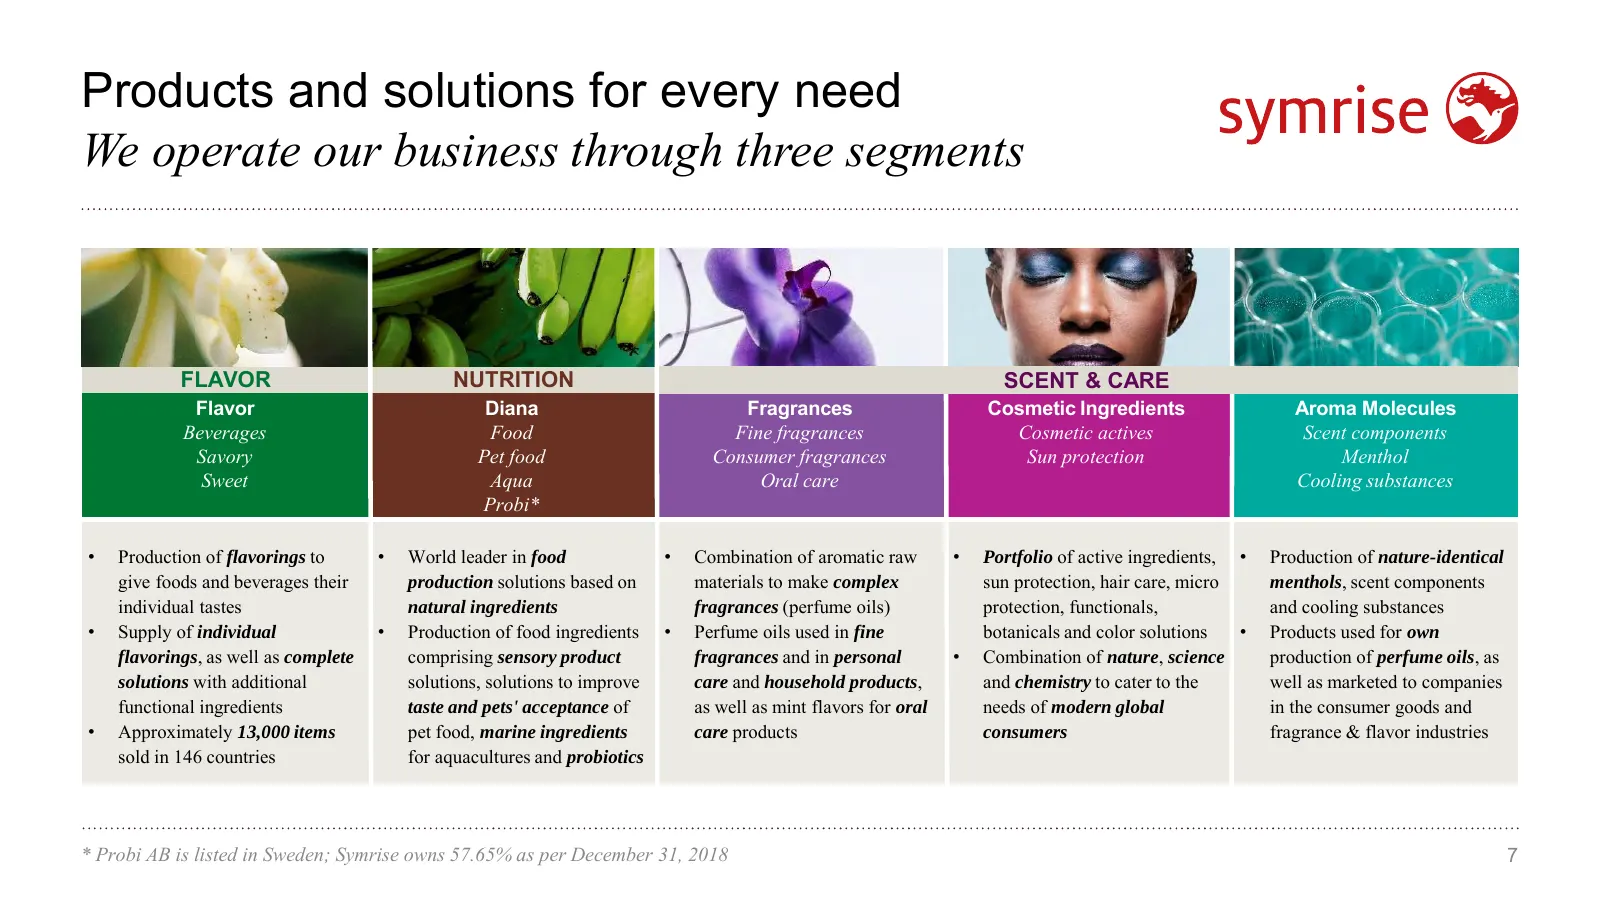
Slide 7: Products and solutions for every need
Products and solutions for every need We operate our business through three segments Sales development In €m FLAVOR NUTRITION SCENT & CARE Flavor Diana Fragrances Cosmetic Ingredients Aroma Molecules Beverages Food Fine fragrances Cosmetic actives Scent components Savory Pet food Consumer fragrances
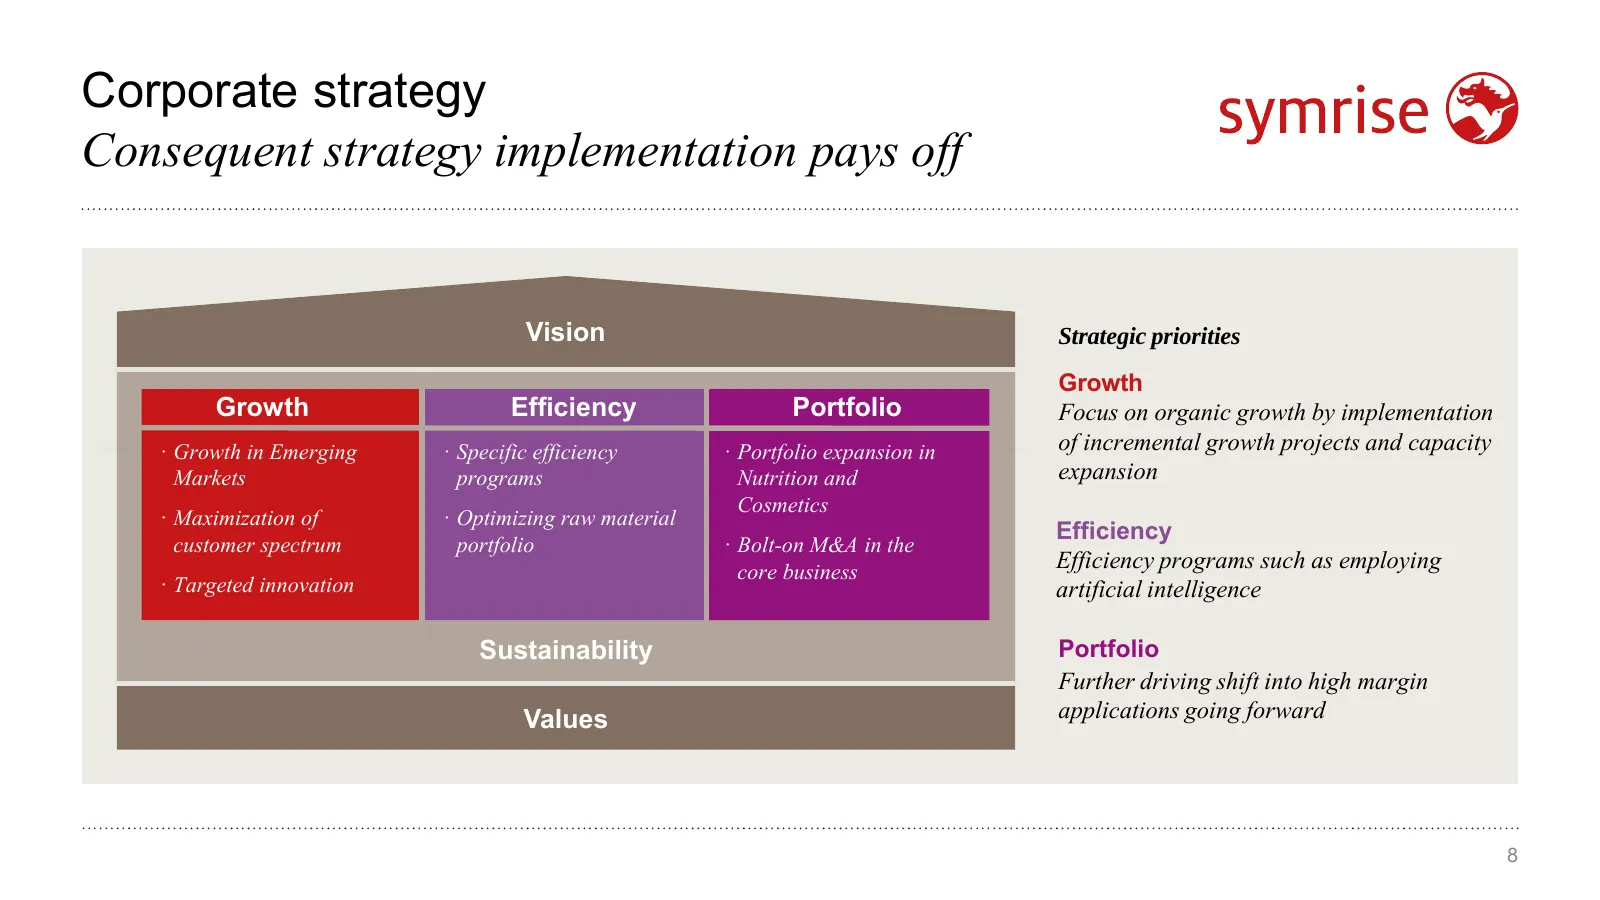
Slide 8: Corporate strategy: Consequent strategy implementation pays off
Corporate strategy Consequent strategy implementation pays off Vision Vision Strategic priorities Growth Growth Efficiency Portfolio Focus on organic growth by implementation · Growth in Emerging · Specific efficiency · Portfolio expansion in of incremental growth projects and capacity Markets progr
Slide 9: Well-balanced Business Portfolio
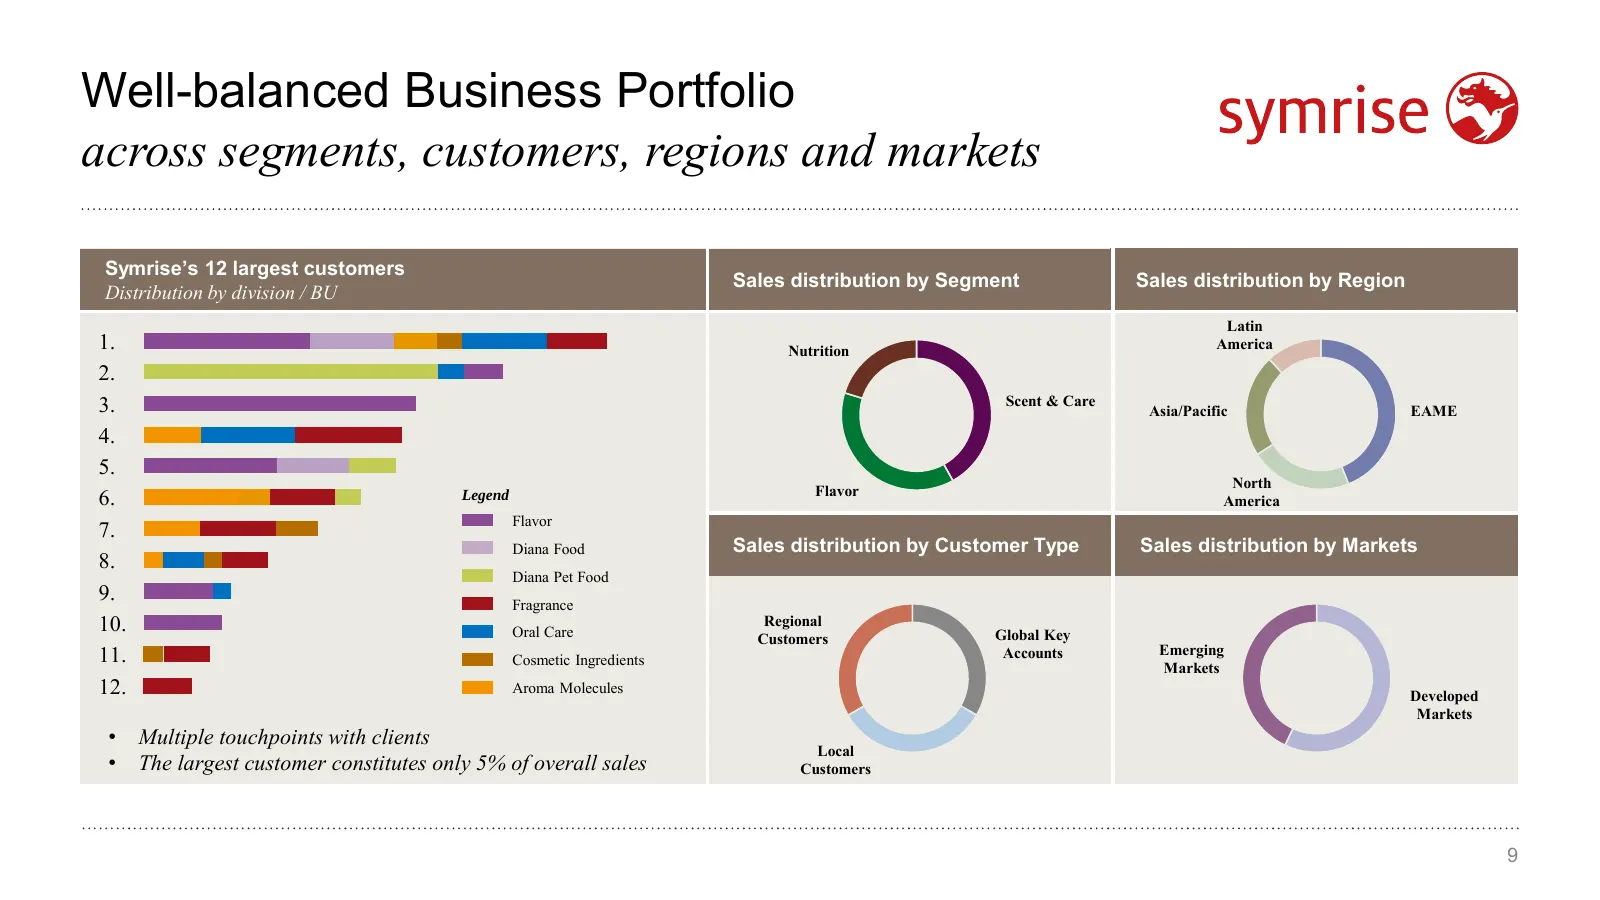
Well-balanced Business Portfolio across segments, customers, regions and markets Symrise’s 12 largest customers Sales distribution by Segment Sales distribution by Region Distribution by division / BU Latin 1. Nutrition America 2. 3. Scent & Care Asia/Pacific EAME 4. 5. North Flavor 6. Legend Americ
Slide 10: Beyond traditional Flavor & Fragrances: Building a unique portfolio
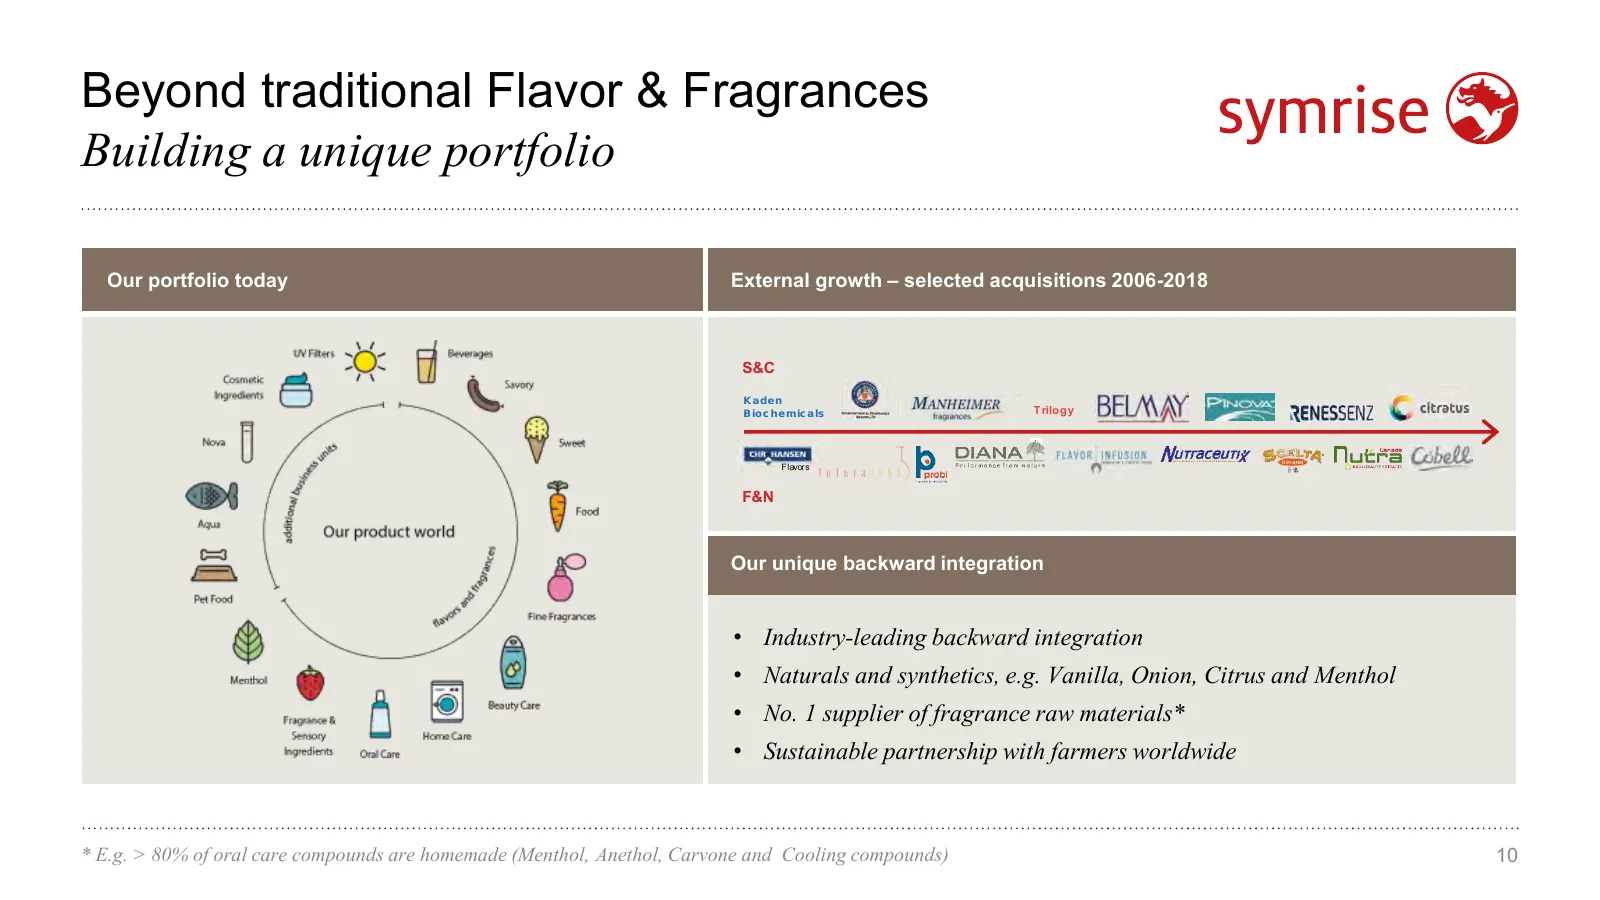
Beyond traditional Flavor & Fragrances Building a unique portfolio Our portfolio today External growth – selected acquisitions 2006-2018 S&C Kaden Biochemicals T rilogy Flavors F&N Our unique backward integration • Industry-leading backward integration • Naturals and synthetics, e.g. Vanilla, Onion,
Slide 11: Growth and Sustainable Business by implementing the UN Sustainable Development Goals
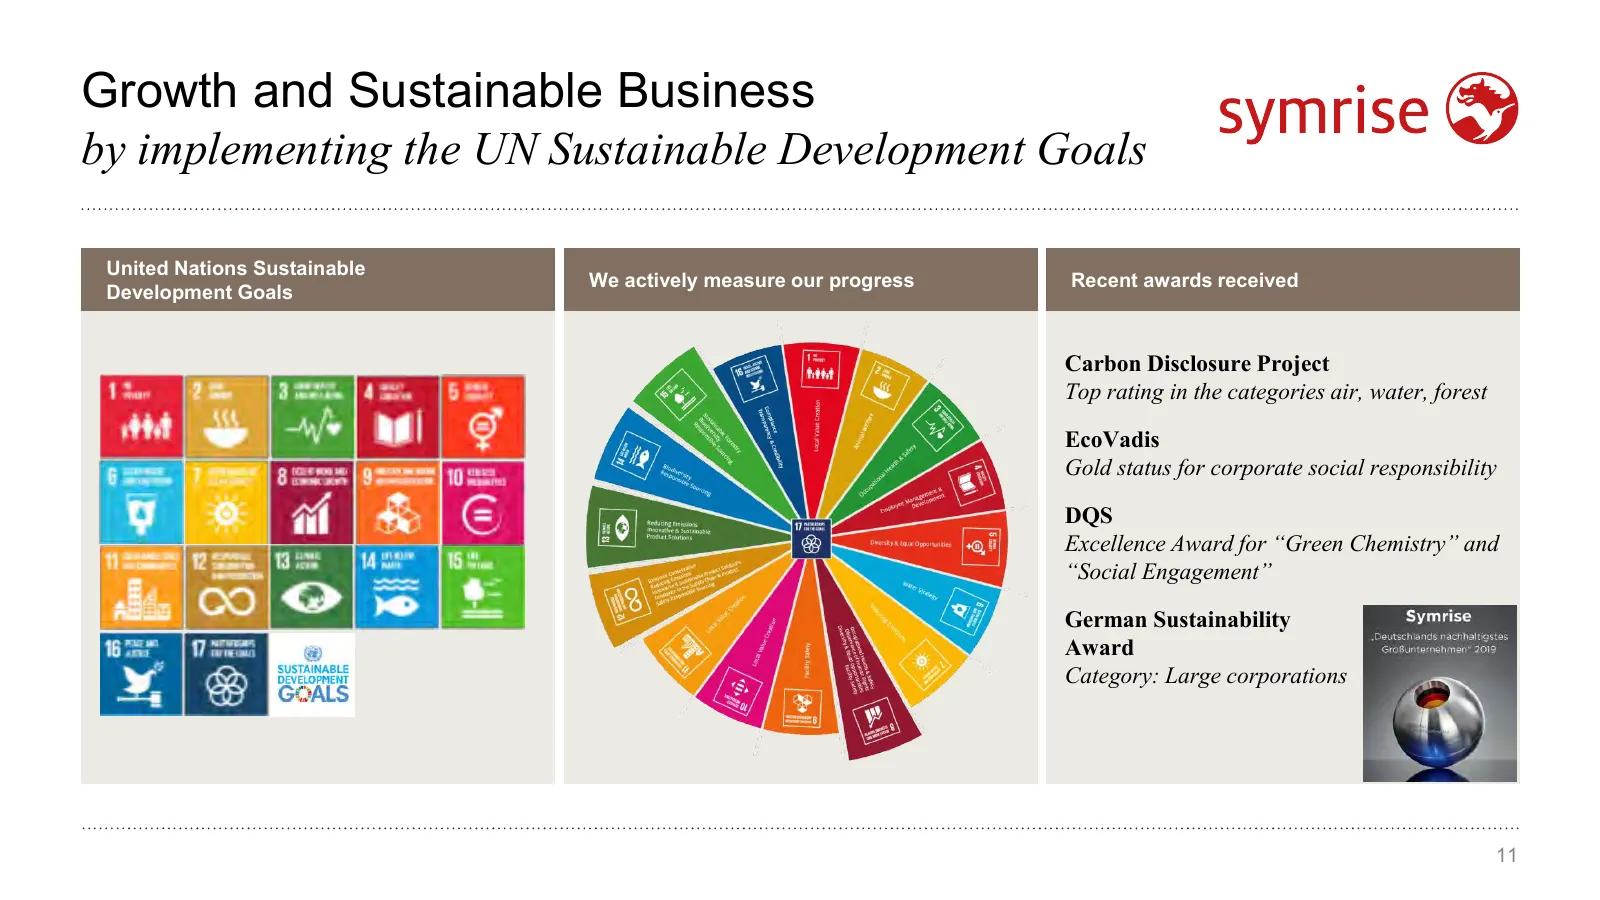
Growth and Sustainable Business by implementing the UN Sustainable Development Goals United Nations Sustainable We actively measure our progress Recent awards received Development Goals Carbon Disclosure Project Top rating in the categories air, water, forest EcoVadis Gold status for corporate socia
Slide 12: Financials
Financials 12
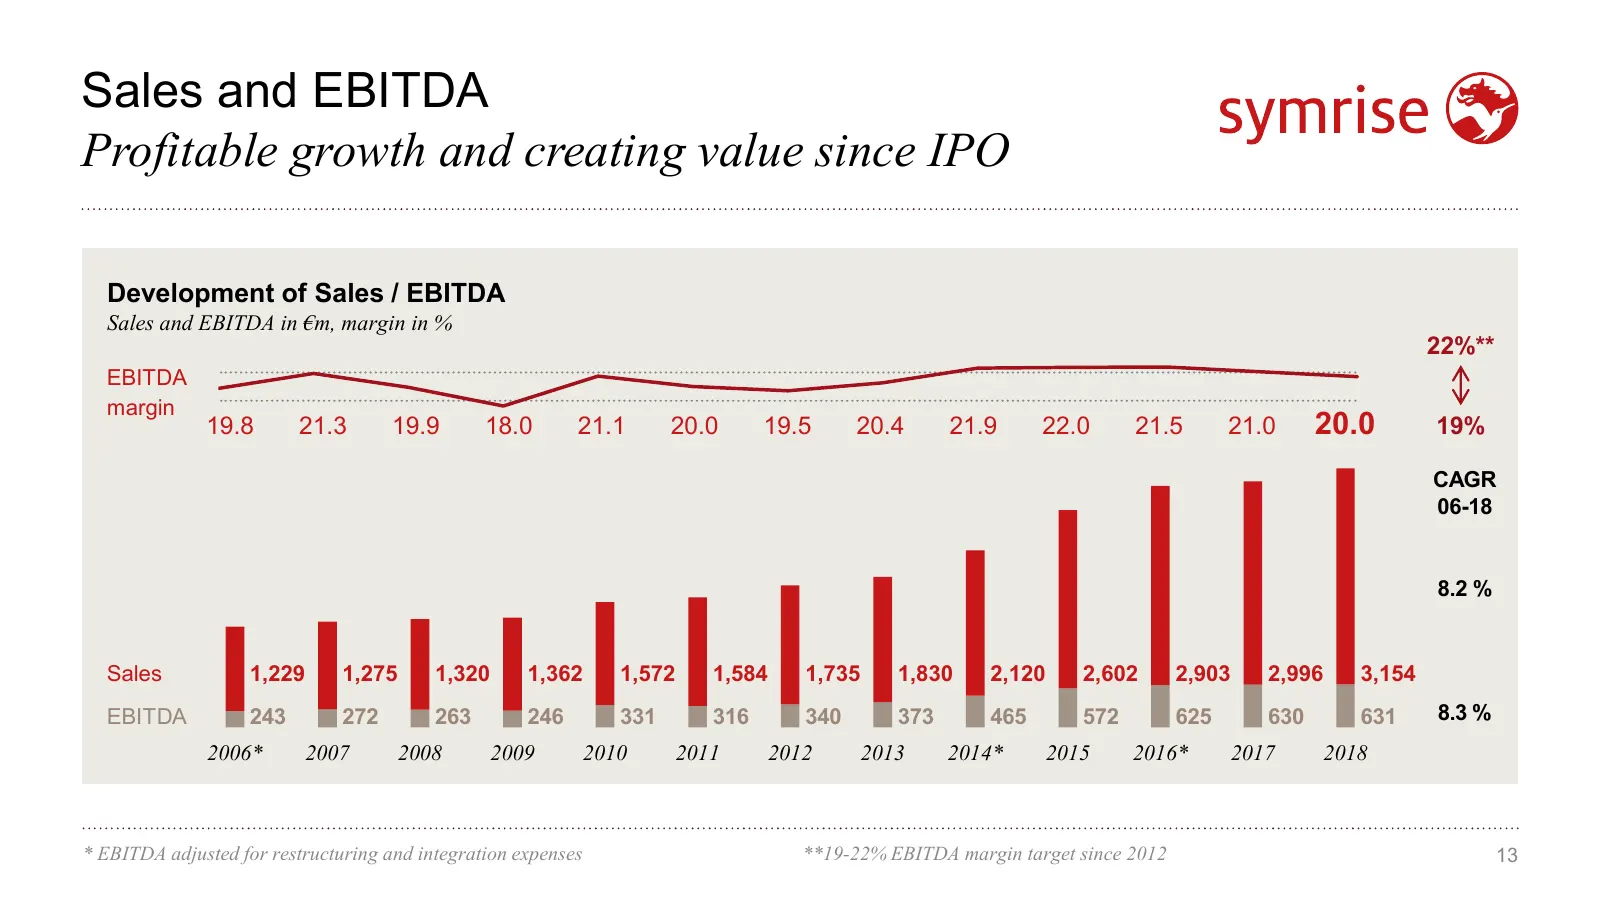
Slide 13: Sales and EBITDA: Profitable growth and creating value since IPO
Sales and EBITDA Profitable growth and creating value since IPO Development of Sales / EBITDA Sales and EBITDA in €m, margin in % 22%** EBITDA margin 19.8 21.3 19.9 18.0 21.1 20.0 19.5 20.4 21.9 22.0 21.5 21.0 20.0 19% CAGR 06-18 8.2 % Sales 1,229 1,275 1,320 1,362 1,572 1,584 1,735 1,830 2,120 2,60
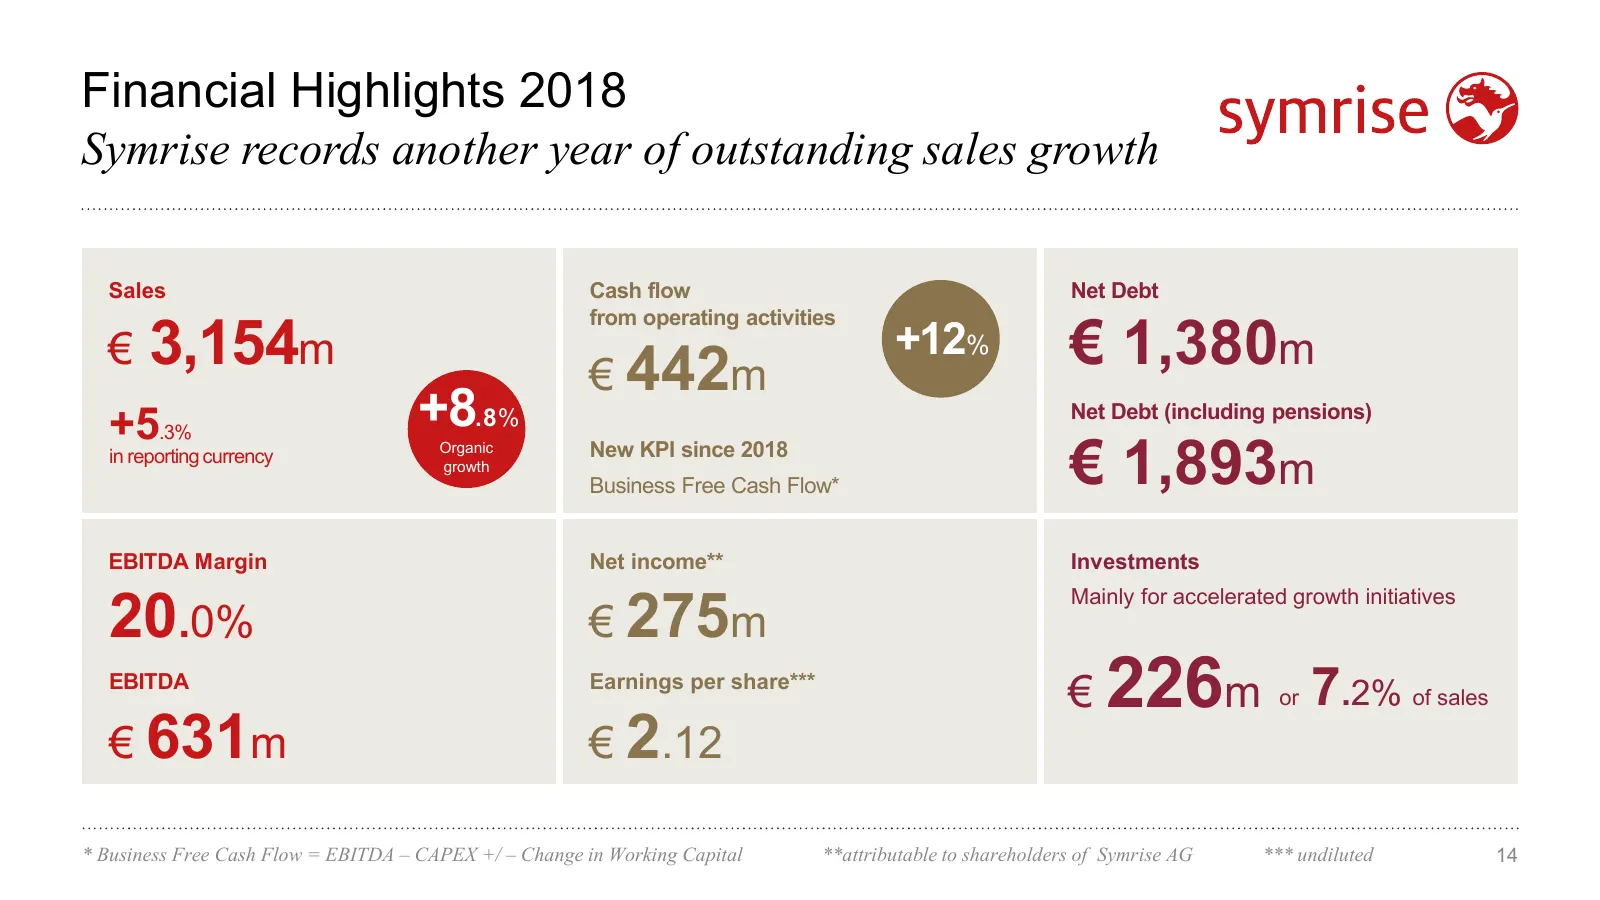
Slide 14: Financial Highlights 2018
Financial Highlights 2018 Symrise records another year of outstanding sales growth Sales Cash flow Net Debt € 3,154m € 1,380m from operating activities +12% € 442m +5.3% +8.8% Net Debt (including pensions) in reporting currency Organic growth New KPI since 2018 Business Free Cash Flow* € 1,893m EBIT
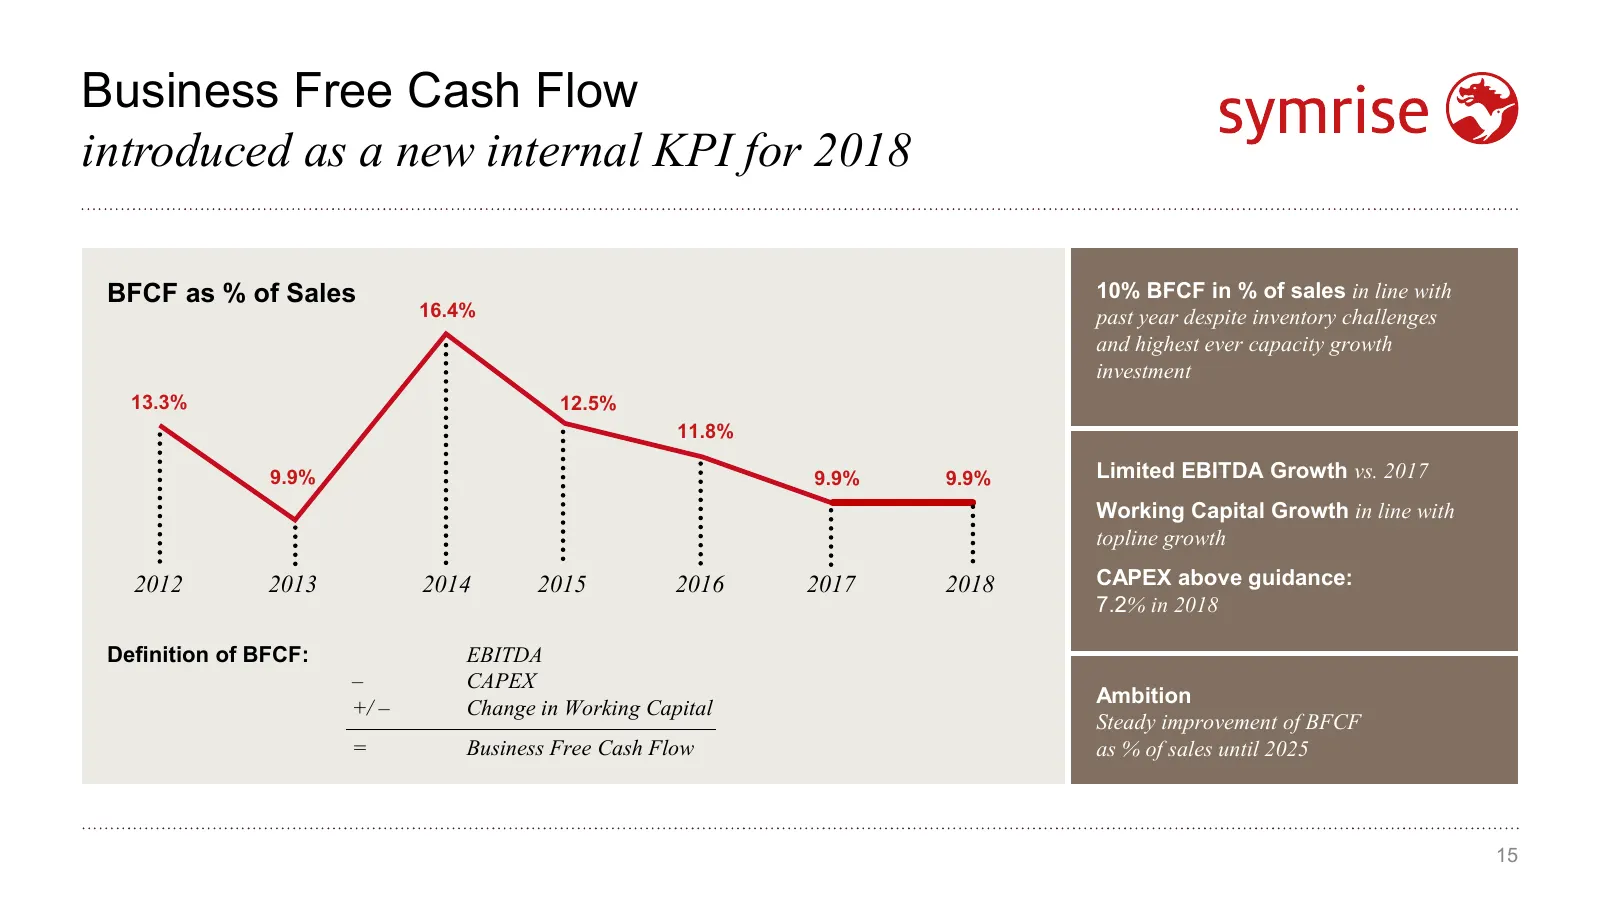
Slide 15: Business Free Cash Flow introduced as a new internal KPI for 2018
Business Free Cash Flow introduced as a new internal KPI for 2018 BFCF as % of Sales 10% BFCF in % of sales in line with 16.4% past year despite inventory challenges and highest ever capacity growth investment 13.3% 12.5% 11.8% 9.9% 9.9% 9.9% Limited EBITDA Growth vs. 2017 Working Capital Growth in
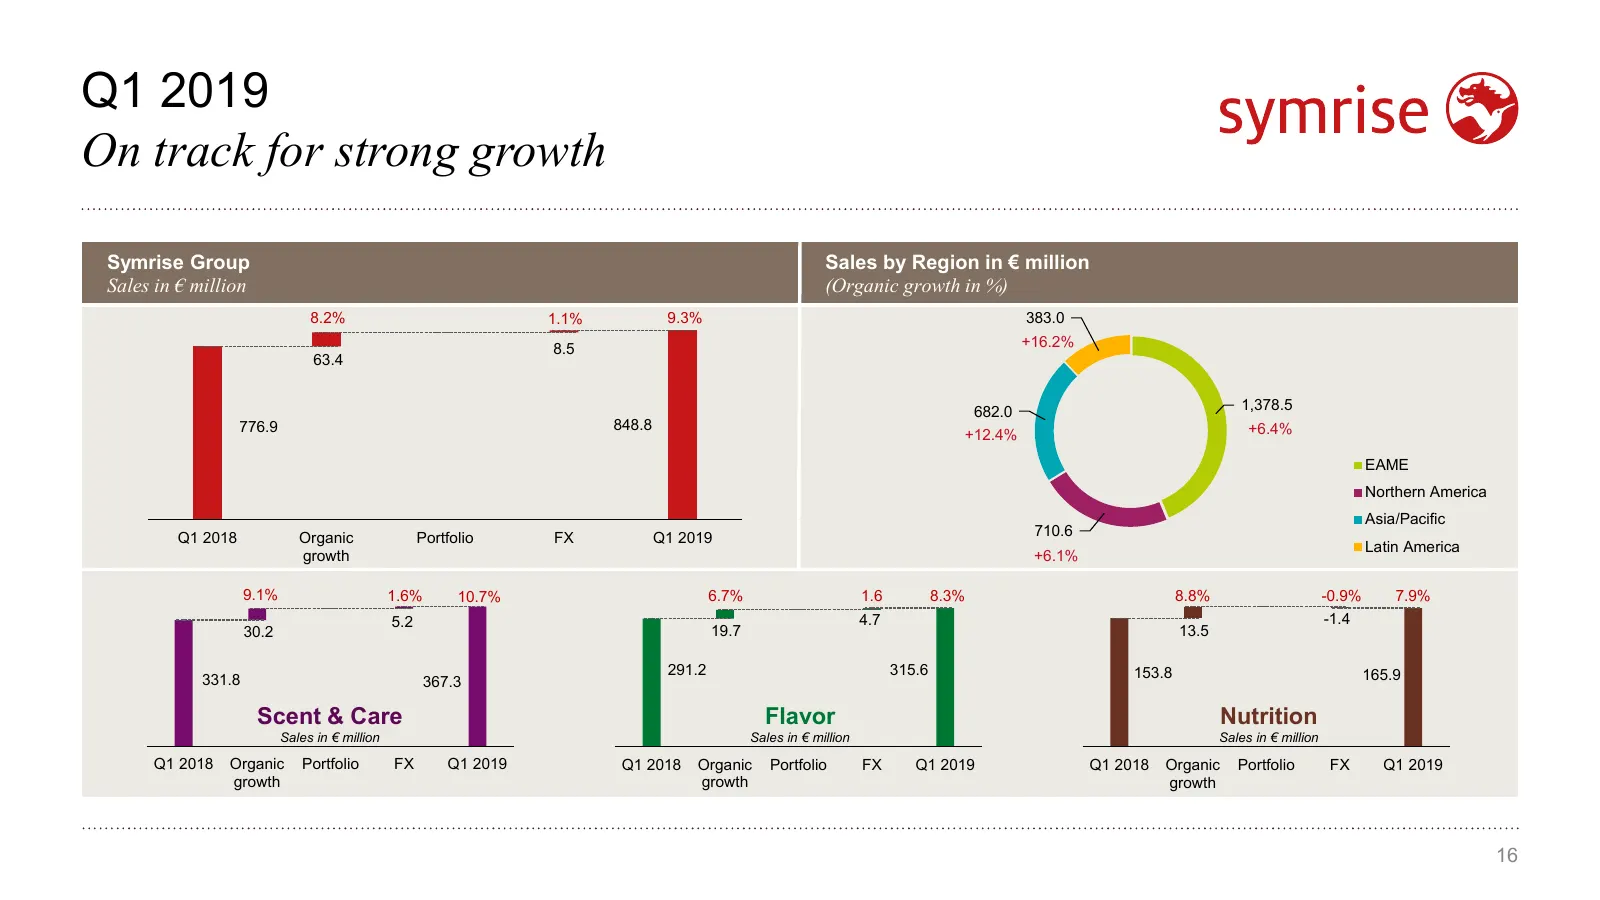
Slide 16: Q1 2019: On track for strong growth
Q1 2019 On track for strong growth Symrise Group Sales by Region in € million Sales in € million (Organic growth in %) 8.2% 1.1% 9.3% 383.0 8.5 +16.2% 63.4 682.0 1,378.5 776.9 848.8 +6.4% +12.4% EAME Northern America Asia/Pacific Q1 2018 Organic Portfolio FX Q1 2019 710.6 Latin America growth +6.1%
Slide 17: Investment Highlights
Investment Highlights 17
Slide 18: Investment Highlights: Diversified, stable and profitable growth
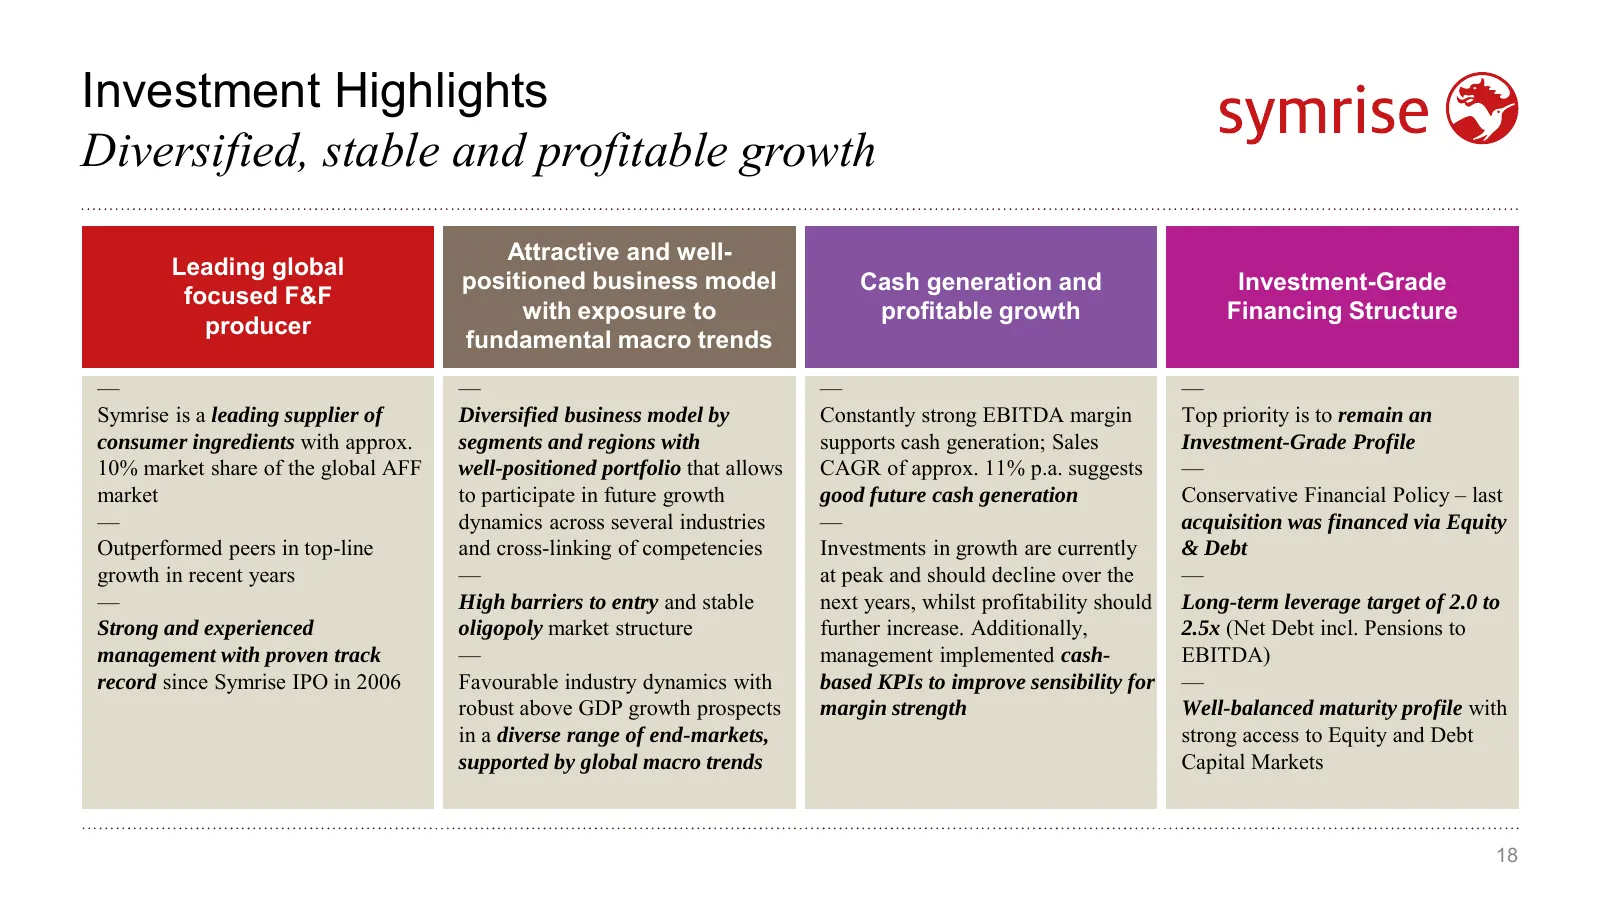
Investment Highlights Diversified, stable and profitable growth Attractive and well- Leading global positioned business model Cash generation and Investment-Grade focused F&F with exposure to profitable growth Financing Structure producer fundamental macro trends — — — — Symrise is a leading supplie
Slide 19: Outlook
Outlook 19
Slide 20: Outlook 2019: Confident to achieve targets
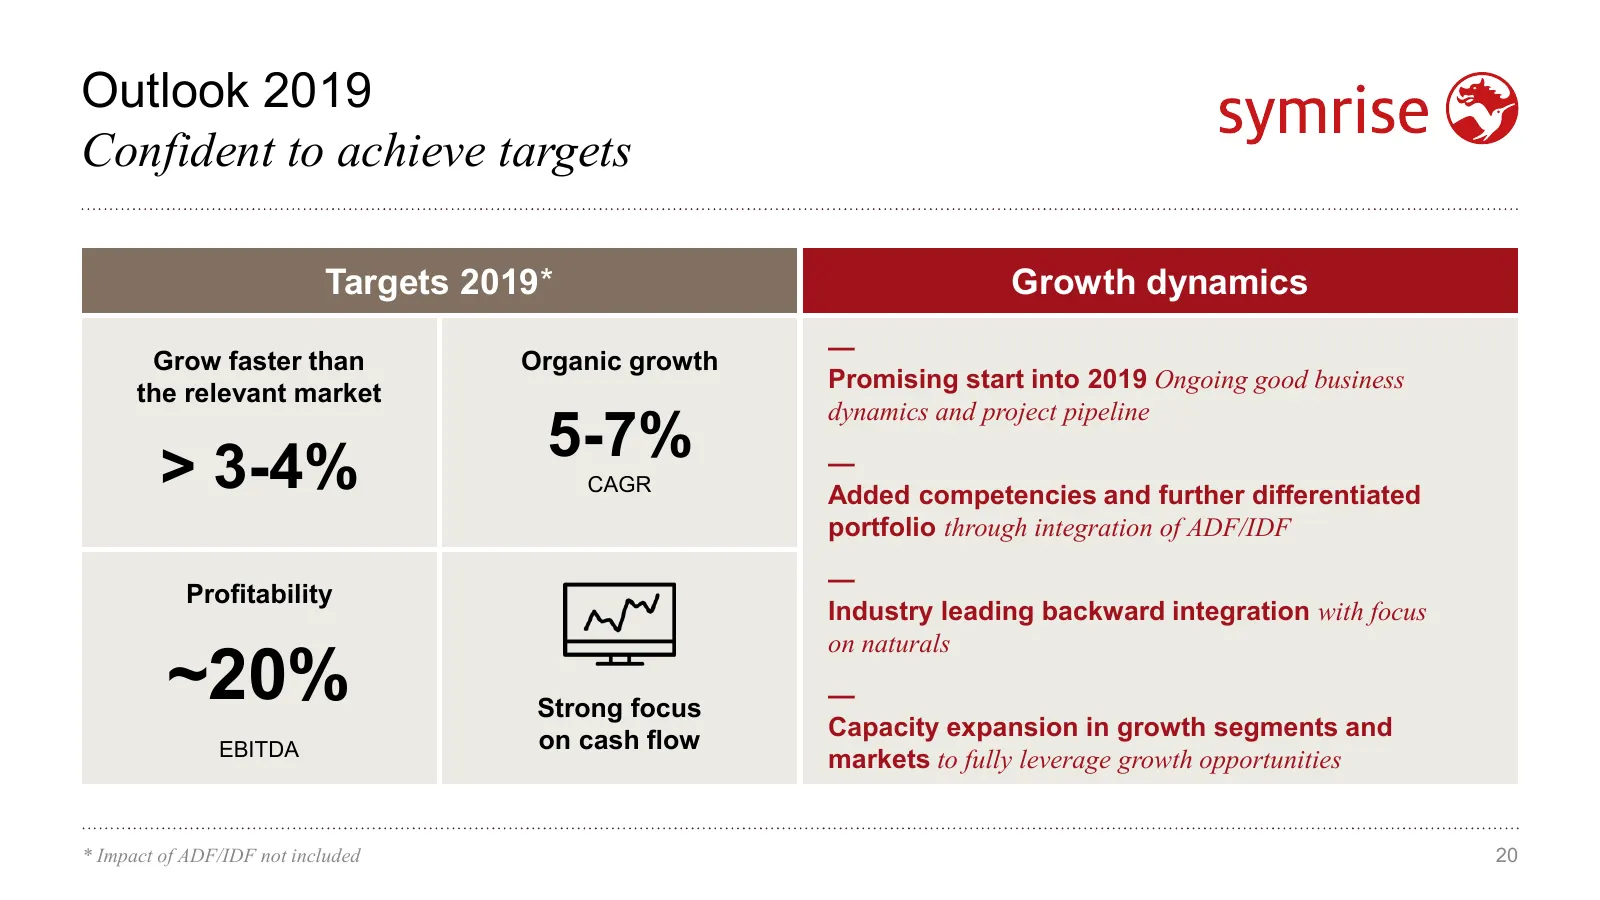
Outlook 2019 Confident to achieve targets Targets 2019* Growth dynamics — Grow faster than Organic growth Promising start into 2019 Ongoing good business the relevant market 5-7% dynamics and project pipeline > 3-4% CAGR — Added competencies and further differentiated portfolio through integration o
Slide 21: Driving growth through targeted investments
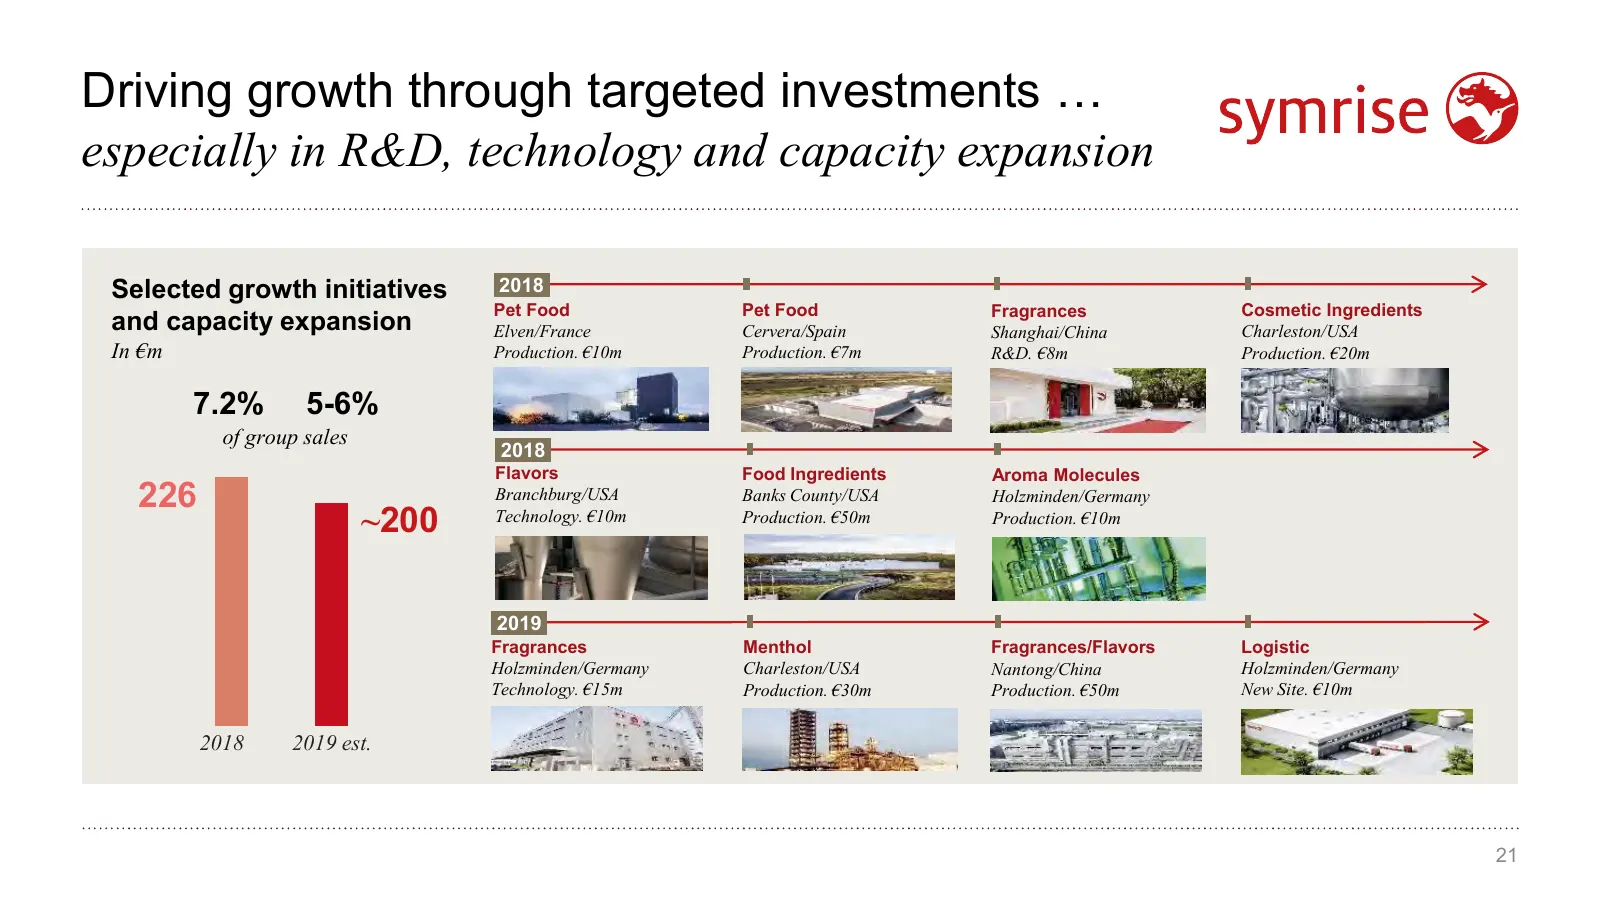
Driving growth through targeted investments … especially in R&D, technology and capacity expansion Selected growth initiatives 2018 Pet Food Pet Food Fragrances Cosmetic Ingredients and capacity expansion Elven/France Cervera/Spain Shanghai/China Charleston/USA In €m Production. €10m Production. €7m
Slide 22: Carefully selected acquisitions like ADF/IDF
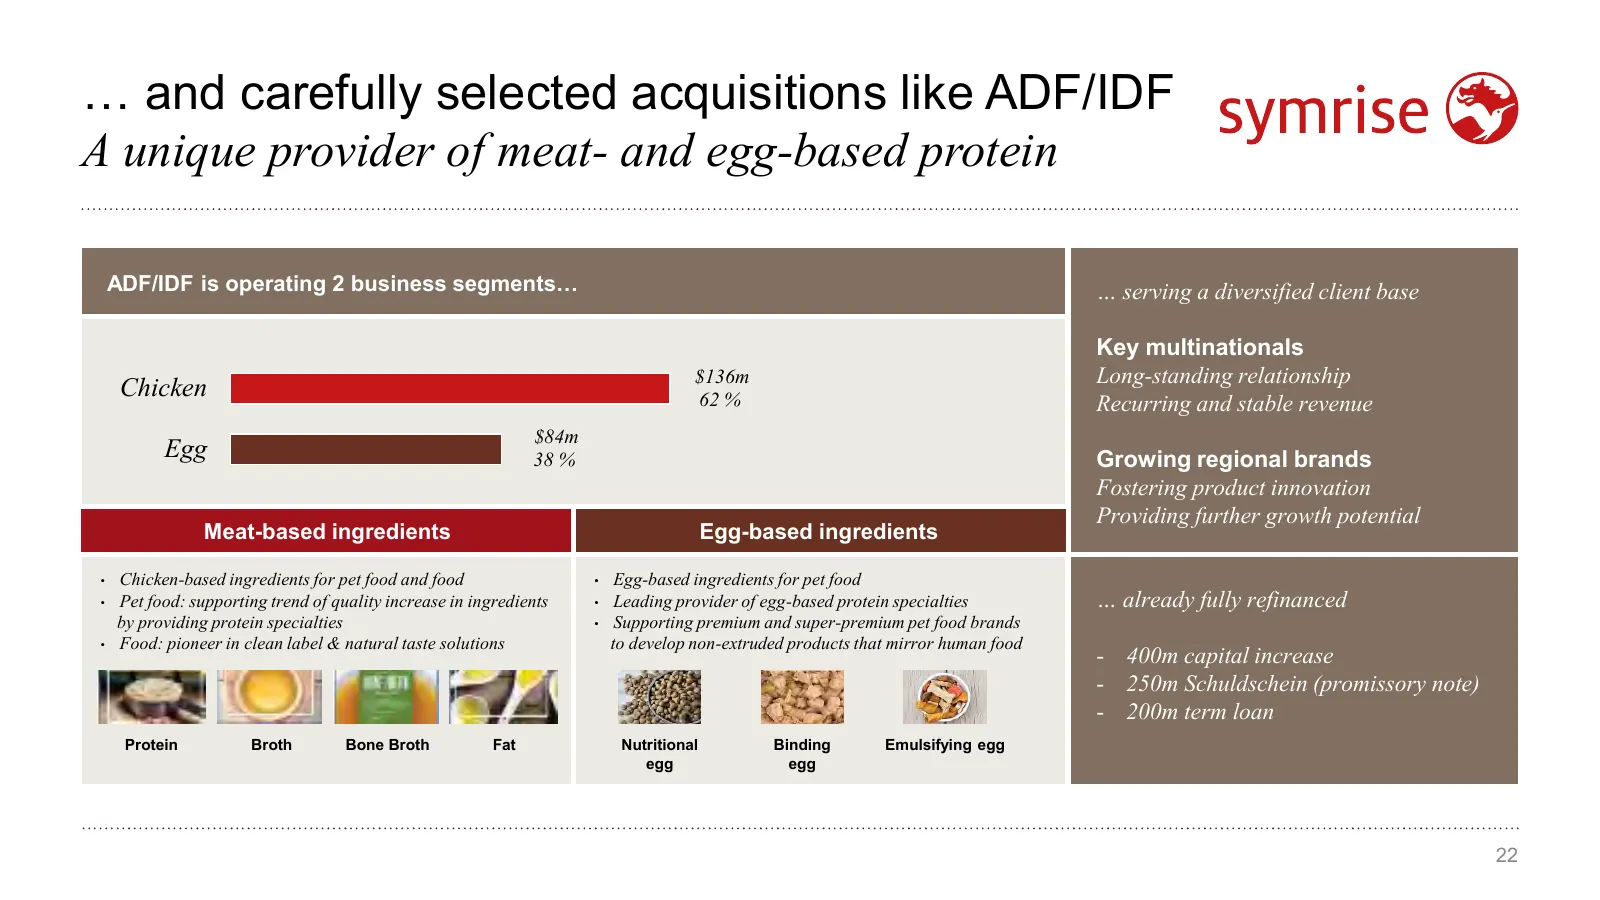
… and carefully selected acquisitions like ADF/IDF A unique provider of meat- and egg-based protein ADF/IDF • is operating 2 business segments… … serving a diversified client base Key multinationals $136m Long-standing relationship Chicken 62 % Recurring and stable revenue $84m Egg 38 % Growing regi
Slide 23: Objectives 2025: Supported by our proven strategy
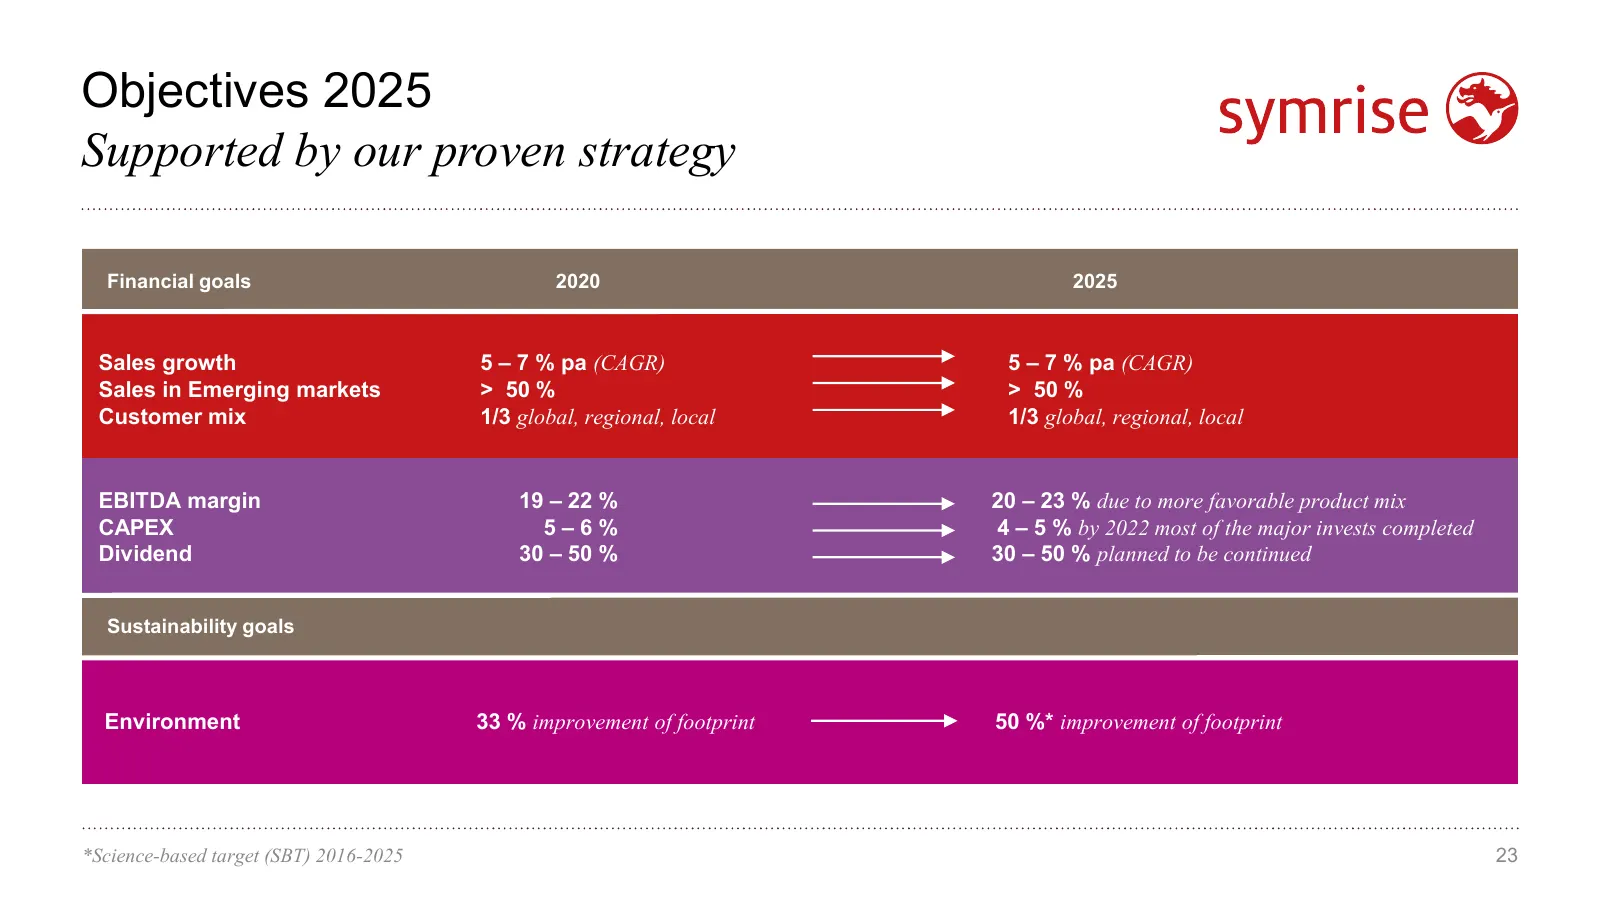
Objectives 2025 Supported by our proven strategy Financial goals 2020 2025 Financial goals 2020 2025 Sales Salesgrowth growth 55––77%%pa pa(CAGR) (CAGR) 5 – 7 % pa (CAGR) Sales Salesinin Emerging markets Emerging markets >> 50 % 50 % > 50 % Customer mix Customer mix 1/3 1/3global, global,regional, r
Slide 24: Symrise AG Financial Calendar & Contact
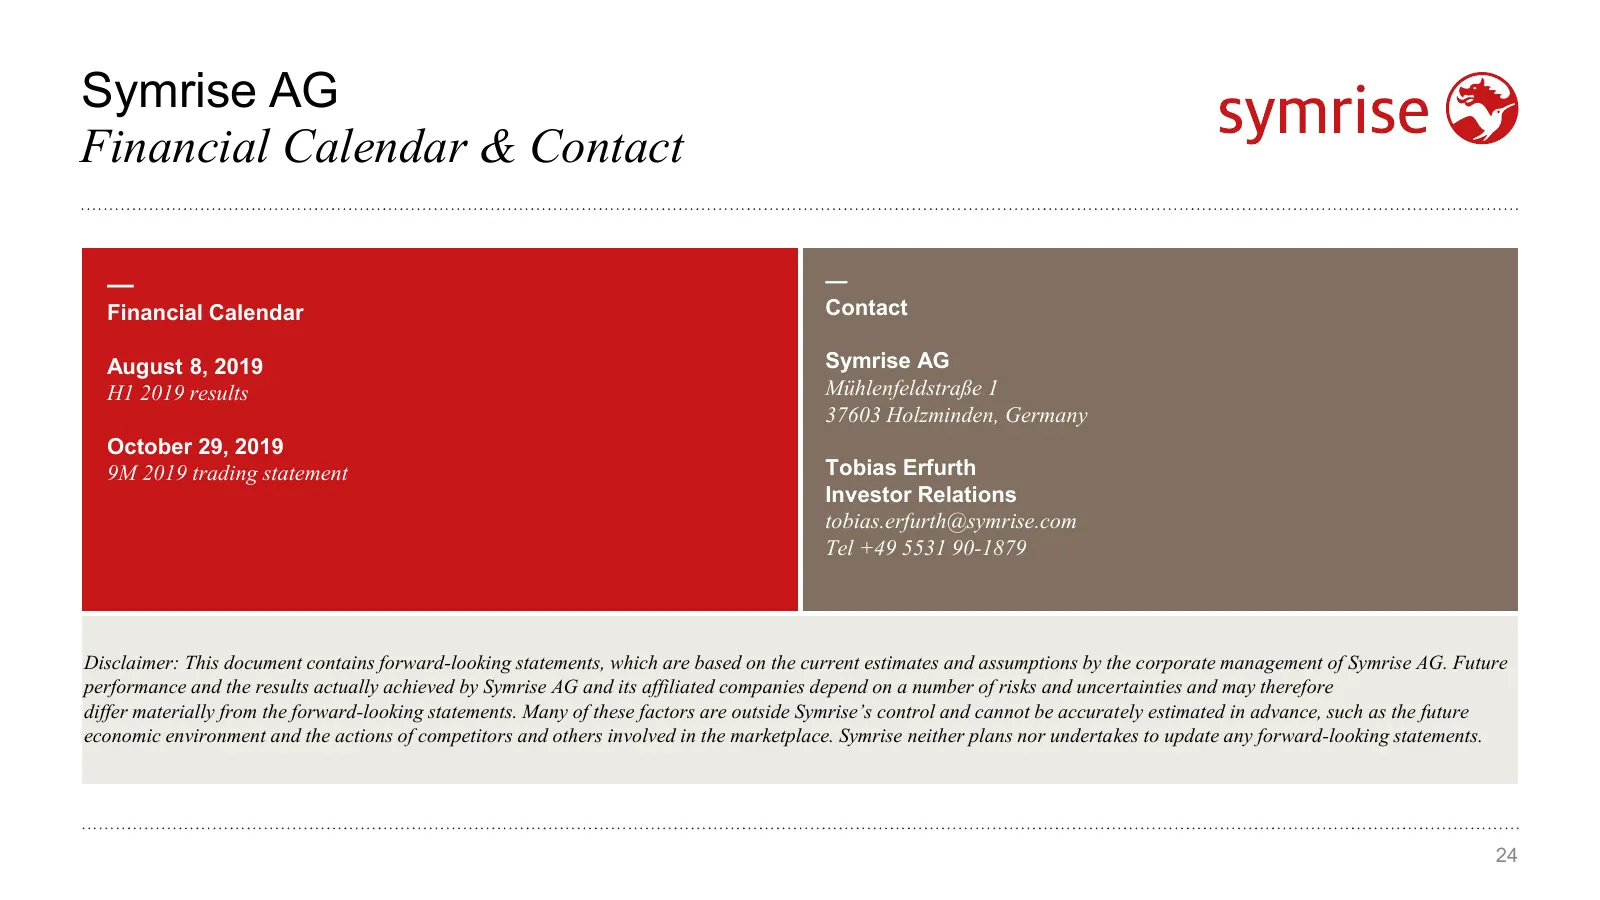
Symrise AG Financial Calendar & Contact — — Financial Calendar Contact August 8, 2019 Symrise AG H1 2019 results Mühlenfeldstraße 1 37603 Holzminden, Germany October 29, 2019 9M 2019 trading statement Tobias Erfurth Investor Relations tobias.erfurth@symrise.com Tel +49 5531 90-1879 Disclaimer: This
Slide 25: Appendix
Appendix 25
Slide 26: Appendix: Solid Financing Structure
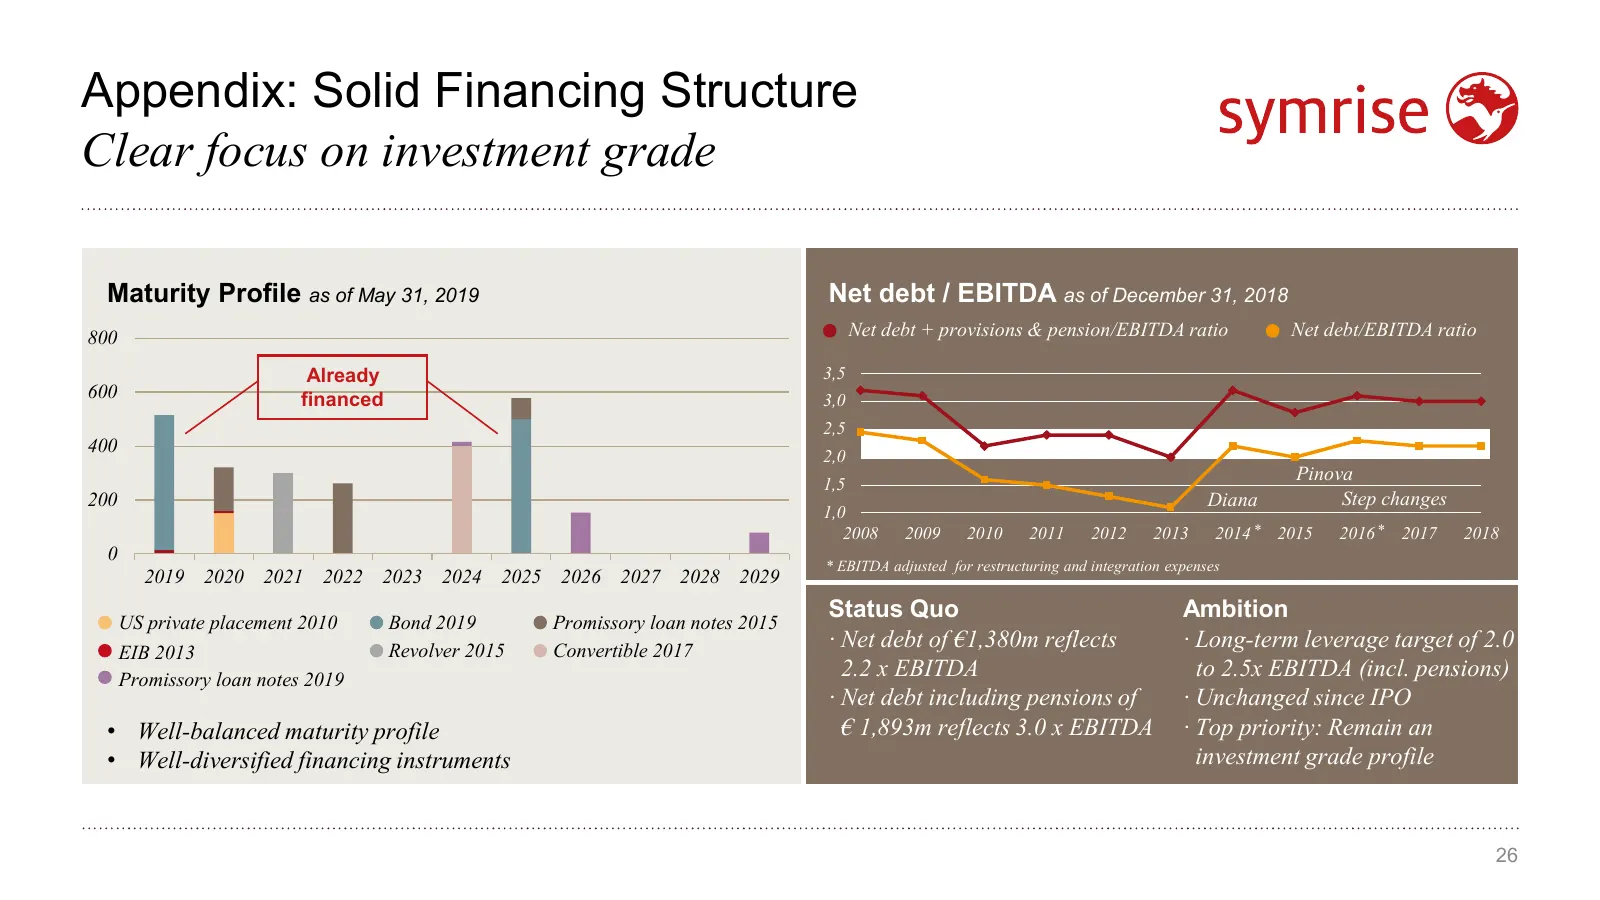
Appendix: Solid Financing Structure Clear focus on investment grade Maturity Profile as of May 31, 2019 Net debt / EBITDA as of December 31, 2018 800 Net debt + provisions & pension/EBITDA ratio Net debt/EBITDA ratio Already 3,5 600 financed 3,0 2,5 400 2,0 Pinova 1,5 200 Diana Step changes 1,0 2008
Slide 27: Appendix: Proposed ADF/IDF acquisition
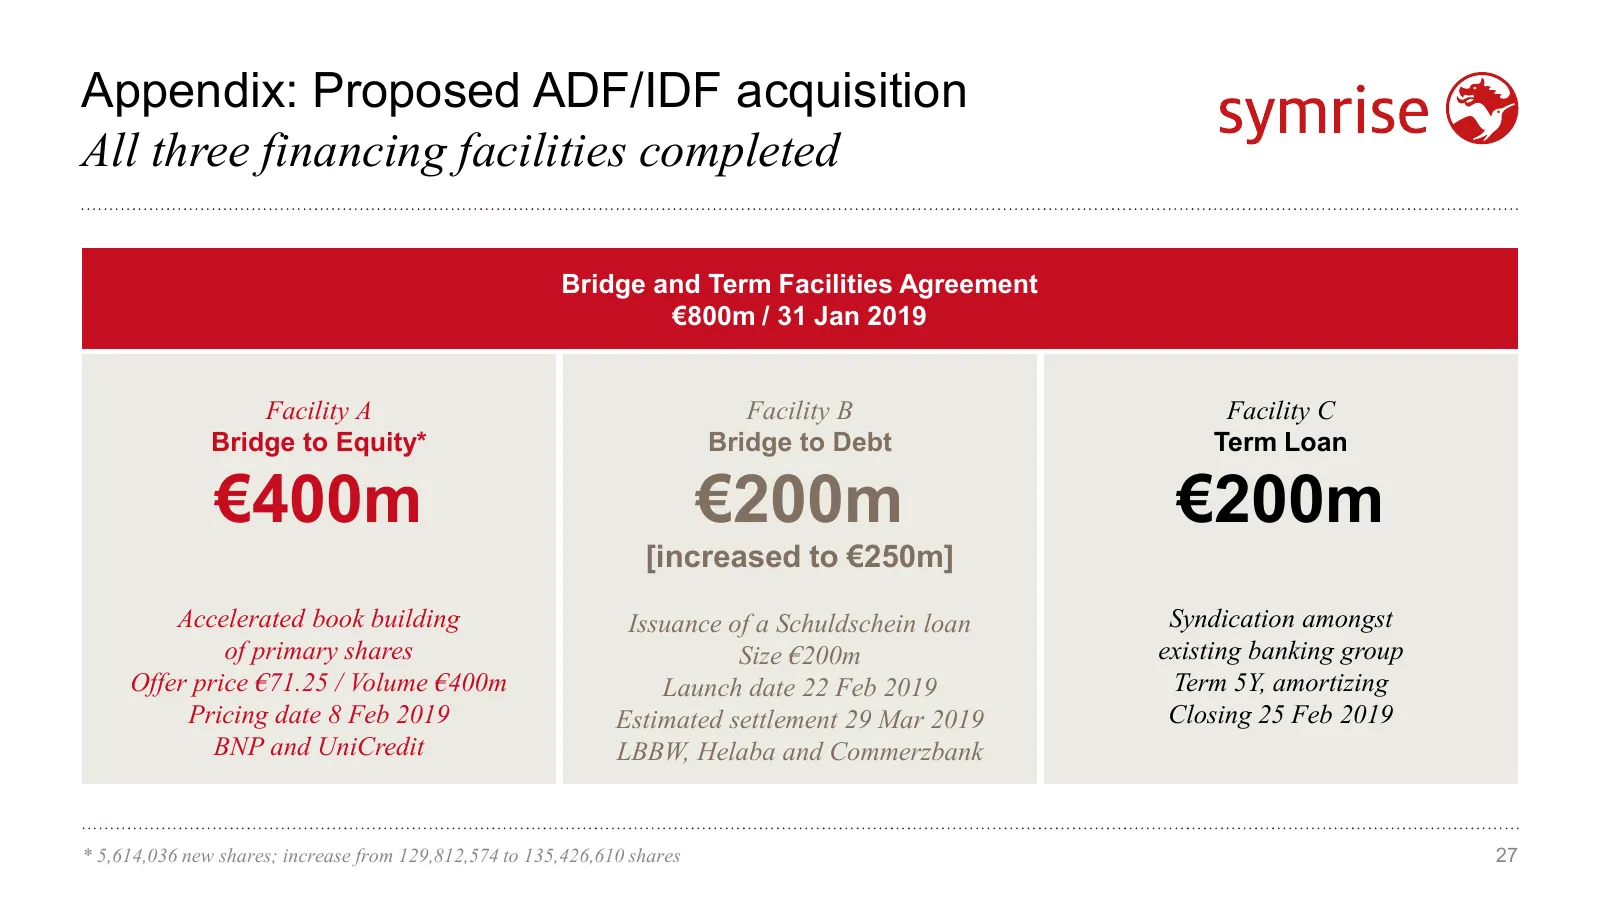
Appendix: Proposed ADF/IDF acquisition All three financing facilities completed Bridge and Term Facilities Agreement €800m / 31 Jan 2019 Facility A Facility B Facility C Bridge to Equity* Bridge to Debt Term Loan €400m €200m €200m [increased to €250m] Accelerated book building Issuance of a Schuldsc
Slide 28: Appendix: Amortization from business combinations
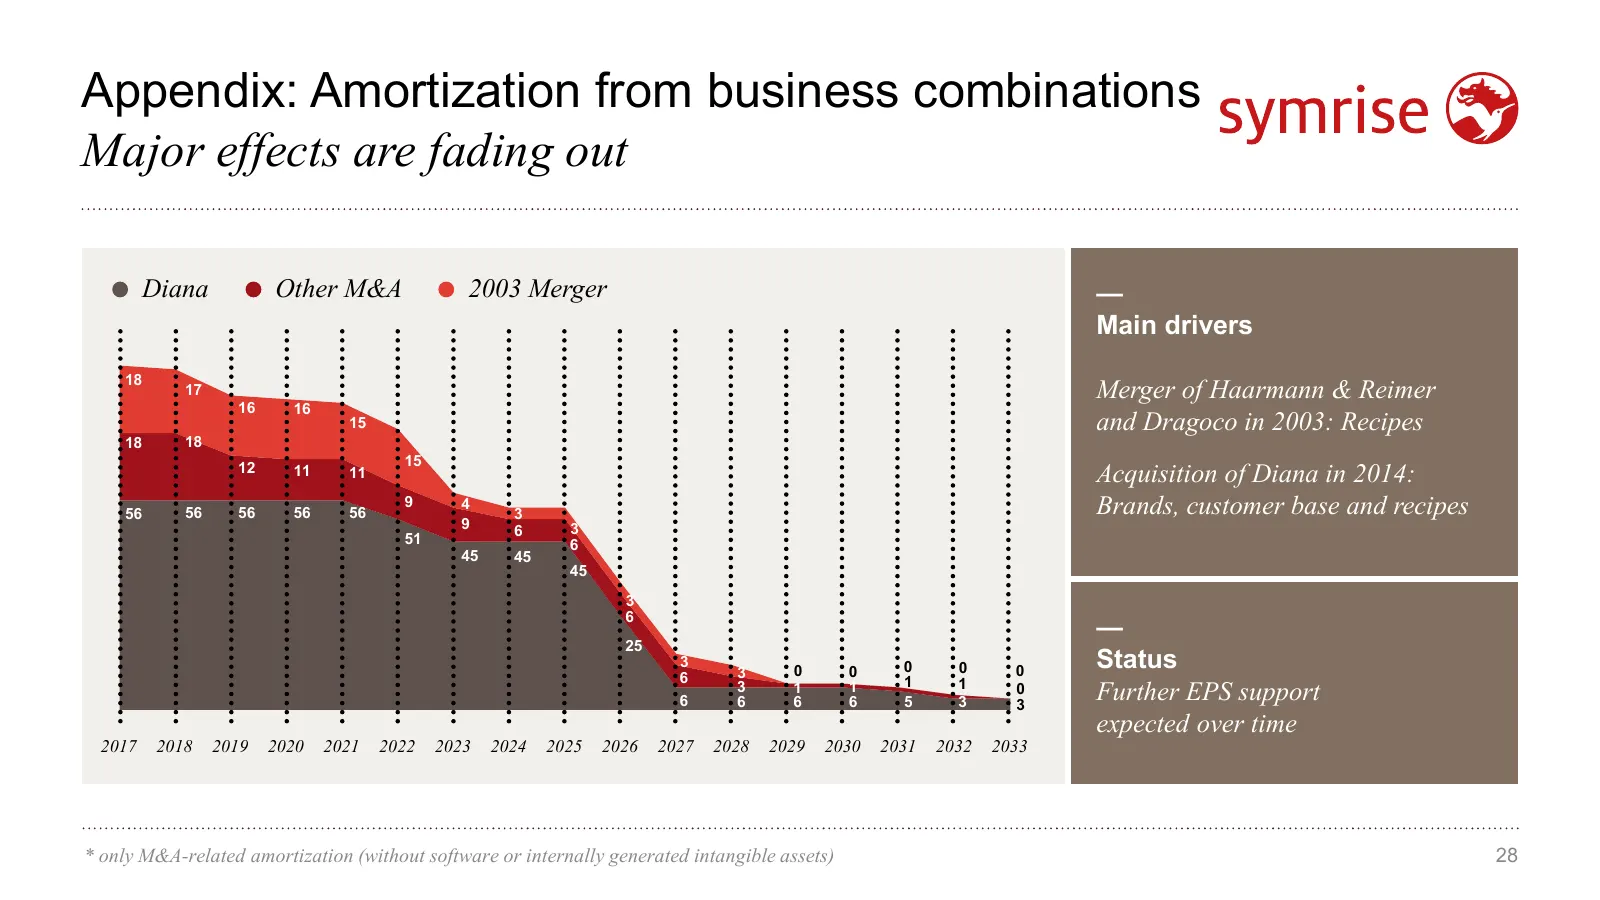
Appendix: Amortization from business combinations Major effects are fading out Diana Other M&A 2003 Merger — Main drivers 18 17 Merger of Haarmann & Reimer 16 16 15 and Dragoco in 2003: Recipes 18 18 15 12 11 11 Acquisition of Diana in 2014: 56 56 56 56 56 9 4 3 Brands, customer base and recipes 9 6
Source: Internet Archive copy of symrise.com
More decks from Symrise AG
 Q3 2026 Earnings Presentation22 slides · Oct 28, 2026
 Investor Presentation (October 2026)39 slides · October 2026
 H1 2026 Earnings Presentation25 slides · Jul 30, 2026
 Q2 2026 Earnings Presentation29 slides · Jul 30, 2026
 Shareholder Meeting (May 2026)19 slides · May 6, 2026
 Q1 2026 Earnings Presentation19 slides · Apr 29, 2026