Bank of New York Co Inc
Bank of New York — Mellon Financial — Merger or Acquisition (December 2006)
34 slides from Bank of New York's merger presentation, Dec 4, 2006
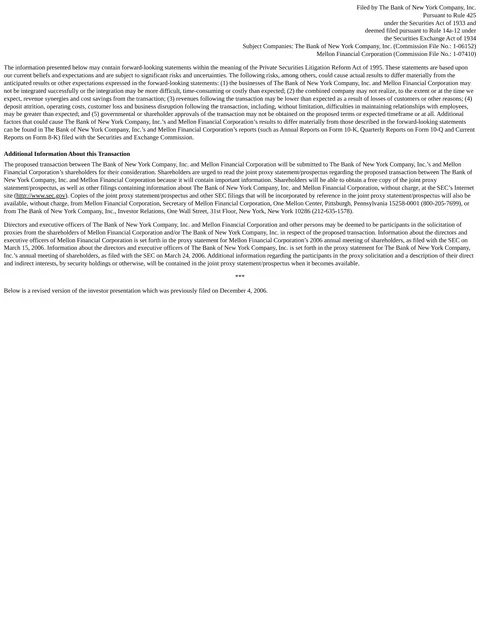
Slide 1: Rule 425 filing legend and forward-looking statements
Filed by The Bank of New York Company, Inc. Pursuant to Rule 425 under the Securities Act of 1933 and deemed filed pursuant to Rule 14a-12 under the Securities Exchange Act of 1934 Subject Companies: The Bank of New York Company, Inc. (Commission File No.: 1-06152) Mellon Financial Corporation (Comm
Slide 2: A Global Financial Services Growth Company
A Global Financial Services Growth Company December 4, 2006
Slide 3: Disclosure and Cautionary Statement
Disclosure and Cautionary Statement The proposed transaction between The Bank of New York Company, Inc. and Mellon Financial Corporation will be submitted to The Bank of New York Company, Inc.'s and Mellon Financial Corporation's shareholders for their consideration. Shareholders are urged to read t
Slide 4: The Bank of New York Mellon
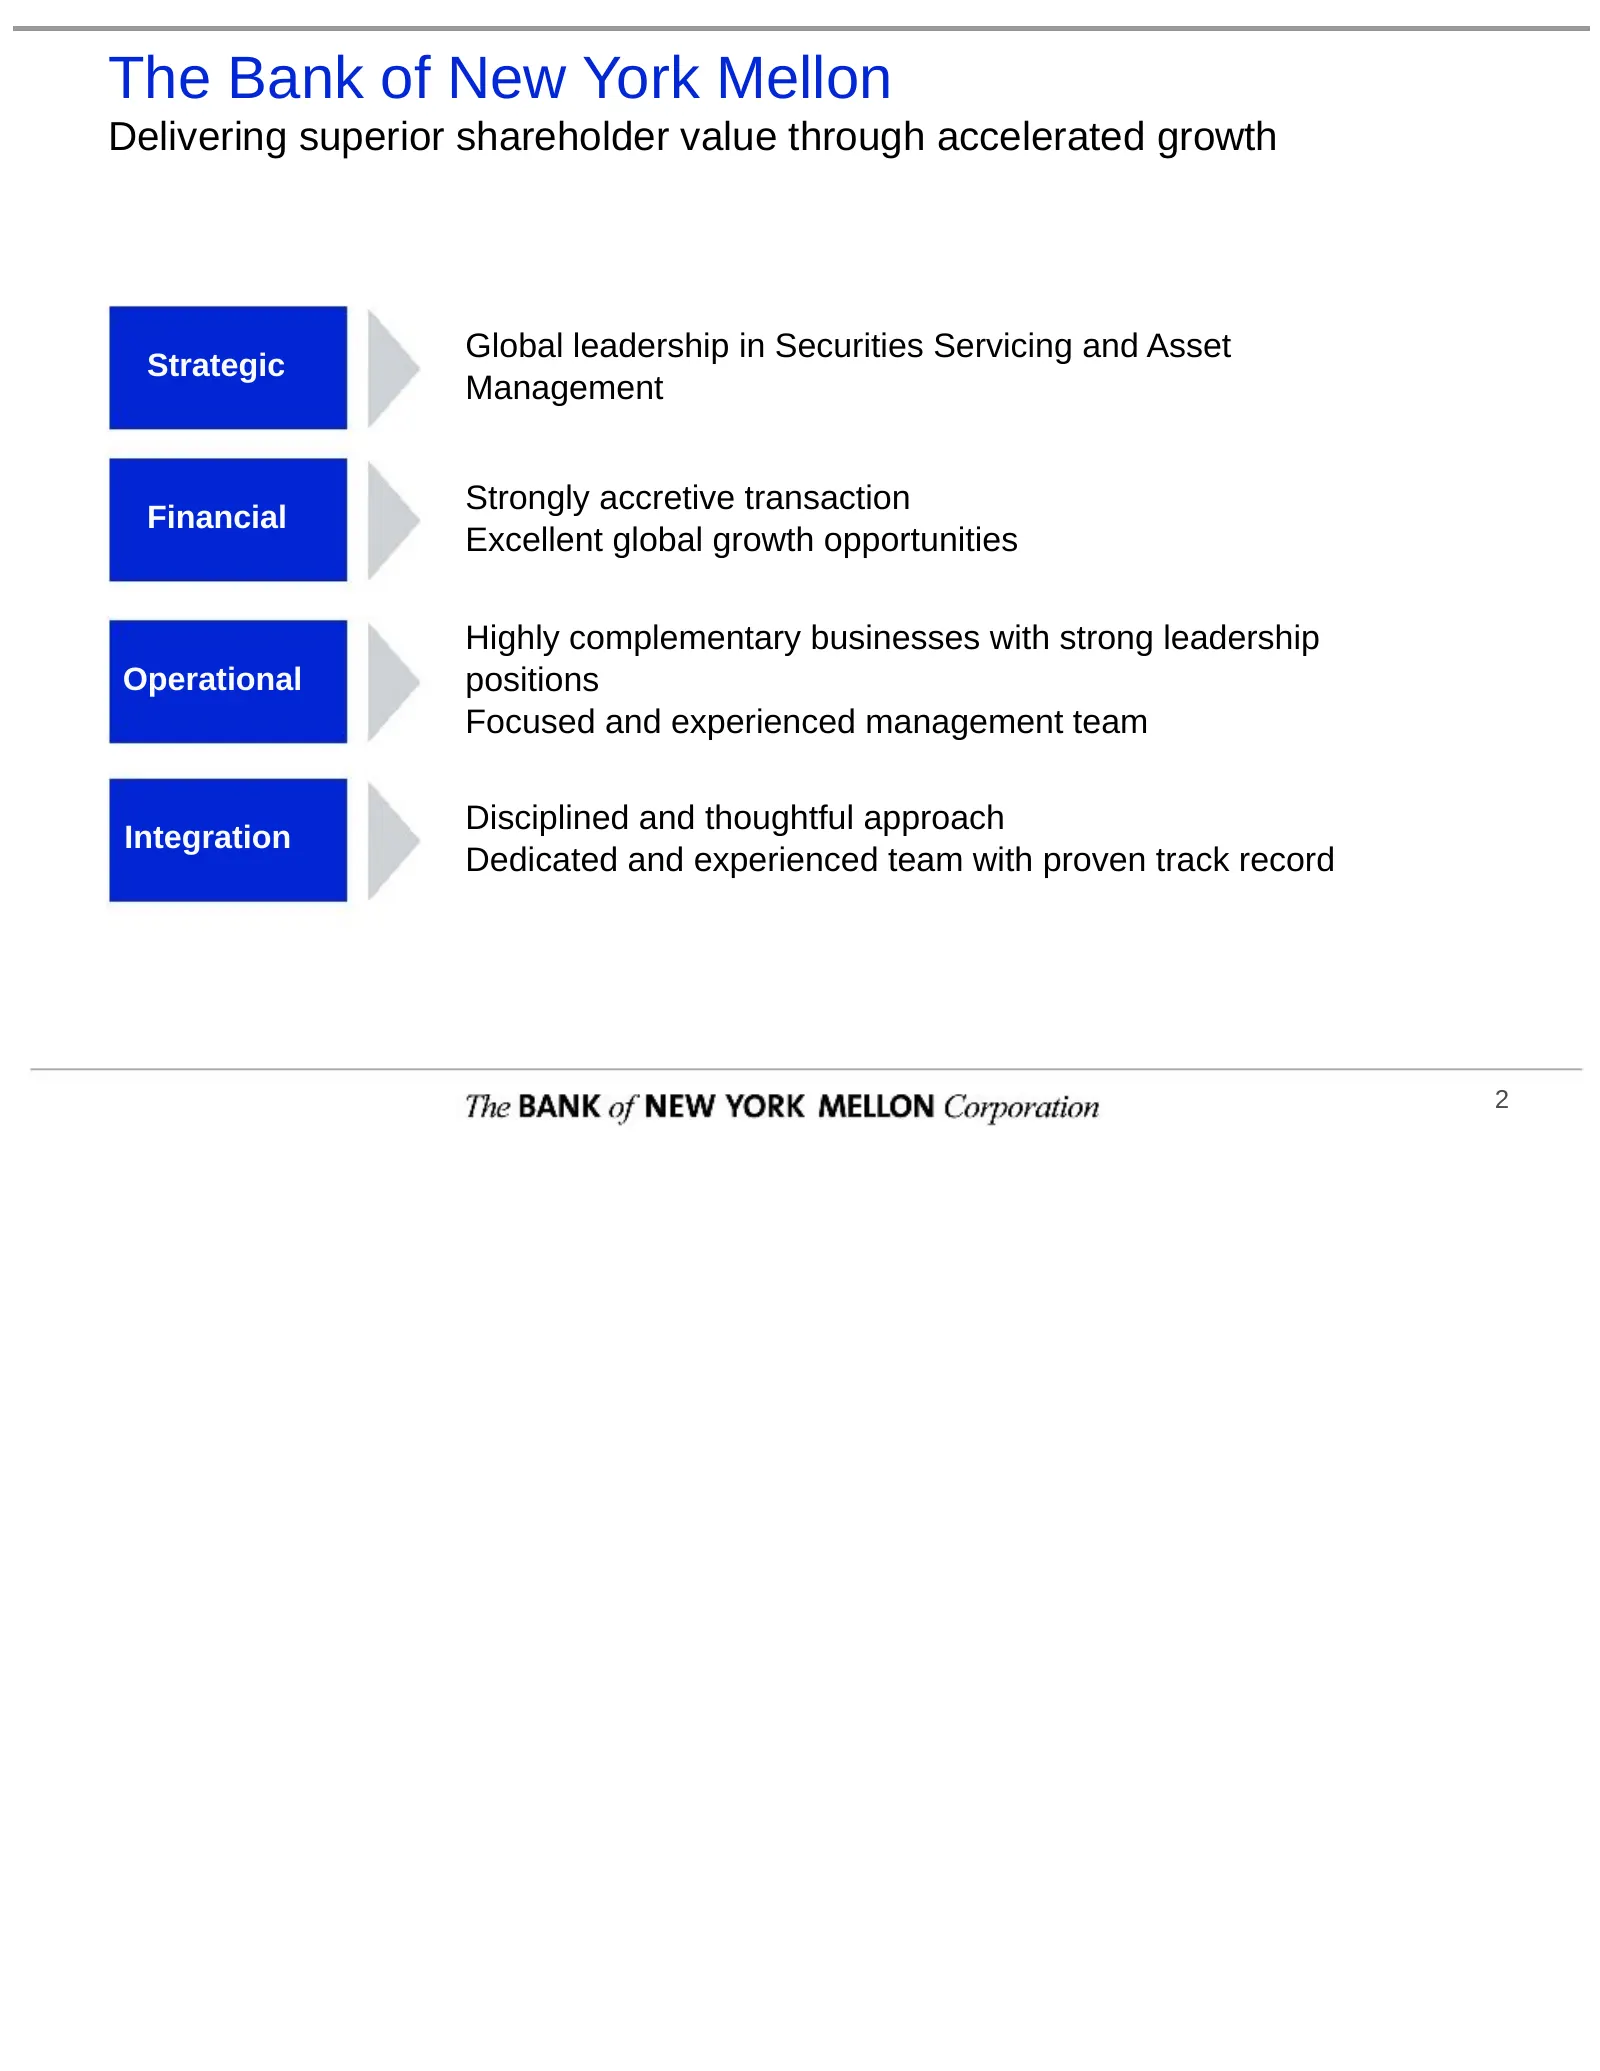
The Bank of New York Mellon Delivering superior shareholder value through accelerated growth Global leadership in Securities Servicing and Asset Strategic Management Strongly accretive transaction Financial Excellent global growth opportunities Highly complementary businesses with strong leadership
Slide 5: Compelling Strategic Attributes
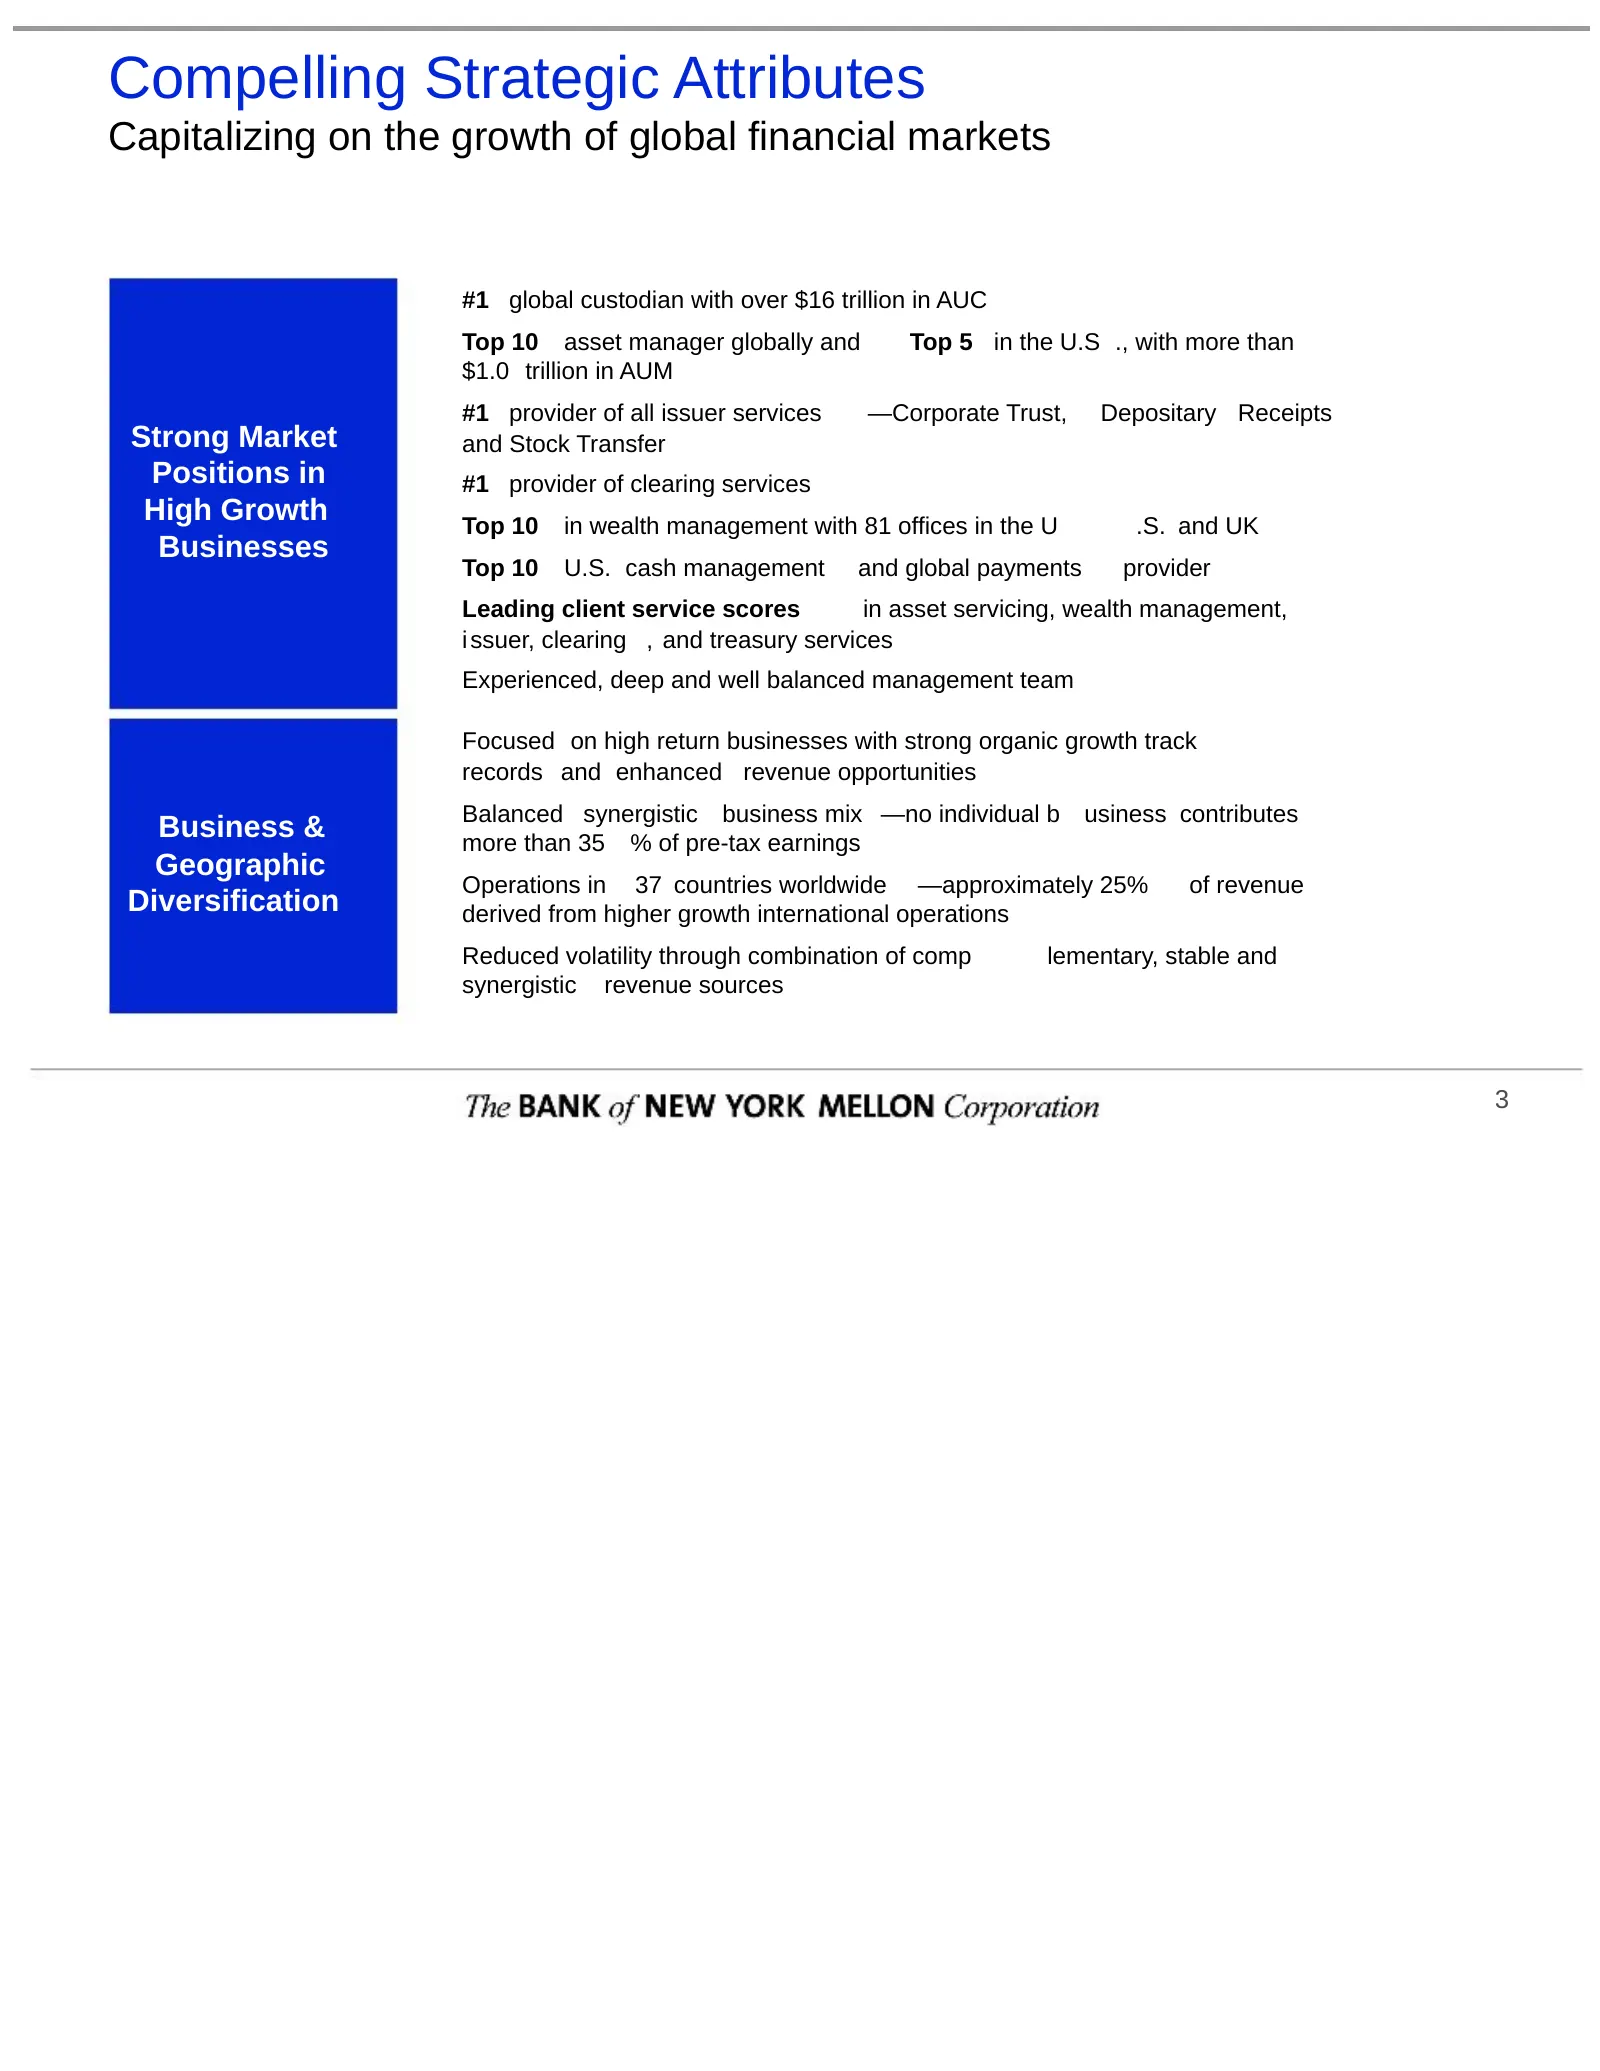
Compelling Strategic Attributes Capitalizing on the growth of global financial markets #1 global custodian with over $16 trillion in AUC Top 10 asset manager globally and Top 5 in the U.S ., with more than $1.0 trillion in AUM #1 provider of all issuer services —Corporate Trust, Depositary Receipts
Slide 6: Compelling Financial Rationale
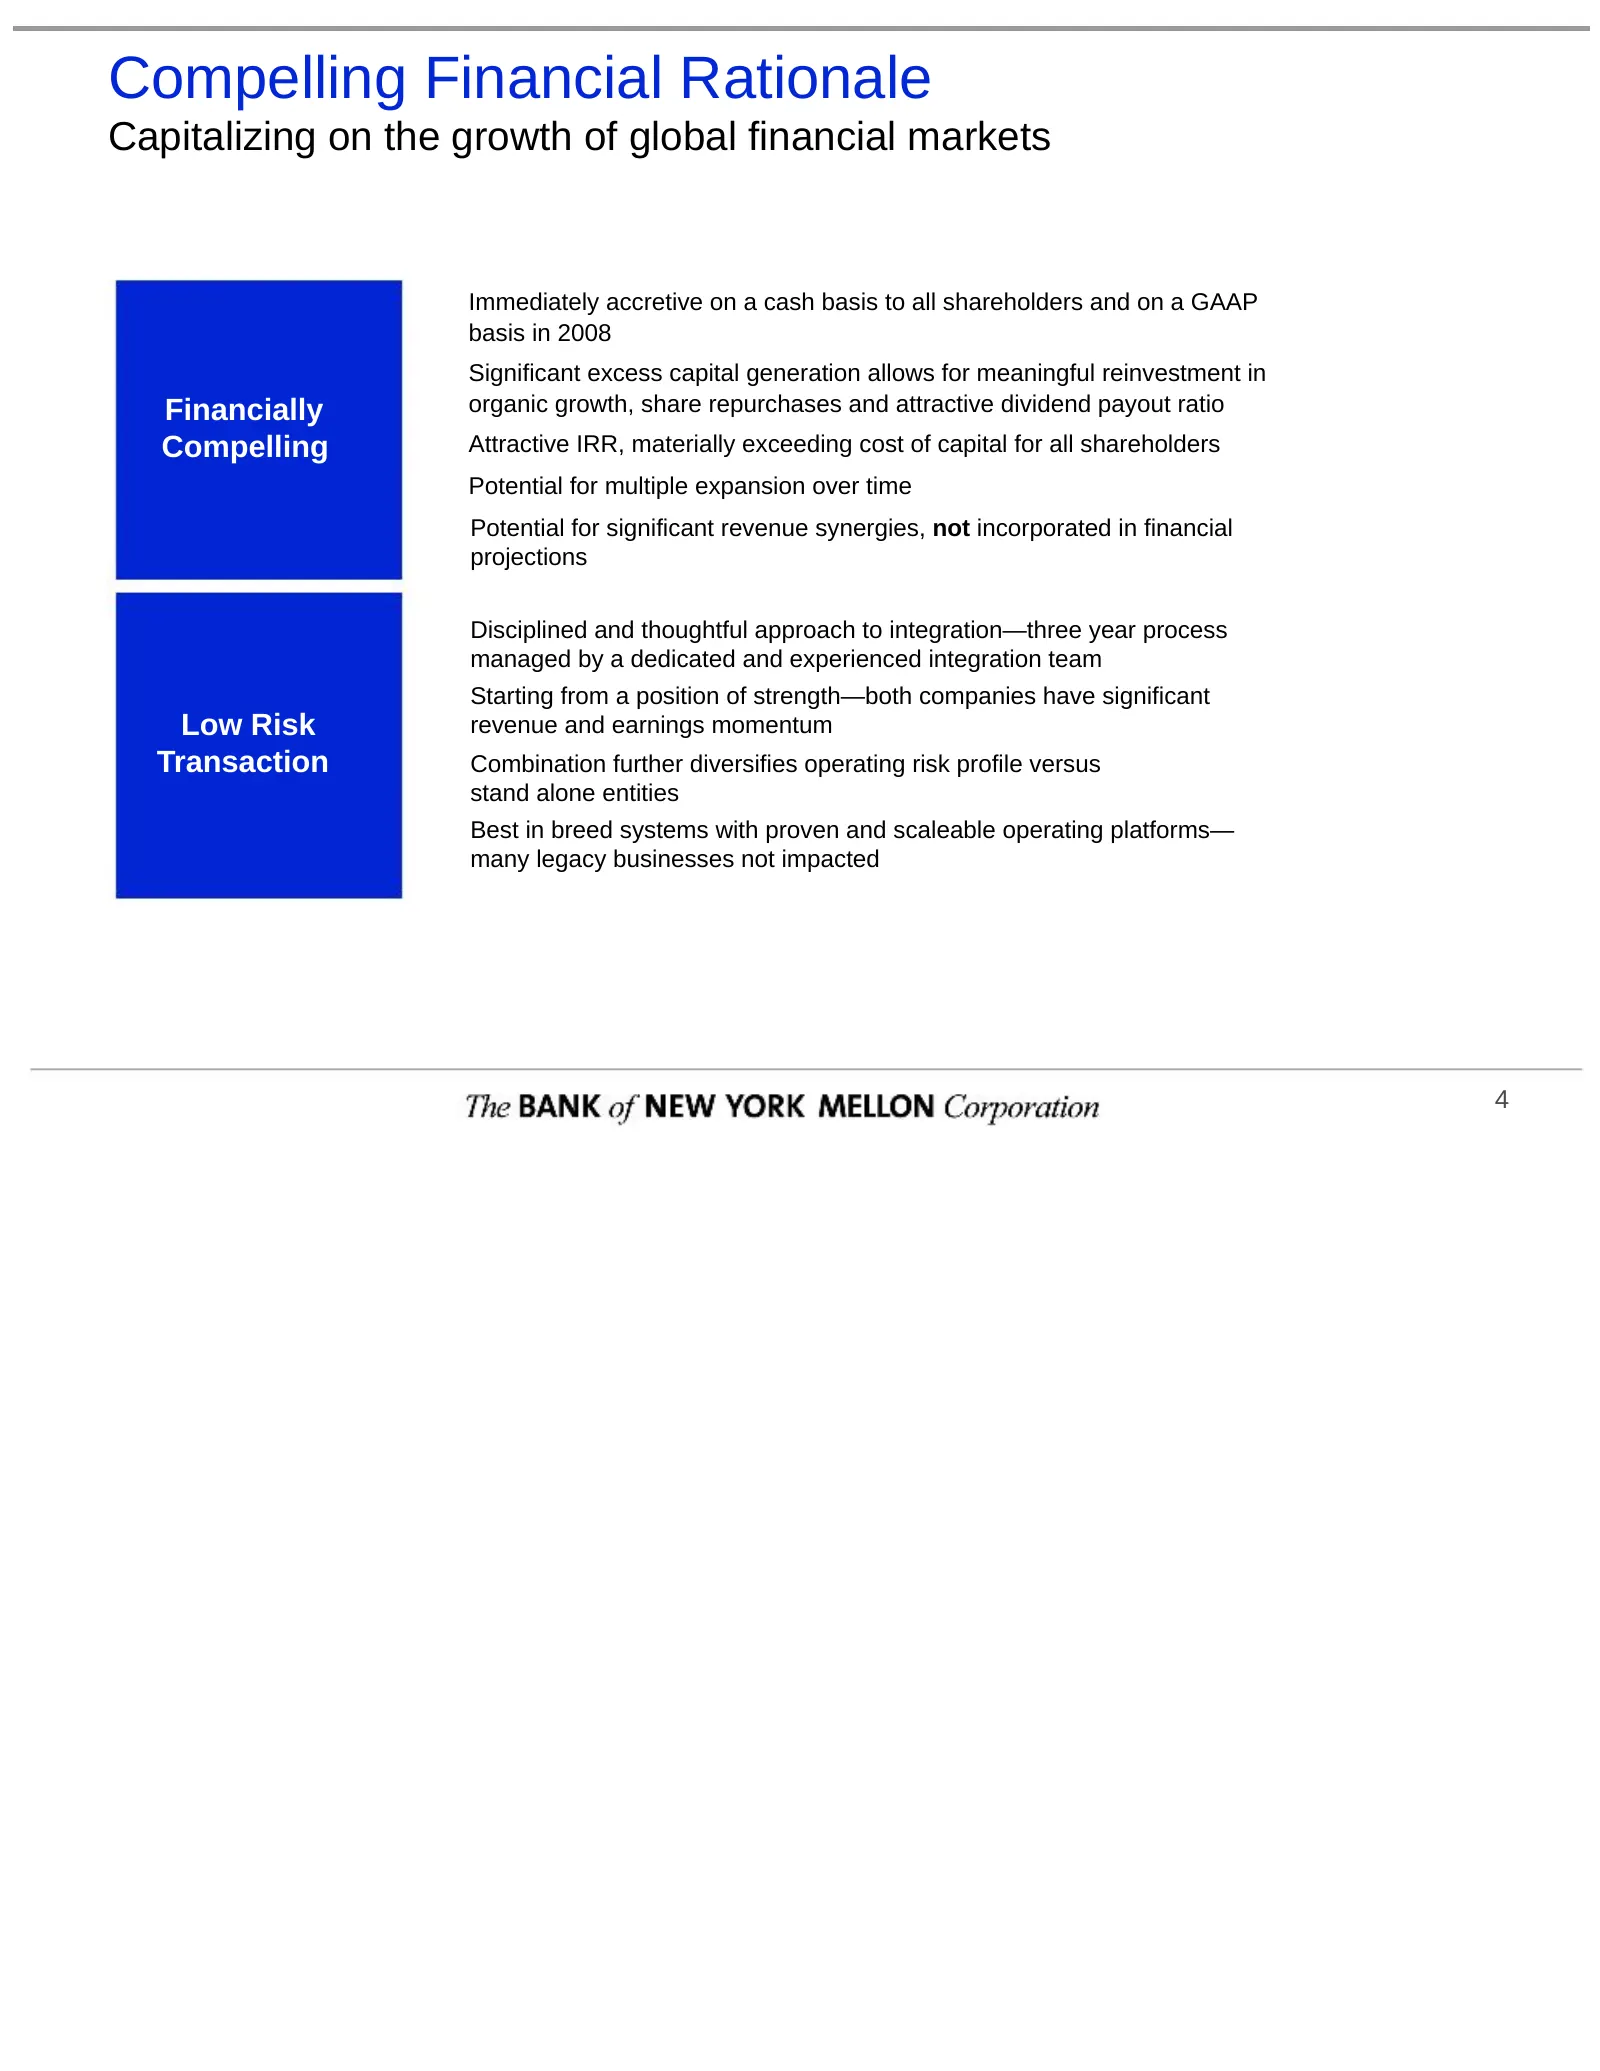
Compelling Financial Rationale Capitalizing on the growth of global financial markets Immediately accretive on a cash basis to all shareholders and on a GAAP basis in 2008 Significant excess capital generation allows for meaningful reinvestment in Financially organic growth, share repurchases and at
Slide 7: Transaction Summary
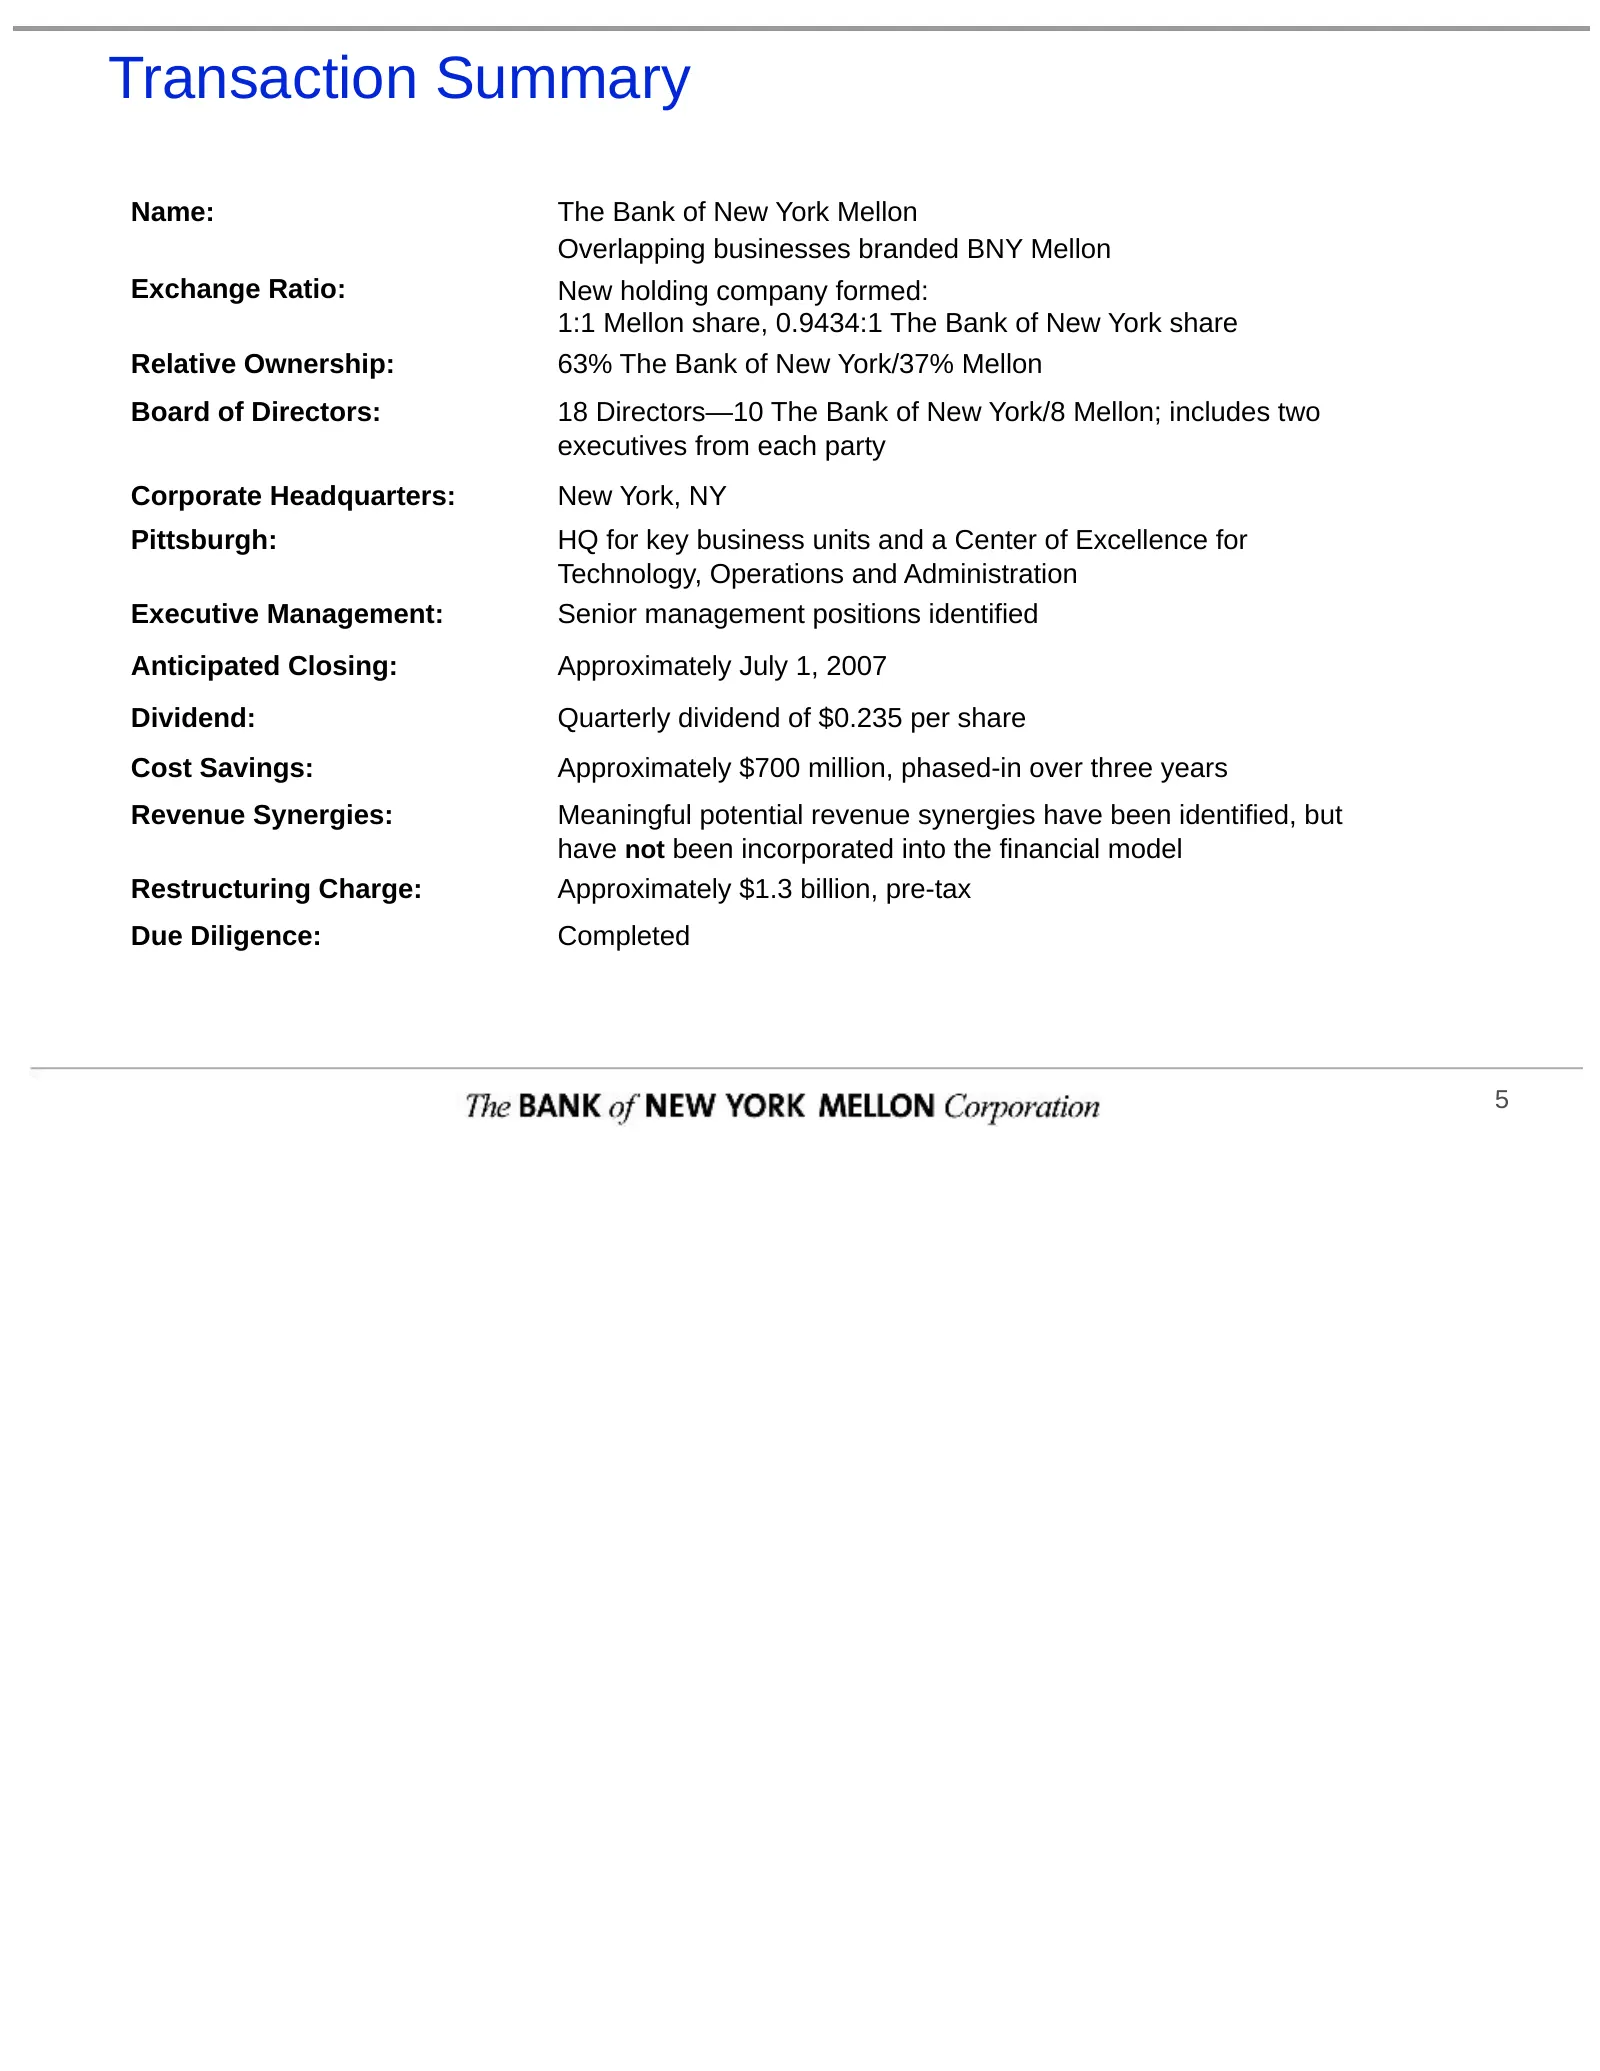
Transaction Summary Name: The Bank of New York Mellon Overlapping businesses branded BNY Mellon Exchange Ratio: New holding company formed: 1:1 Mellon share, 0.9434:1 The Bank of New York share Relative Ownership: 63% The Bank of New York/37% Mellon Board of Directors: 18 Directors—10 The Bank of Ne
Slide 8: Management Depth and Experience
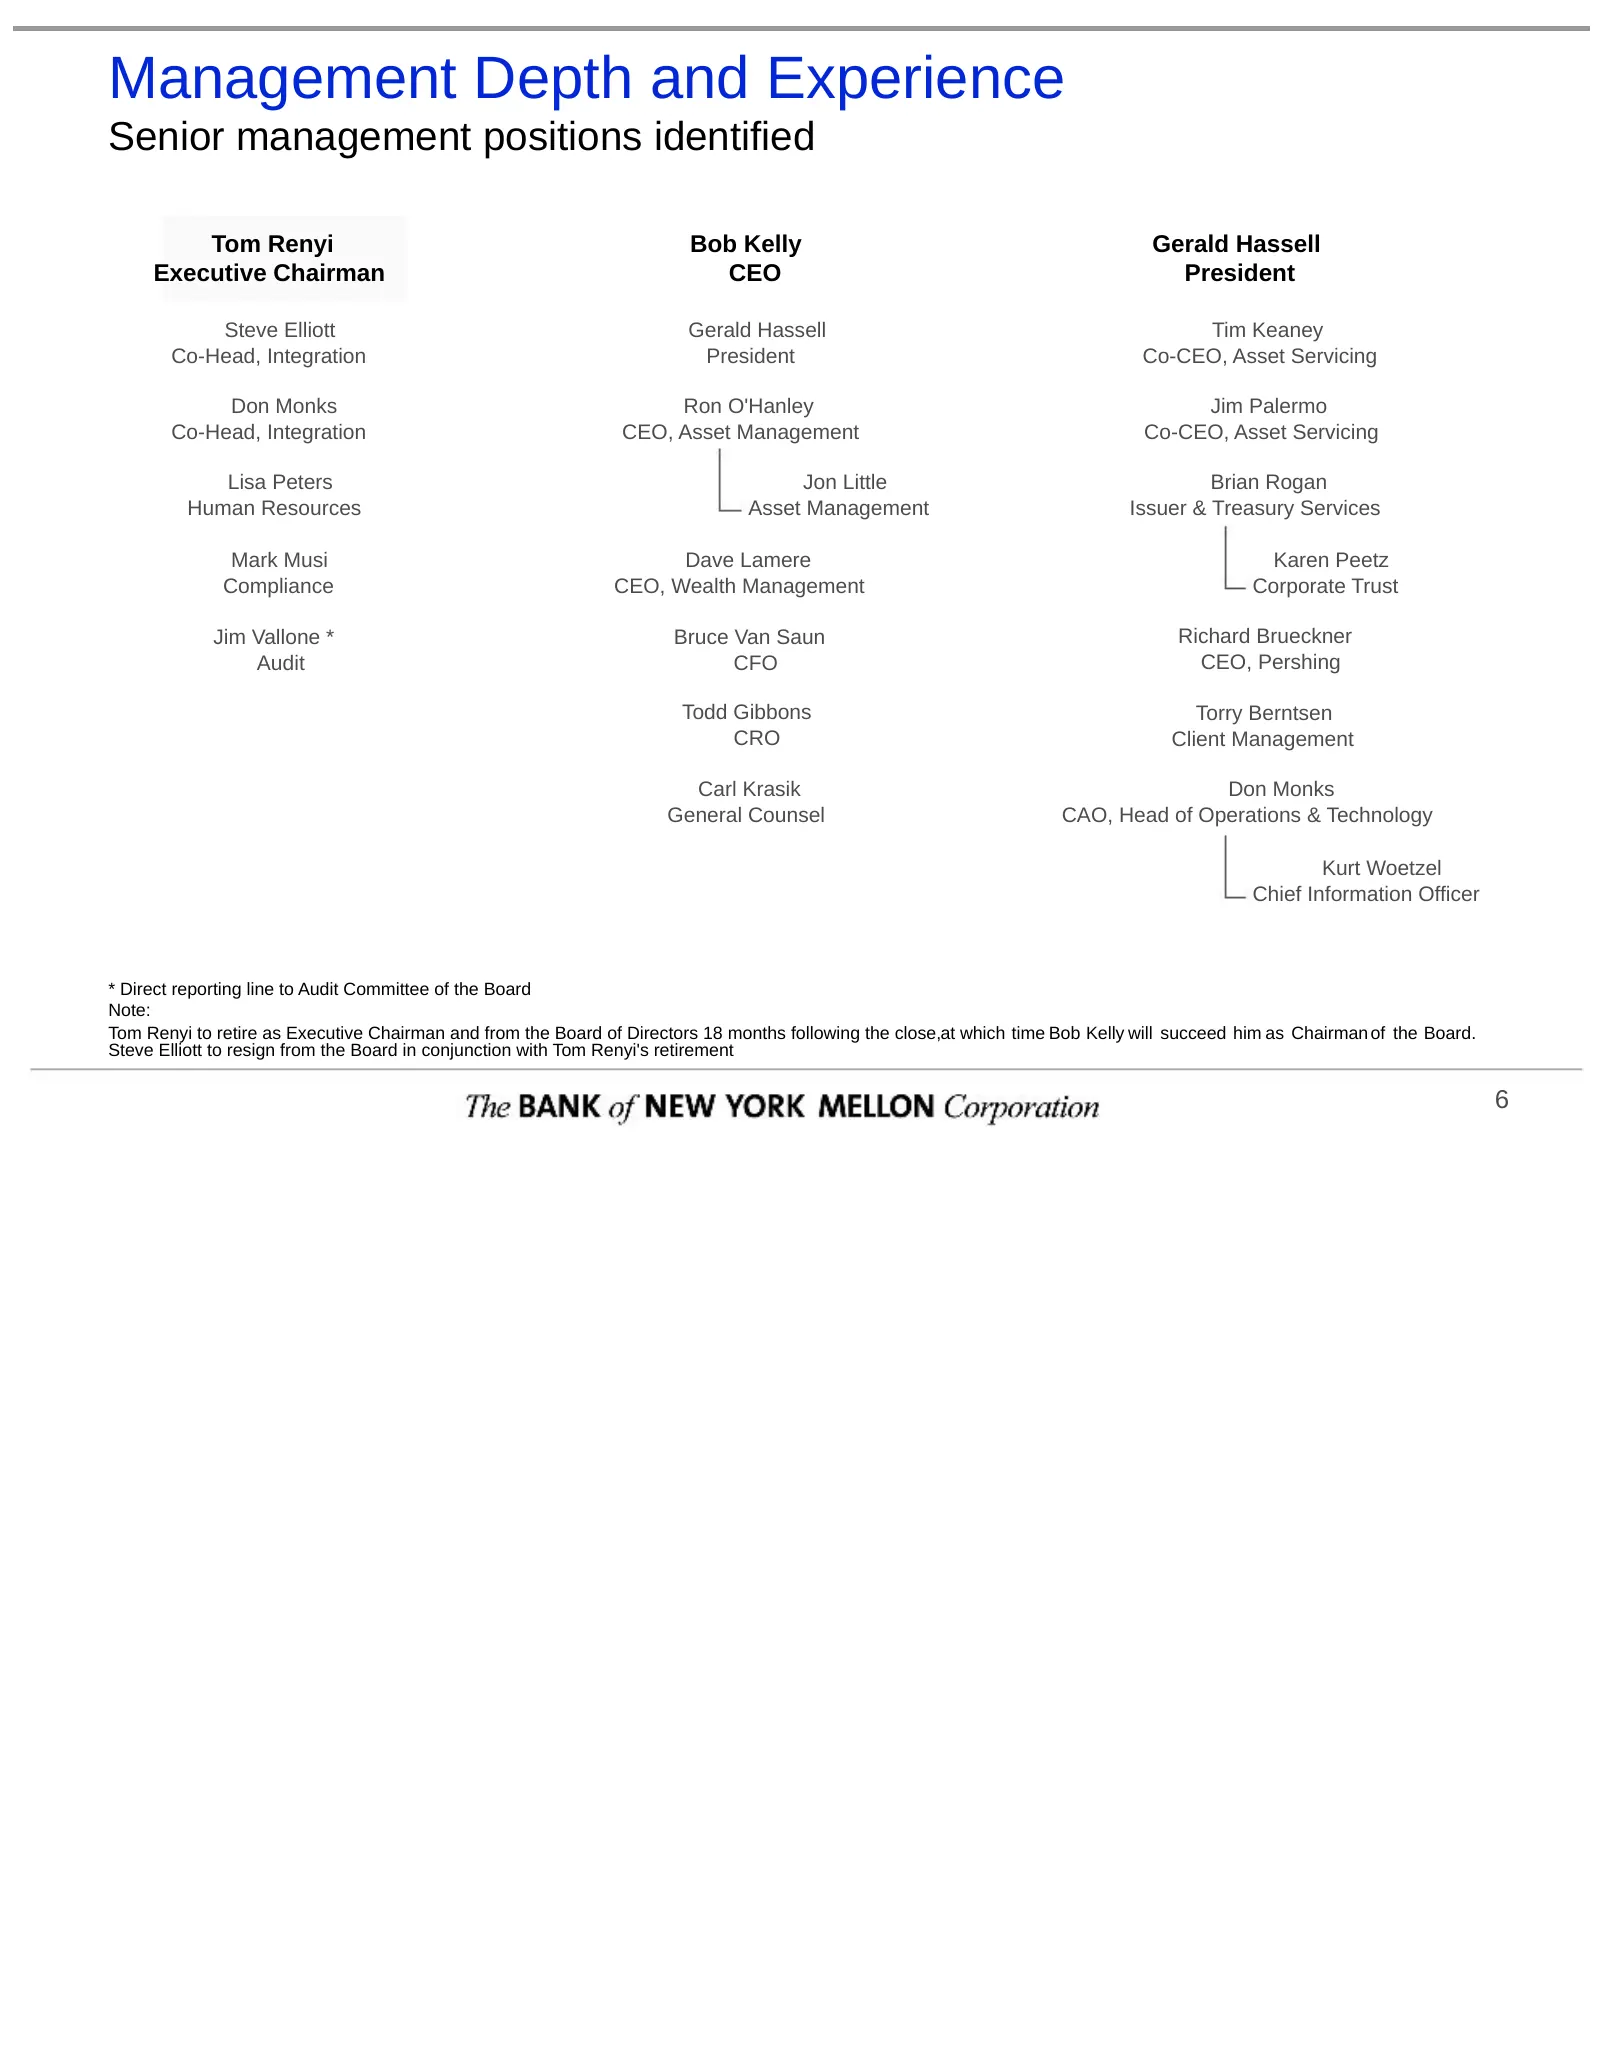
Management Depth and Experience Senior management positions identified Tom Renyi Bob Kelly Gerald Hassell Executive Chairman CEO President Steve Elliott Gerald Hassell Tim Keaney Co-Head, Integration President Co-CEO, Asset Servicing Don Monks Ron O'Hanley Jim Palermo Co-Head, Integration CEO, Asset
Slide 9: Enhanced Global Reach and Scale
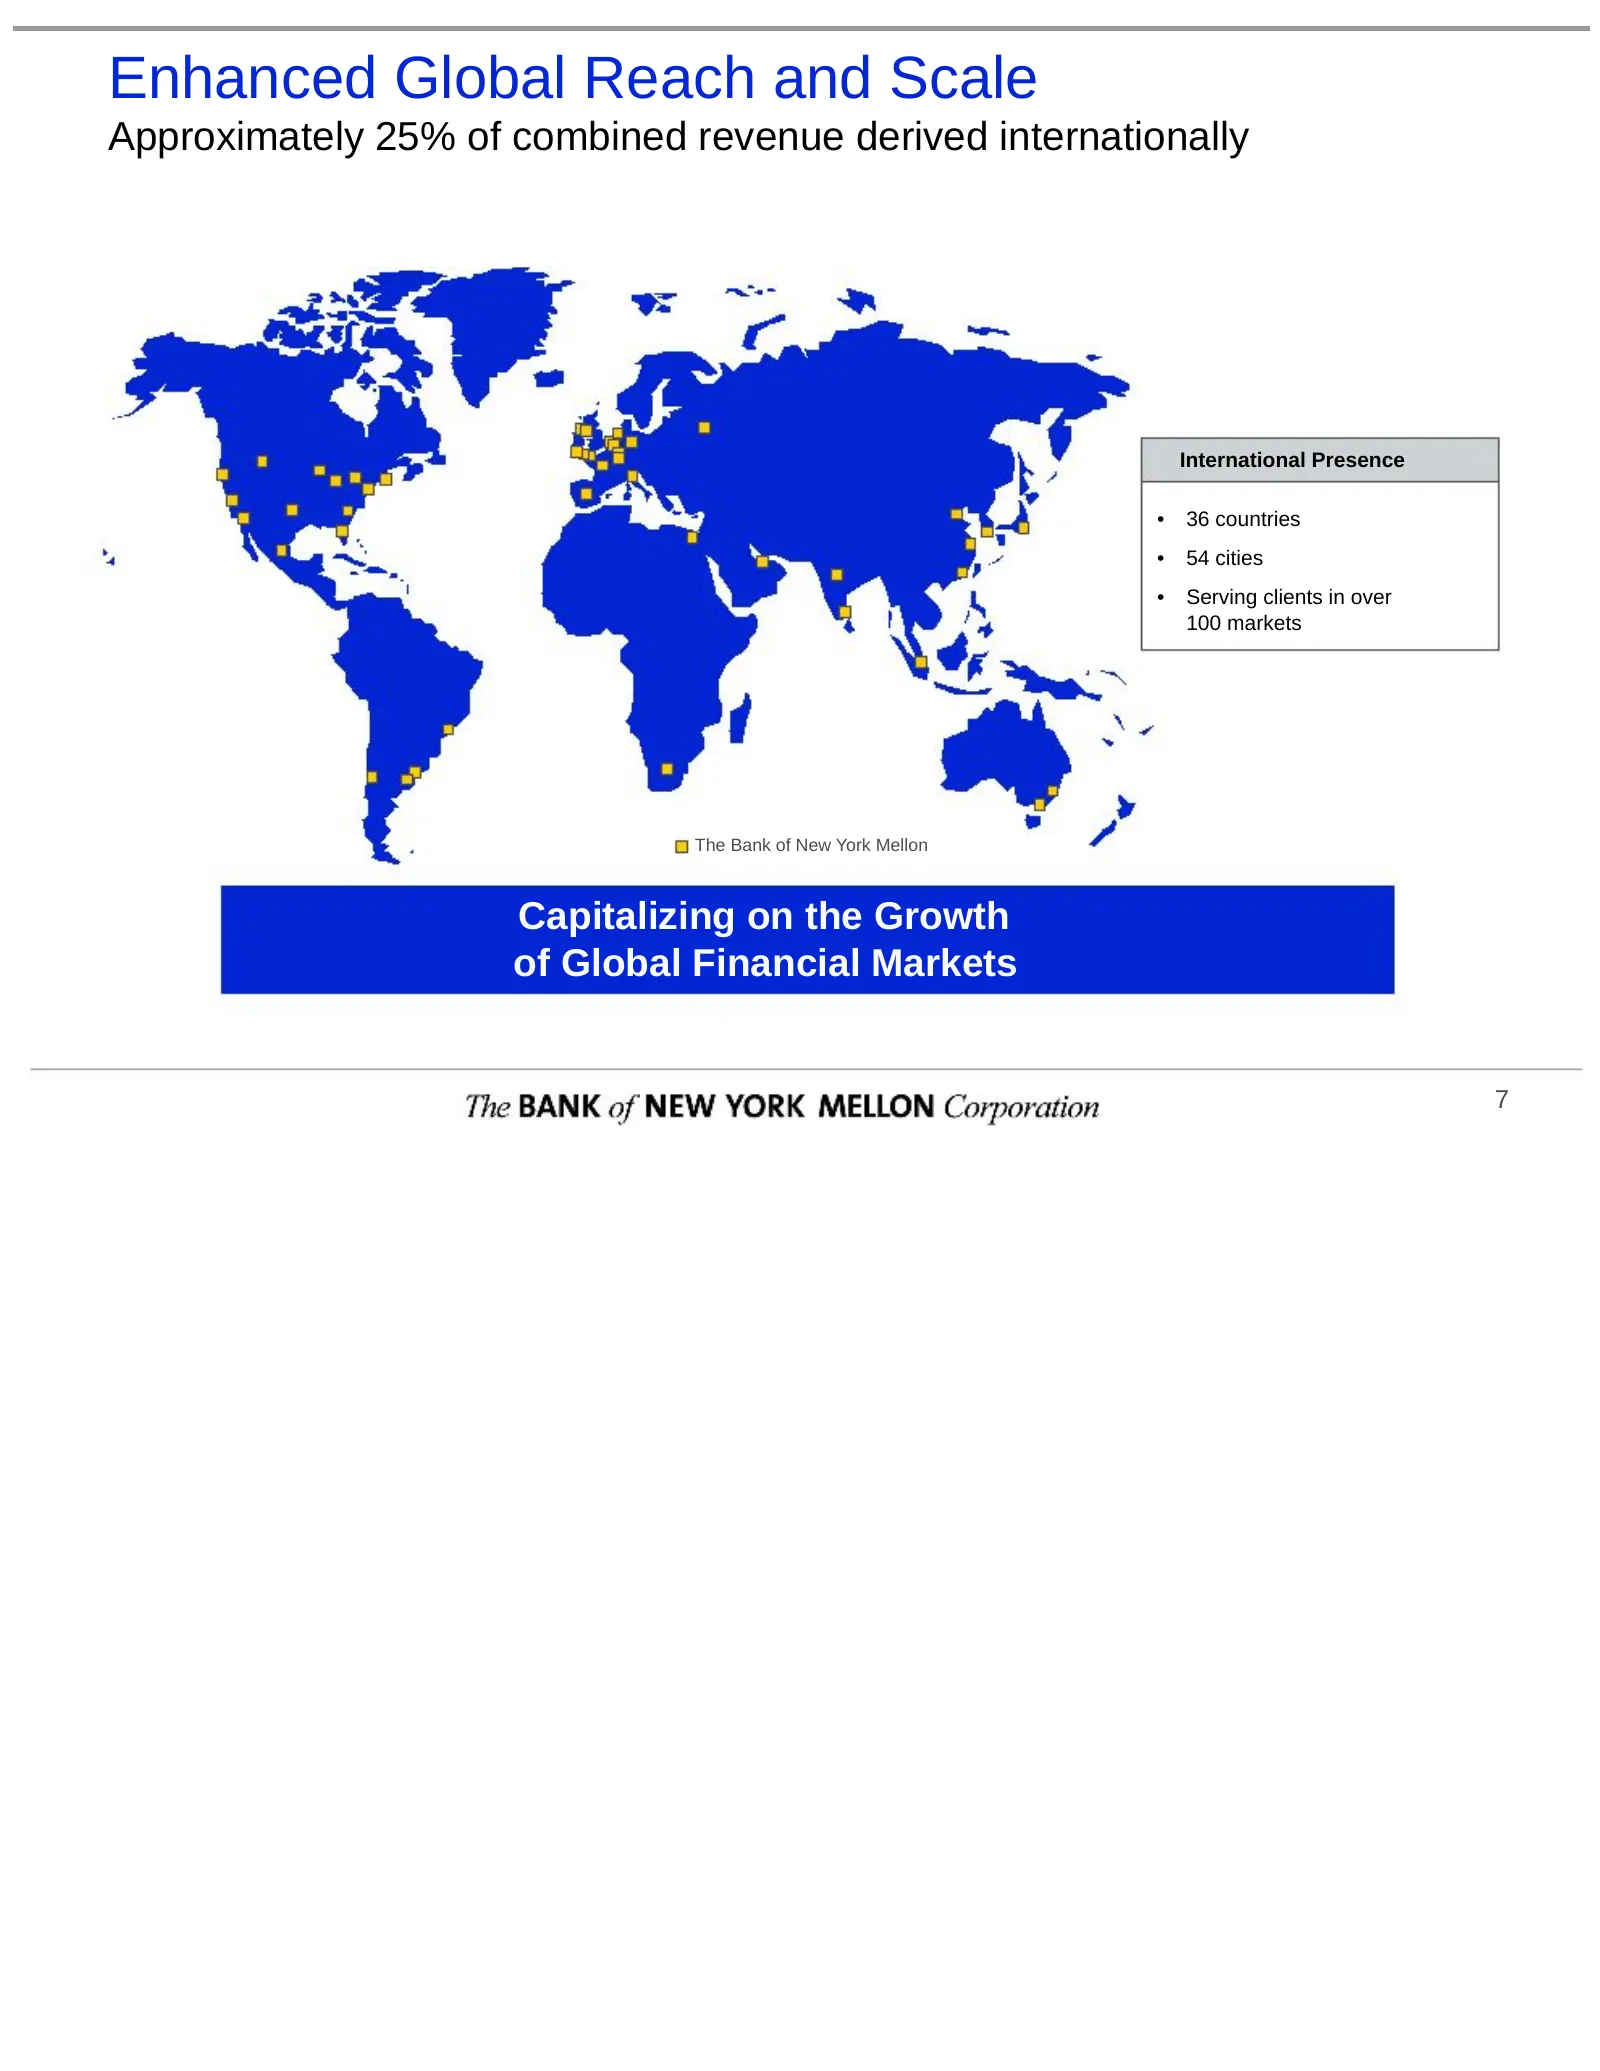
Enhanced Global Reach and Scale Approximately 25% of combined revenue derived internationally International Presence • 36 countries • 54 cities • Serving clients in over 100 markets The Bank of New York Mellon Capitalizing on the Growth of Global Financial Markets 7
Slide 10: Scale Enhances Ability to Invest, Compete and Outperform Globally
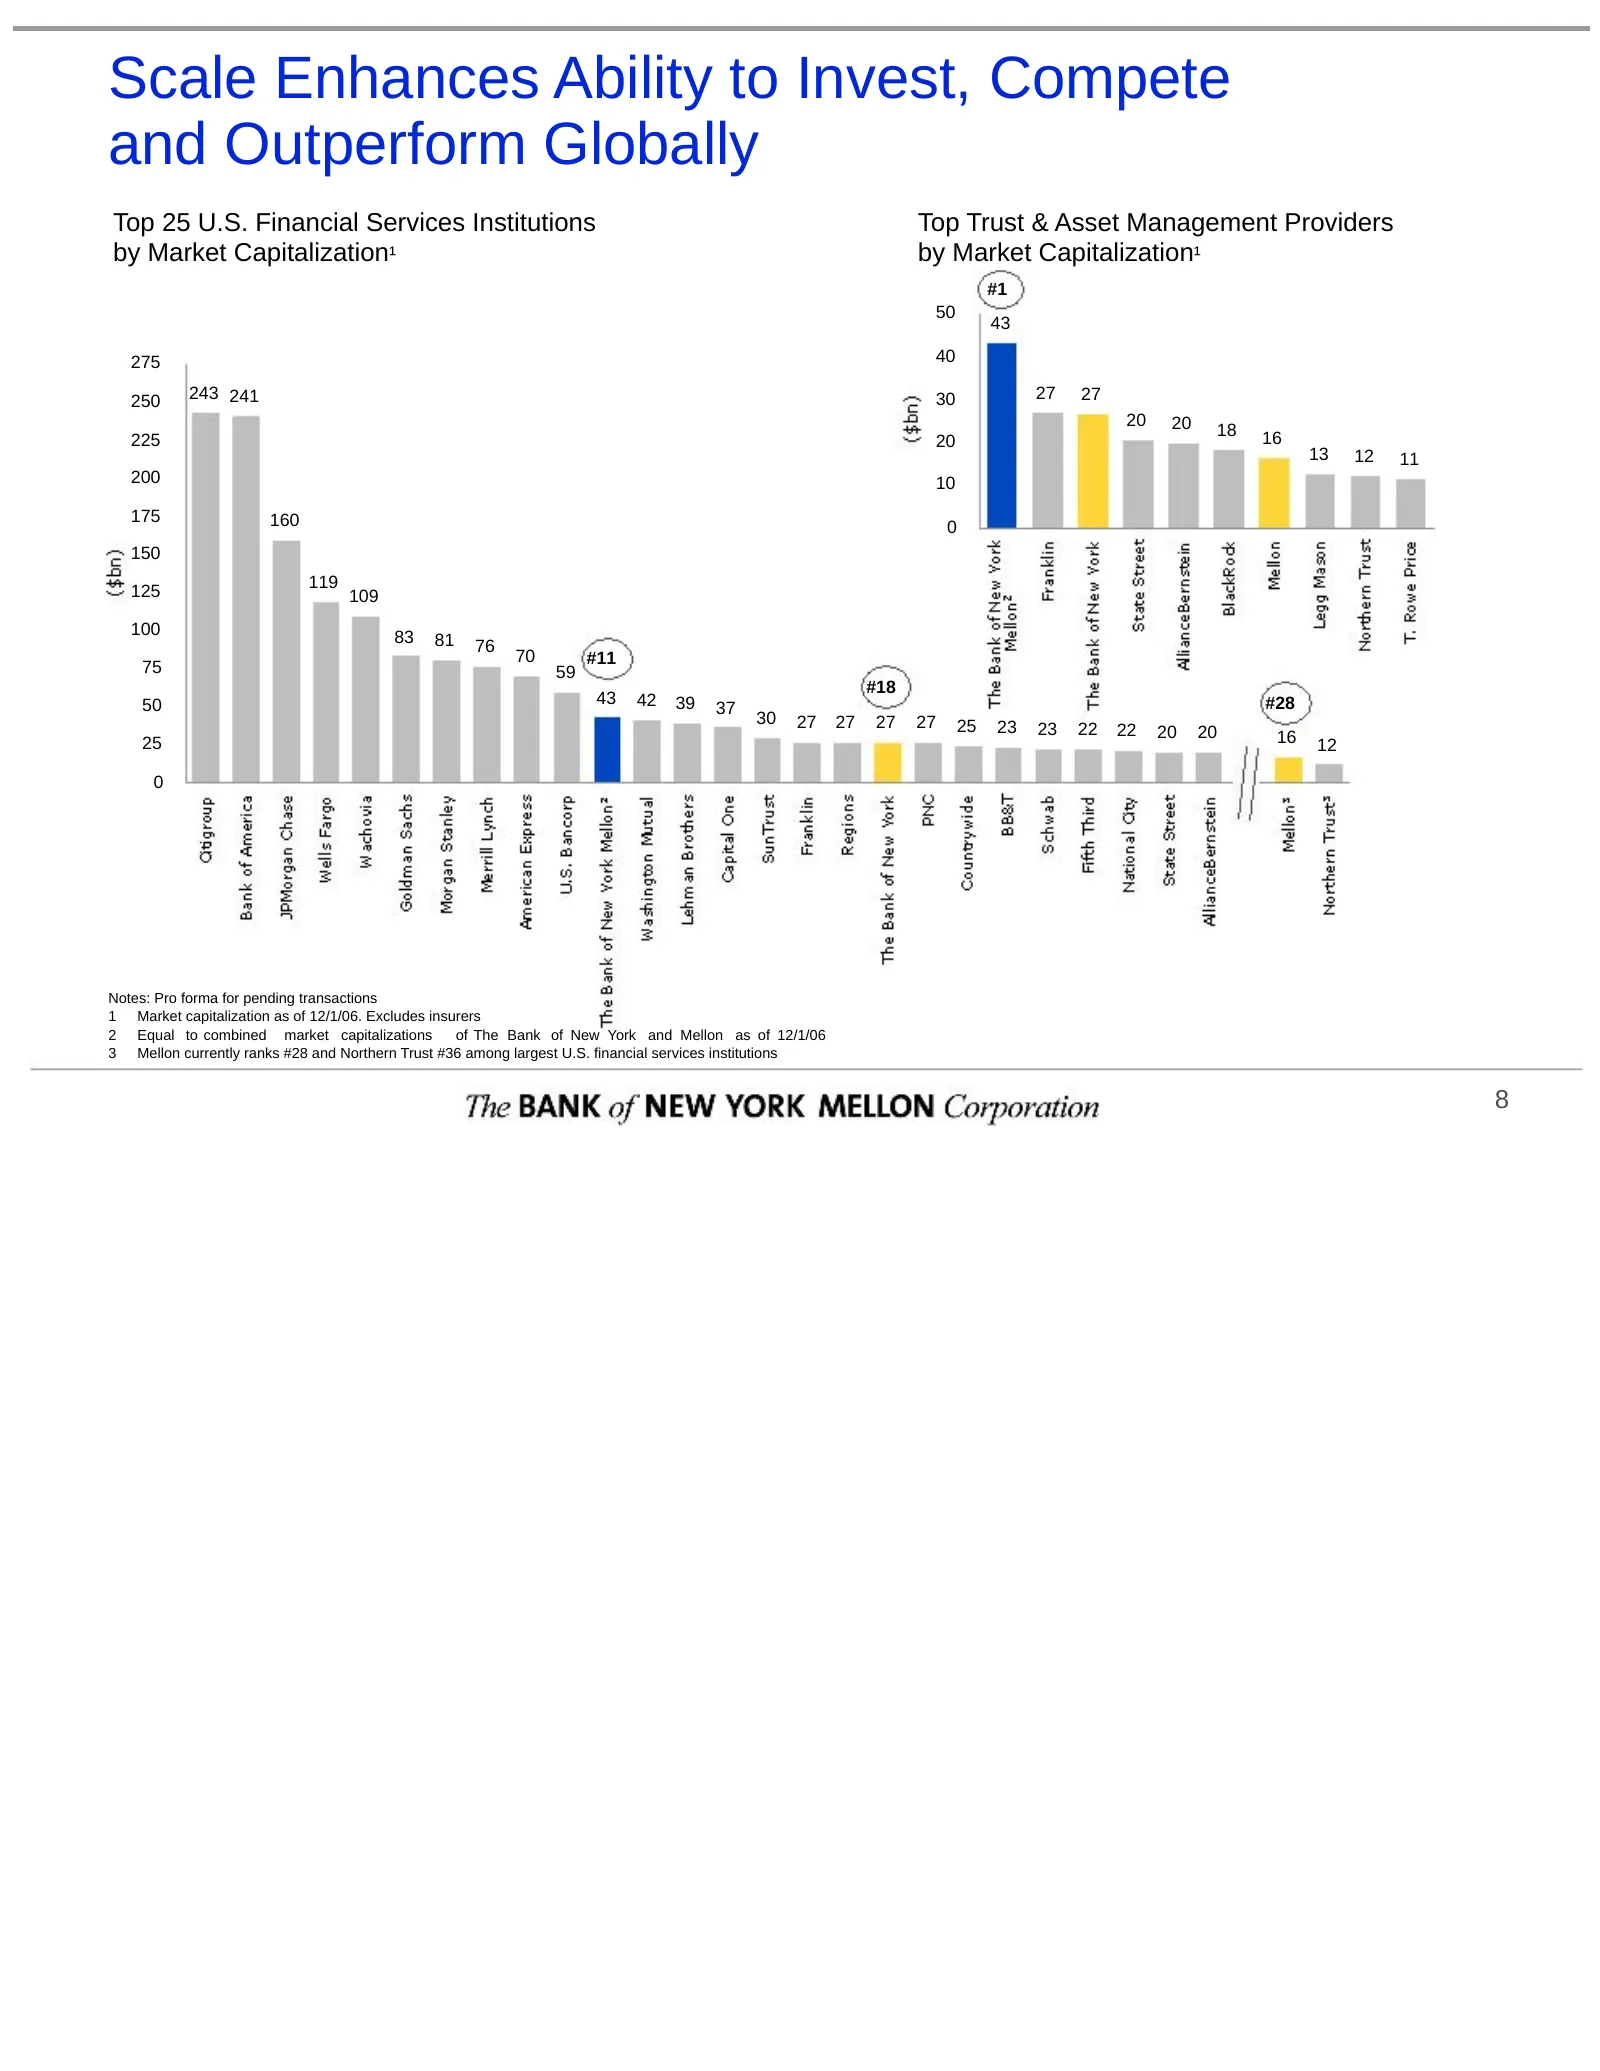
Scale Enhances Ability to Invest, Compete and Outperform Globally Top 25 U.S. Financial Services Institutions Top Trust & Asset Management Providers by Market Capitalization¹ by Market Capitalization¹ #1 50 43 275 40 250 243 241 30 27 27 20 20 18 16 225 20 13 12 11 200 10 175 160 0 150 119 125 109 1
Slide 11: Integration—Thorough and Thoughtful Process
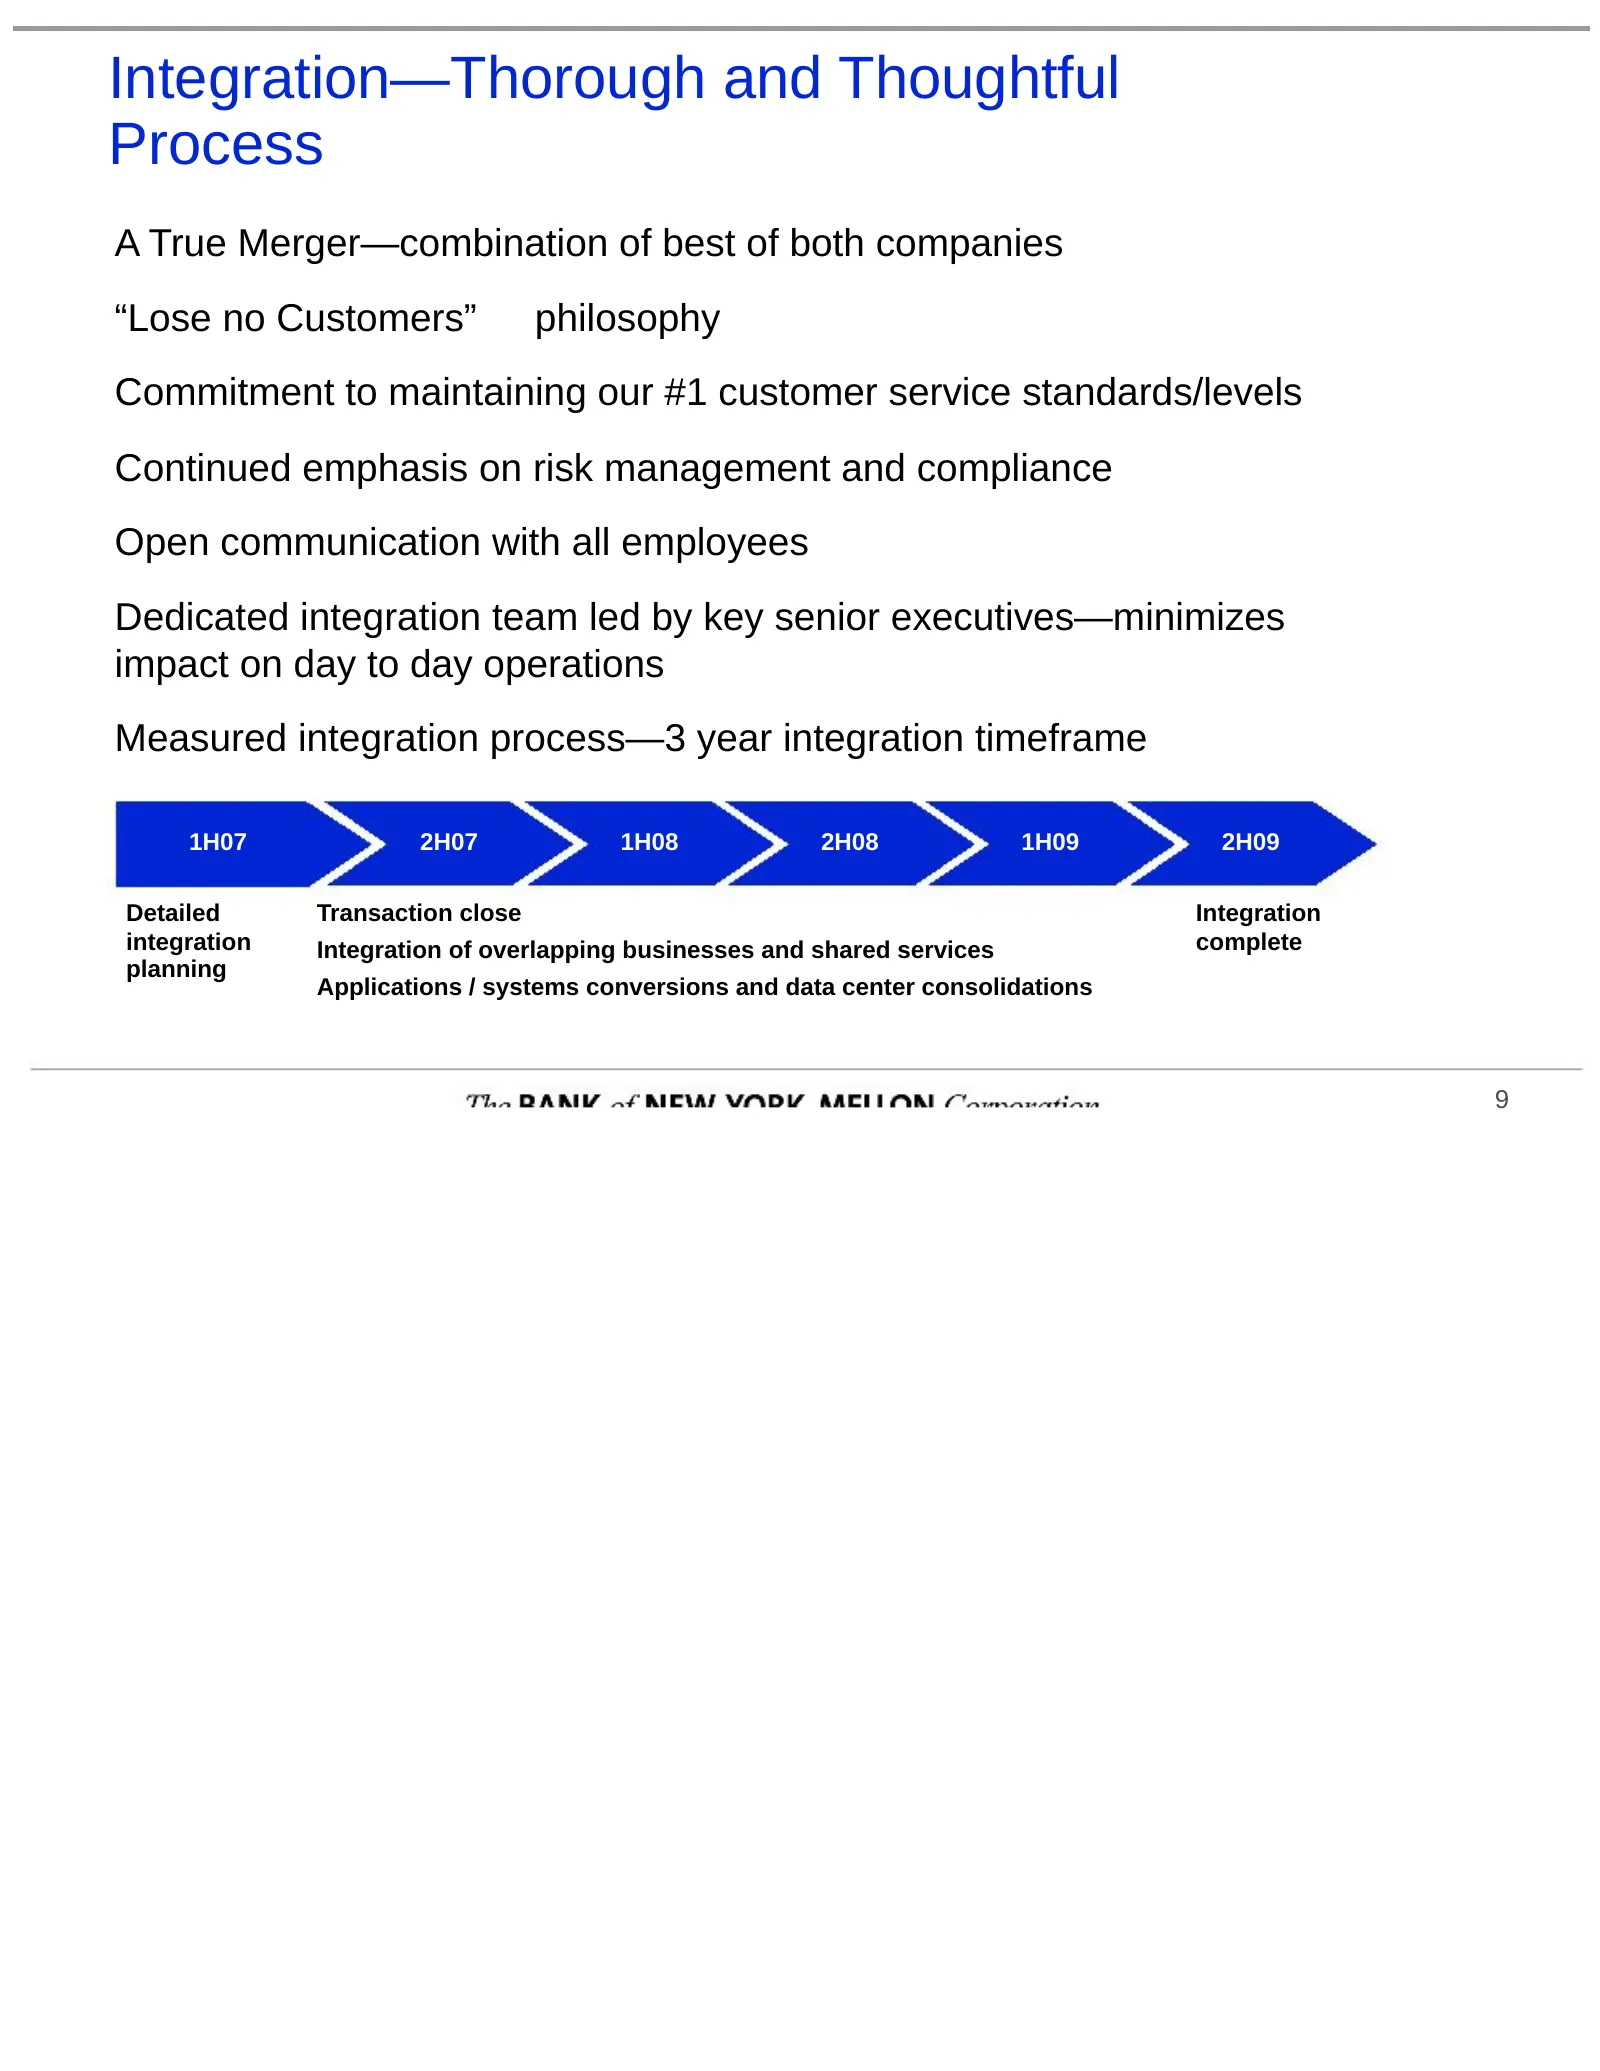
Integration—Thorough and Thoughtful Process A True Merger—combination of best of both companies “Lose no Customers” philosophy Commitment to maintaining our #1 customer service standards/levels Continued emphasis on risk management and compliance Open communication with all employees Dedicated integ
Slide 12: Clearly Defined Operating Strategy
Clearly Defined Operating Strategy Focus on high-growth global businesses—Securities Servicing and Asset Management Maintain superior client service, investment performance and the highest fiduciary standards Achieve competitive margins in each business line Deploy capital effectively to accelerate
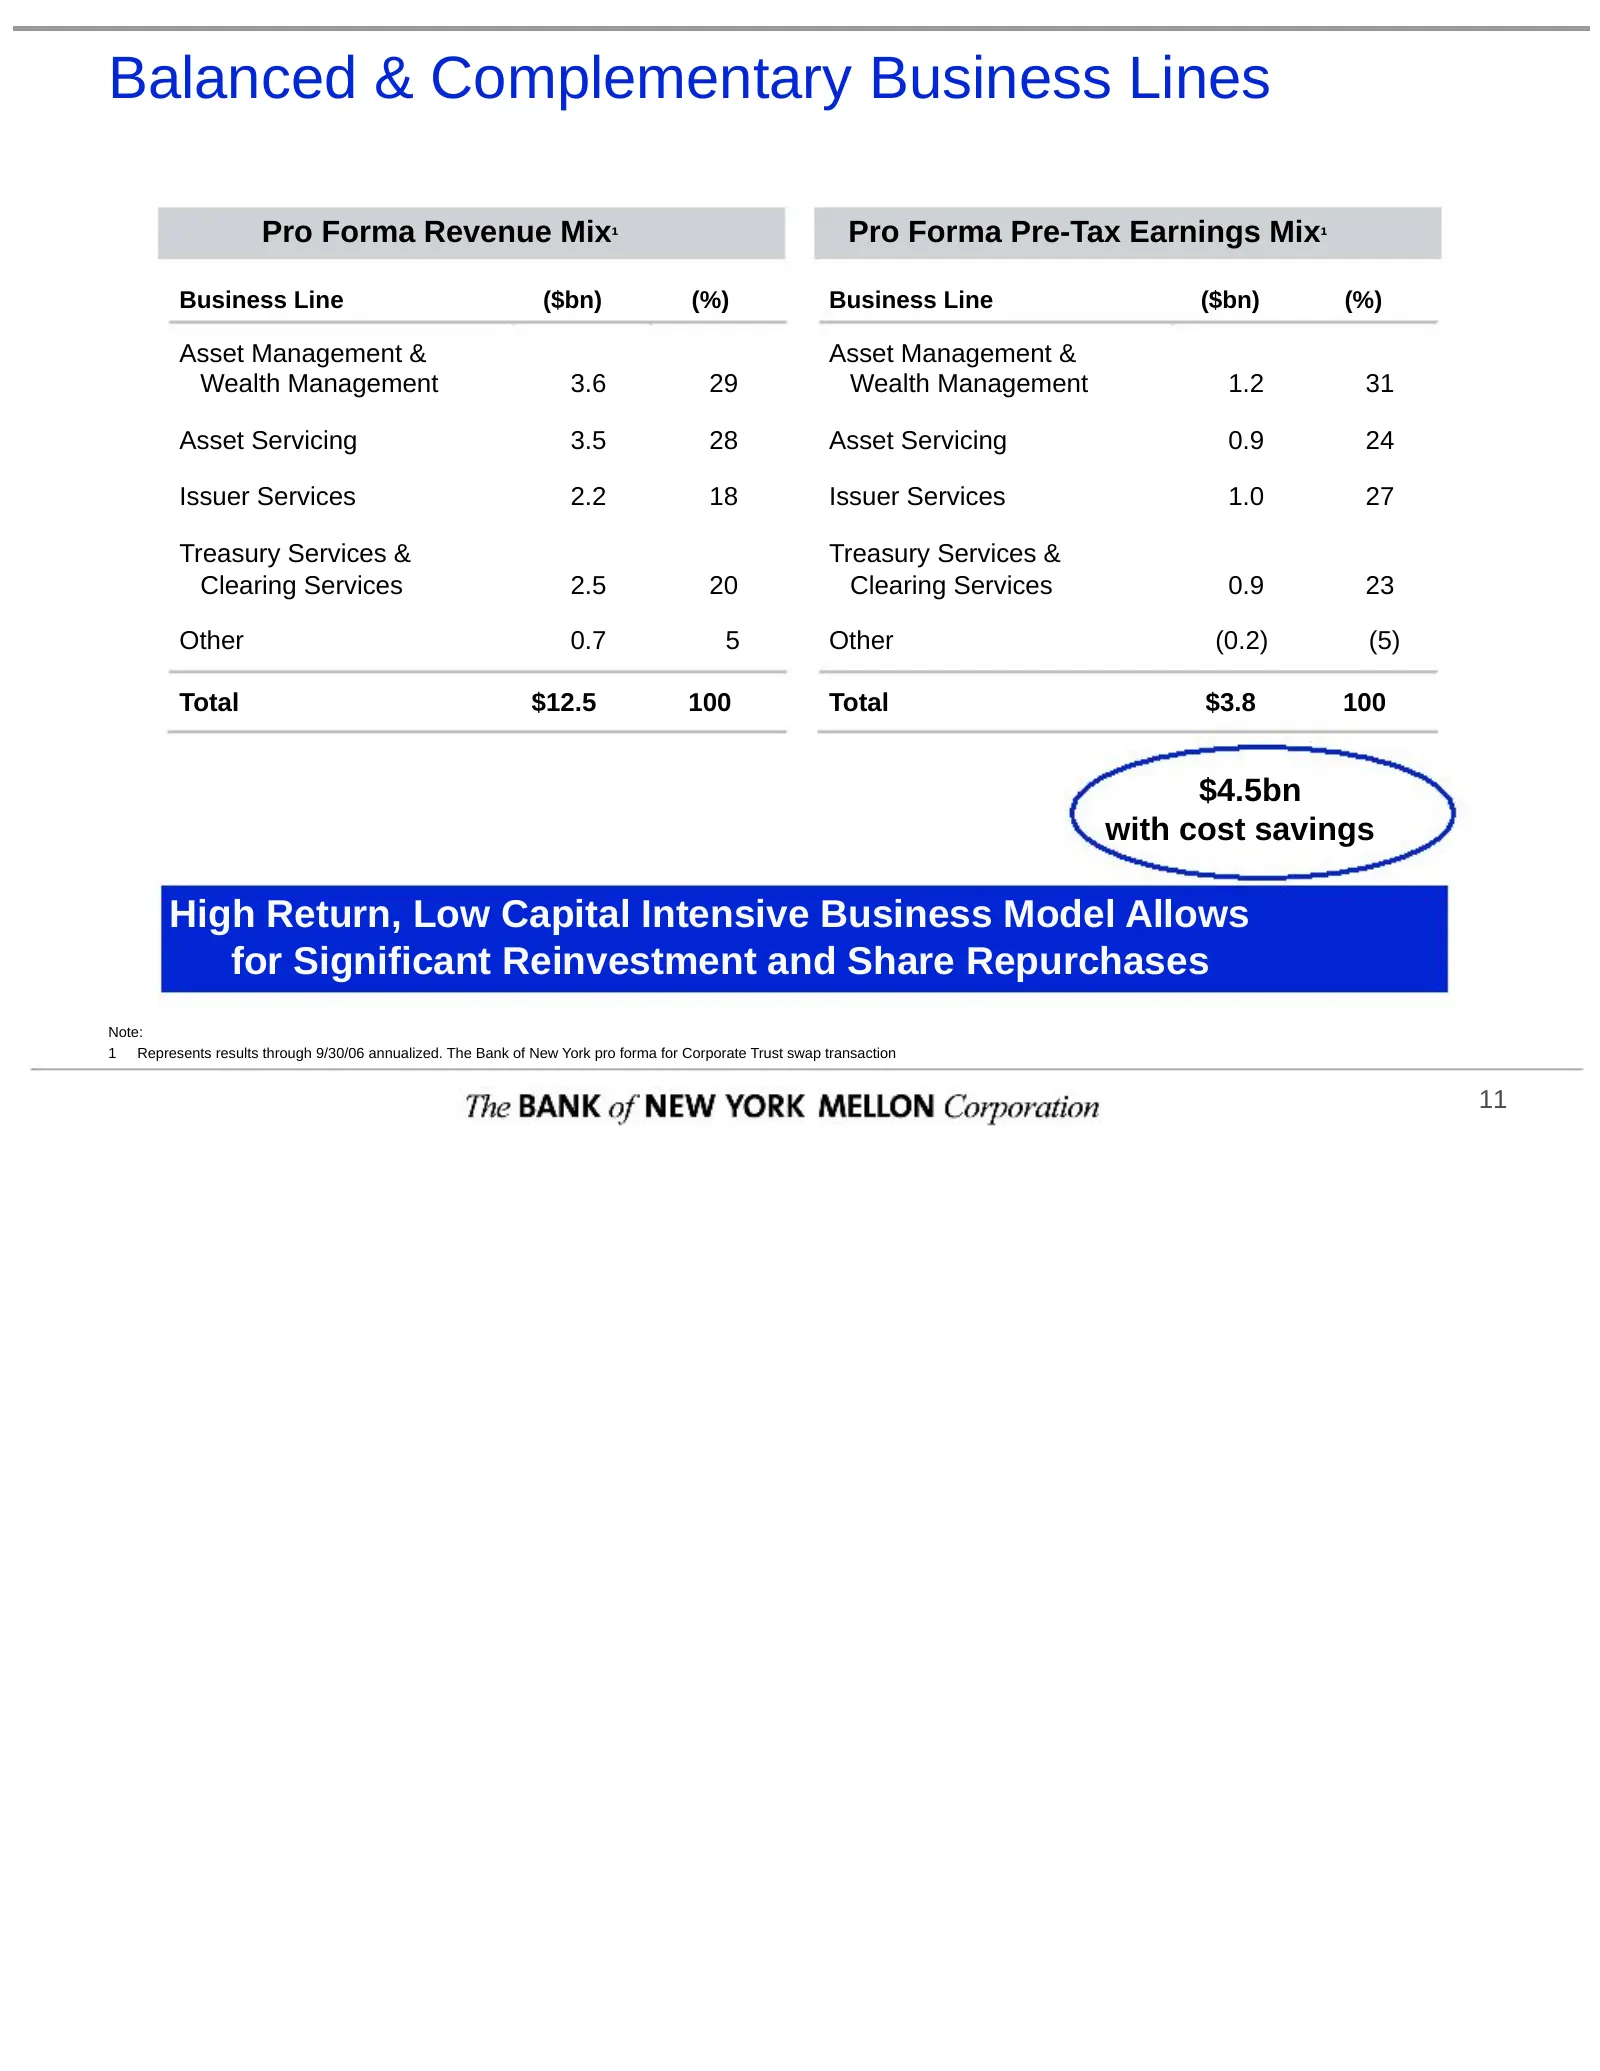
Slide 13: Balanced & Complementary Business Lines
Balanced & Complementary Business Lines Pro Forma Revenue Mix¹ Pro Forma Pre-Tax Earnings Mix¹ Business Line ($bn) (%) Business Line ($bn) (%) Asset Management & Asset Management & Wealth Management 3.6 29 Wealth Management 1.2 31 Asset Servicing 3.5 28 Asset Servicing 0.9 24 Issuer Services 2.2 18
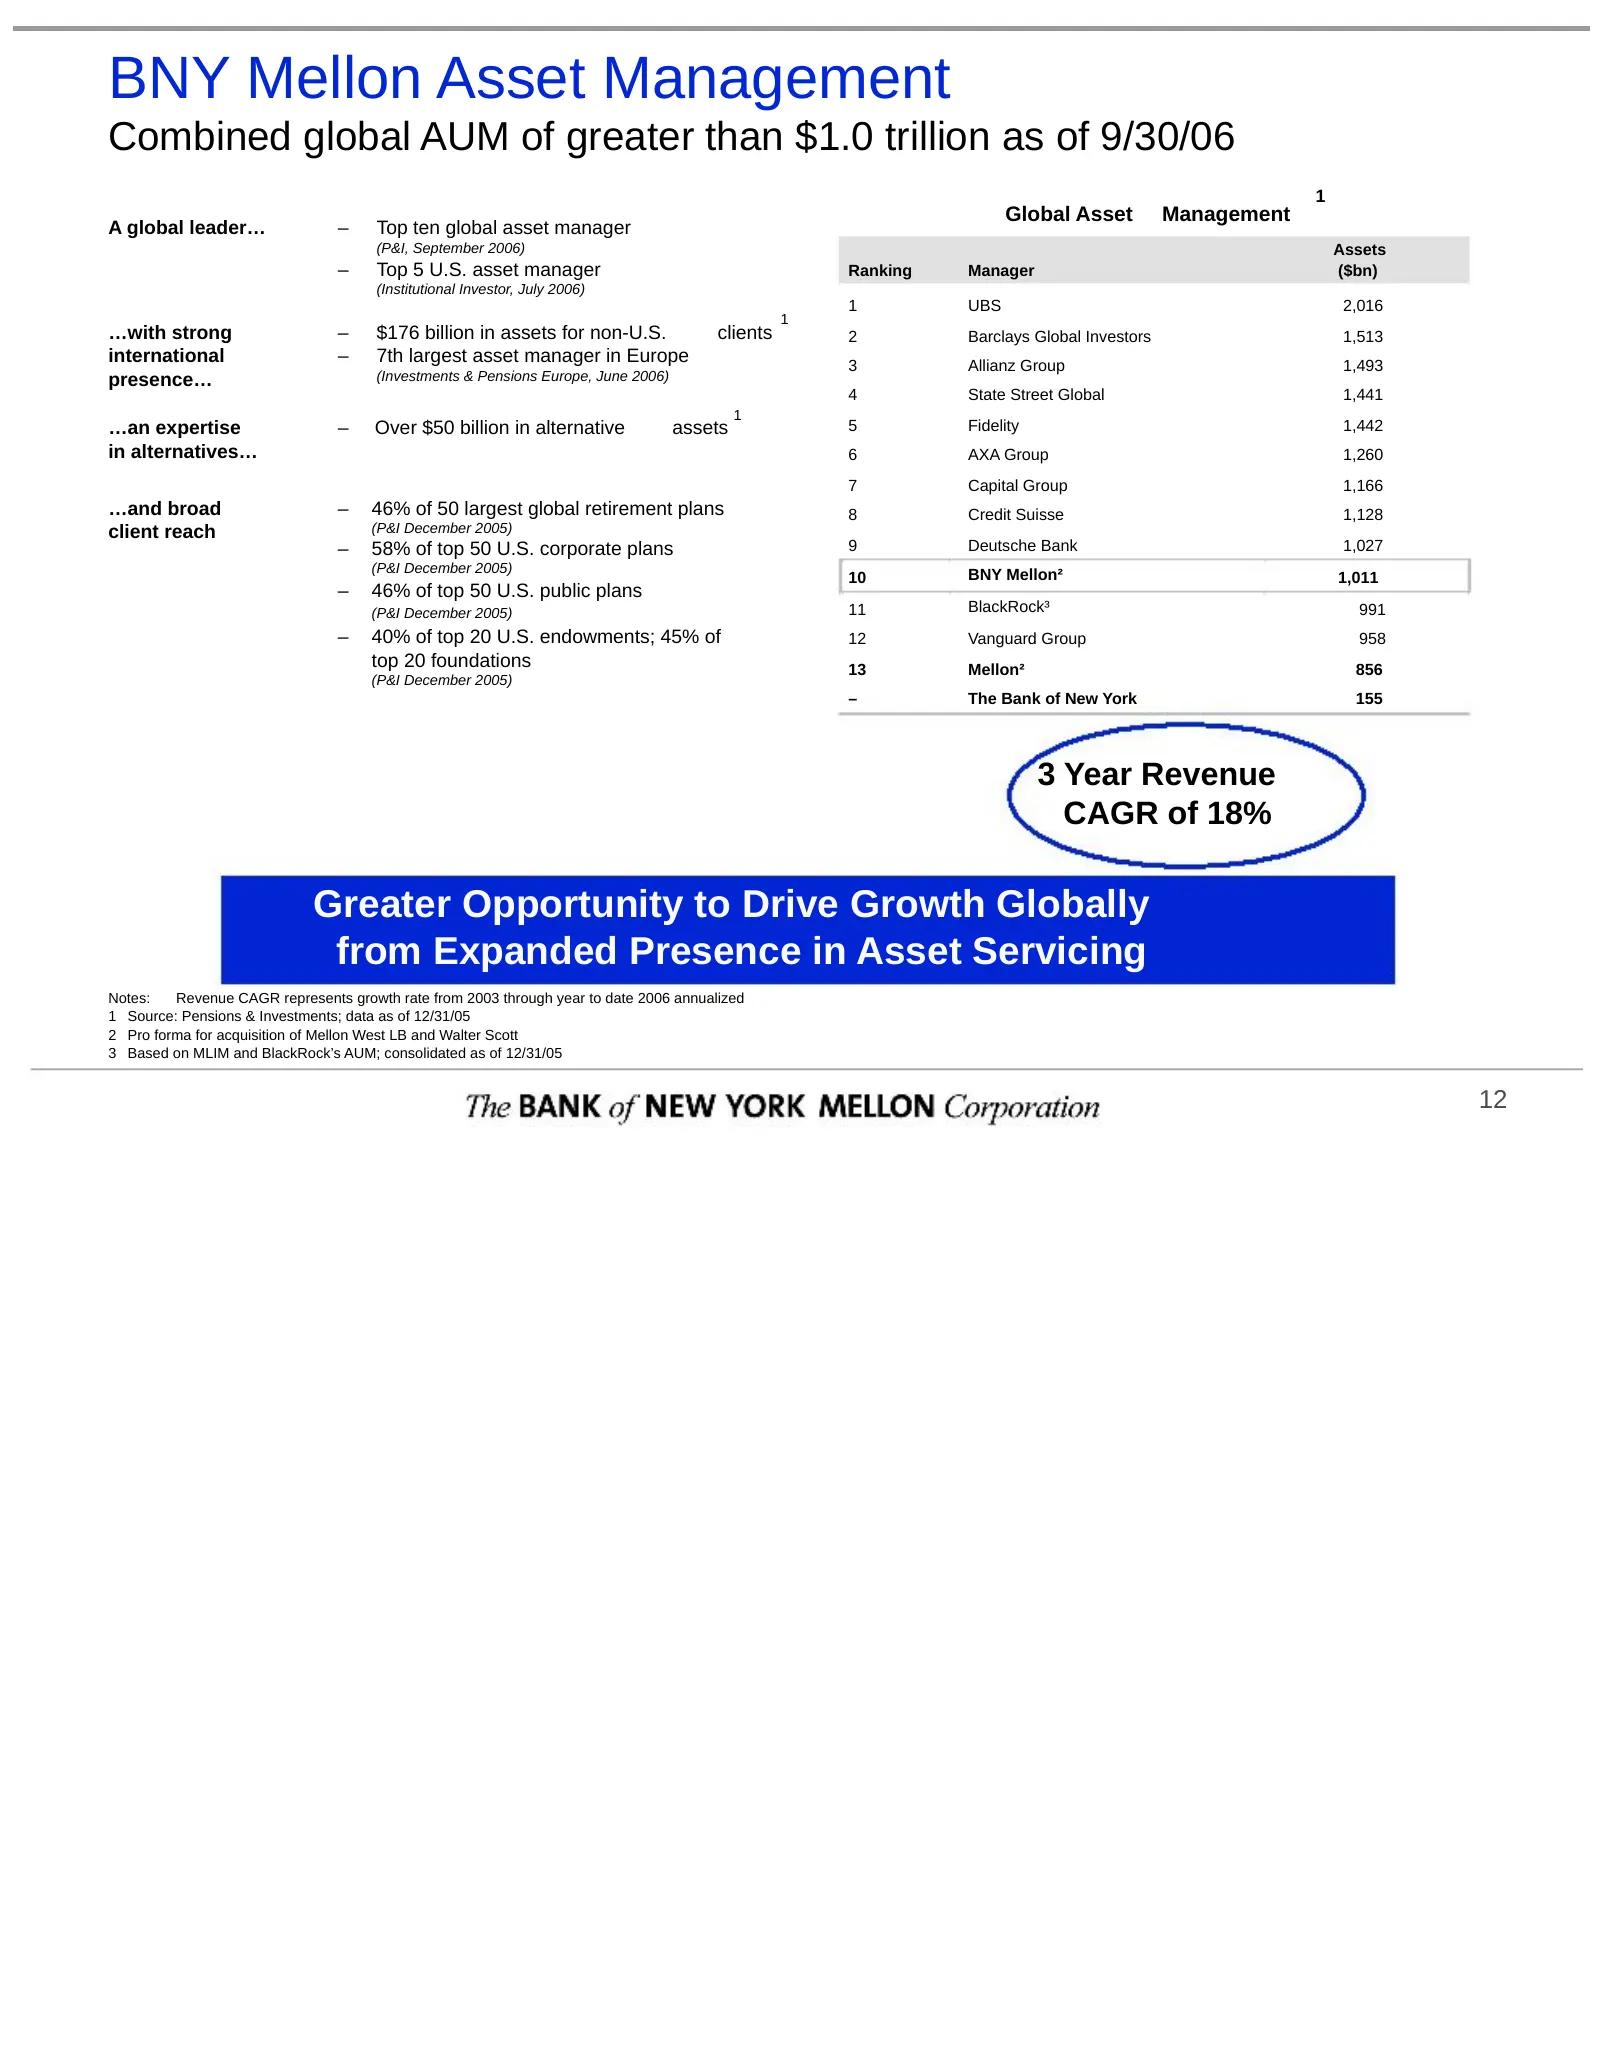
Slide 14: BNY Mellon Asset Management
BNY Mellon Asset Management Combined global AUM of greater than $1.0 trillion as of 9/30/06 1 Global Asset Management A global leader… – Top ten global asset manager (P&I, September 2006) Assets – Top 5 U.S. asset manager Ranking Manager ($bn) (Institutional Investor, July 2006) 1 UBS 2,016 1 …with
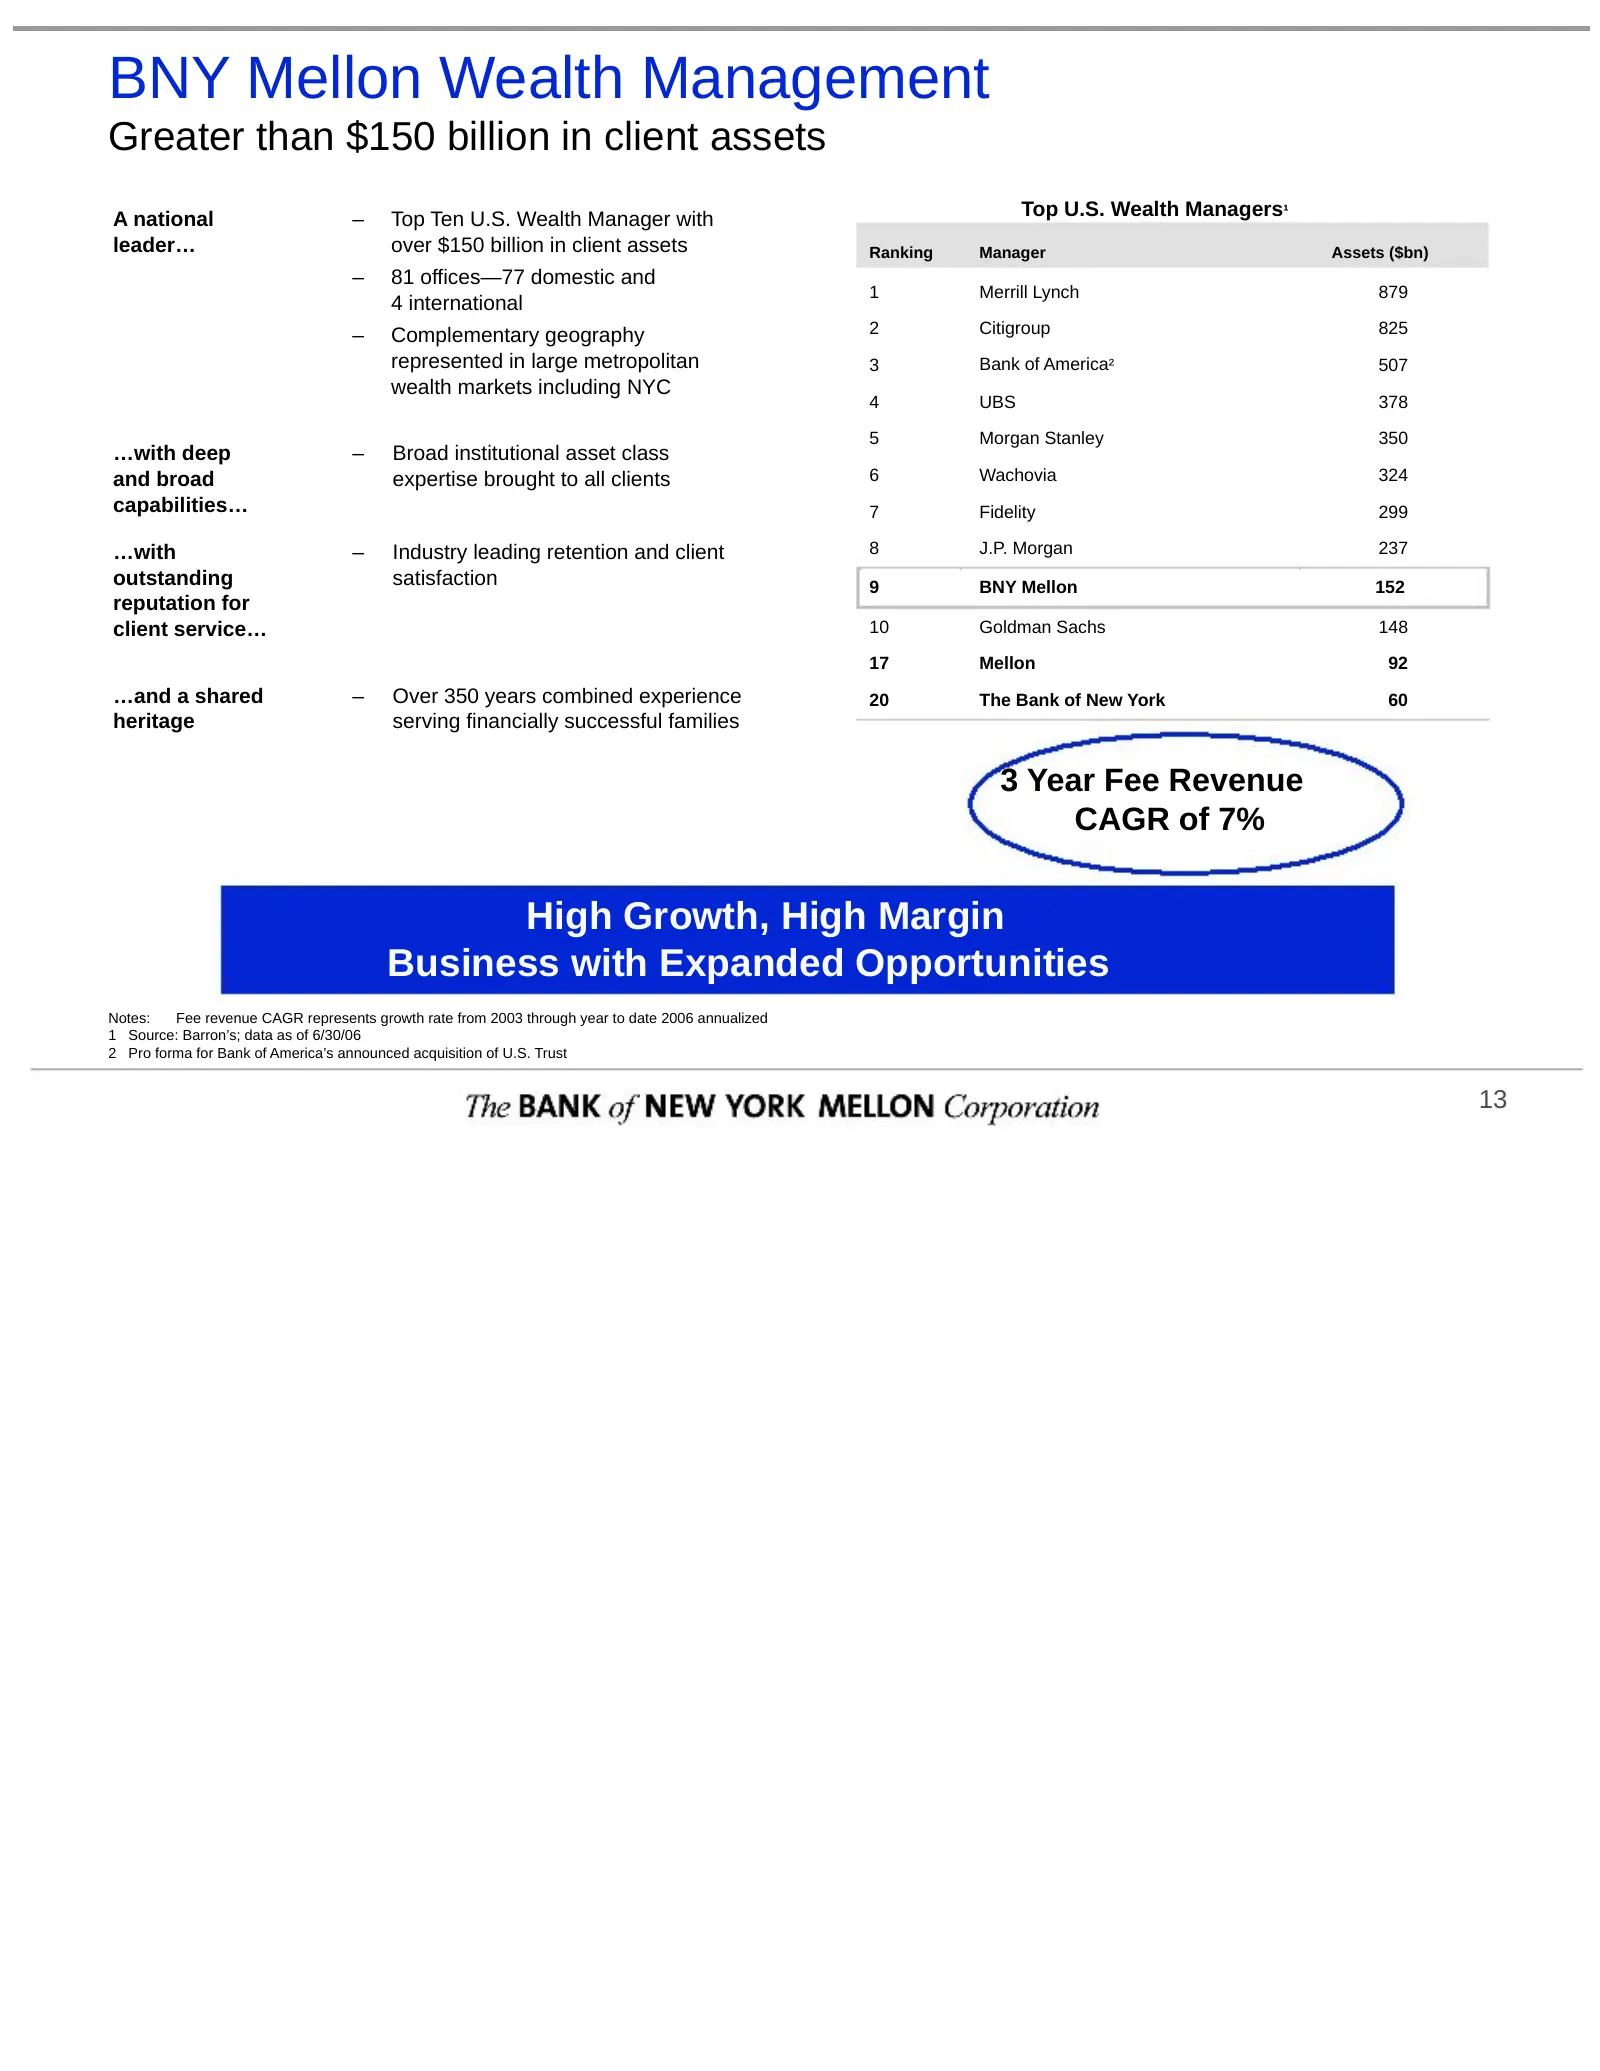
Slide 15: BNY Mellon Wealth Management
BNY Mellon Wealth Management Greater than $150 billion in client assets A national – Top Ten U.S. Wealth Manager with Top U.S. Wealth Managers¹ leader… over $150 billion in client assets Ranking Manager Assets ($bn) – 81 offices—77 domestic and 1 Merrill Lynch 879 4 international – Complementary geo
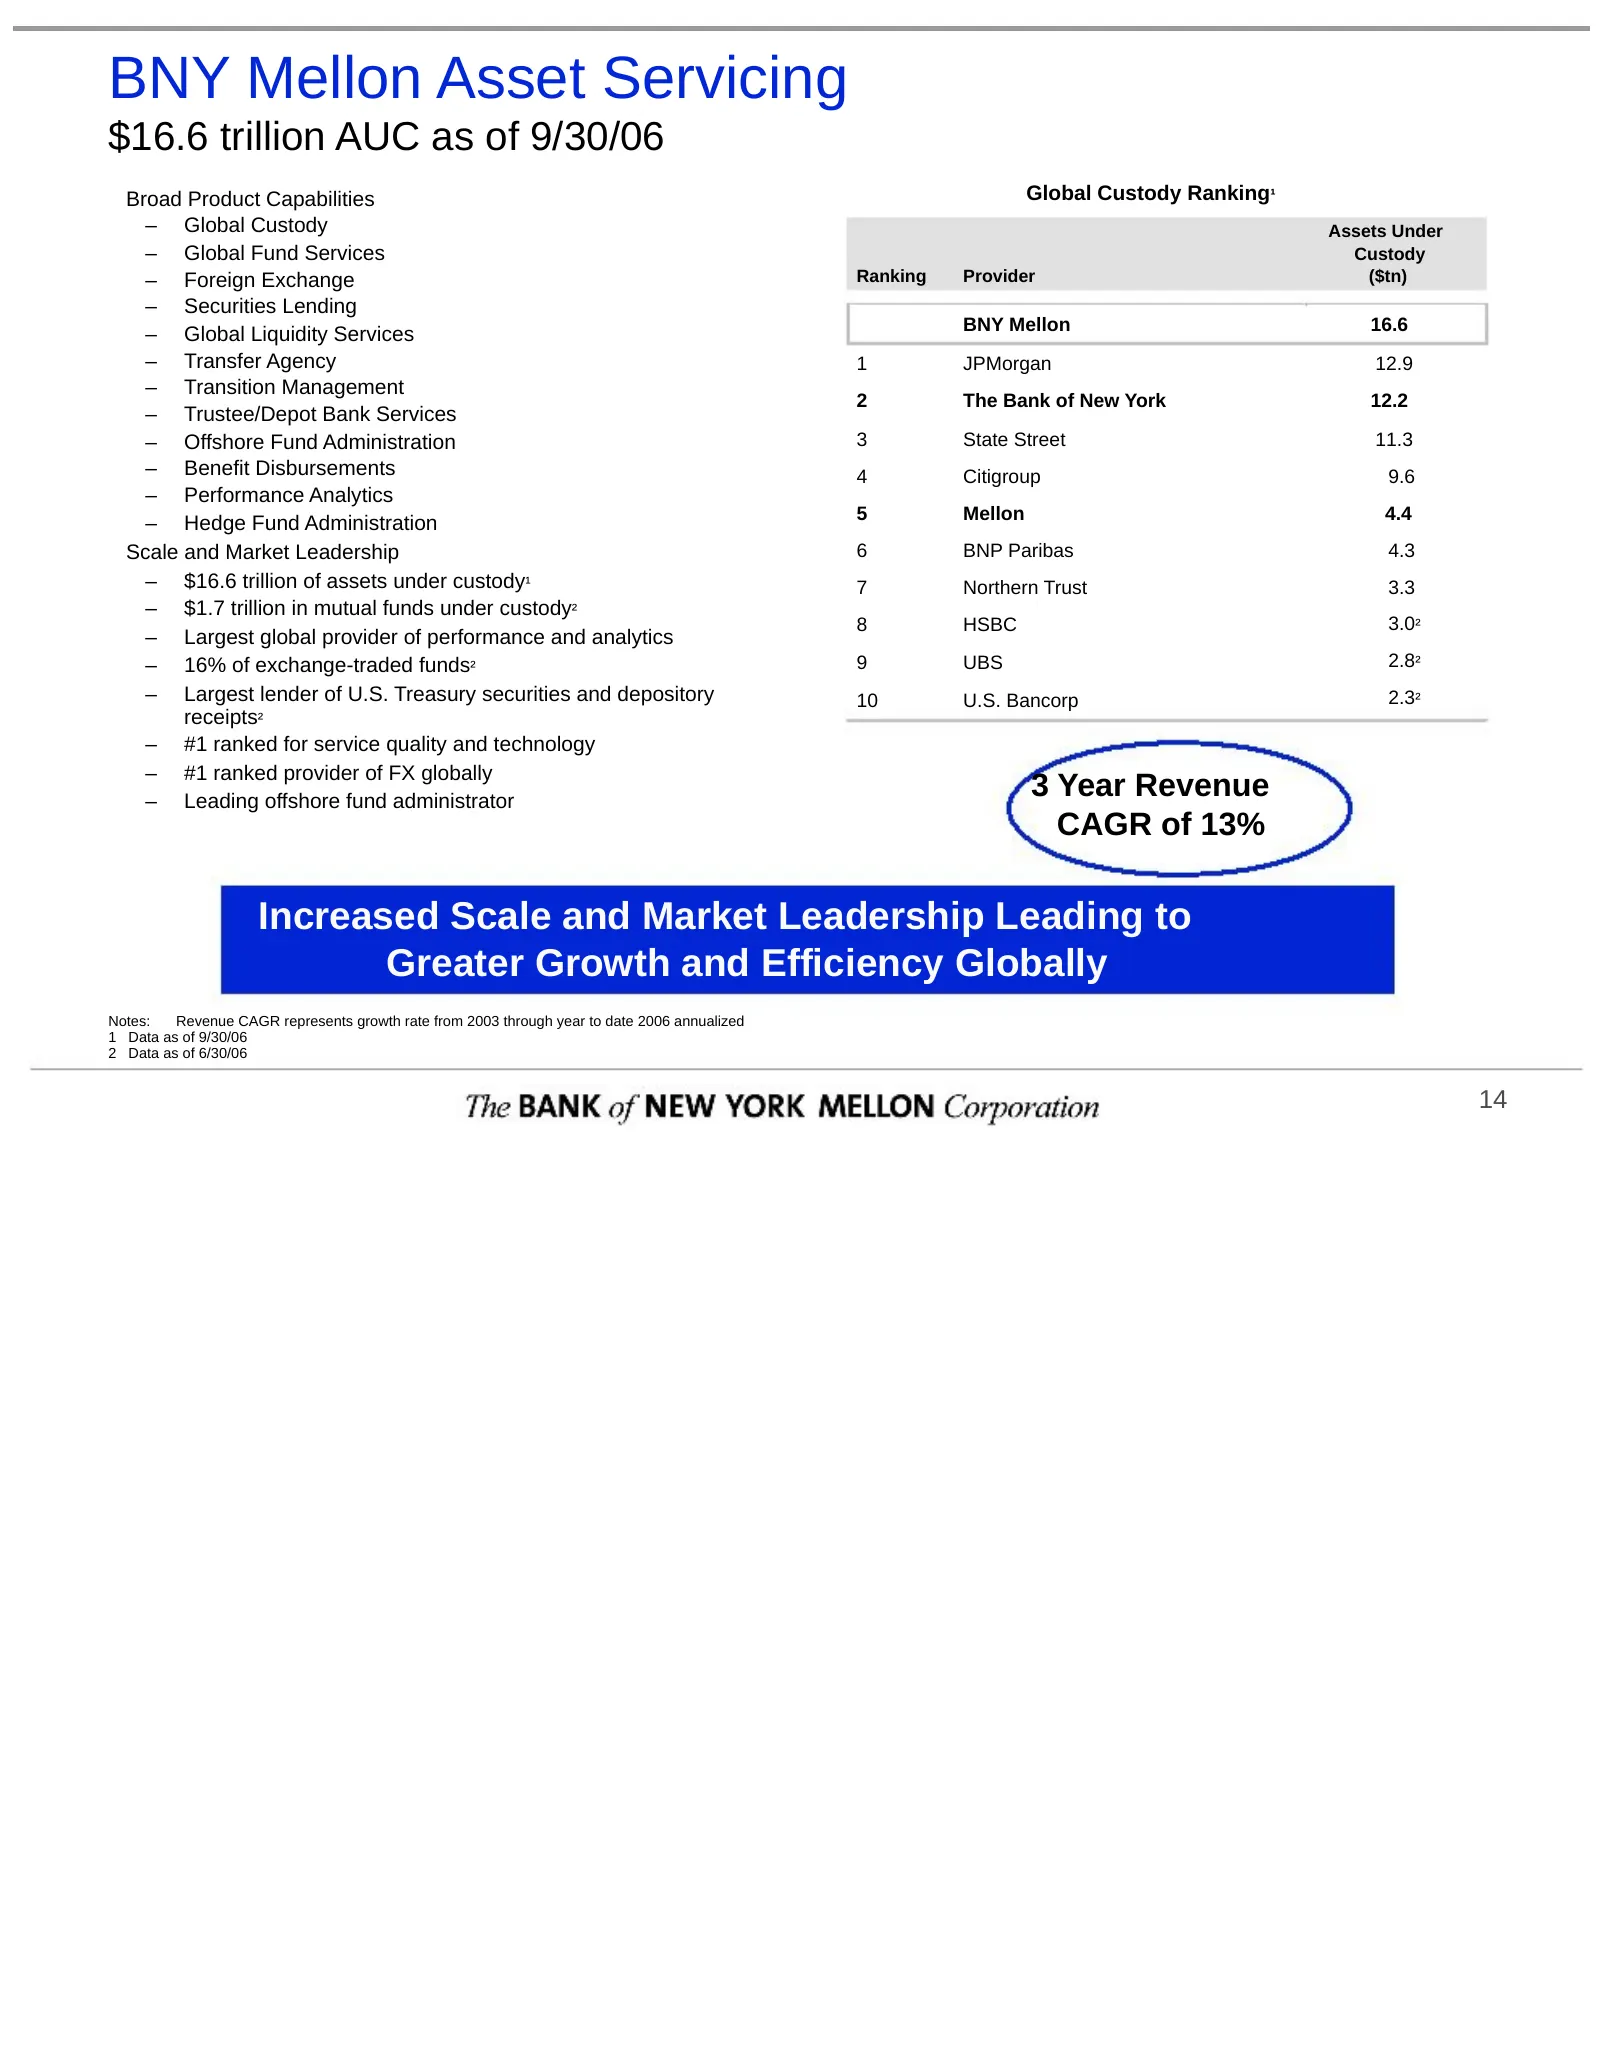
Slide 16: BNY Mellon Asset Servicing
BNY Mellon Asset Servicing $16.6 trillion AUC as of 9/30/06 Broad Product Capabilities Global Custody Ranking¹ – Global Custody Assets Under – Global Fund Services Custody – Foreign Exchange Ranking Provider ($tn) – Securities Lending BNY Mellon 16.6 – Global Liquidity Services – Transfer Agency 1 J
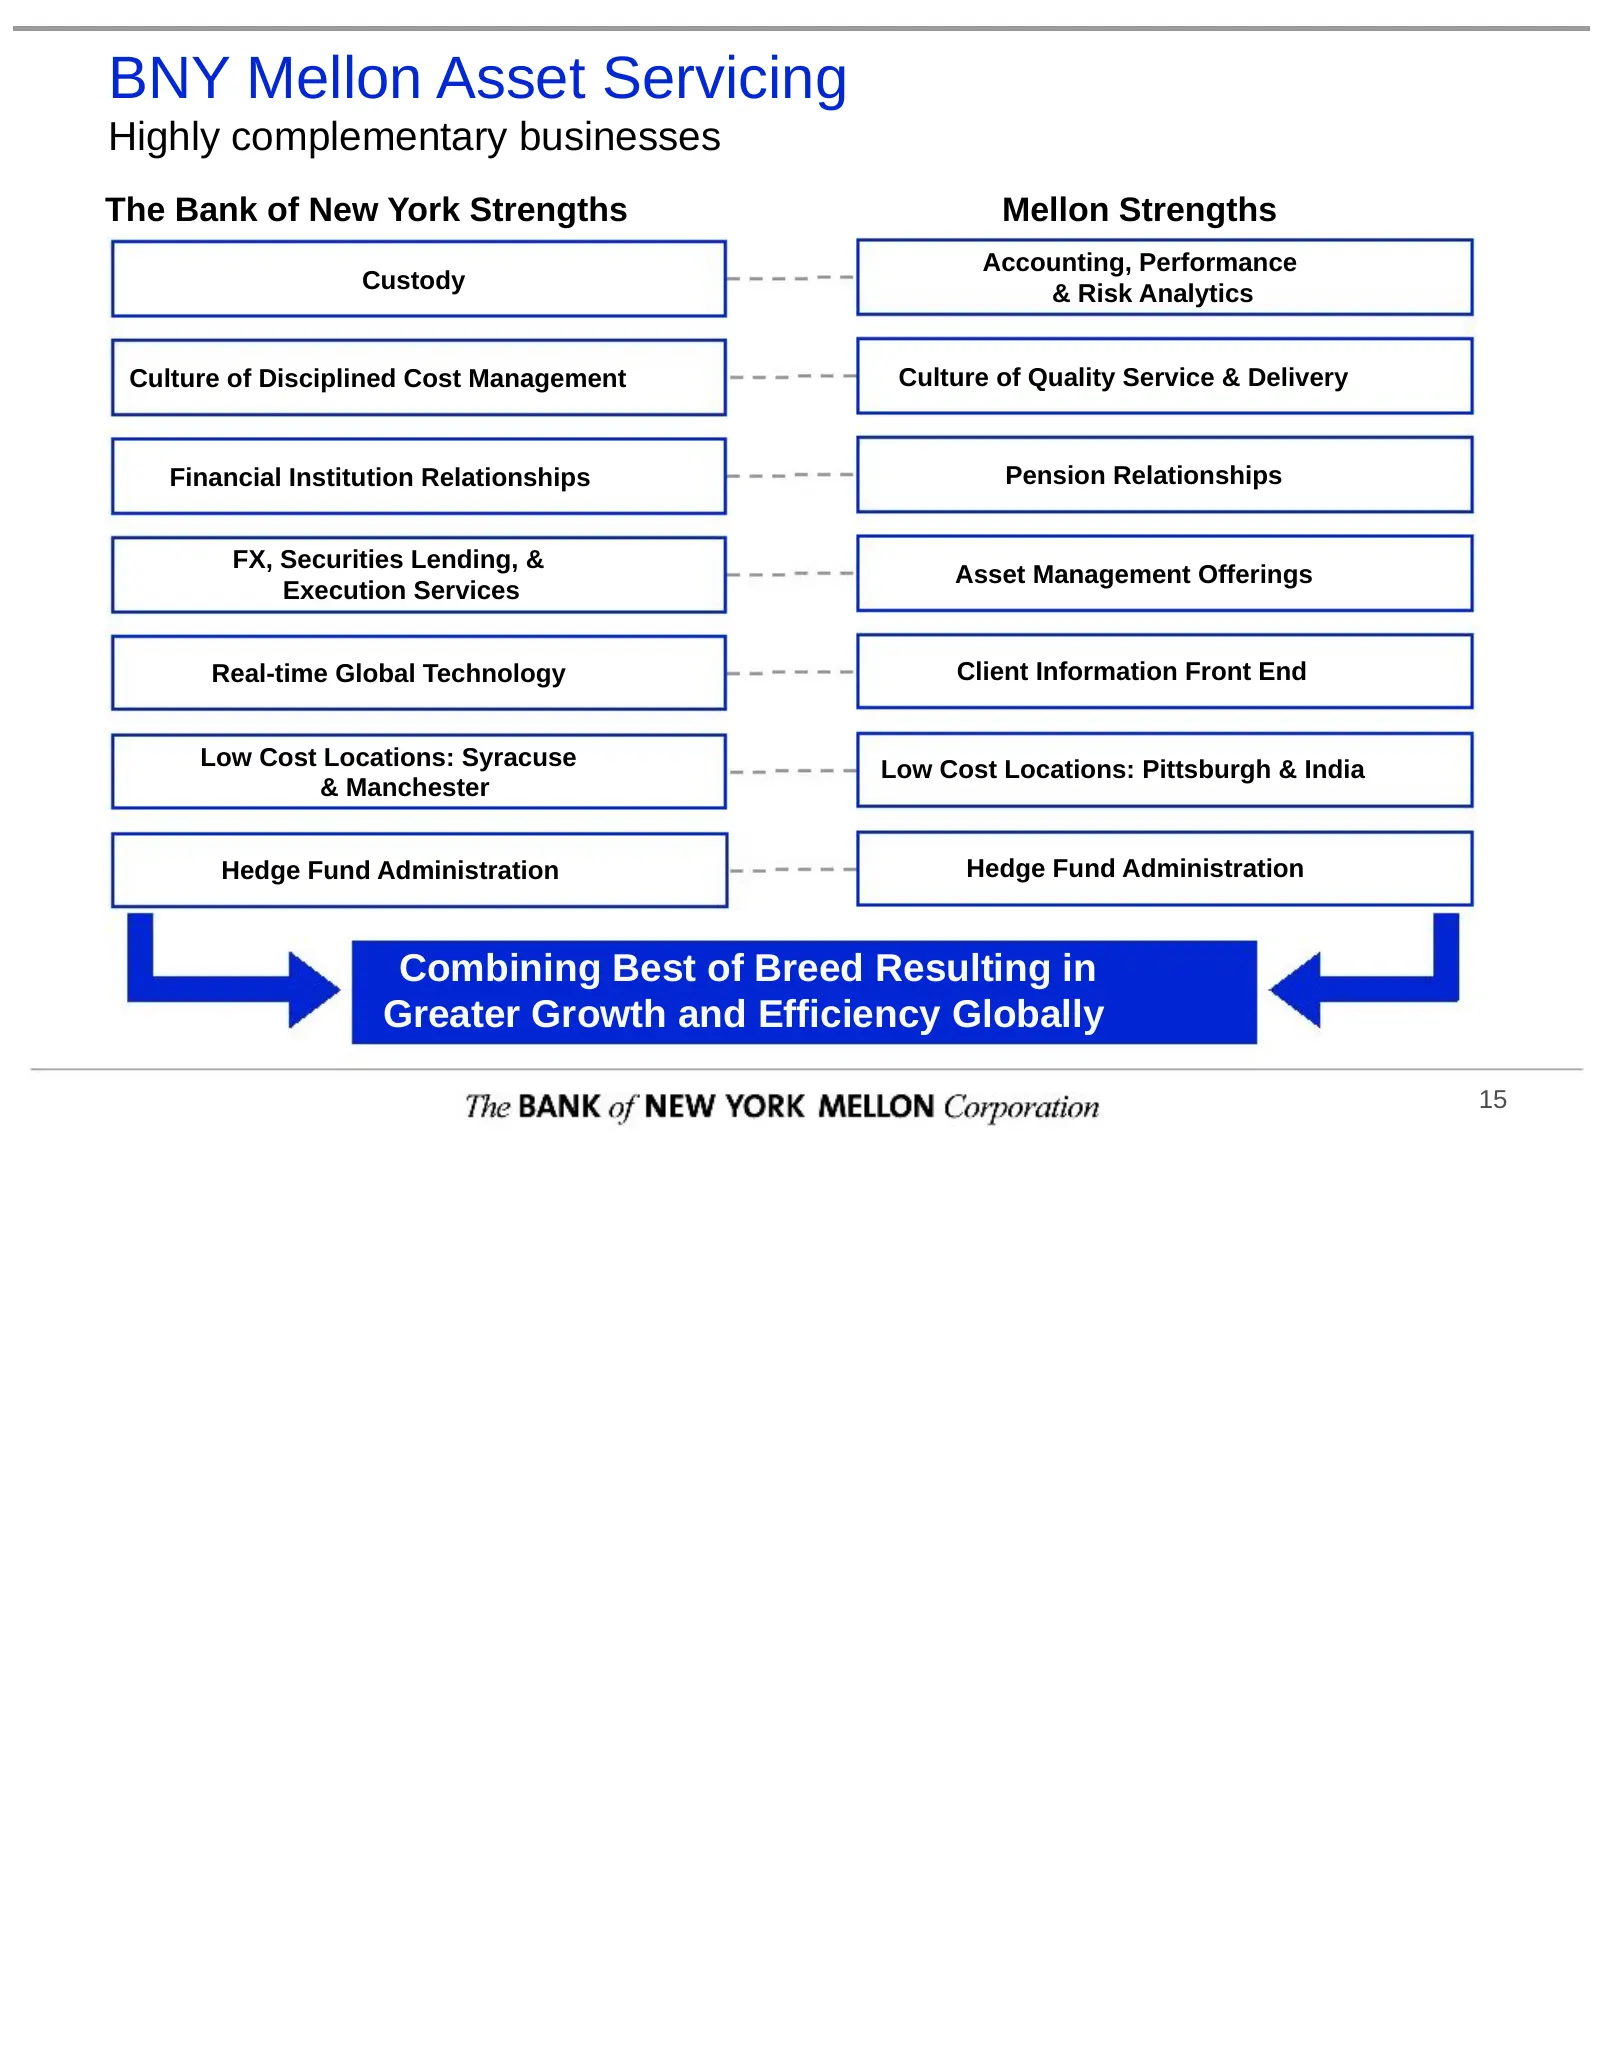
Slide 17: BNY Mellon Asset Servicing: Highly complementary businesses
BNY Mellon Asset Servicing Highly complementary businesses The Bank of New York Strengths Mellon Strengths Accounting, Performance Custody & Risk Analytics Culture of Disciplined Cost Management Culture of Quality Service & Delivery Financial Institution Relationships Pension Relationships FX, Secur
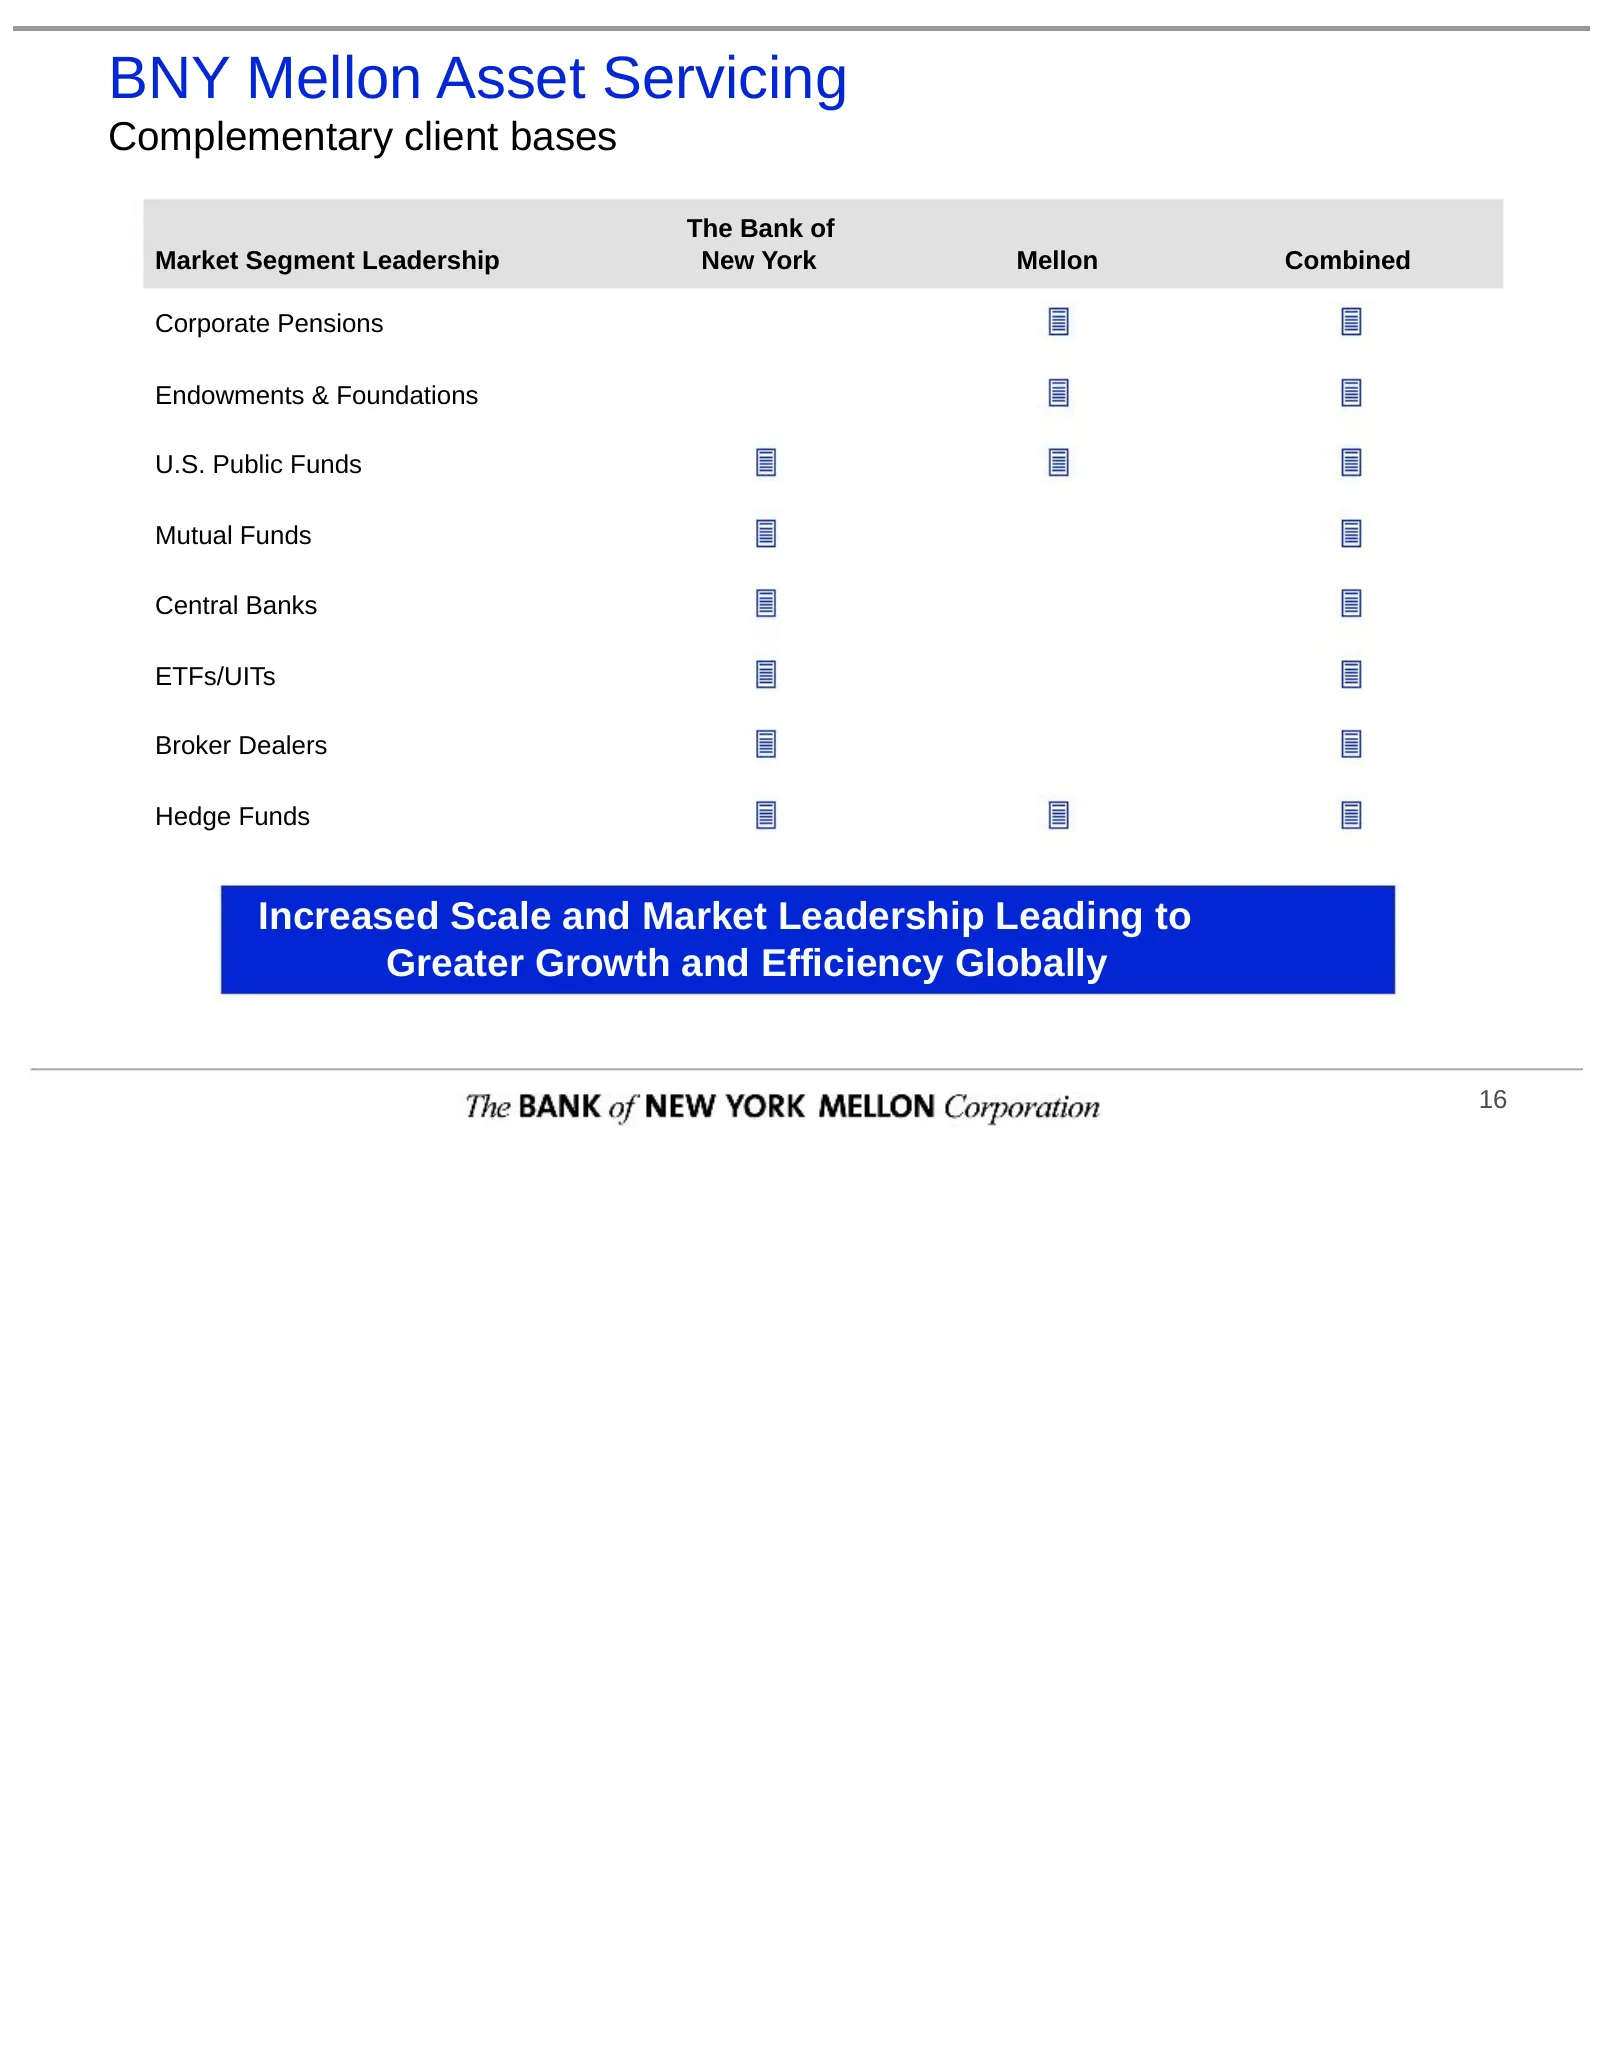
Slide 18: BNY Mellon Asset Servicing: Complementary client bases
BNY Mellon Asset Servicing Complementary client bases The Bank of Market Segment Leadership New York Mellon Combined Corporate Pensions Endowments & Foundations U.S. Public Funds Mutual Funds Central Banks ETFs/UITs Broker Dealers Hedge Funds Increased Scale and Market Leadership Leading to Greater
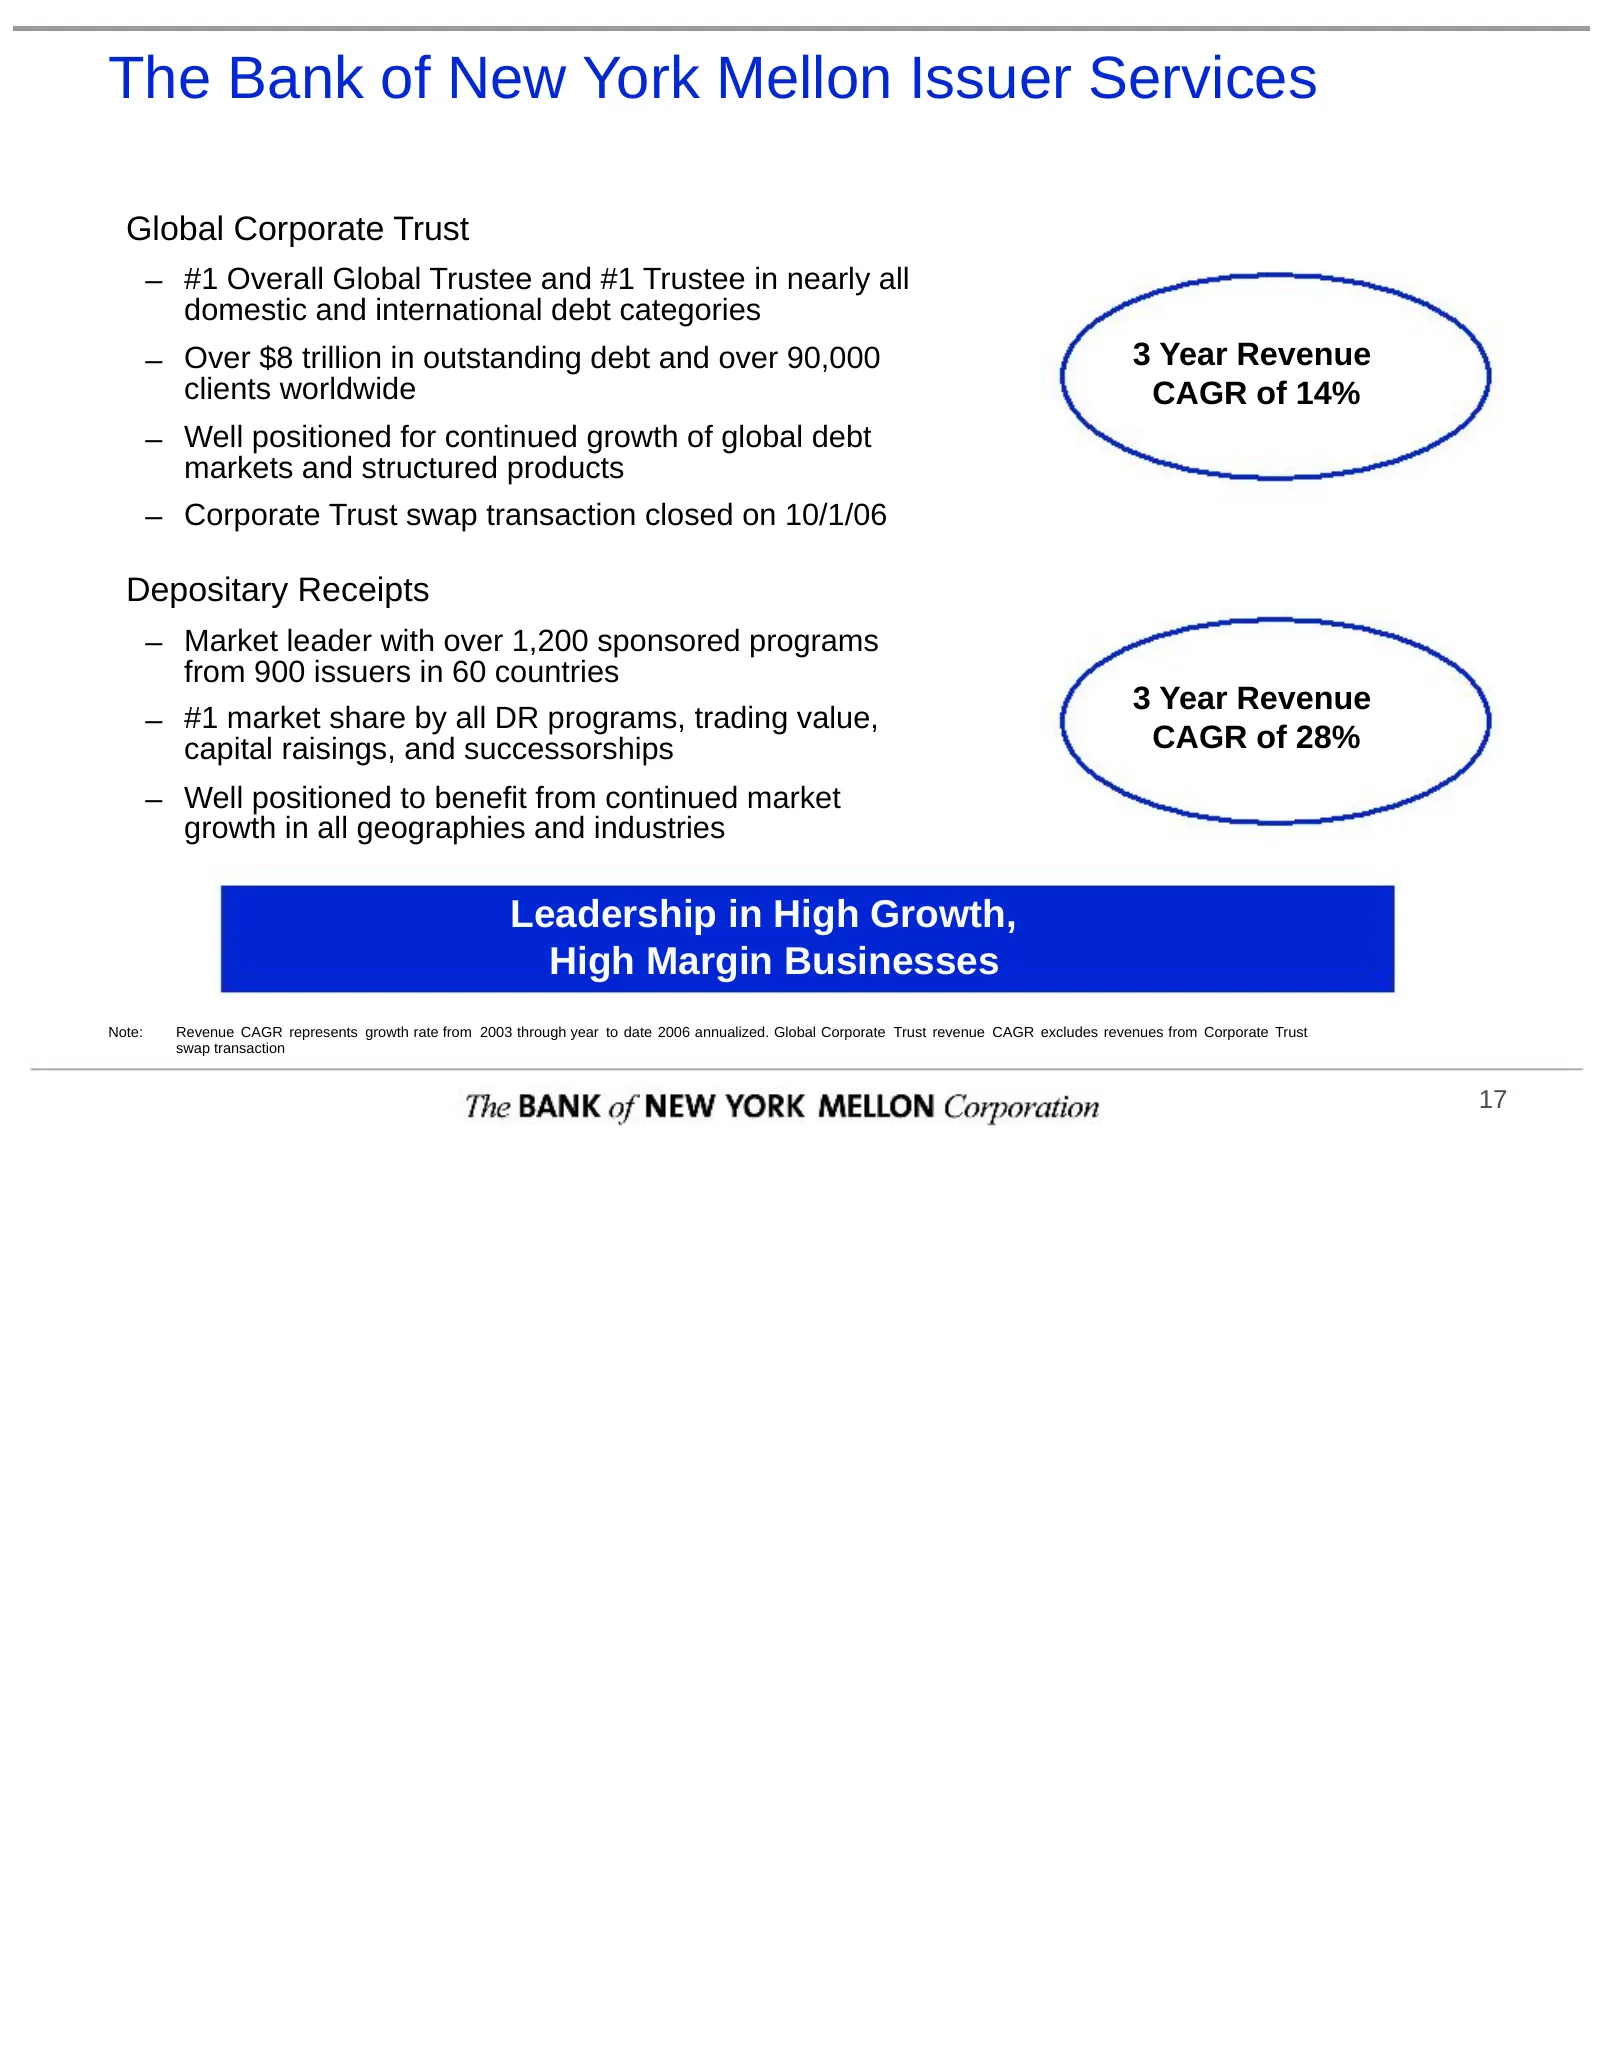
Slide 19: The Bank of New York Mellon Issuer Services
The Bank of New York Mellon Issuer Services Global Corporate Trust – #1 Overall Global Trustee and #1 Trustee in nearly all domestic and international debt categories – Over $8 trillion in outstanding debt and over 90,000 3 Year Revenue clients worldwide CAGR of 14% – Well positioned for continued g
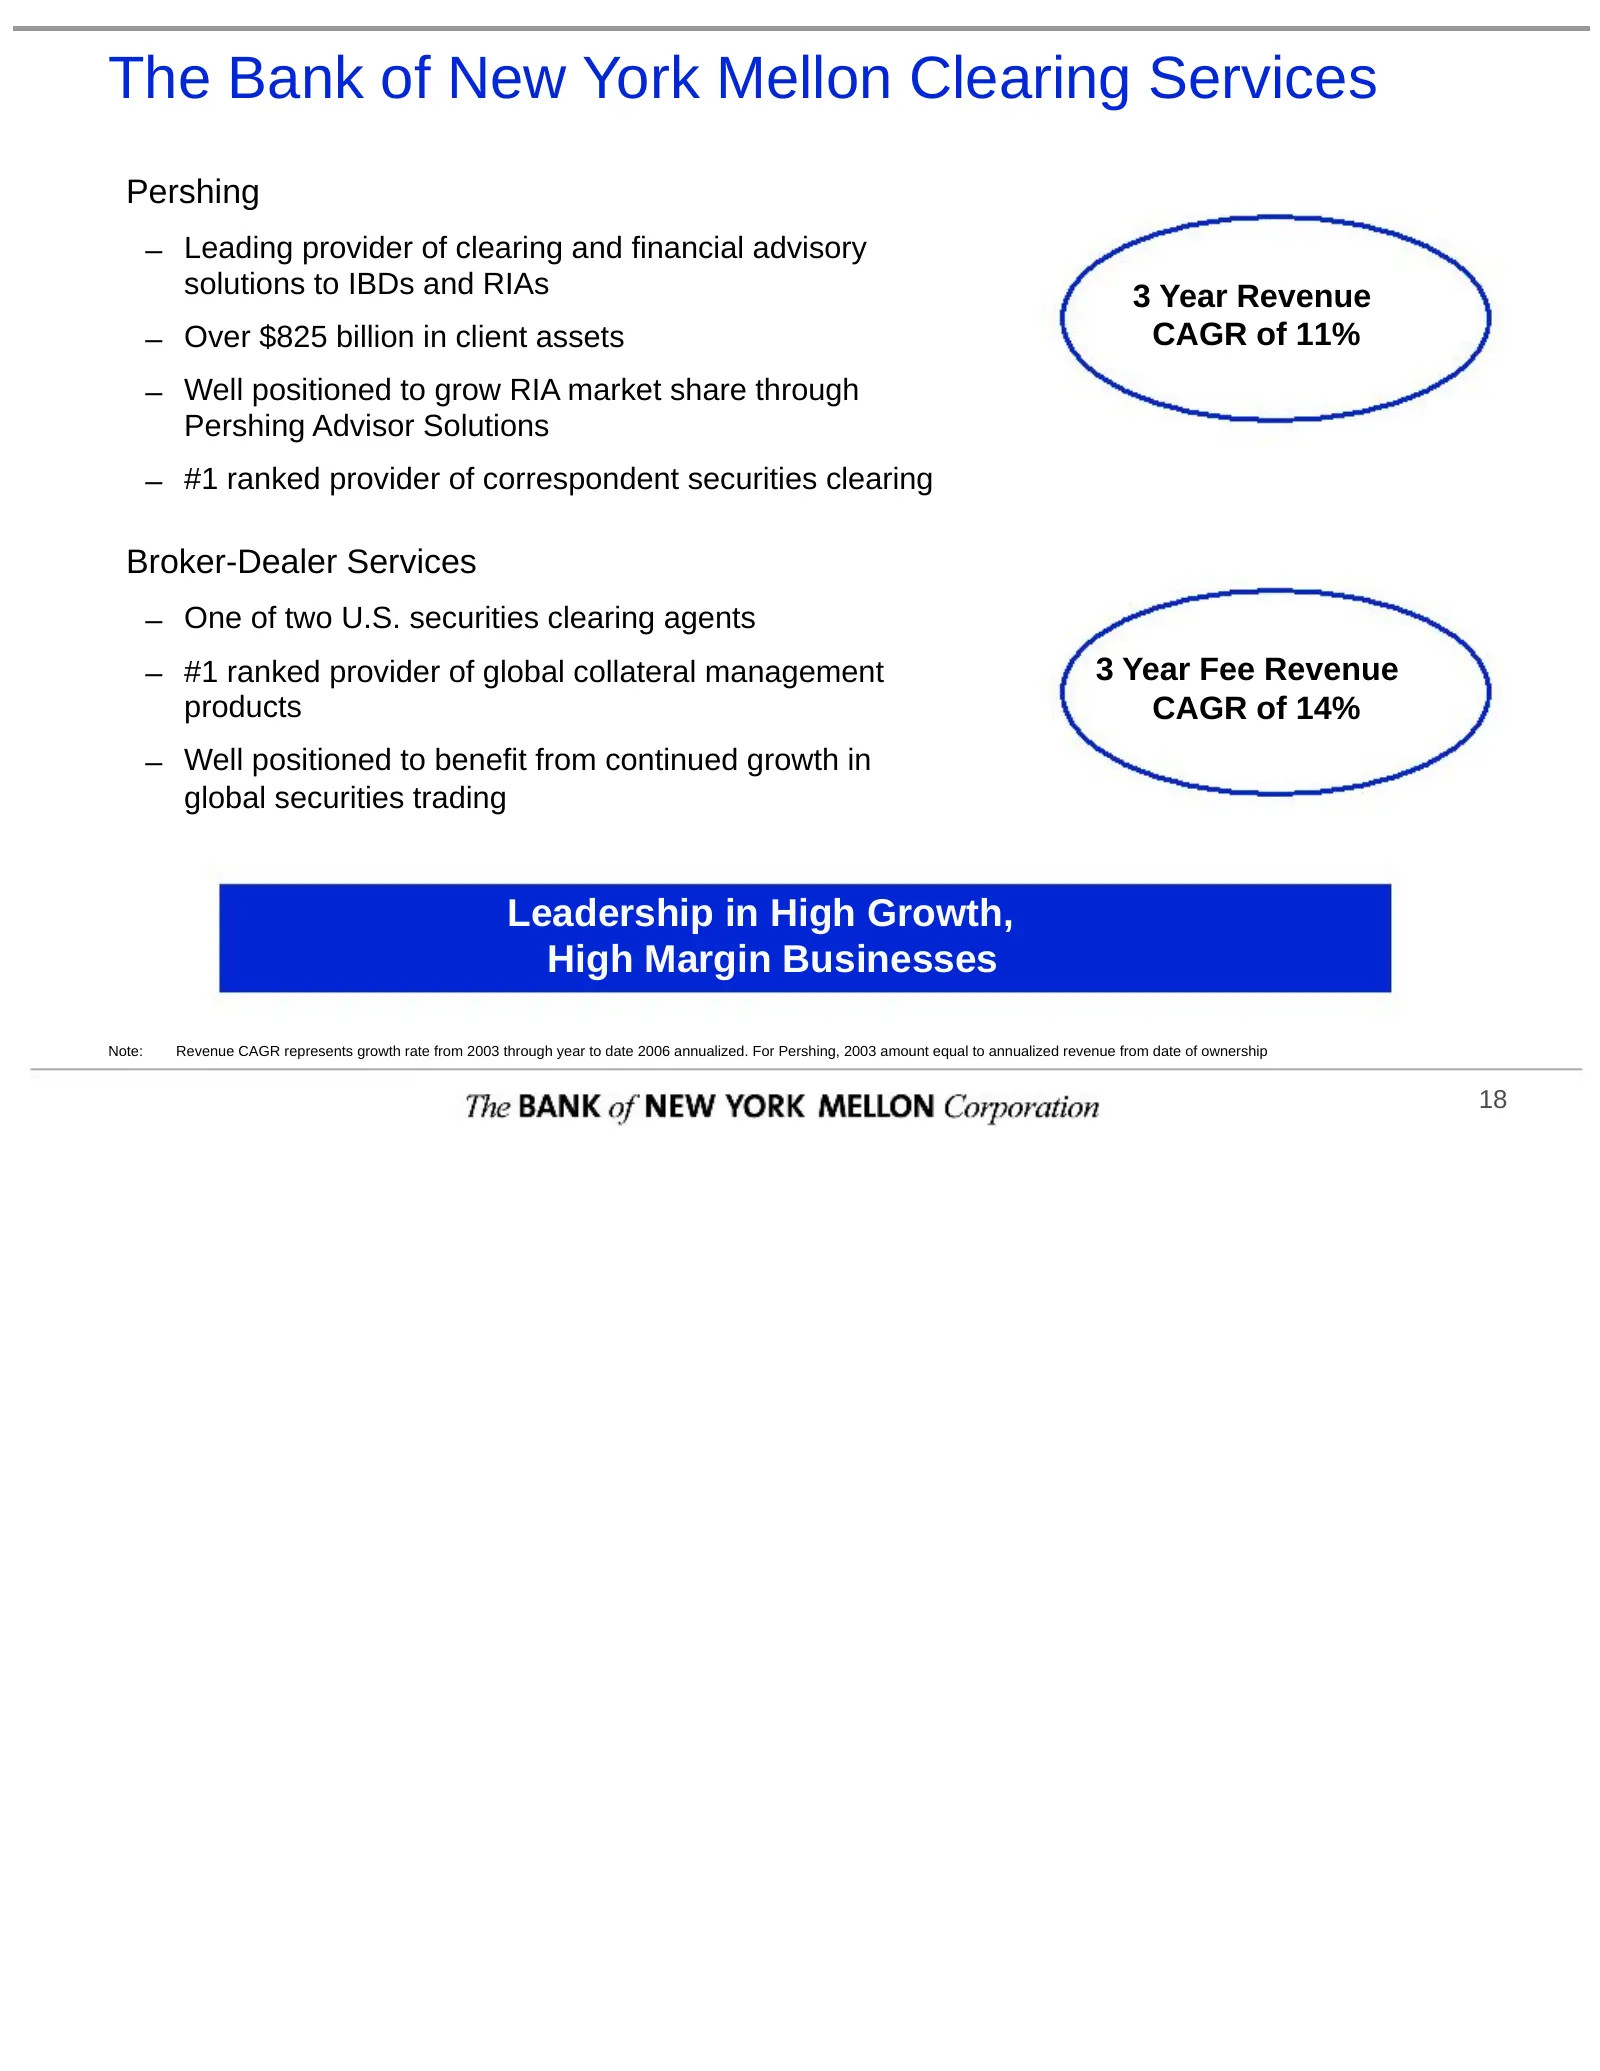
Slide 20: The Bank of New York Mellon Clearing Services
The Bank of New York Mellon Clearing Services Pershing – Leading provider of clearing and financial advisory solutions to IBDs and RIAs 3 Year Revenue – Over $825 billion in client assets CAGR of 11% – Well positioned to grow RIA market share through Pershing Advisor Solutions – #1 ranked provider o
Slide 21: Financial Assumptions
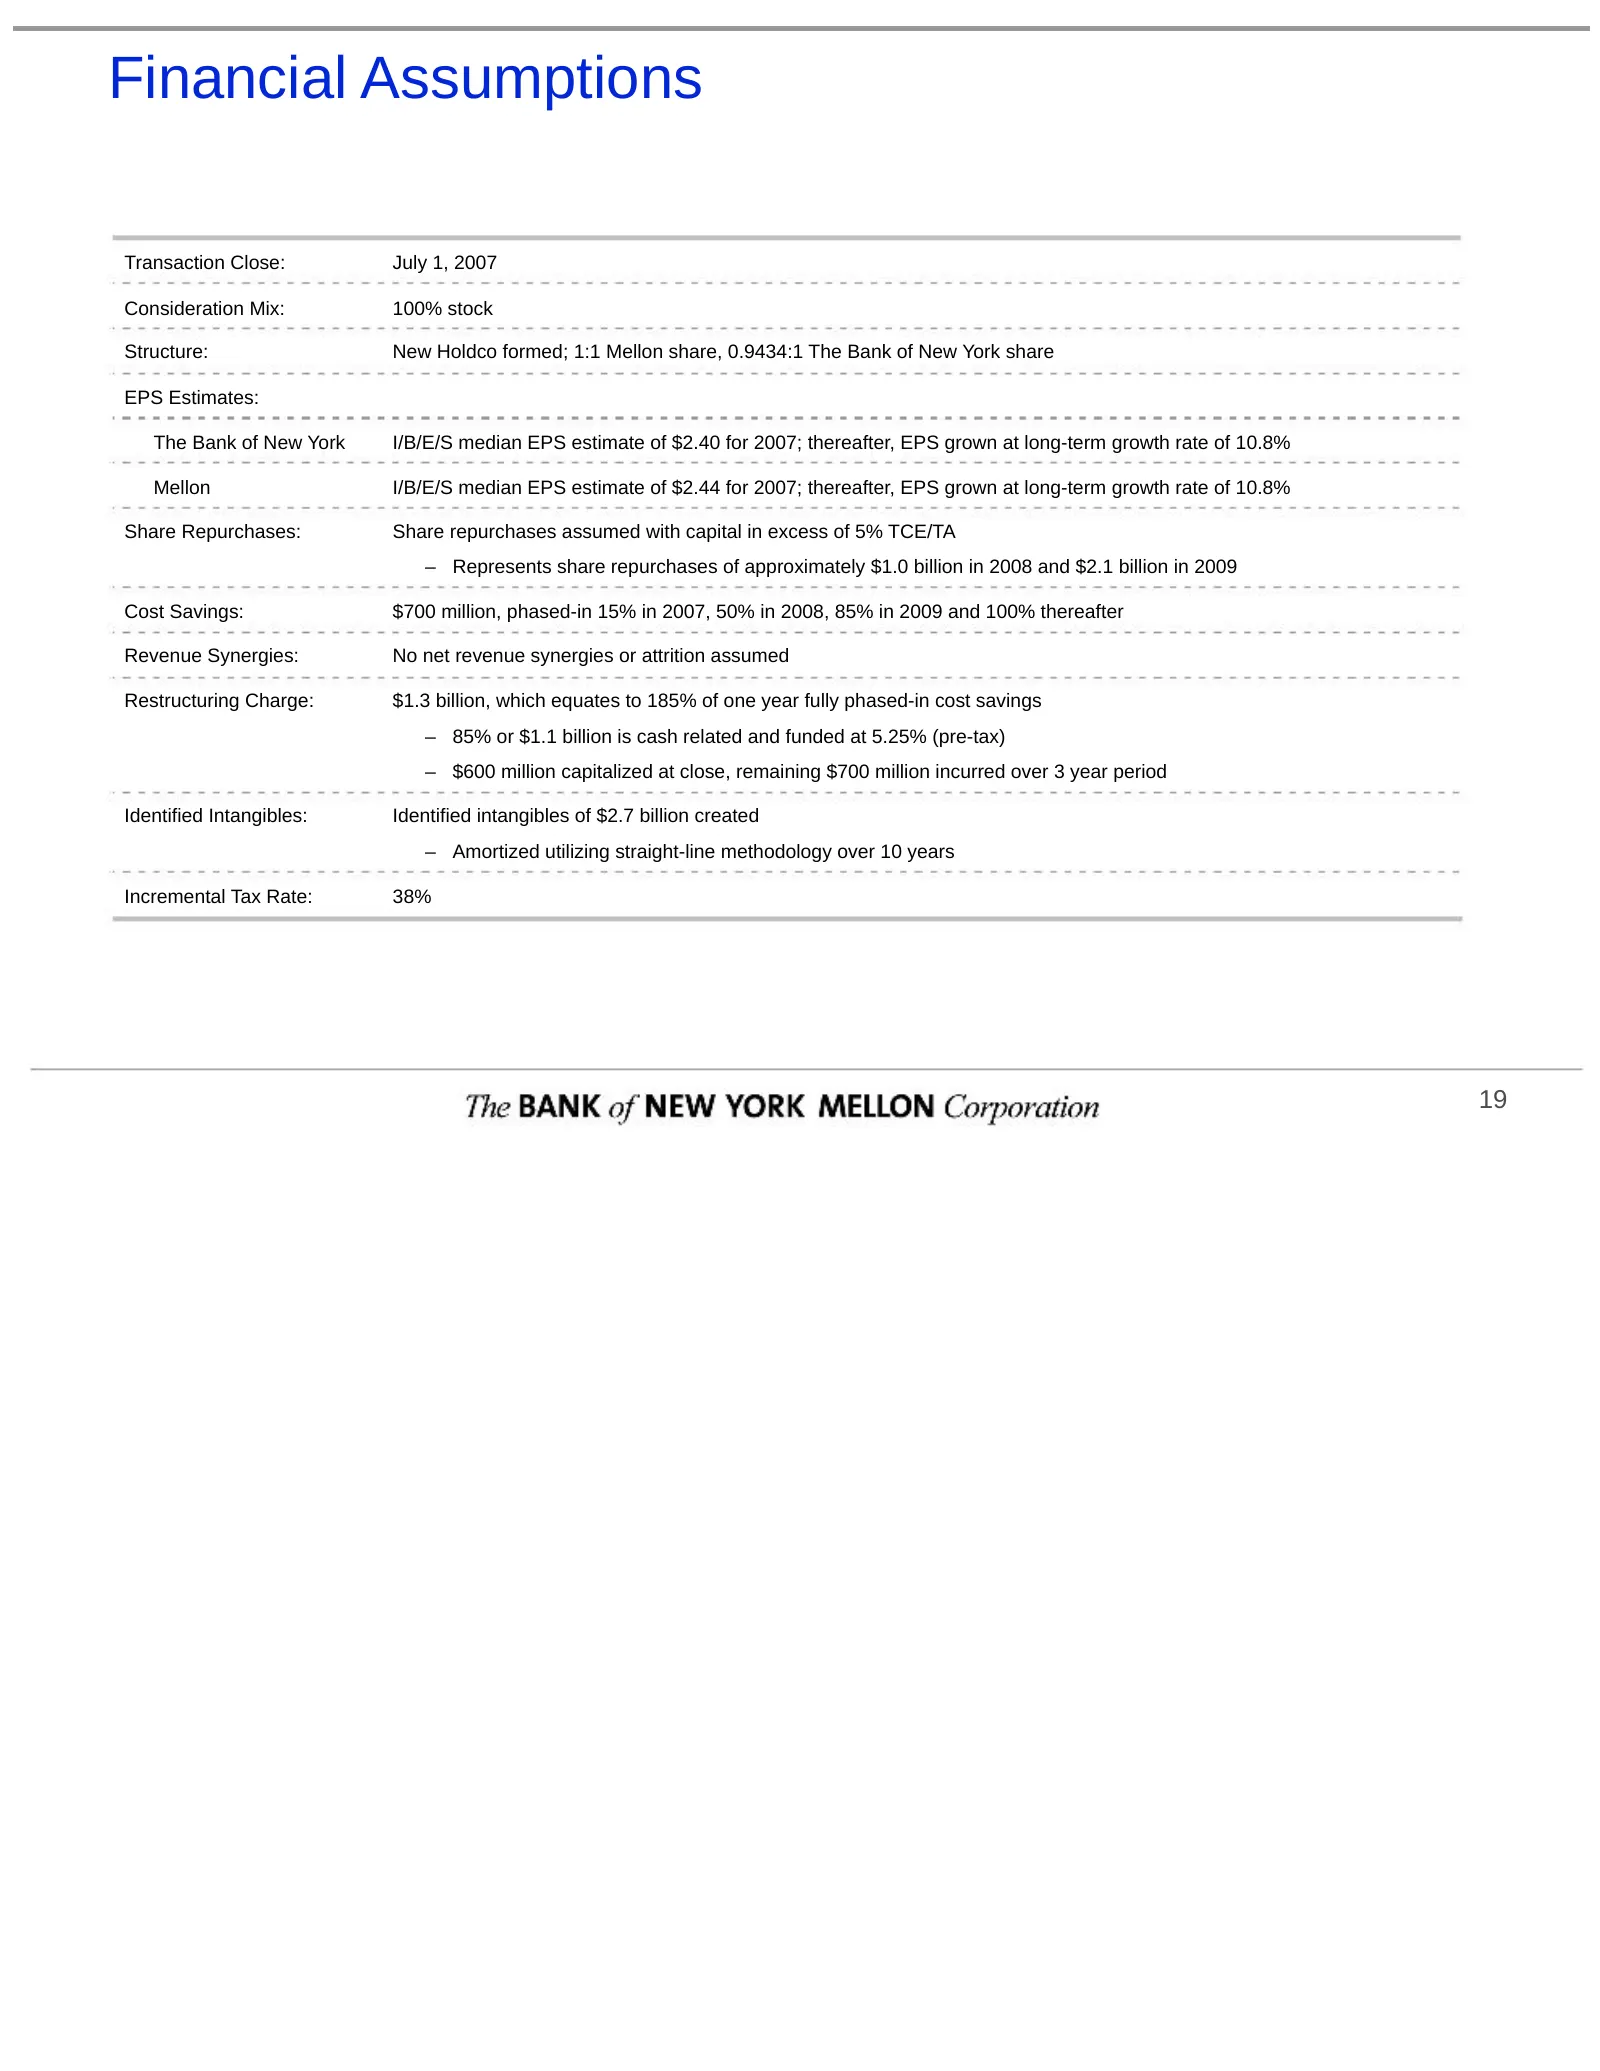
Financial Assumptions Transaction Close: July 1, 2007 Consideration Mix: 100% stock Structure: New Holdco formed; 1:1 Mellon share, 0.9434:1 The Bank of New York share EPS Estimates: The Bank of New York I/B/E/S median EPS estimate of $2.40 for 2007; thereafter, EPS grown at long-term growth rate of
Slide 22: Realistic, Deliverable Expense Synergies
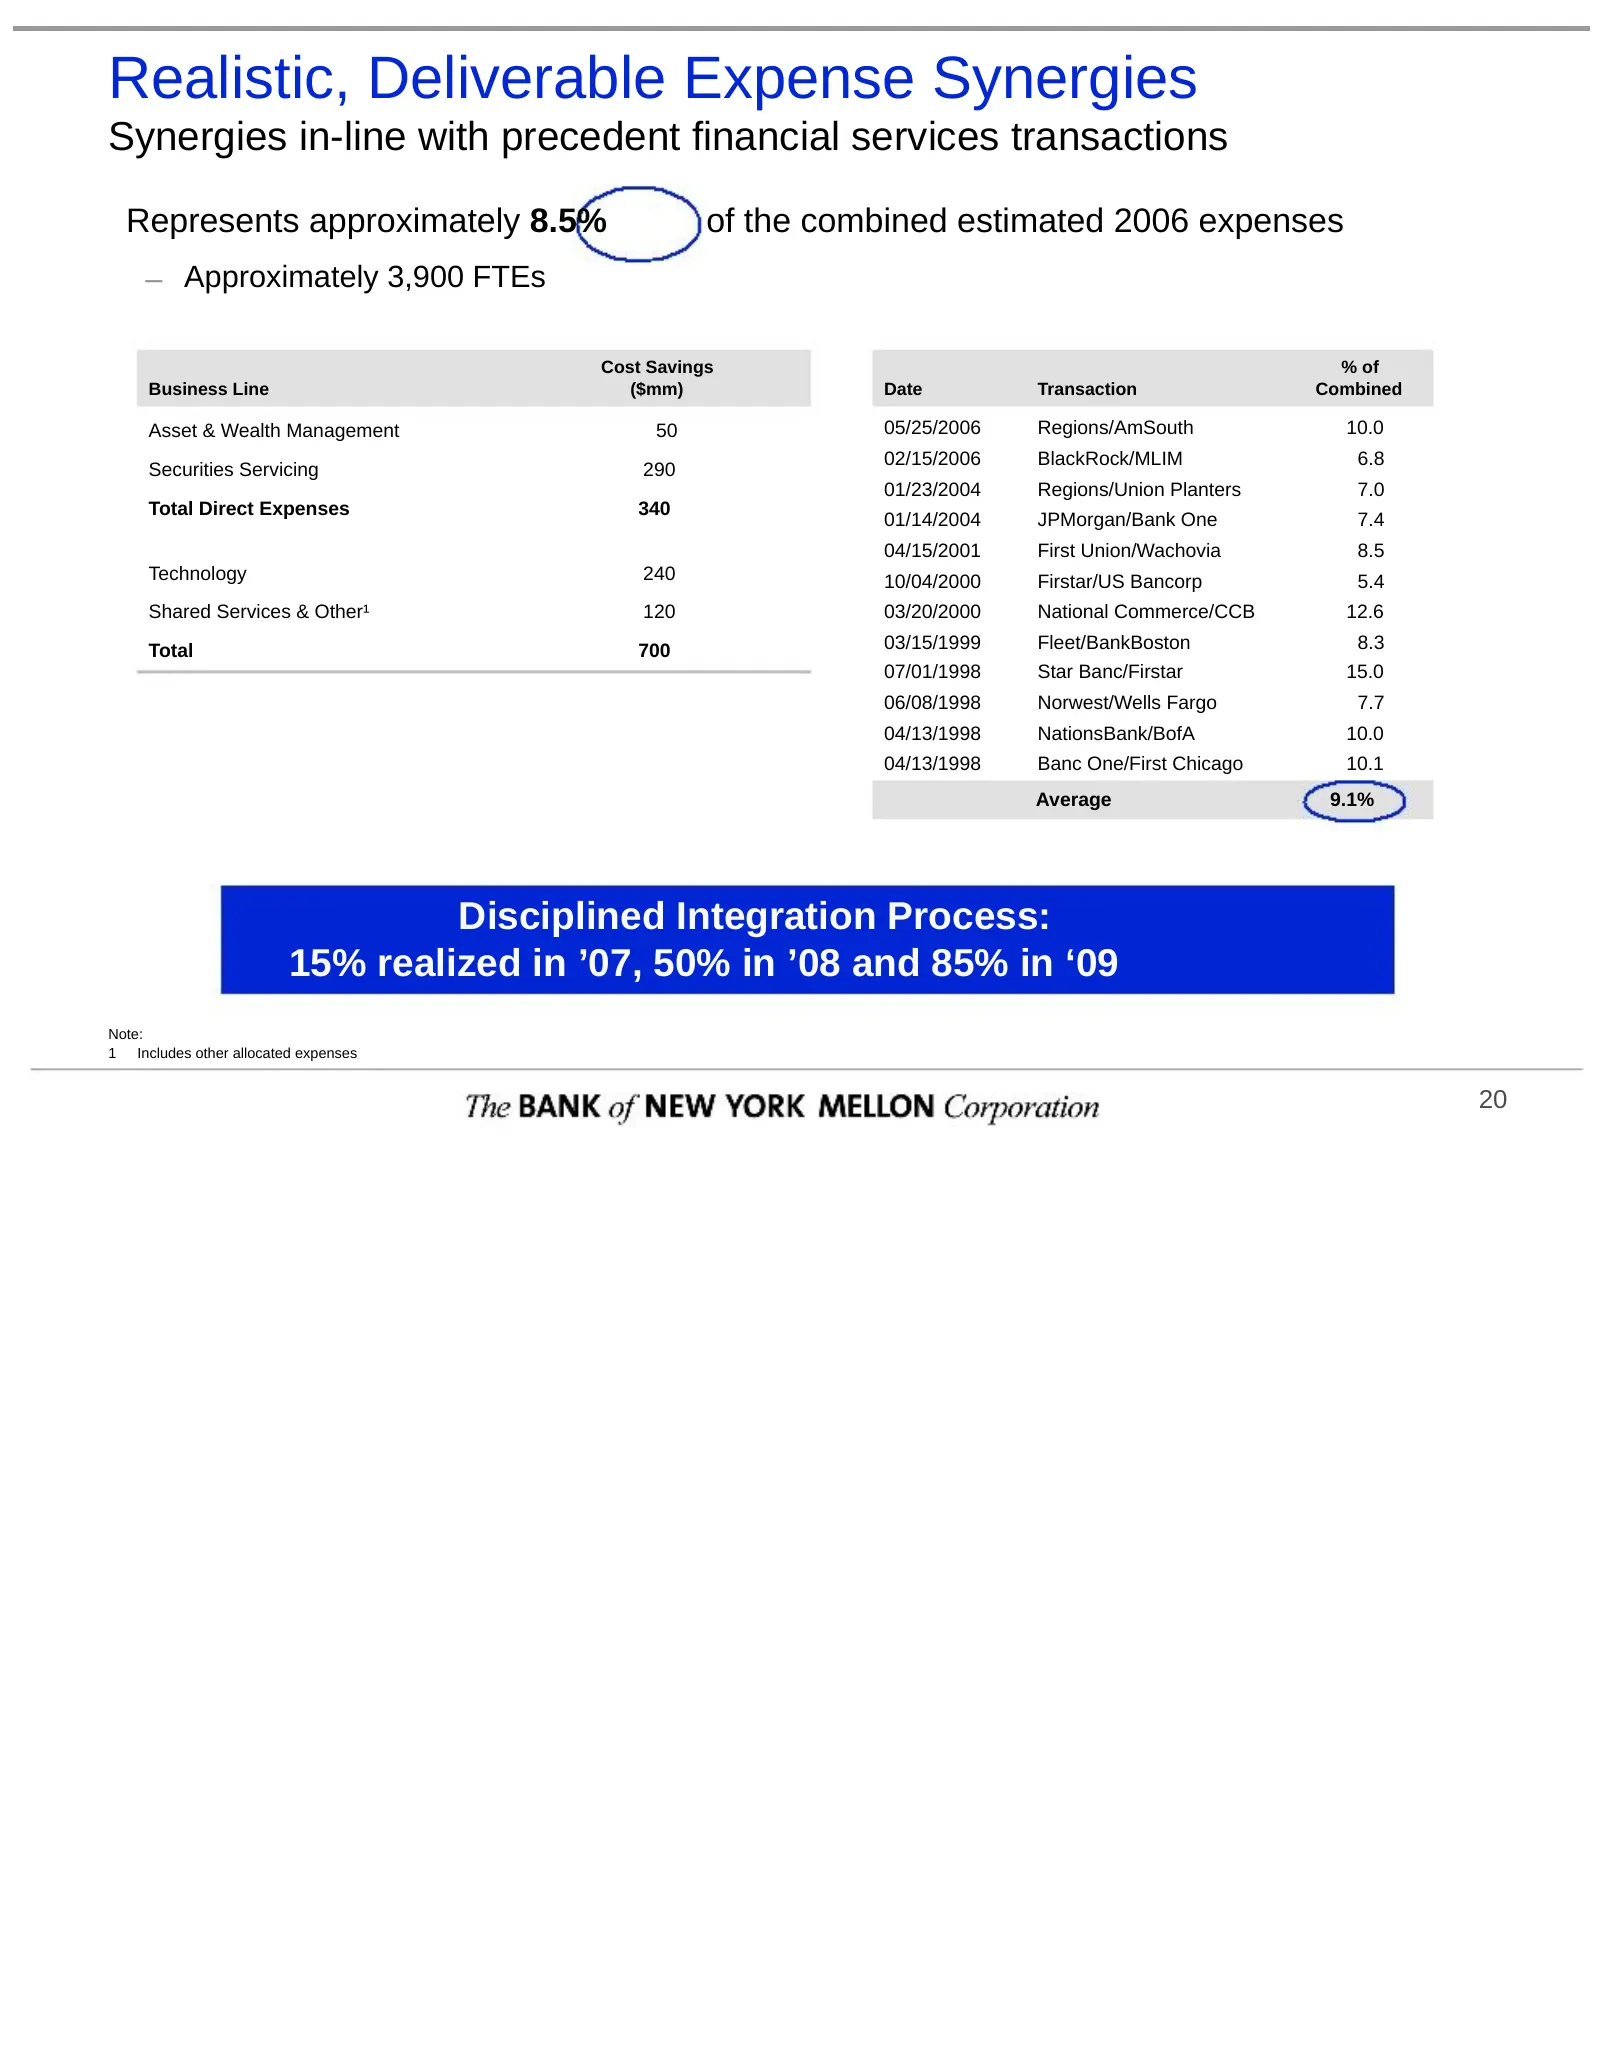
Realistic, Deliverable Expense Synergies Synergies in-line with precedent financial services transactions Represents approximately 8.5% of the combined estimated 2006 expenses – Approximately 3,900 FTEs Cost Savings % of Business Line ($mm) Date Transaction Combined Asset & Wealth Management 50 05/2
Slide 23: Merger Related Costs—$1.3 Billion Pre-tax
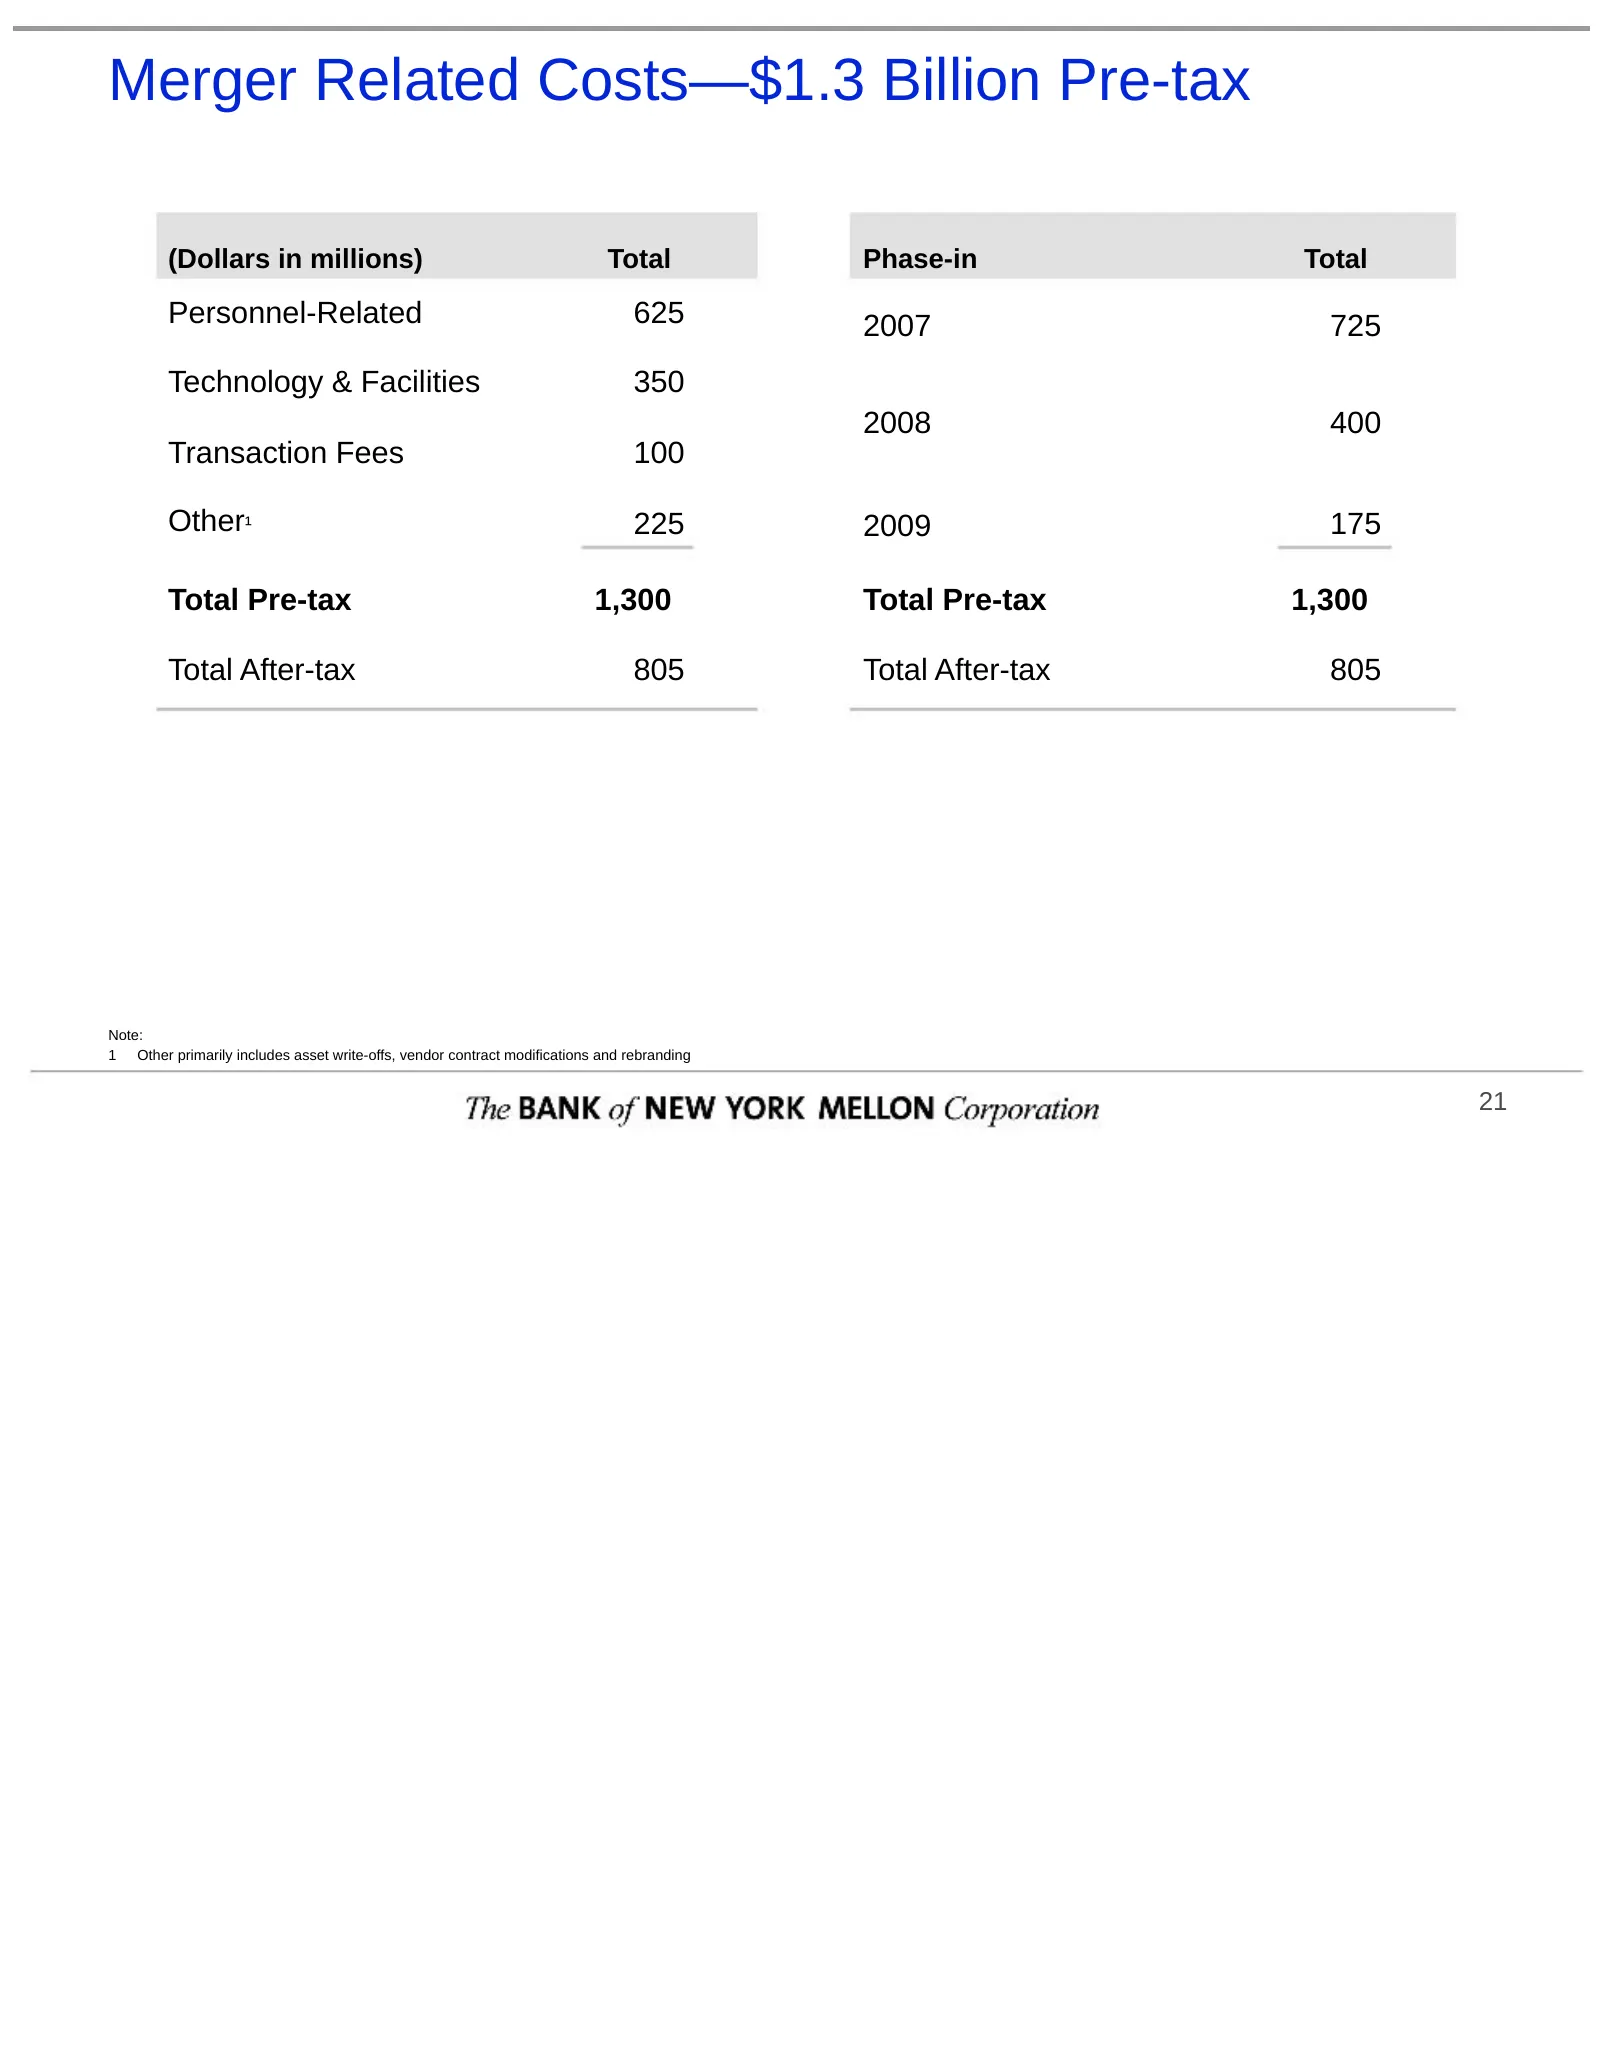
Merger Related Costs—$1.3 Billion Pre-tax (Dollars in millions) Total Phase-in Total Personnel-Related 625 2007 725 Technology & Facilities 350 2008 400 Transaction Fees 100 Other¹ 225 2009 175 Total Pre-tax 1,300 Total Pre-tax 1,300 Total After-tax 805 Total After-tax 805 Note: 1 Other primarily in
Slide 24: Pro Forma Impact—EPS
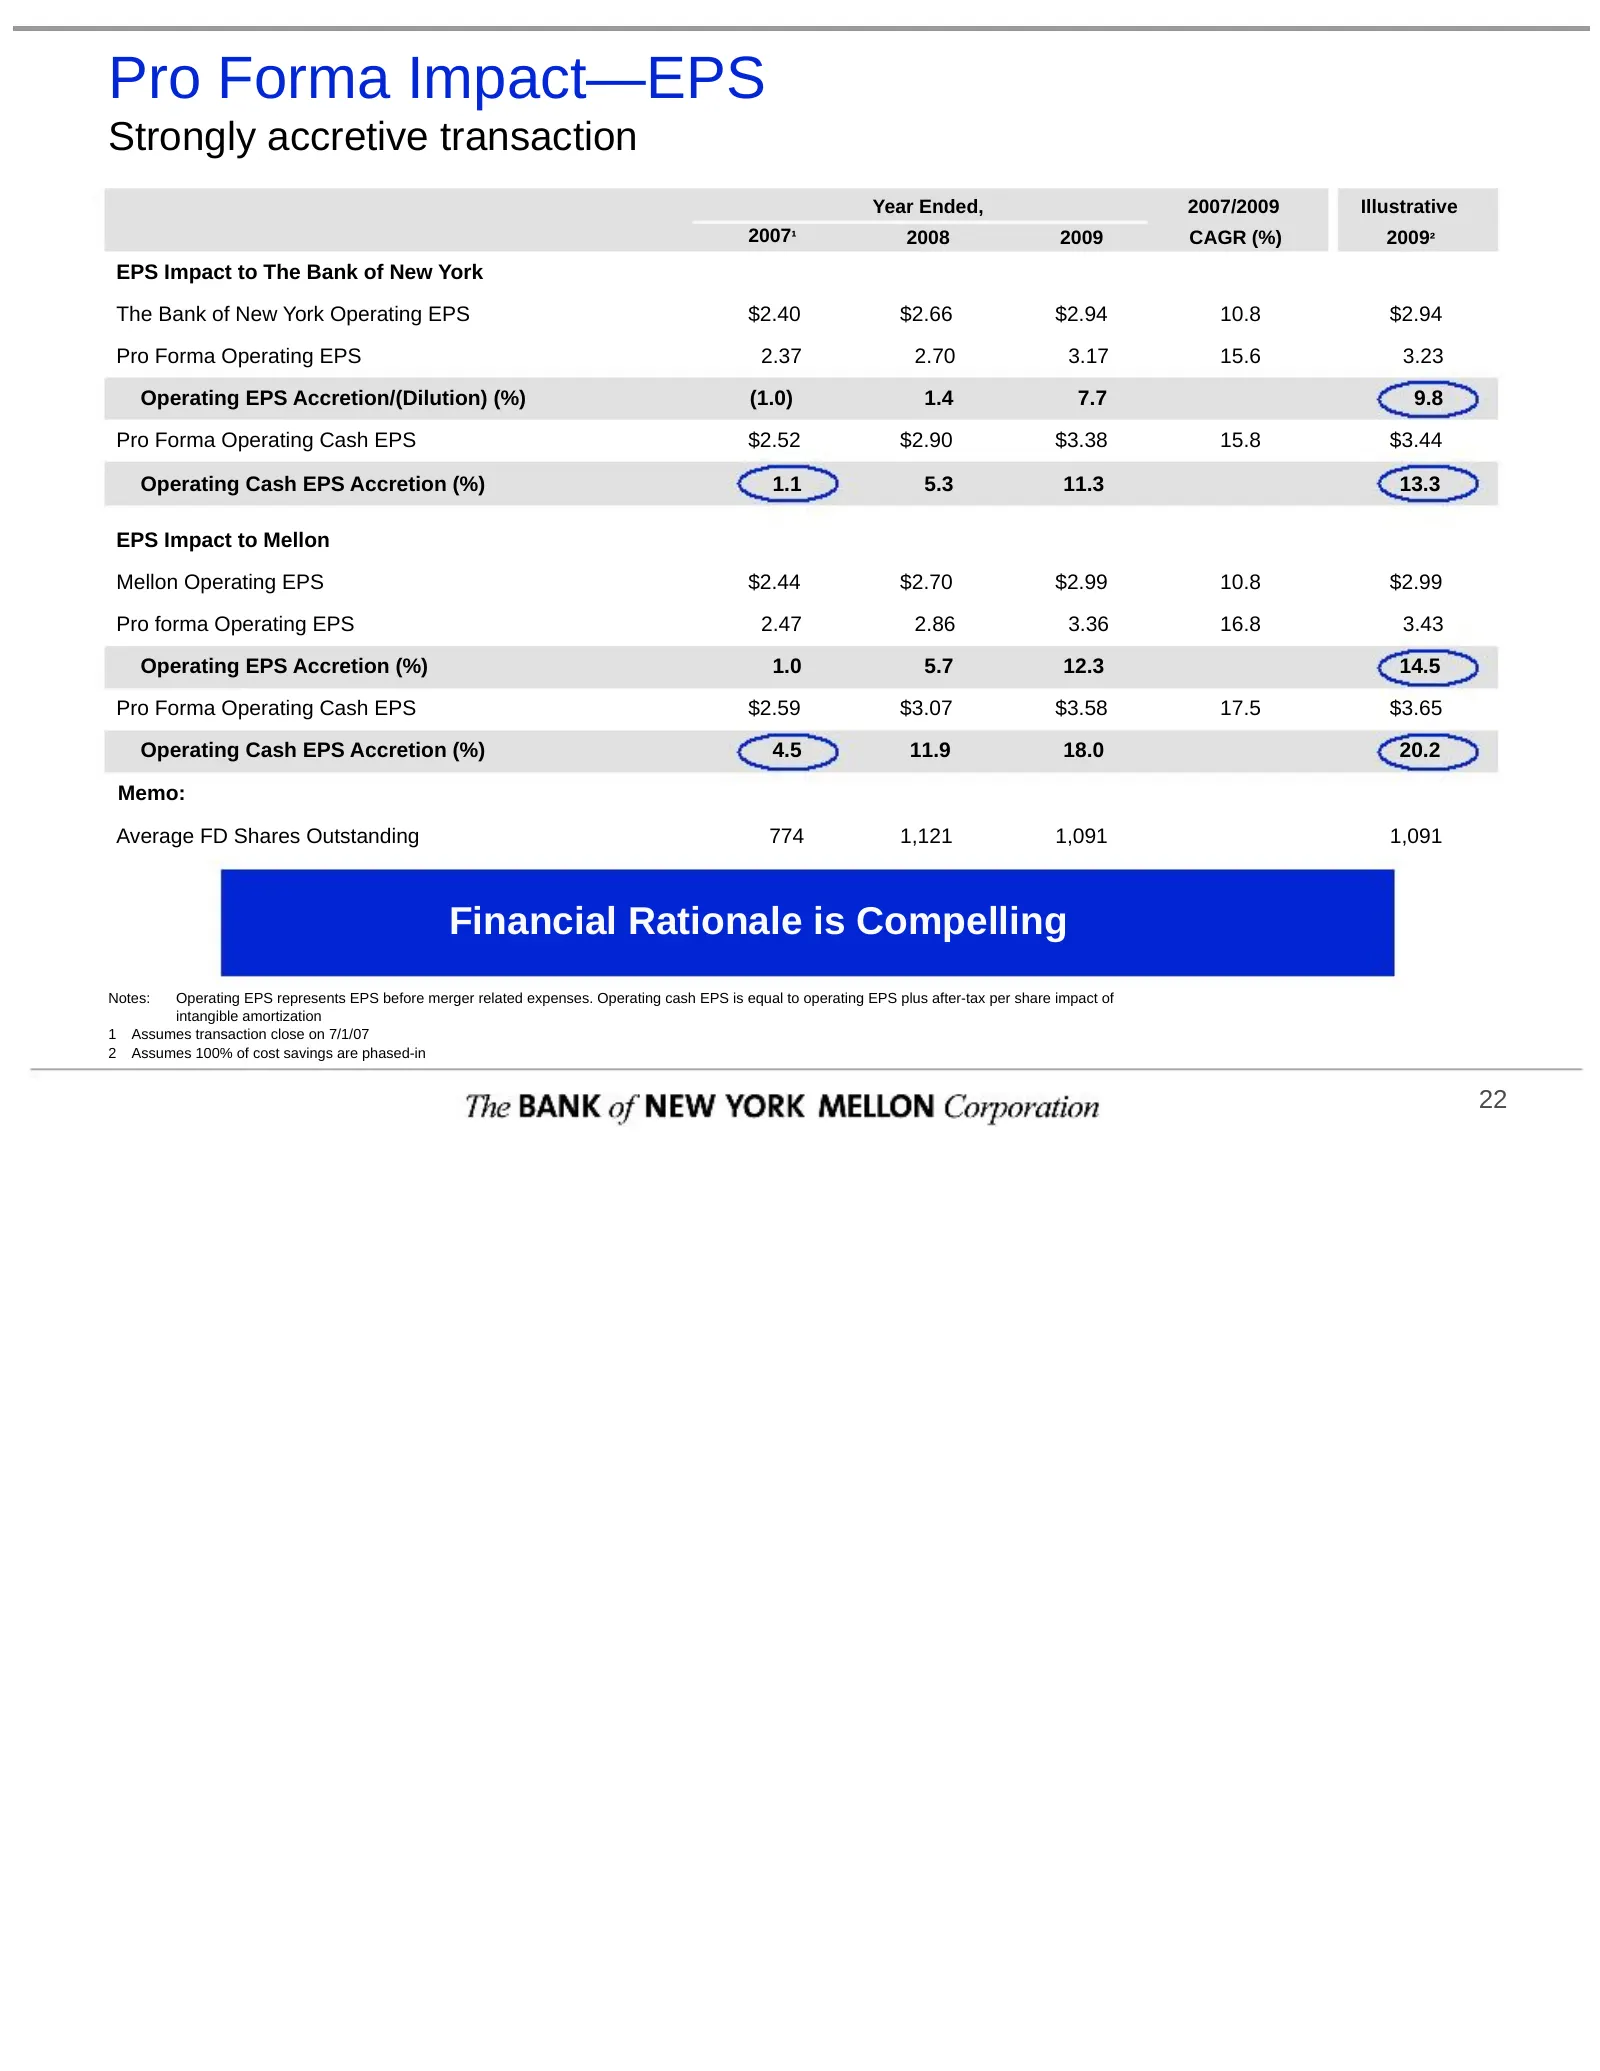
Pro Forma Impact—EPS Strongly accretive transaction Year Ended, 2007/2009 Illustrative 2007¹ 2008 2009 CAGR (%) 2009² EPS Impact to The Bank of New York The Bank of New York Operating EPS $2.40 $2.66 $2.94 10.8 $2.94 Pro Forma Operating EPS 2.37 2.70 3.17 15.6 3.23 Operating EPS Accretion/(Dilution)
Slide 25: Meaningful Revenue Synergy Opportunities
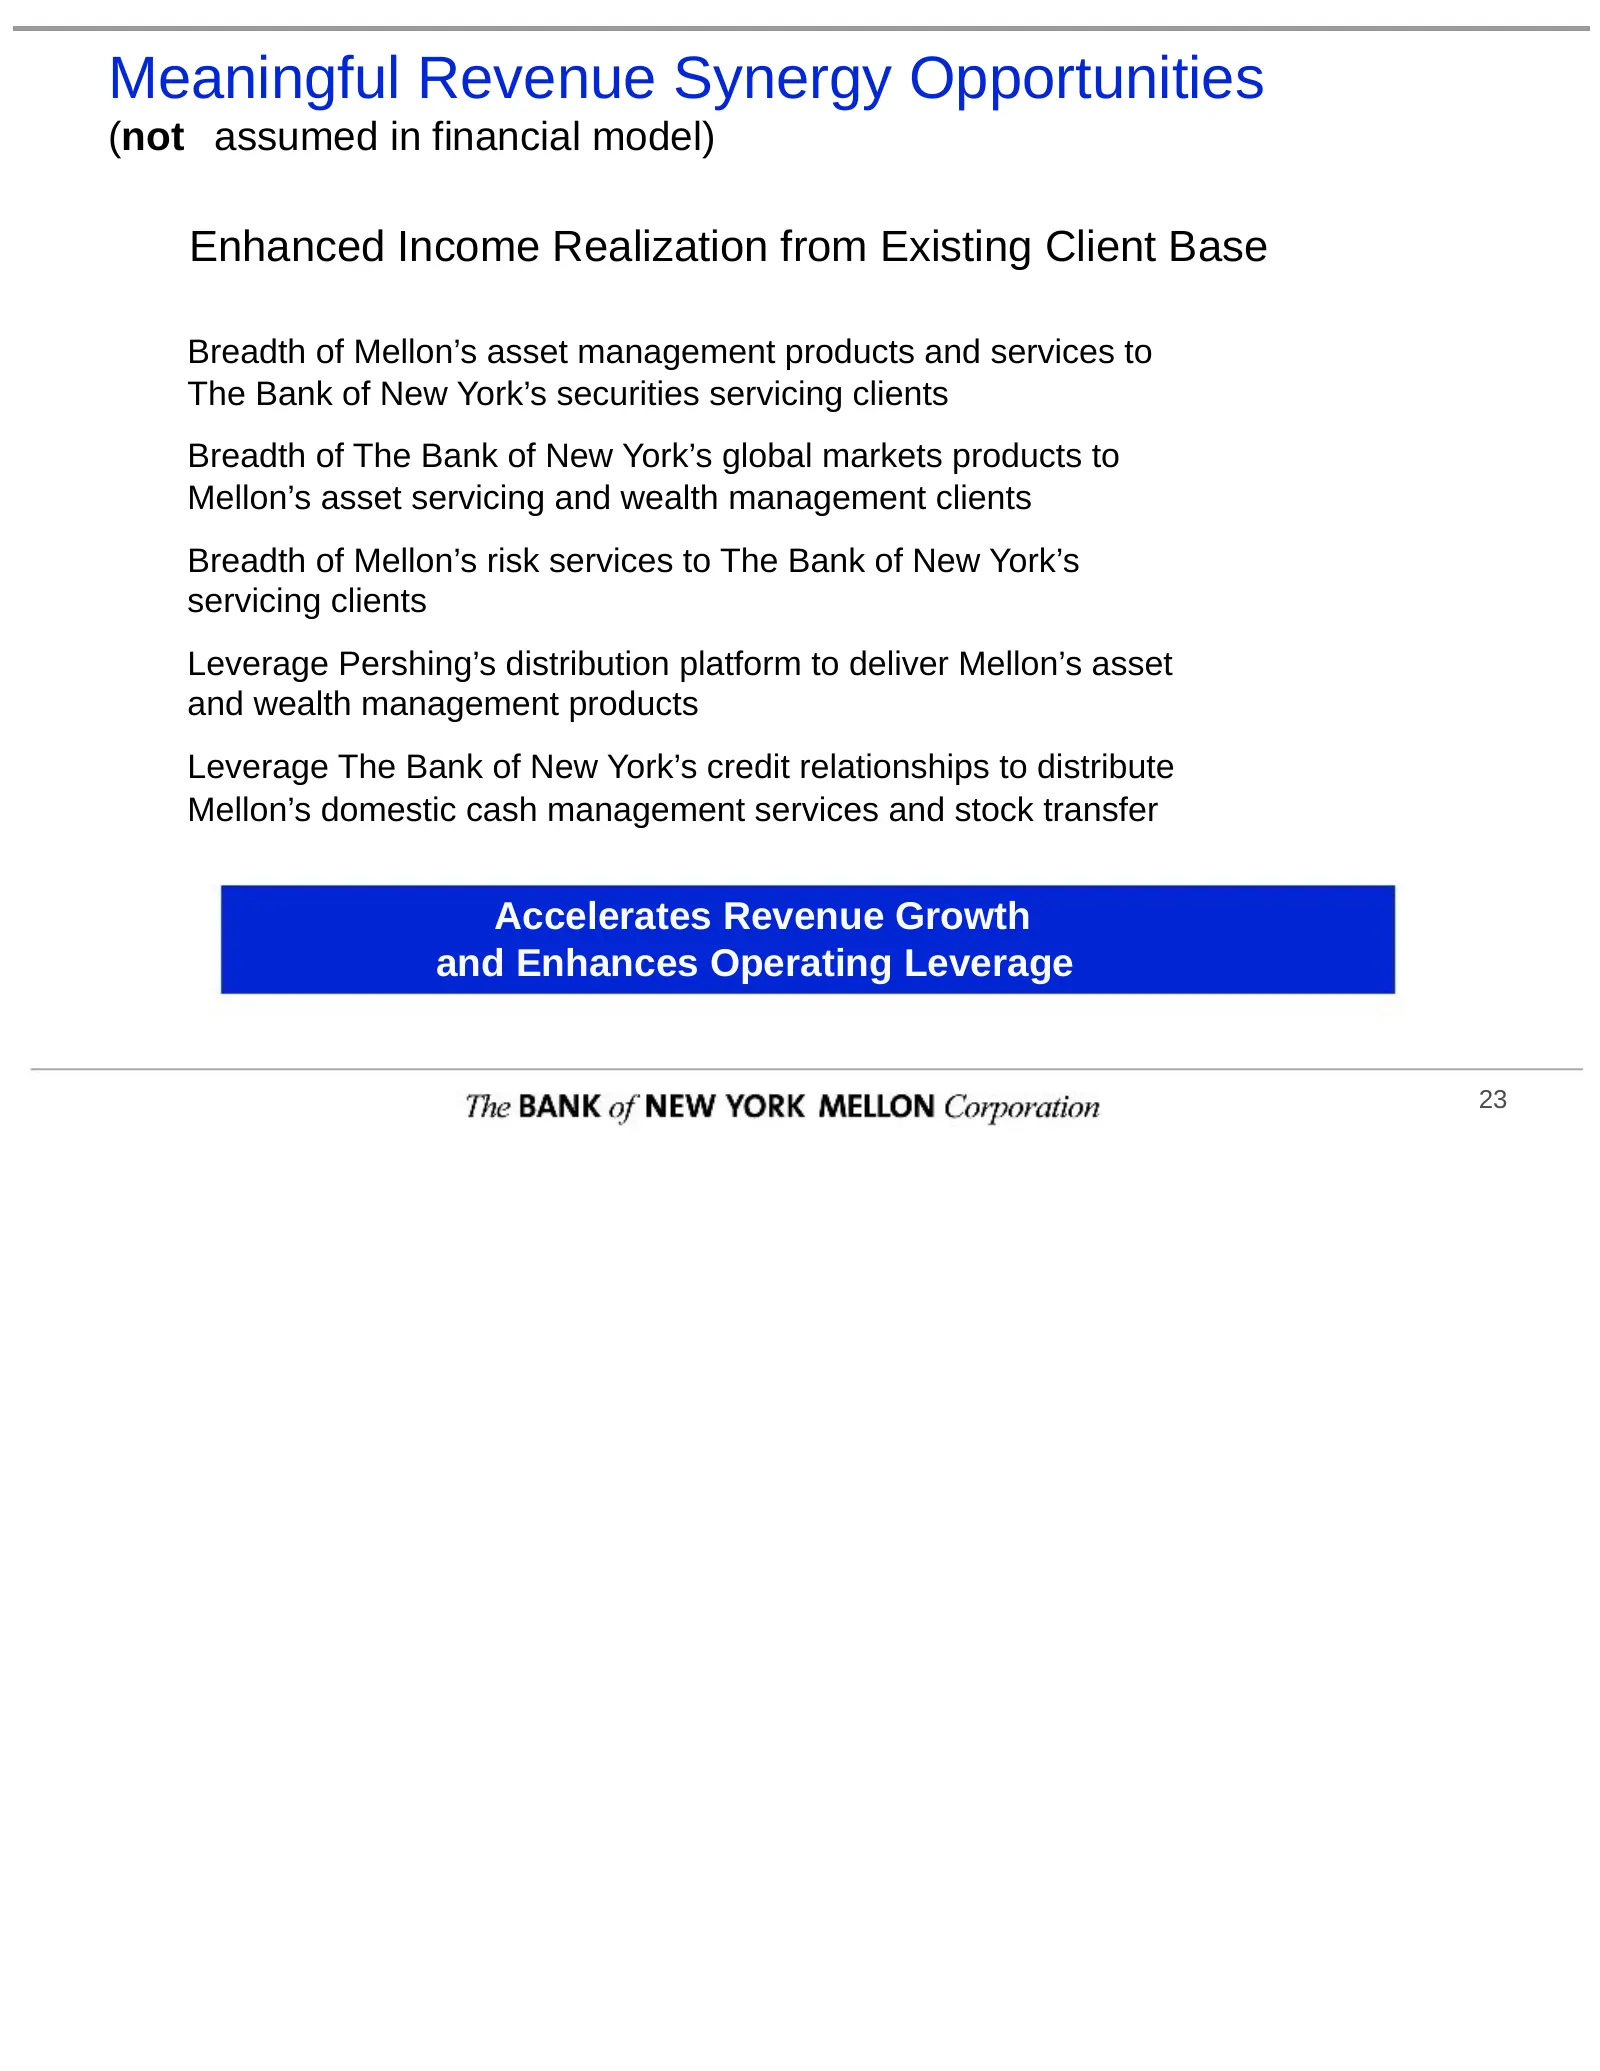
Meaningful Revenue Synergy Opportunities (not assumed in financial model) Enhanced Income Realization from Existing Client Base Breadth of Mellon’s asset management products and services to The Bank of New York’s securities servicing clients Breadth of The Bank of New York’s global markets products
Slide 26: The Bank of New York Mellon
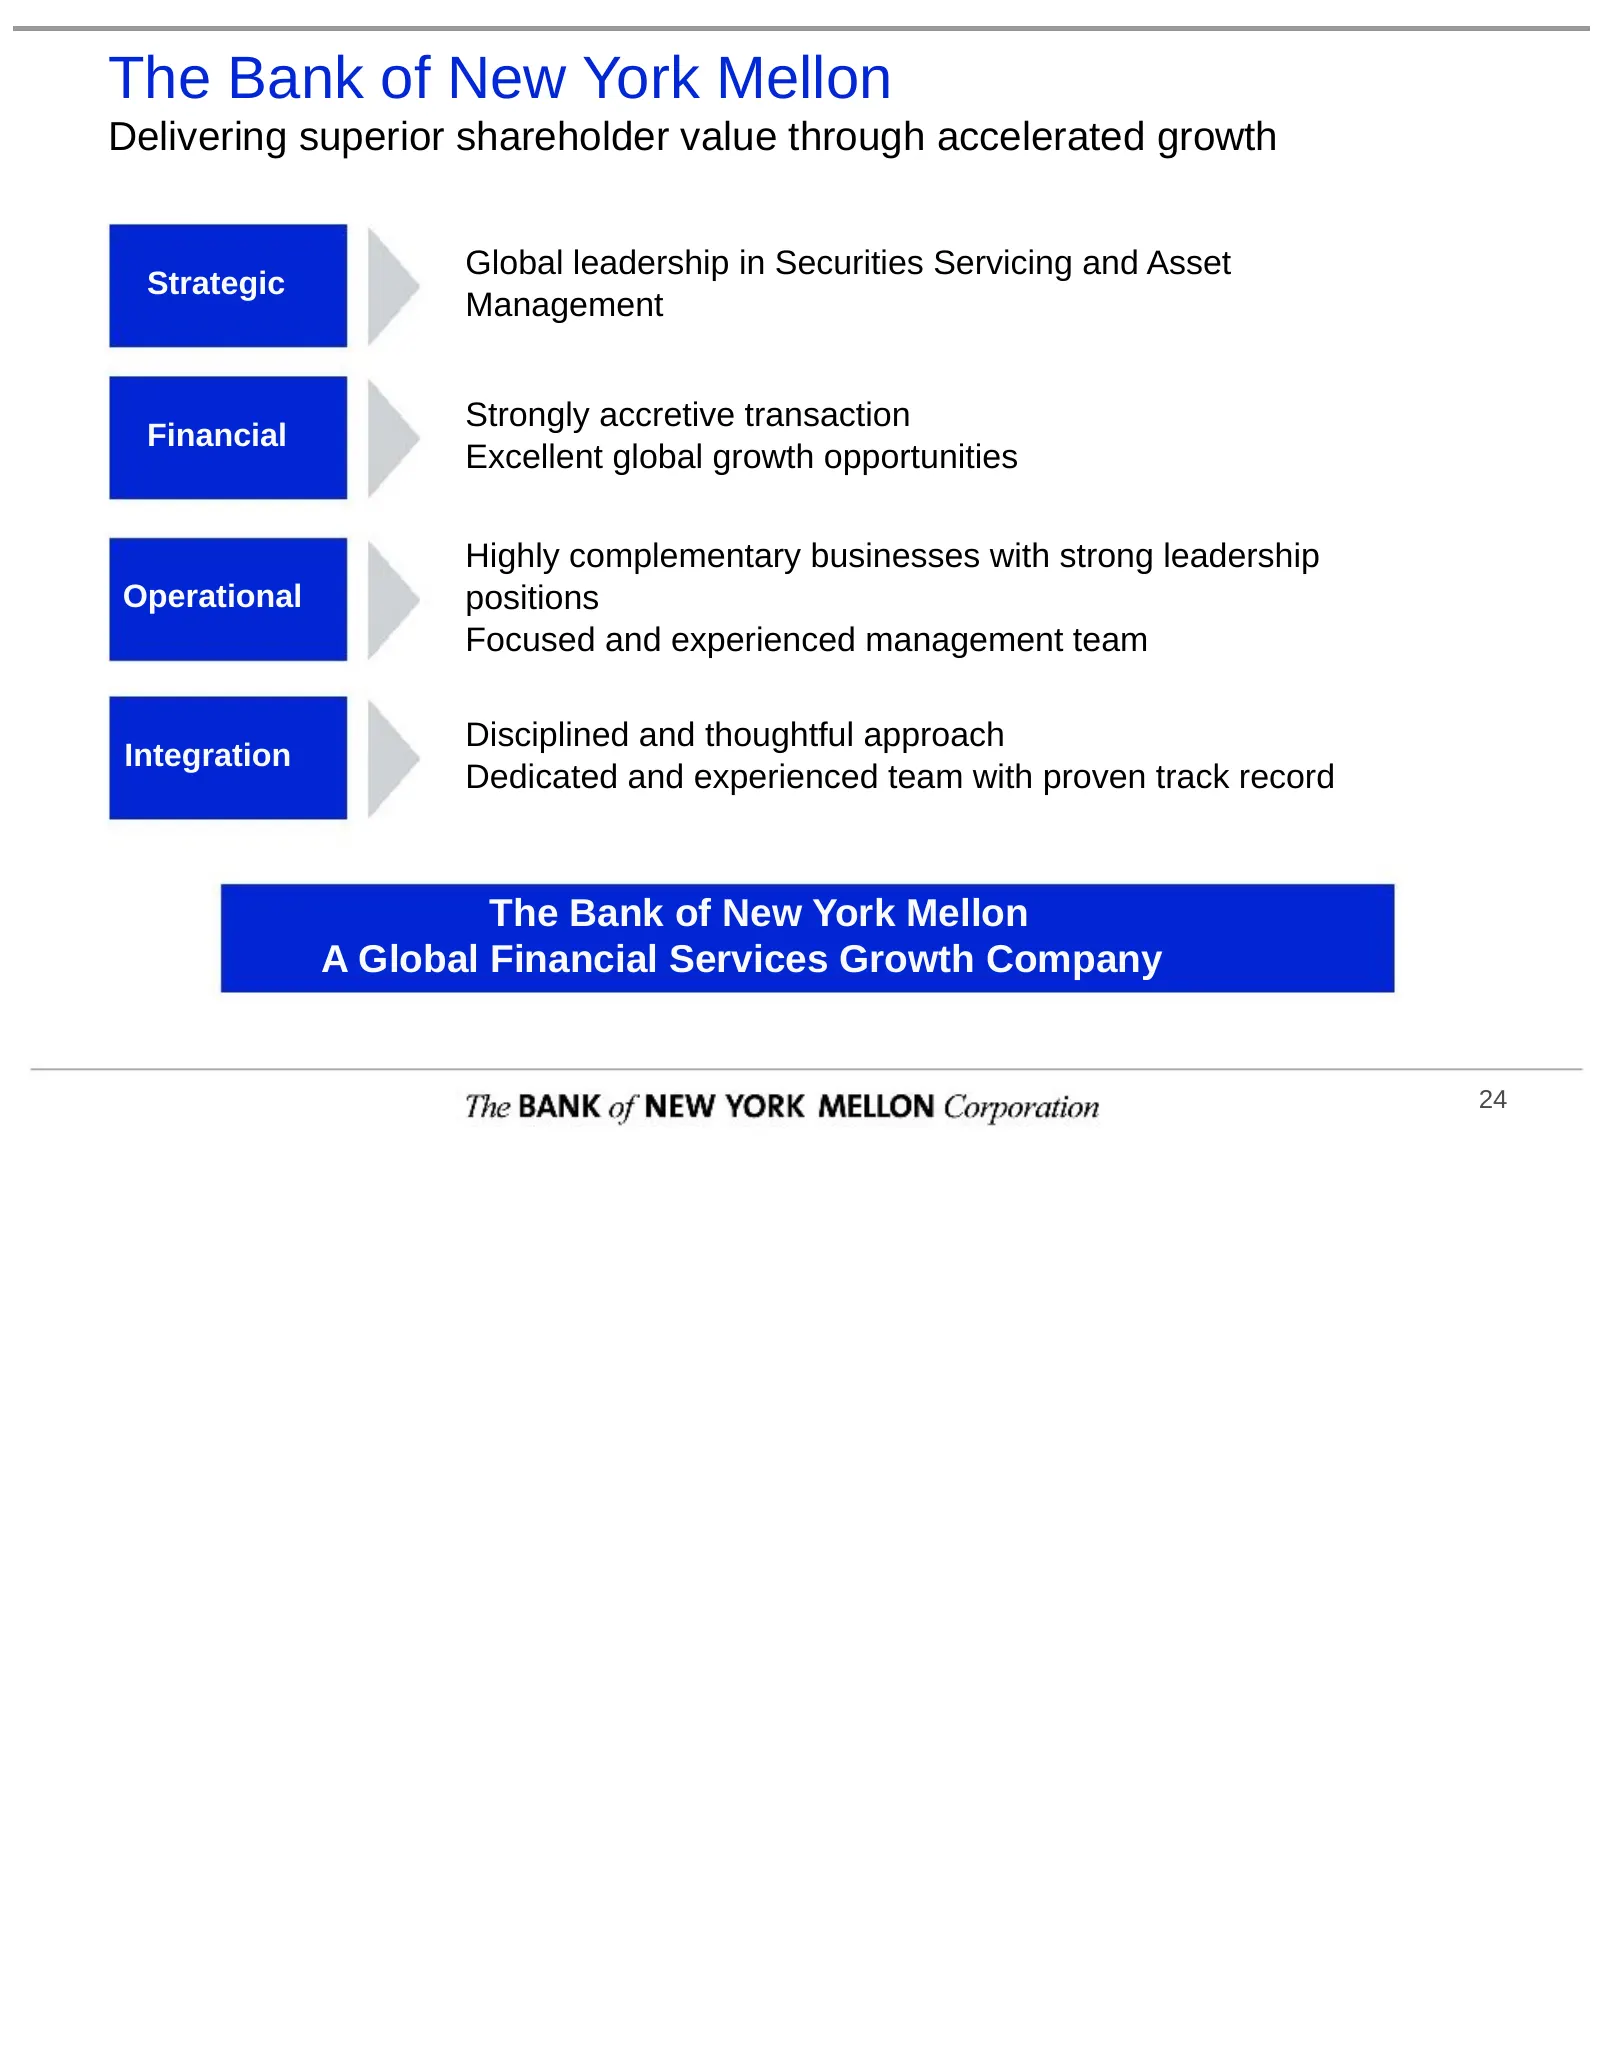
The Bank of New York Mellon Delivering superior shareholder value through accelerated growth Global leadership in Securities Servicing and Asset Strategic Management Strongly accretive transaction Financial Excellent global growth opportunities Highly complementary businesses with strong leadership

Slide 27: Appendix
Appendix The BANK of NEW YORK MELLON Corporation 25
Slide 28: Timeline
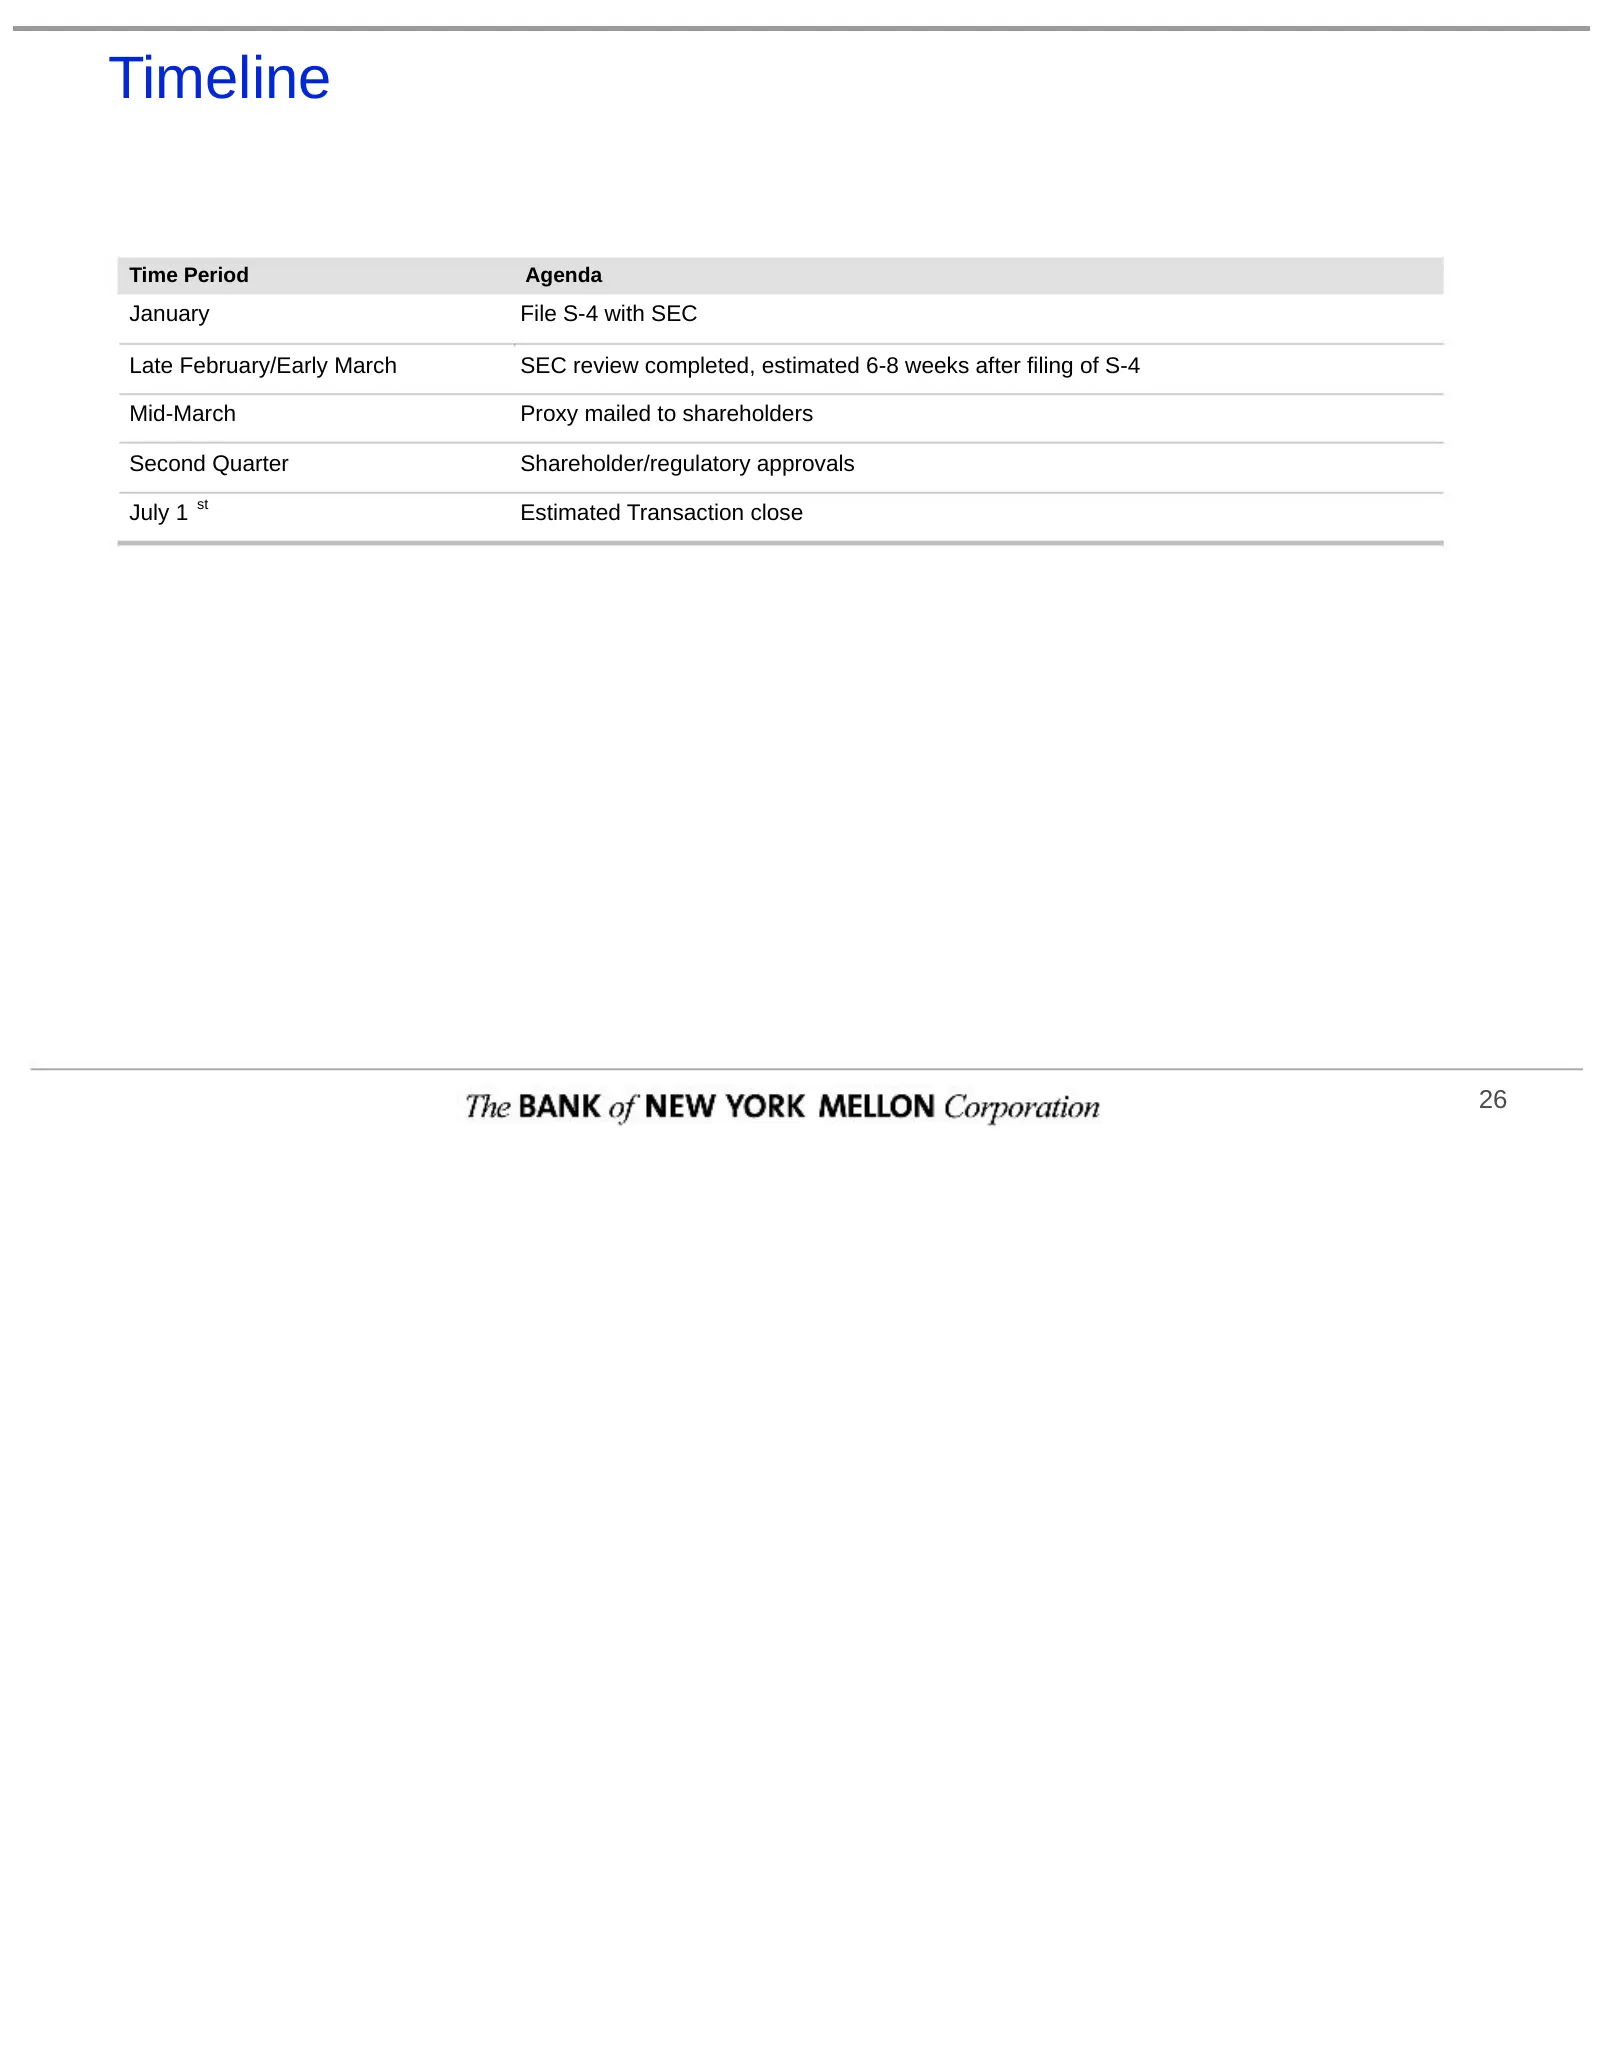
Timeline Time Period Agenda January File S-4 with SEC Late February/Early March SEC review completed, estimated 6-8 weeks after filing of S-4 Mid-March Proxy mailed to shareholders Second Quarter Shareholder/regulatory approvals st July 1 Estimated Transaction close 26
Slide 29: Combined Balance Sheet
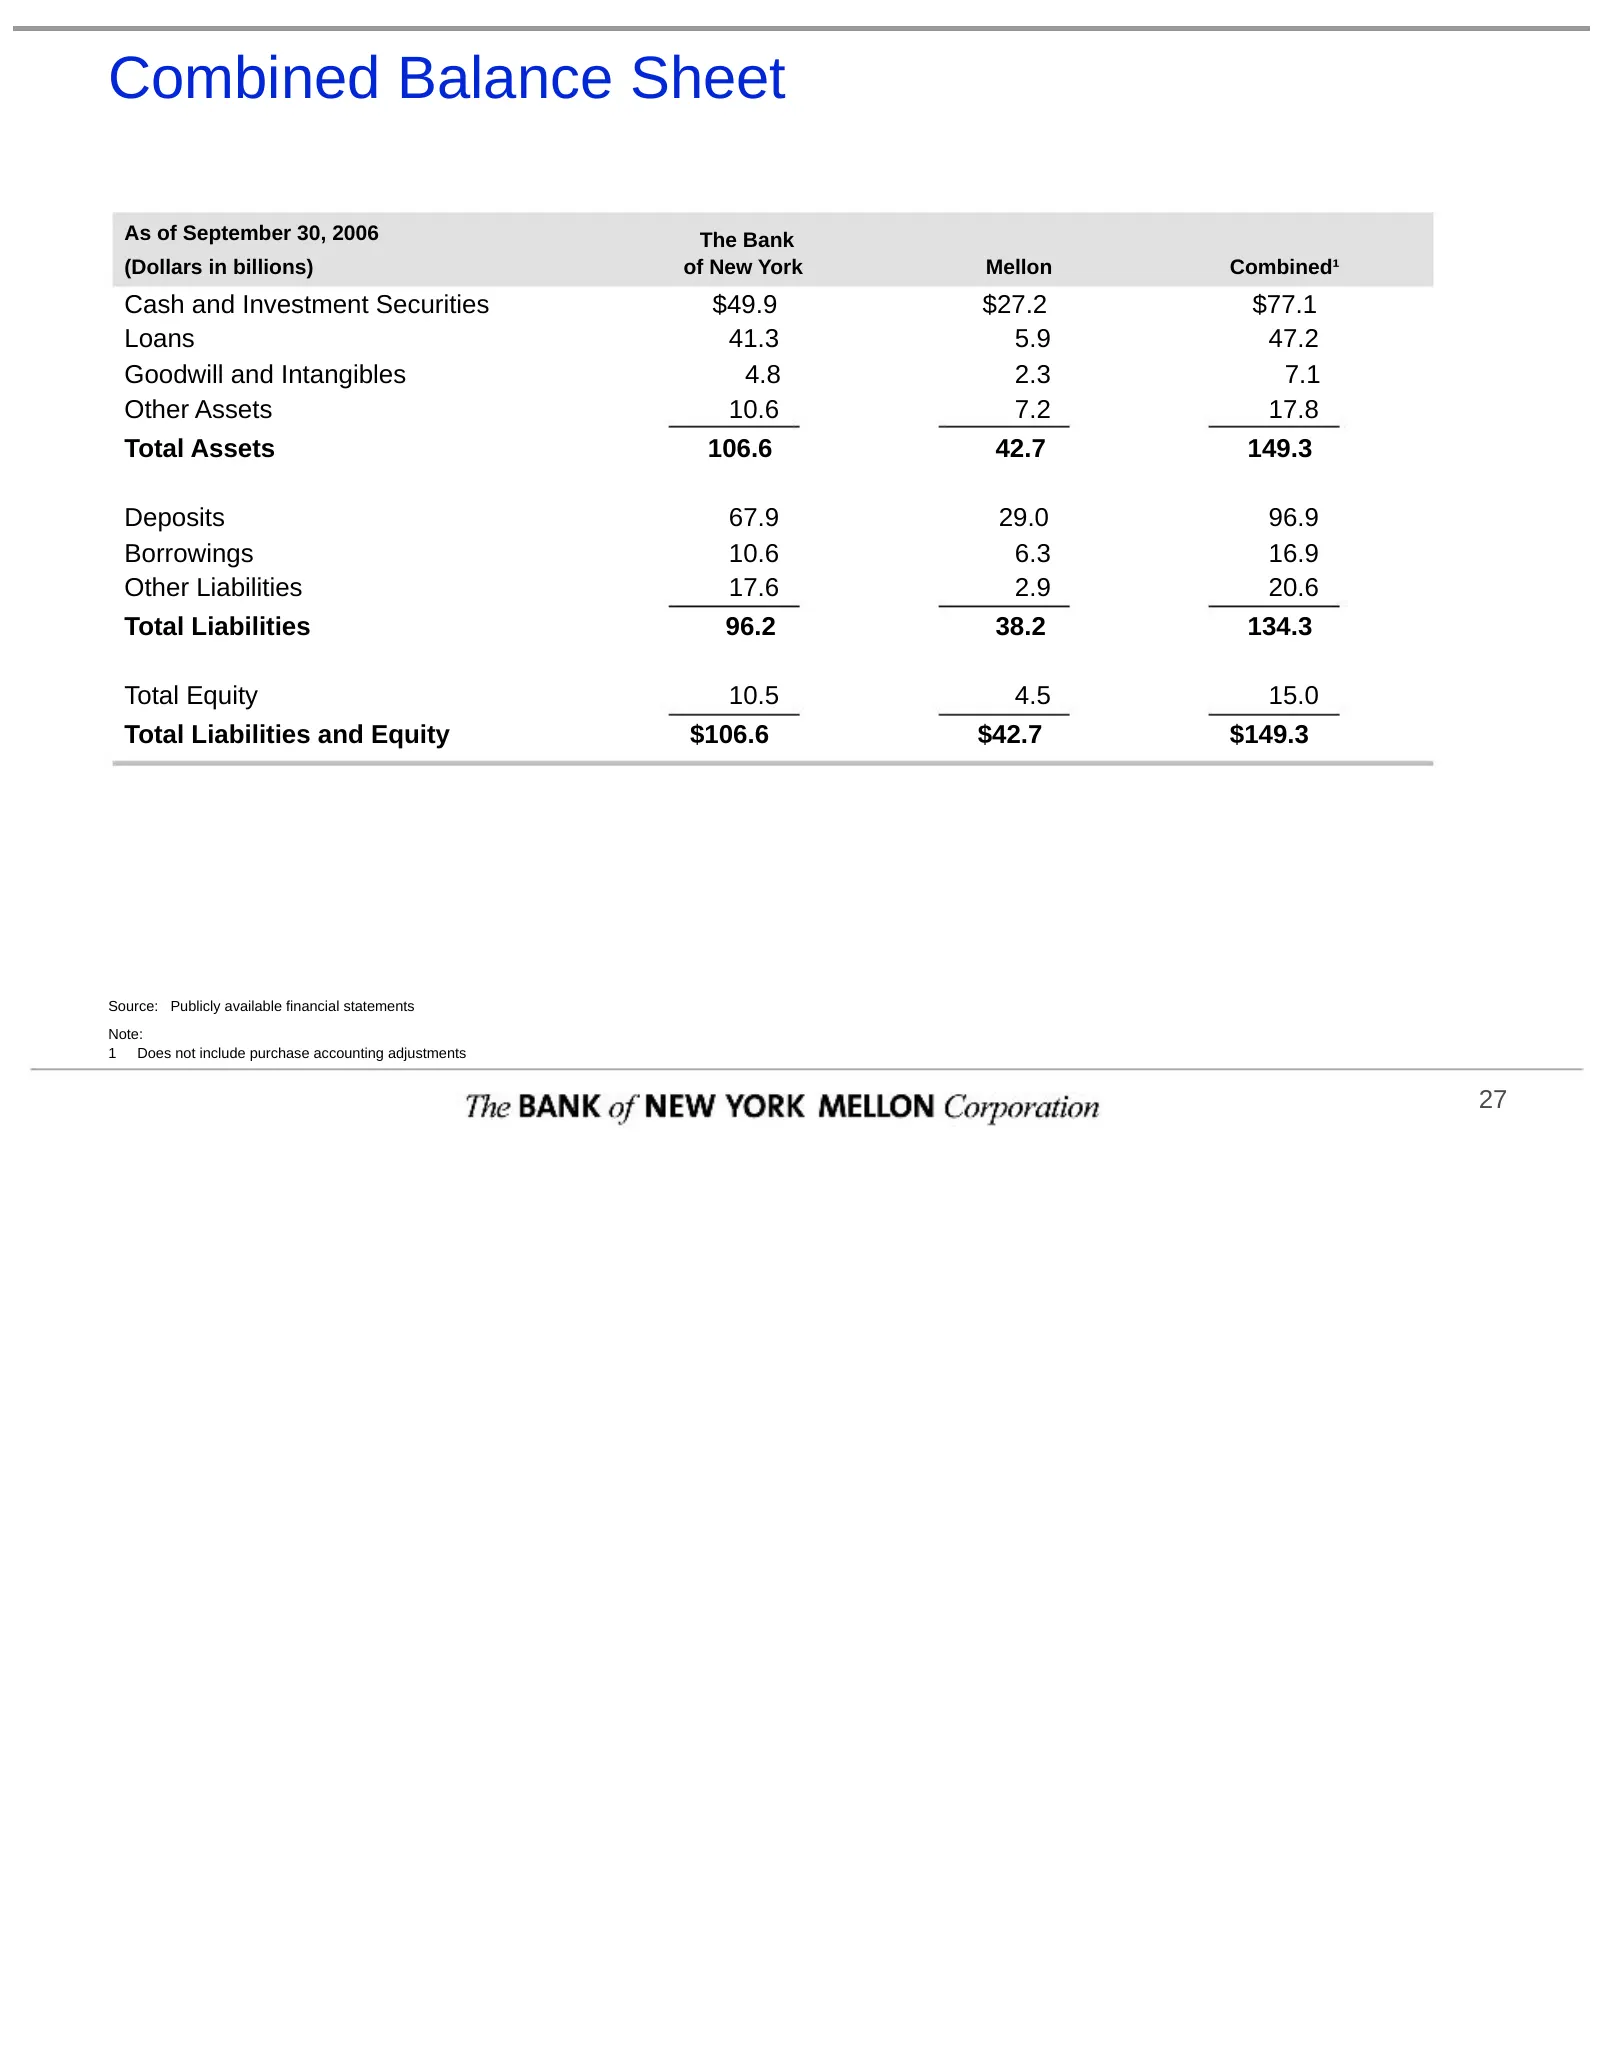
Combined Balance Sheet As of September 30, 2006 The Bank (Dollars in billions) of New York Mellon Combined¹ Cash and Investment Securities $49.9 $27.2 $77.1 Loans 41.3 5.9 47.2 Goodwill and Intangibles 4.8 2.3 7.1 Other Assets 10.6 7.2 17.8 Total Assets 106.6 42.7 149.3 Deposits 67.9 29.0 96.9 Borro
Slide 30: Pro Forma Income Statement
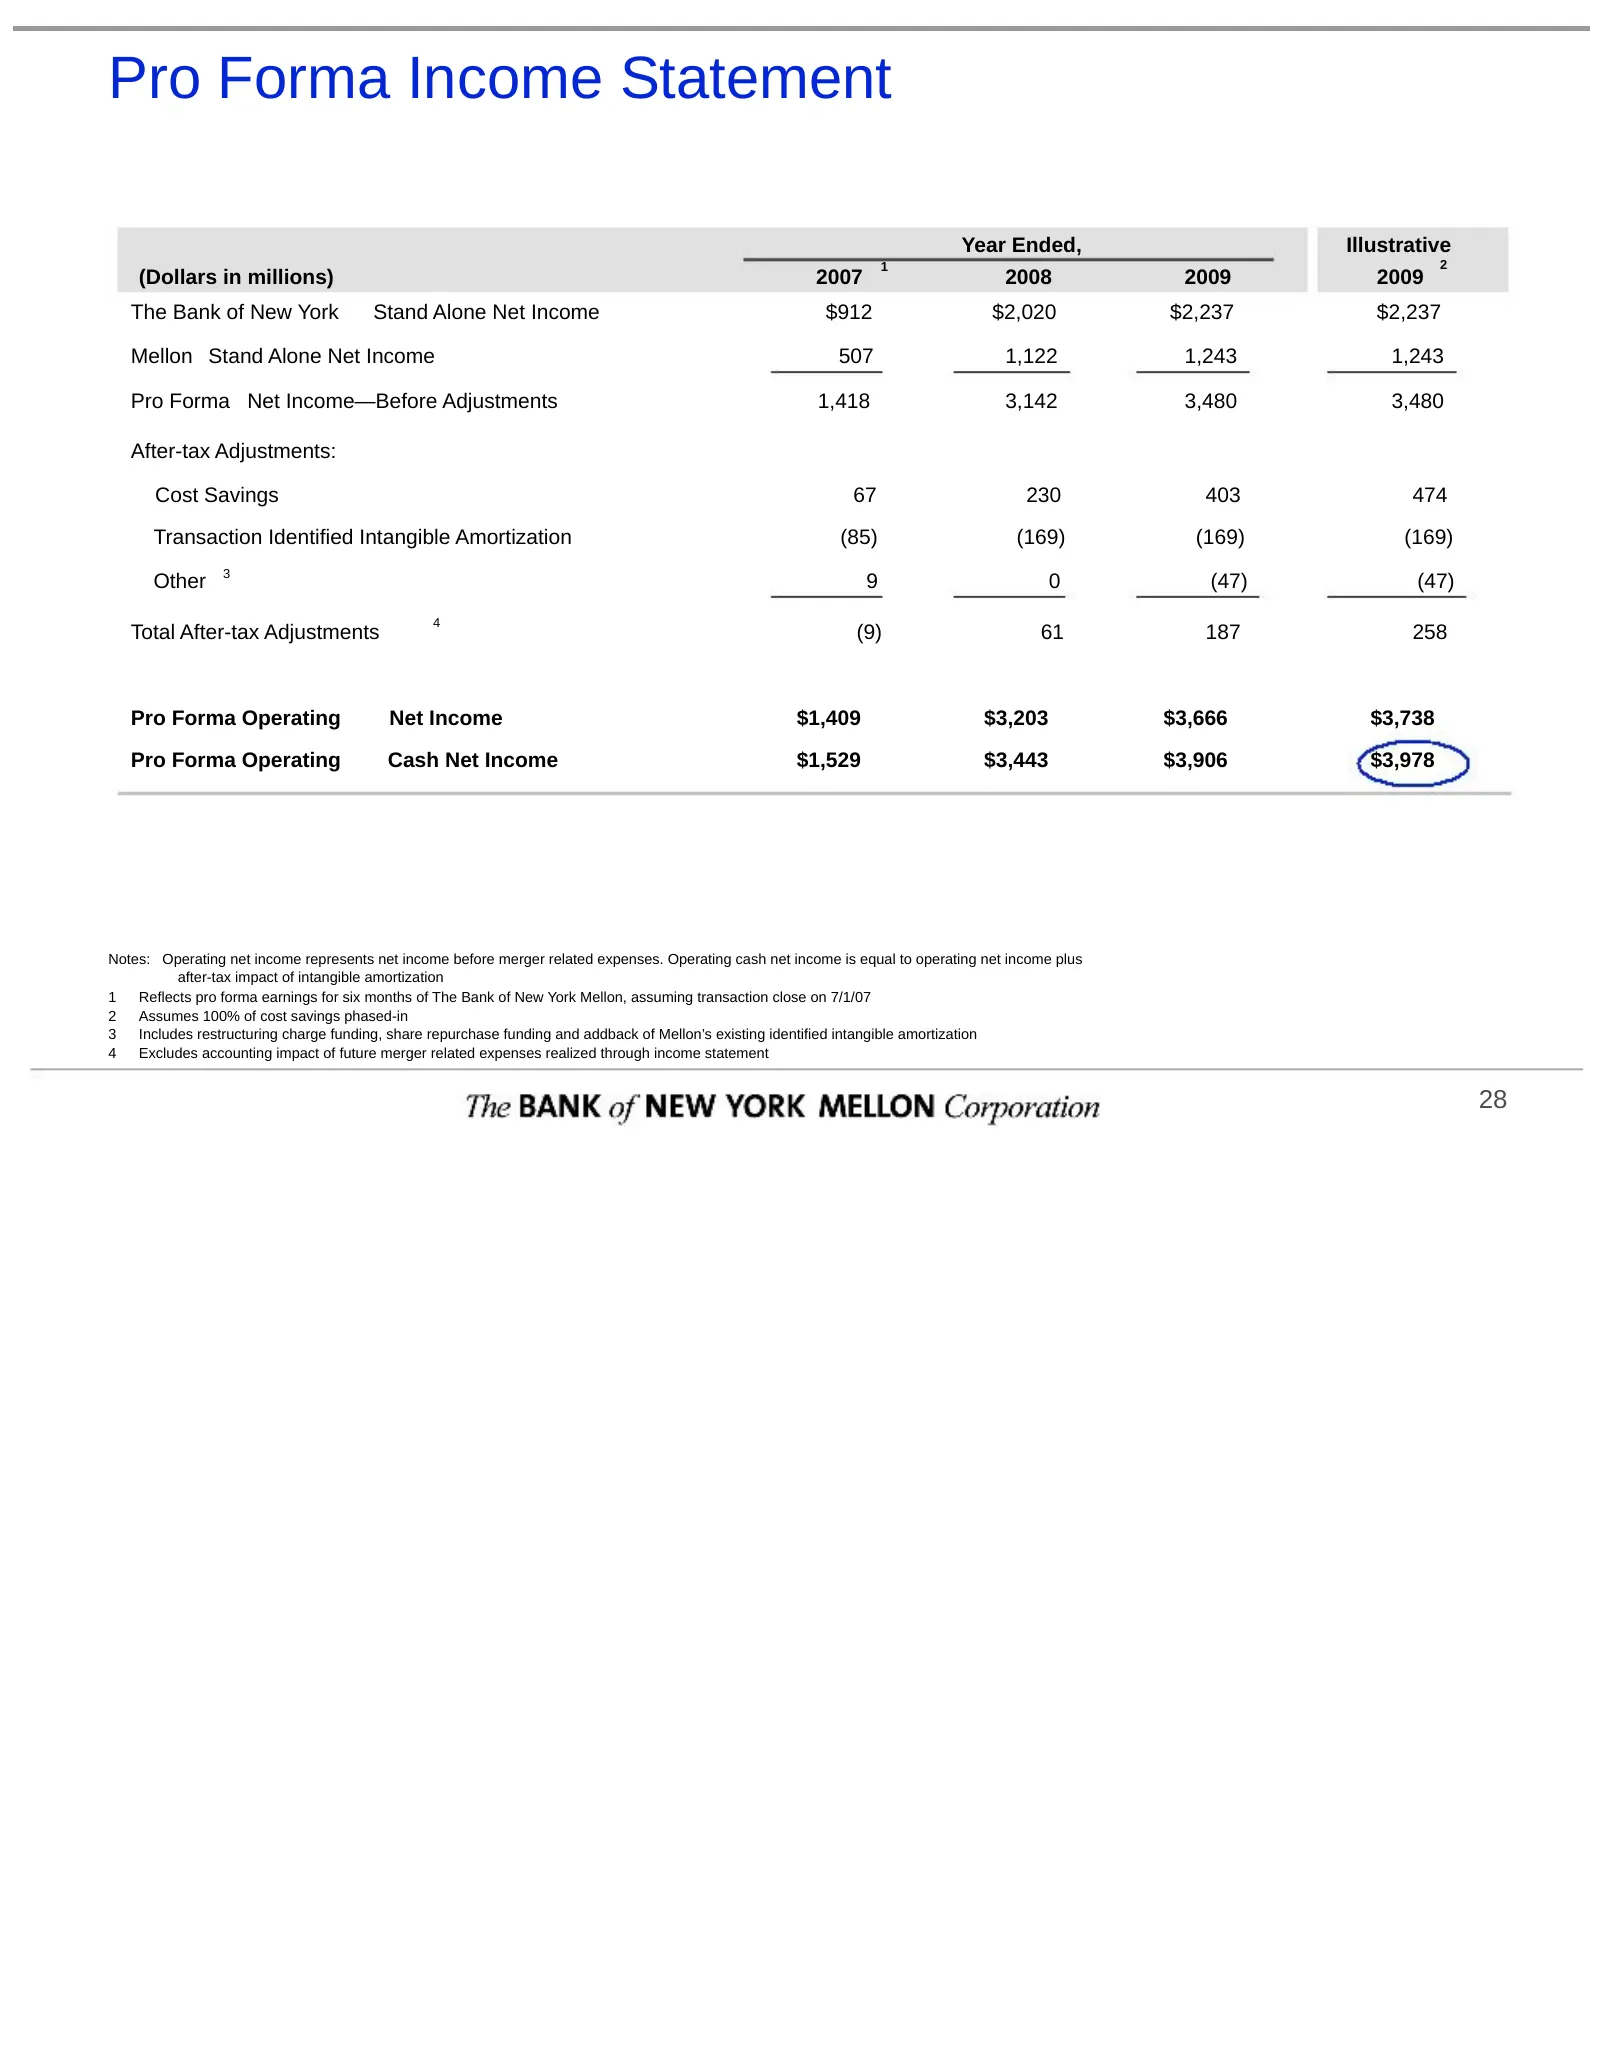
Pro Forma Income Statement Year Ended, Illustrative 1 2 (Dollars in millions) 2007 2008 2009 2009 The Bank of New York Stand Alone Net Income $912 $2,020 $2,237 $2,237 Mellon Stand Alone Net Income 507 1,122 1,243 1,243 Pro Forma Net Income—Before Adjustments 1,418 3,142 3,480 3,480 After-tax Adjust
Slide 31: Pro Forma Operating Metrics
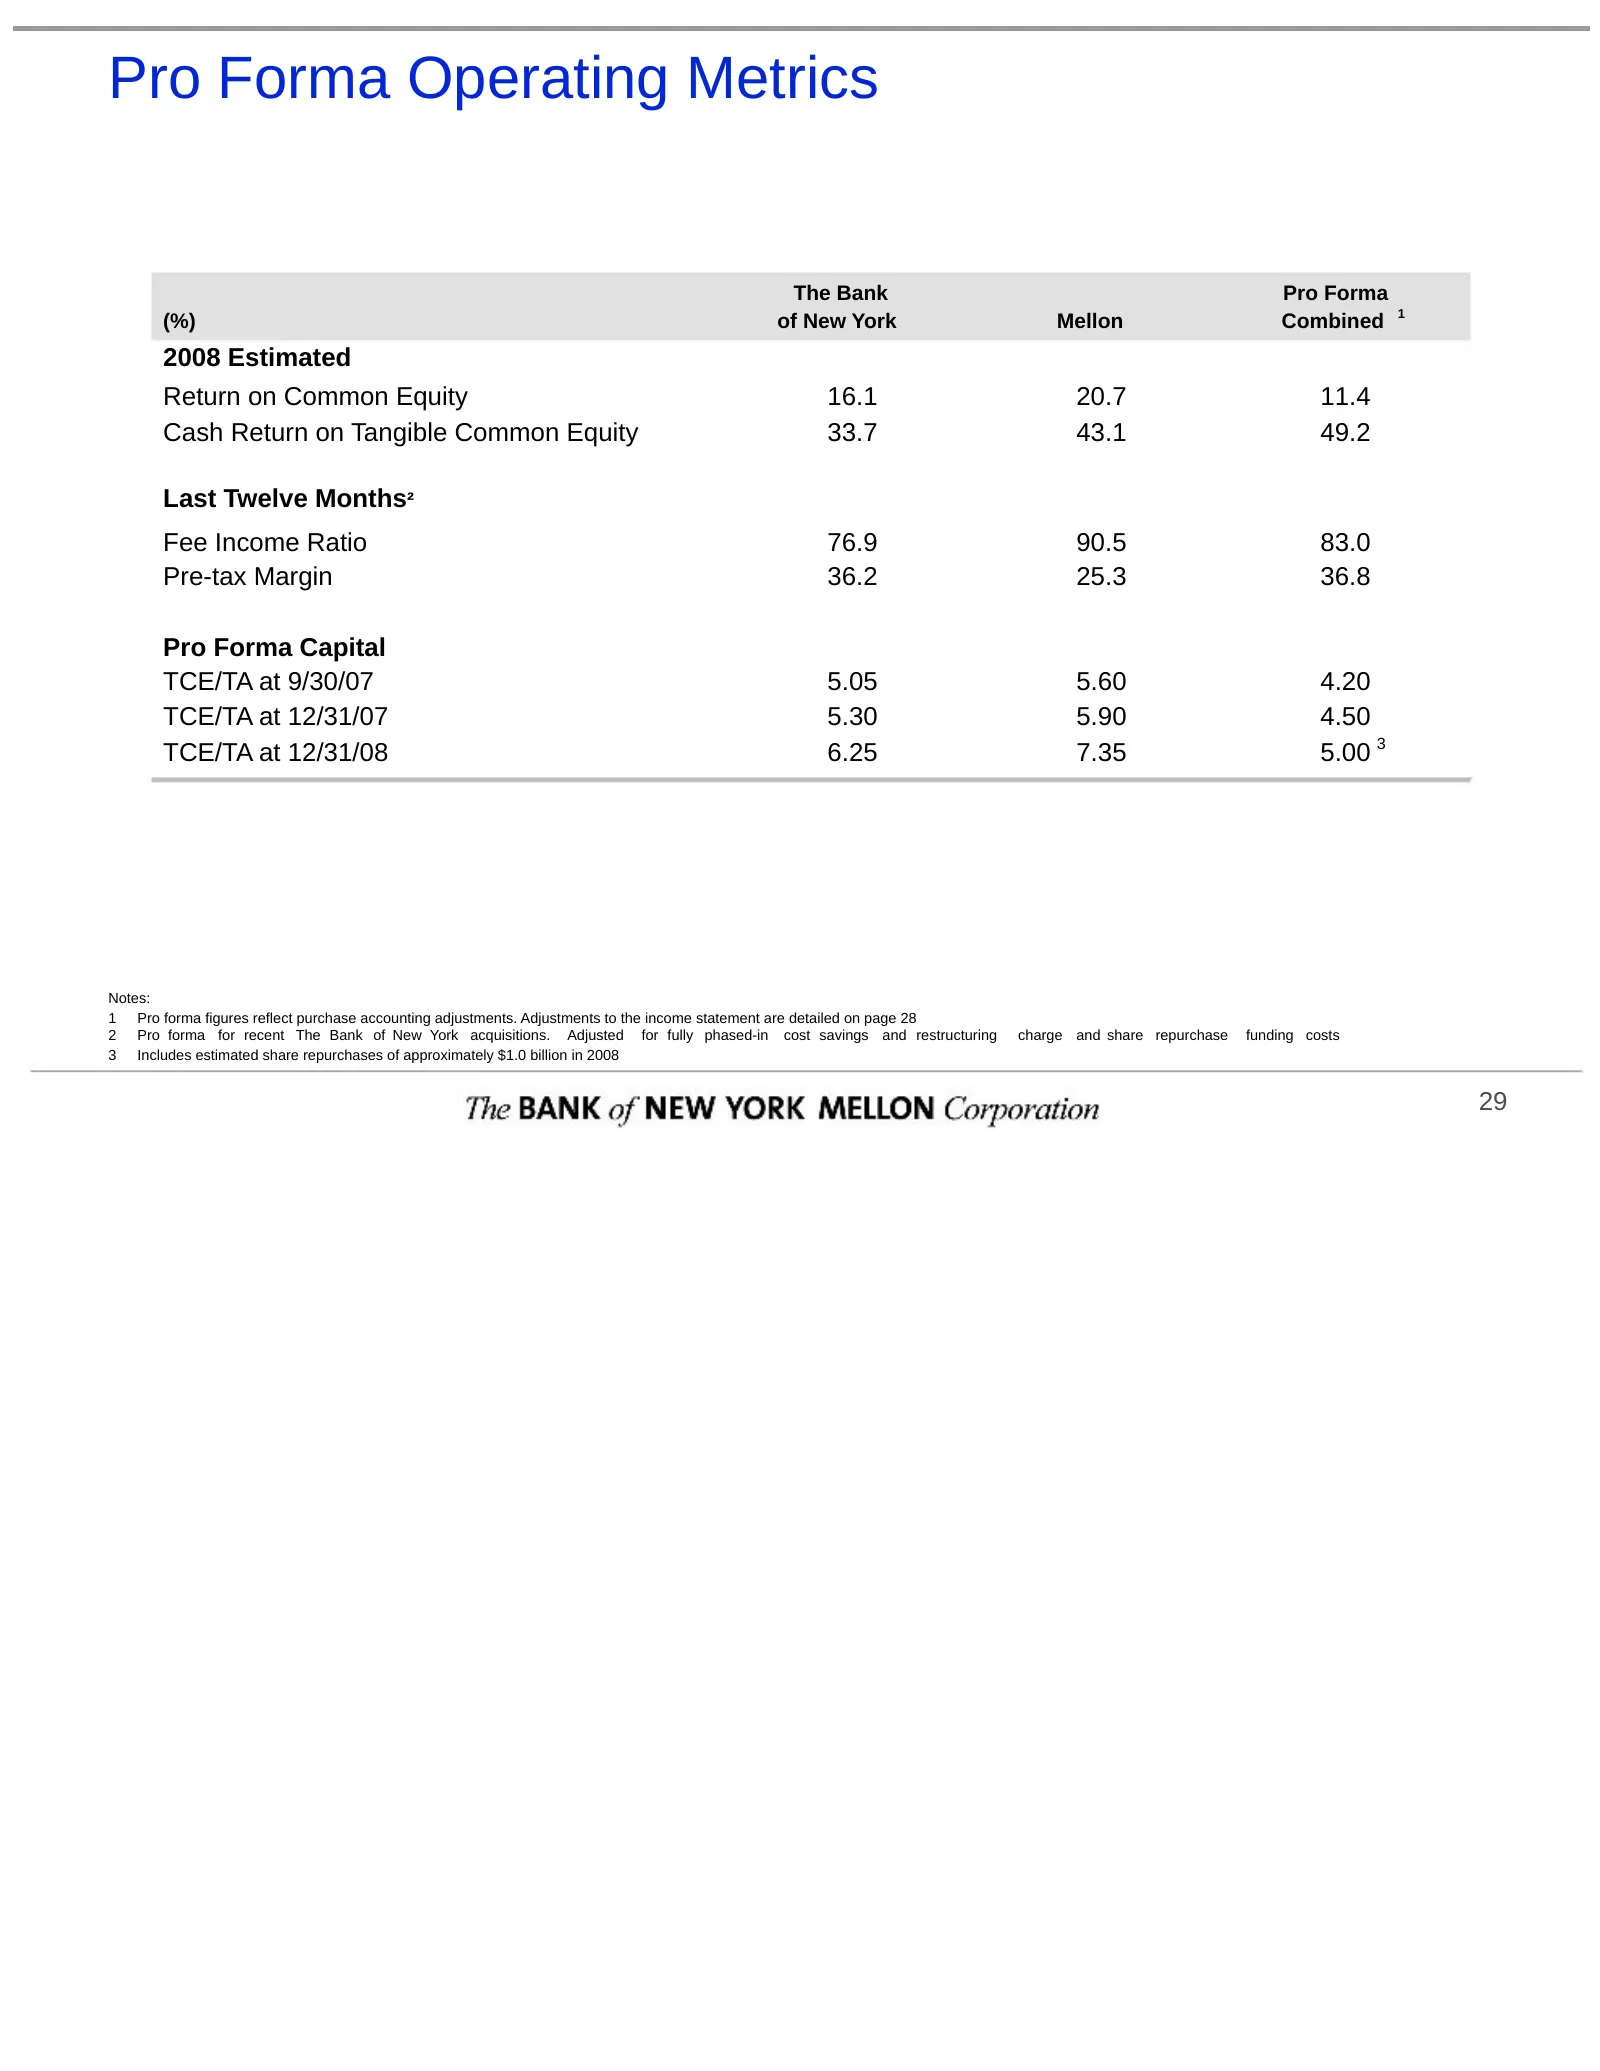
Pro Forma Operating Metrics The Bank Pro Forma (%) of New York Mellon Combined 1 2008 Estimated Return on Common Equity 16.1 20.7 11.4 Cash Return on Tangible Common Equity 33.7 43.1 49.2 Last Twelve Months² Fee Income Ratio 76.9 90.5 83.0 Pre-tax Margin 36.2 25.3 36.8 Pro Forma Capital TCE/TA at 9/
Slide 32: Pro Forma Capital Generation
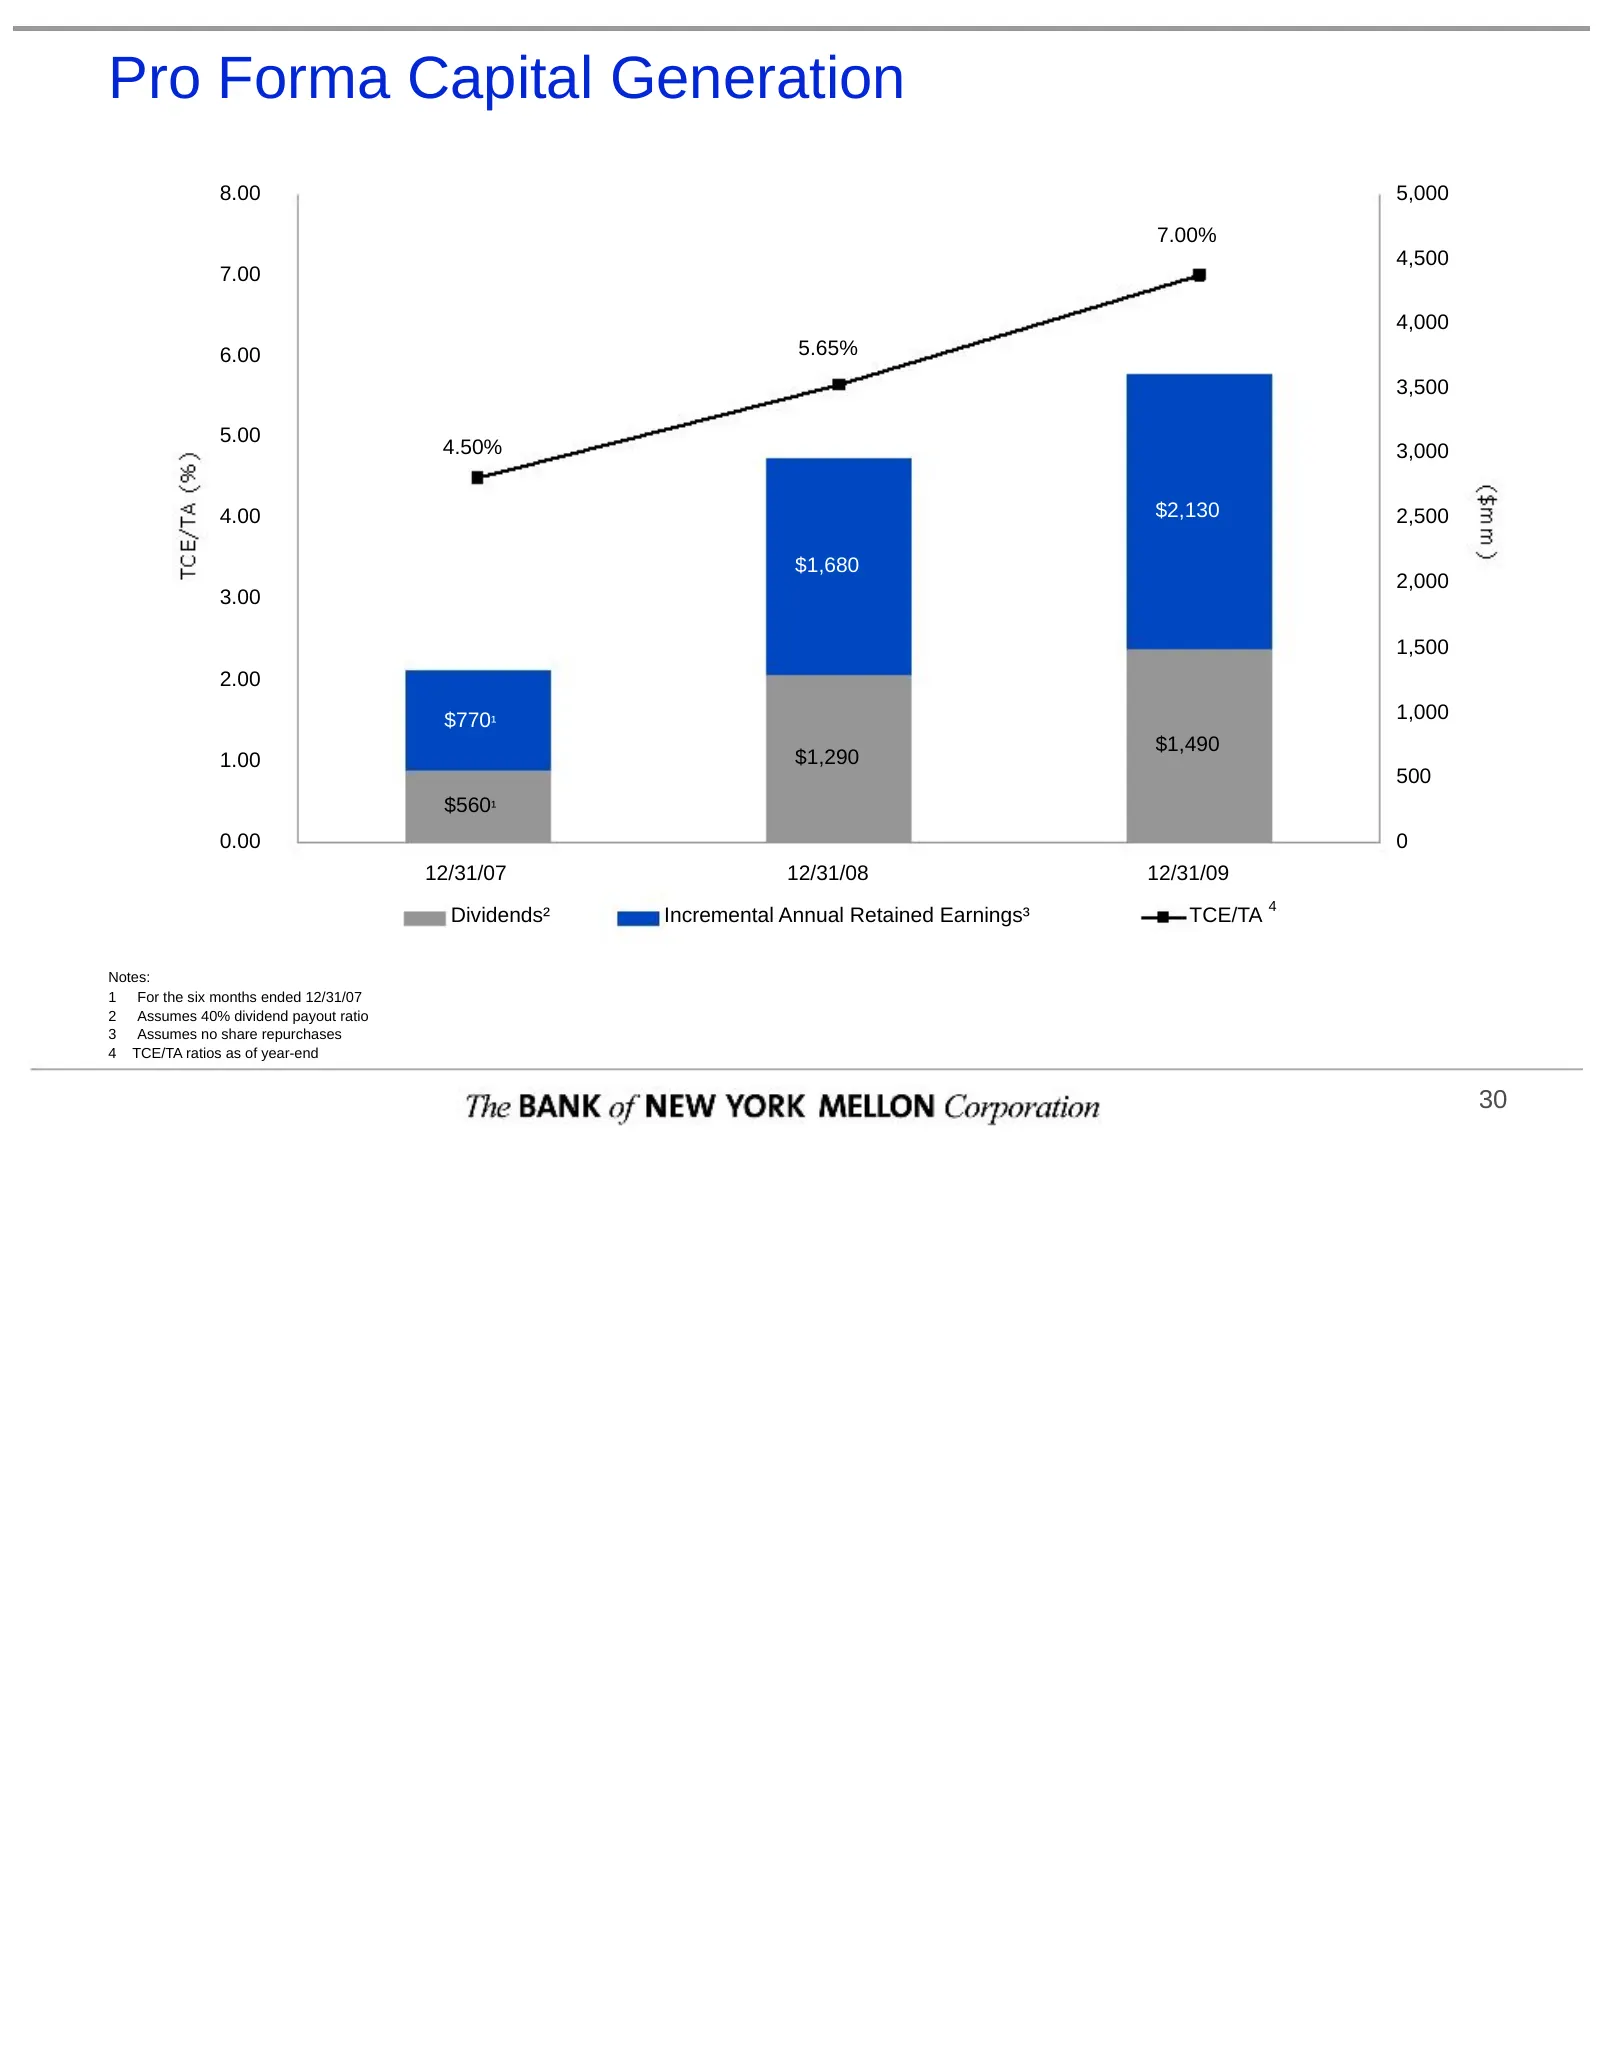
Pro Forma Capital Generation 8.00 5,000 7.00% 4,500 7.00 4,000 6.00 5.65% 3,500 5.00 4.50% 3,000 4.00 $2,130 2,500 $1,680 2,000 3.00 1,500 2.00 $770¹ 1,000 $1,490 1.00 $1,290 500 $560¹ 0.00 0 12/31/07 12/31/08 12/31/09 4 Dividends² Incremental Annual Retained Earnings³ TCE/TA Notes: 1 For the six mo
Slide 33: Internal Rate of Return
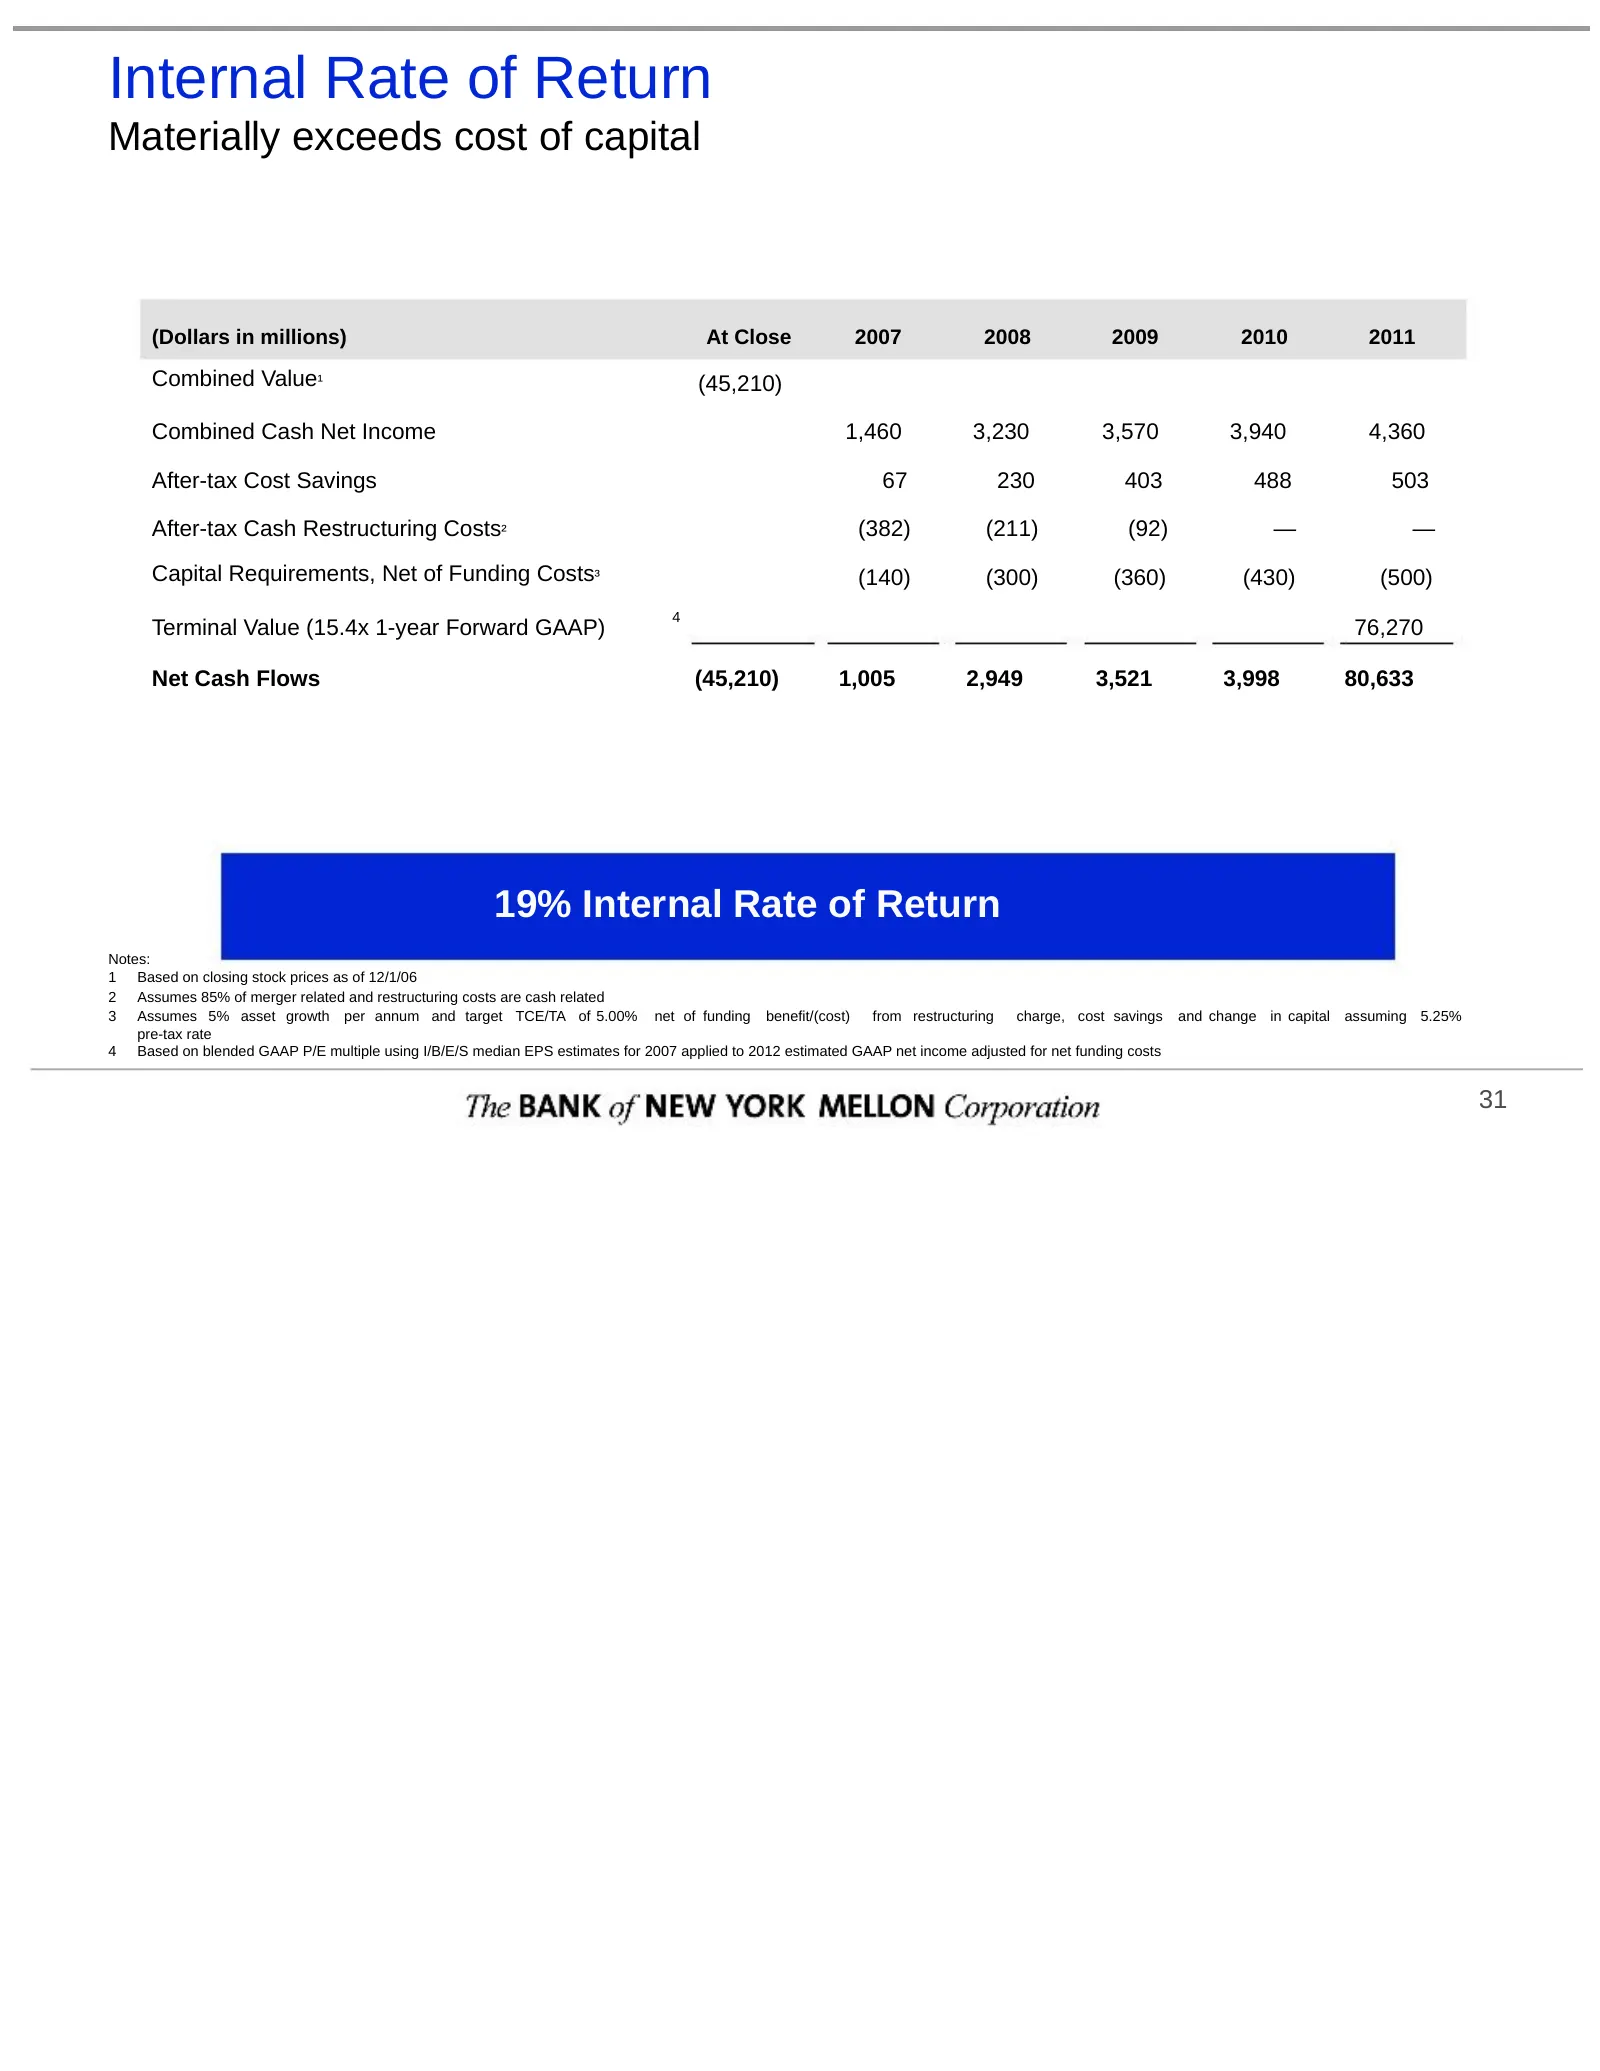
Internal Rate of Return Materially exceeds cost of capital (Dollars in millions) At Close 2007 2008 2009 2010 2011 Combined Value¹ (45,210) Combined Cash Net Income 1,460 3,230 3,570 3,940 4,360 After-tax Cost Savings 67 230 403 488 503 After-tax Cash Restructuring Costs² (382) (211) (92) — — Capita

Slide 34: The Bank of New York Mellon Corporation
The BANK of NEW YORK MELLON Corporation 32
Source: SEC EDGAR · 425 filed Dec 4, 2006
More decks from Bank of New York Co Inc
 Citigroup 2007 Financial Services Conference38 slides · Feb 1, 2007
 Bank of New York — Merger or Acquisition (December 2006)34 slides · Dec 19, 2006
 Mellon Financial — Merger or Acquisition (December 2006)34 slides · Dec 19, 2006
 Lehman Brothers 2006 Financial Services Conference36 slides · Sep 13, 2006
 Merger or Acquisition (June 2006)14 slides · Jun 30, 2006
 Investor Day (January 2005)185 slides · Jan 27, 2005