Hayes Lemmerz International Inc
Hayes Lemmerz International — Q1 2004 Earnings Presentation
23 slides from Hayes Lemmerz International's earnings presentation, Jun 9, 2004

Slide 1: First Quarter 2004 Results
First Quarter 2004 Results June 9, 2004
Slide 2: Forward Looking Statement
Forward Looking Statement THIS PRESENTATION CONTAINS FORWARD LOOKING STATEMENTS WITHIN THE MEANING OF THE PRIVATE SECURITIES LITIGATION REFORM ACT OF 1995 WITH RESPECT TO THE FINANCIAL CONDITION, RESULTS OF OPERATIONS, AND BUSINESS OF THE COMPANY. THESE FORWARD LOOKING STATEMENTS INVOLVE CERTAIN RIS
Slide 3: Financial Statement Comments
Financial Statement Comments Period financial results are not totally comparable due to the Company's emergence from Chapter 11 Earnings from operations excluding fresh start accounting adjustments and reorganization items are used by management as the primary profitability measure (also referred to
Slide 4: Agenda
Agenda Company Highlights Curt Clawson, President, CEO & Chairman of the Board Financial Review Jim Yost, Vice President of Finance & CFO 2004 Outlook Curt Clawson, President, CEO & Chairman of the Board Q&A
Slide 5: Our Vision: Premier Automotive Supplier
Grow by satisfying customers Be the lowest cost producer Have the best people in the industry Our Vision Premier Automotive Supplier CONTINUED PROGRESS IN ALL THREE AREAS
Slide 6: First Quarter 2004 Business Highlights
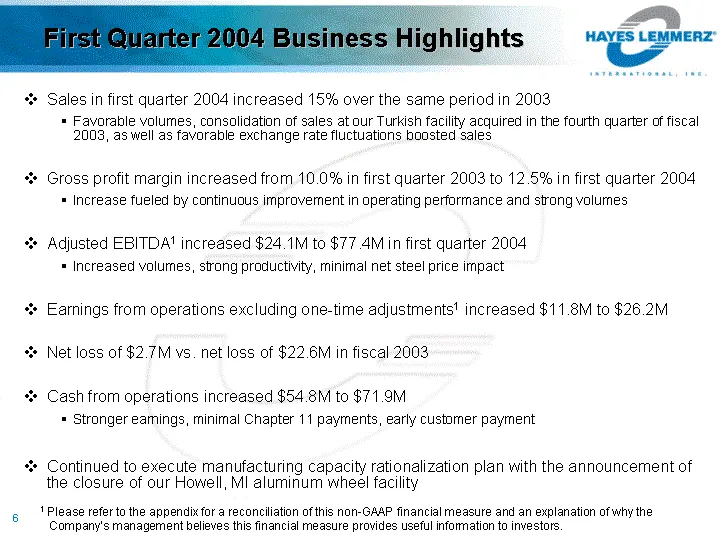
First Quarter 2004 Business Highlights Sales in first quarter 2004 increased 15% over the same period in 2003 Favorable volumes, consolidation of sales at our Turkish facility acquired in the fourth quarter of fiscal 2003, as well as favorable exchange rate fluctuations boosted sales Gross profit ma
Slide 7: Strengthening of the Balance Sheet
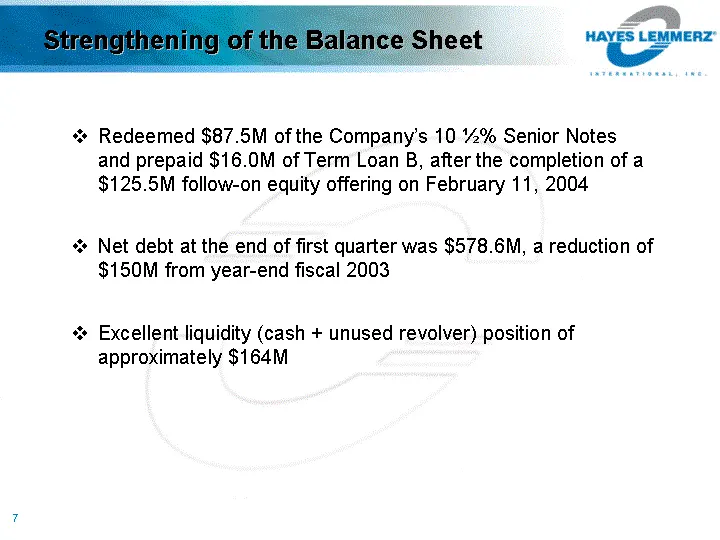
Strengthening of the Balance Sheet Redeemed $87.5M of the Company's 10 1/2% Senior Notes and prepaid $16.0M of Term Loan B, after the completion of a $125.5M follow-on equity offering on February 11, 2004 Net debt at the end of first quarter was $578.6M, a reduction of $150M from year-end fiscal 200
Slide 8: First Quarter 2004 Financial Review
First Quarter 2004 Financial Review
Slide 9: Q1 2004 Financial Review: Financial Highlights
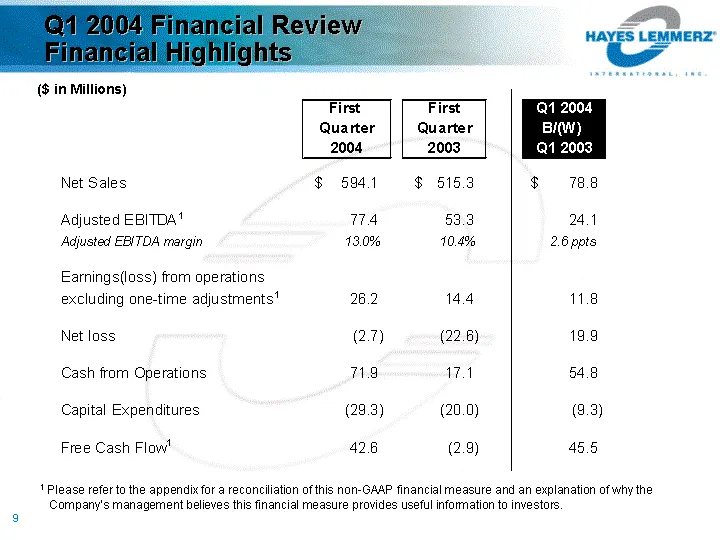
Q1 2004 Financial Review Financial Highlights ($ in Millions) 1 Please refer to the appendix for a reconciliation of this non-GAAP financial measure and an explanation of why the Company's management believes this financial measure provides useful information to investors.
Slide 10: Q1 2004 Financial Review: Segment Highlights
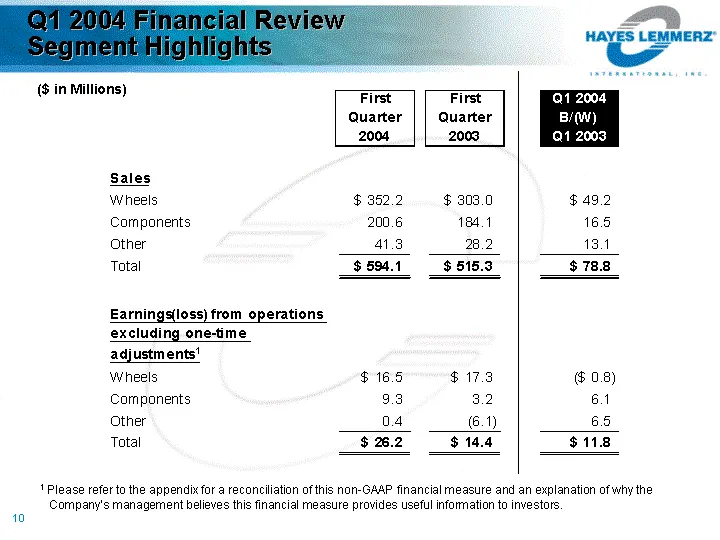
Q1 2004 Financial Review Segment Highlights ($ in Millions) 1 Please refer to the appendix for a reconciliation of this non-GAAP financial measure and an explanation of why the Company's management believes this financial measure provides useful information to investors.
Slide 11: Q1 2004 vs. Q1 2003 - Change in Net Sales
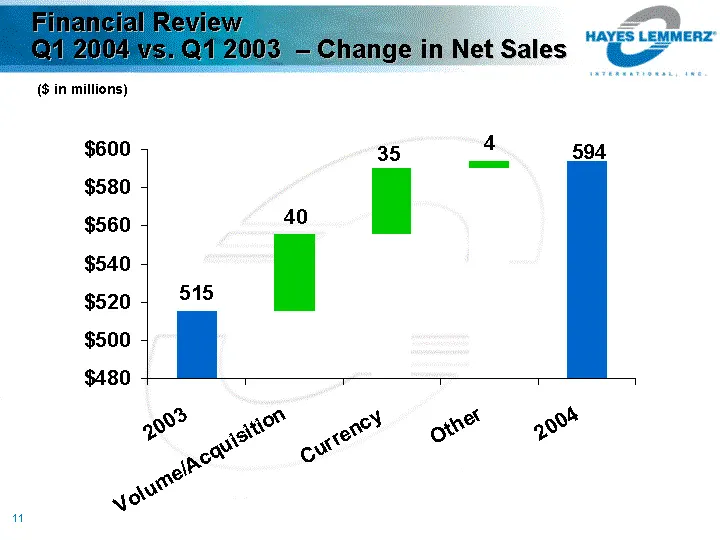
Financial Review Q1 2004 vs. Q1 2003 - Change in Net Sales 2003 Volume/Acquisition Currency Other 2004 Show 515.3 594.1 Hide 0 515.3 555.3 590.3 0 Green 0 40 35 3.8 0 Red 0 0 0 ($ in millions)
Slide 12: Q1 2004 Free Cash Flow
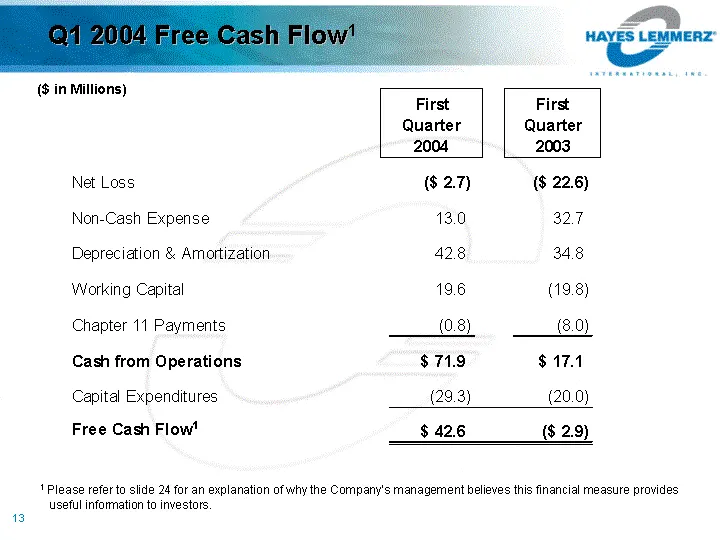
Q1 2004 Free Cash Flow1 ($ in Millions) 1 Please refer to slide 24 for an explanation of why the Company's management believes this financial measure provides useful information to investors.
Slide 13: Debt and Net Book Debt as of April 30, 2004
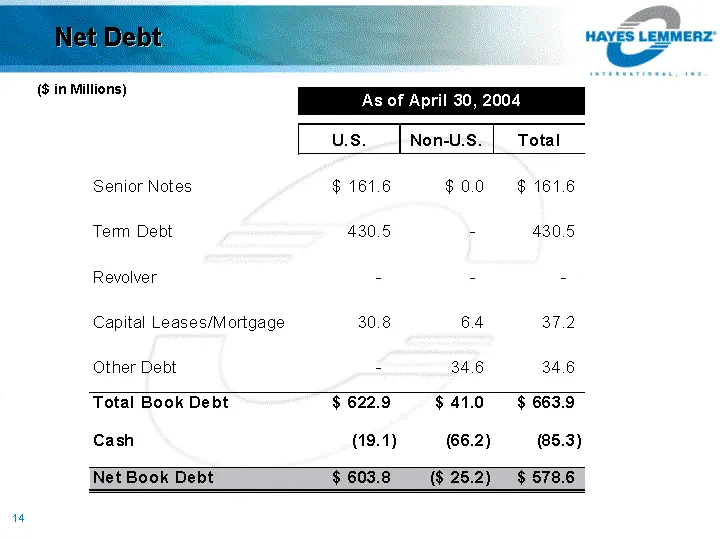
(S in Millions) ‘As of April 30, 2004 U.S. | Non-U.s. | Total Senior Notes $ 161.6 $00 $1616 Tem Debt 430.5 7 430.5 Revolver - - - Capital Leases/Mortgage 30.8 64 37.2 Other Debt - 34.6 34.6 Total Book Debt $6229 $410 $6639 Cash (19.1) (66.2) 85.3) Net Book Debt $ 603.8 ($25.2) $578.6

Slide 14: 2004 Outlook
2004 Outlook HAYES LEMMERZ: INTERNATIONAL, INE.
Slide 15: 2004 Production Outlook
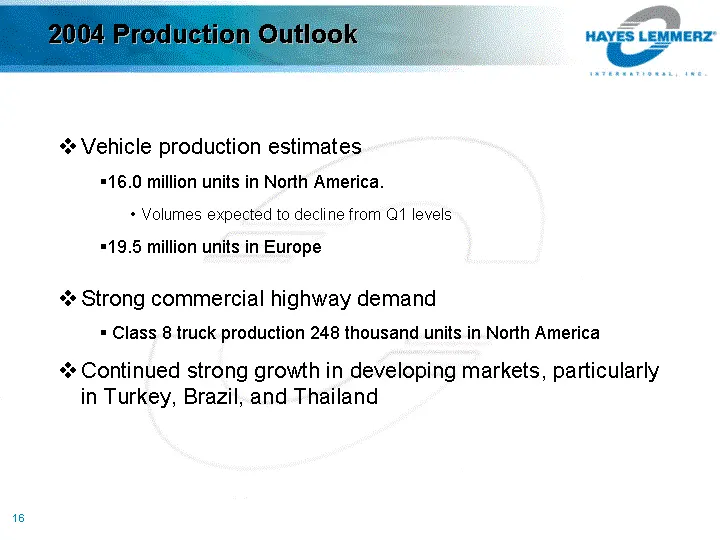
2004 Production Outlook Vehicle production estimates 16.0 million units in North America. Volumes expected to decline from Q1 levels 19.5 million units in Europe Strong commercial highway demand Class 8 truck production 248 thousand units in North America Continued strong growth in developing market
Slide 16: Steel Impact
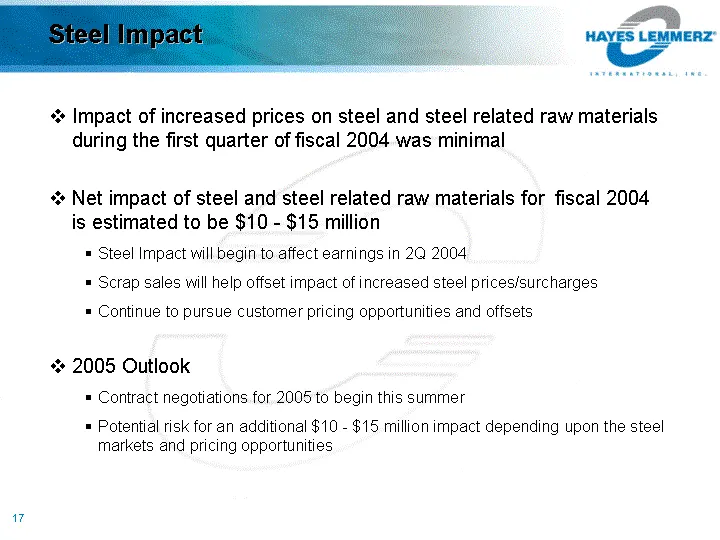
Steel Impact Impact of increased prices on steel and steel related raw materials during the first quarter of fiscal 2004 was minimal Net impact of steel and steel related raw materials for fiscal 2004 is estimated to be $10 - $15 million Steel Impact will begin to affect earnings in 2Q 2004 Scrap sa
Slide 17: 2004 Financial Outlook
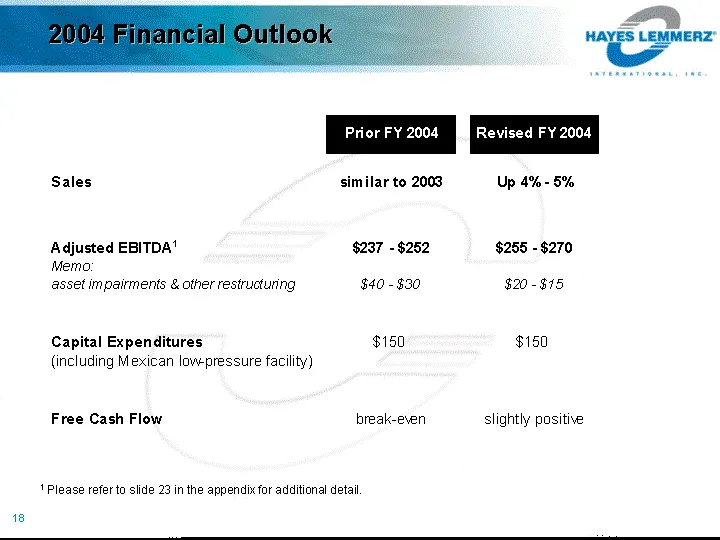
2004 Financial Outlook 1 Please refer to slide 23 in the appendix for additional detail.
Slide 18: Appendix
Appendix HAYES LEMMERZ INTERNATIONAL, INC.
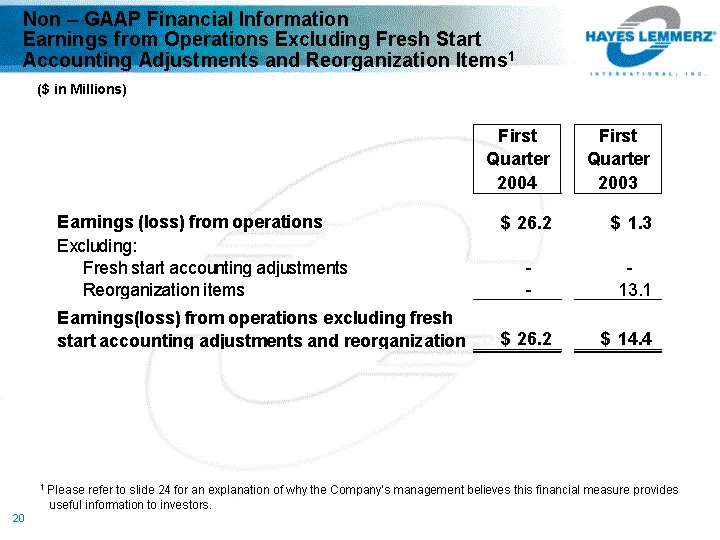
Slide 19: Non-GAAP Financial Information: Earnings from Operations Excluding Fresh Start Adjustments
Non - GAAP Financial Information Earnings from Operations Excluding Fresh Start Accounting Adjustments and Reorganization Items1 ($ in Millions) 1 Please refer to slide 24 for an explanation of why the Company's management believes this financial measure provides useful information to investors.
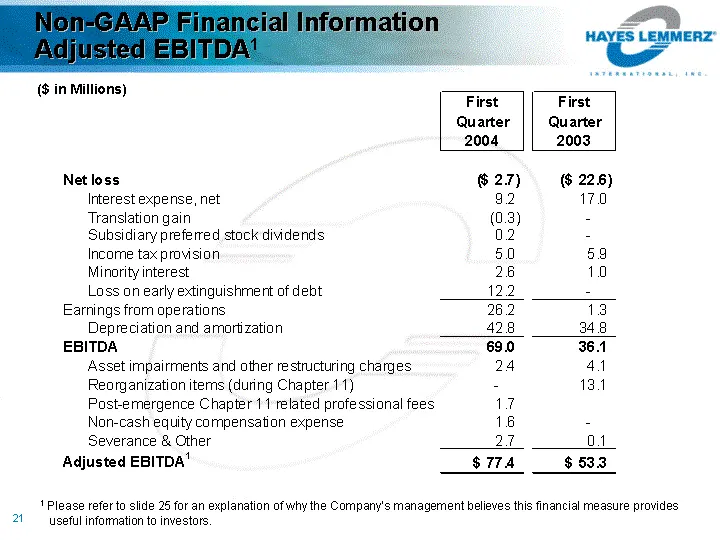
Slide 20: Non-GAAP Financial Information: Adjusted EBITDA
Non-GAAP Financial Information Adjusted EBITDA1 ($ in Millions) 1 Please refer to slide 25 for an explanation of why the Company's management believes this financial measure provides useful information to investors.
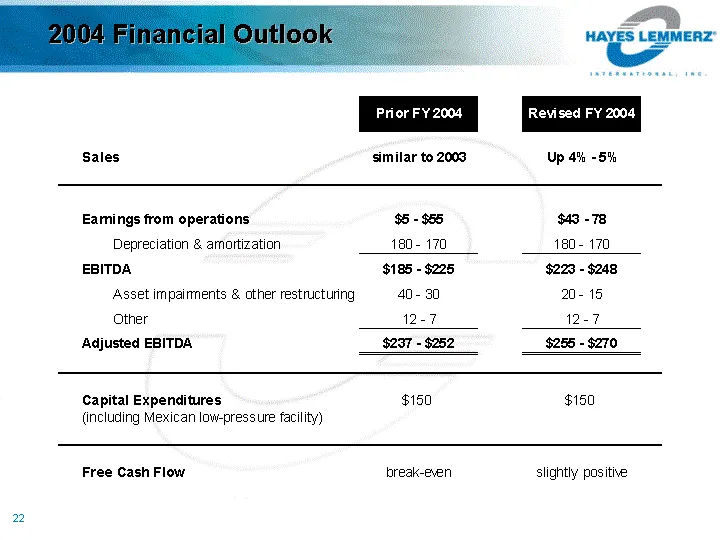
Slide 21: Prior vs. Revised FY 2004 Outlook
2 Prior FY. 2004 Revised FY 2004 Sales similar to 2003 Up 4% -5% Eamings from operations $5 - $55 $43 -78 Depreciation & amortization 180-170 10-170 EBITDA $185 - $225 $228 - $248 Asset impairments & ather restructuring 40-30 20-15, Other 12-7 12-7 Adjusted EBITDA $257 - $252 $255 - $270 Capital Exp
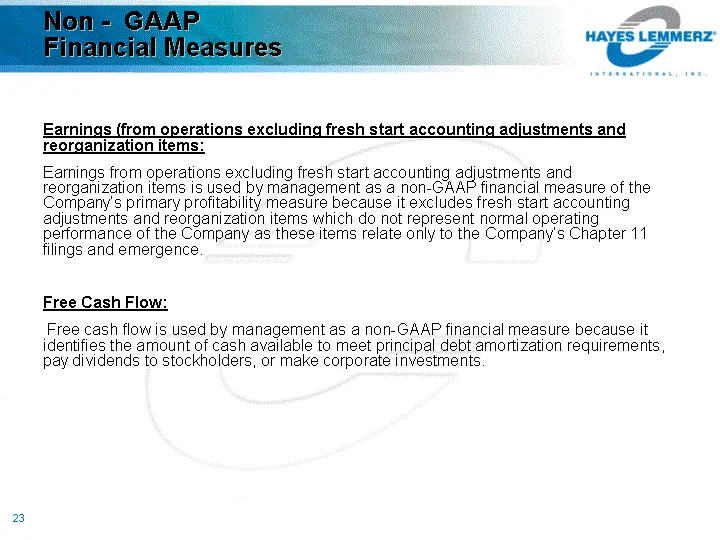
Slide 22: Non-GAAP Financial Measures
Non - GAAP Financial Measures Earnings (from operations excluding fresh start accounting adjustments and reorganization items: Earnings from operations excluding fresh start accounting adjustments and reorganization items is used by management as a non-GAAP financial measure of the Company's primary
Slide 23: Financial Measures: Adjusted EBITDA
Financial Measures Adjusted EBITDA: EBITDA, a measure used by management to measure operating performance, is defined as earnings from operations plus depreciation and amortization. Adjusted EBITDA is defined as EBITDA further adjusted to exclude: (i) asset impairment losses and other restructuring
Source: SEC EDGAR · 8-K filed Jun 9, 2004
More decks from Hayes Lemmerz International Inc
 Q3 2008 Earnings Presentation29 slides · Dec 4, 2008
 Q2 2008 Earnings Presentation34 slides · Sep 4, 2008
 Q1 2008 Earnings Presentation35 slides · Jun 5, 2008
 FY2007 Earnings Presentation35 slides · Apr 10, 2008
 Morgan Stanley Global Automotive Conference 200837 slides · Mar 19, 2008
 2008 Auto Analysts of New York Conference39 slides · Jan 16, 2008