Ascom Holding AG · SIX:ASCN
Ascom — FY2010 Earnings Presentation
11 slides from Ascom's earnings presentation, Mar 9, 2011
Slide 1: 2010 Financial Results
[ ] 2010 FINANCIAL RESULTS Martin Zwyssig CFO 2010 Full-Year Results Conference, 09/03/2011 © Ascom Group 1
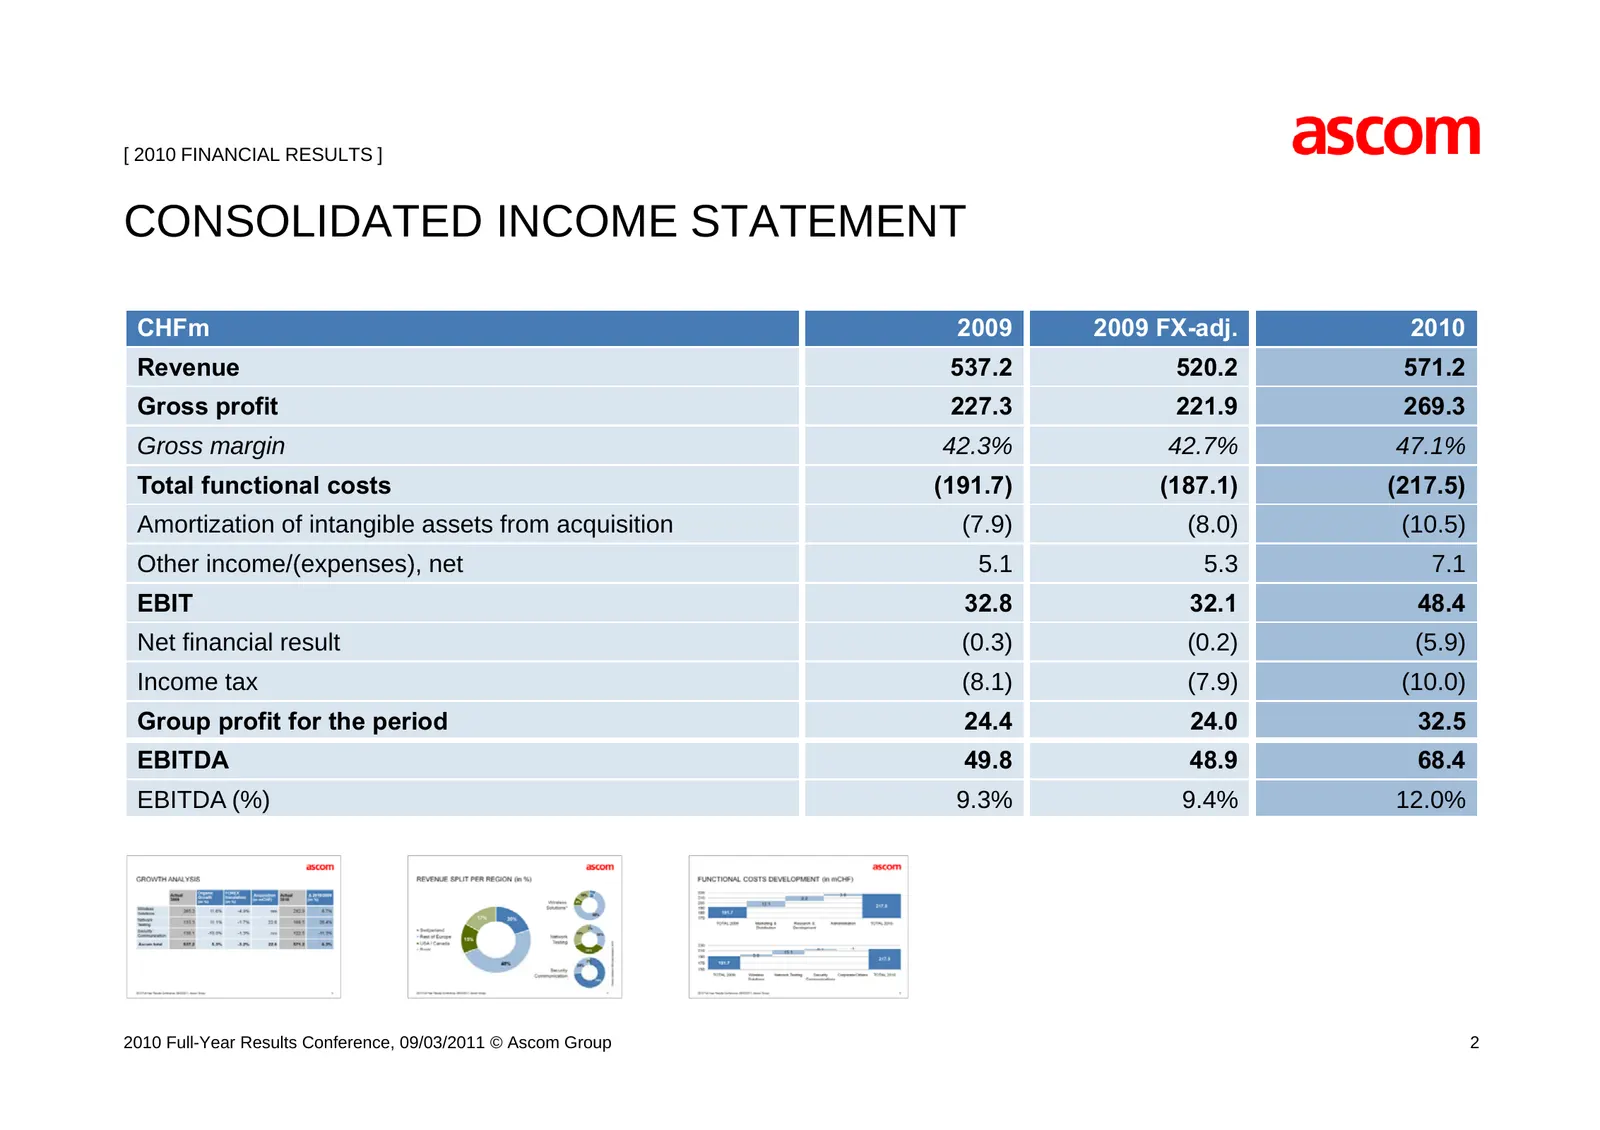
Slide 2: Consolidated Income Statement
[ 2010 FINANCIAL RESULTS ] CONSOLIDATED INCOME STATEMENT CHFm 2009 2009 FX-adj. 2010 Revenue 537.2 520.2 571.2 Gross profit 227.3 221.9 269.3 G Gross margin i 42 3% 42.3% 42 % 42.7% 4 1% 47.1% Total functional costs (191.7) (187.1) (217.5) Amortization of intangible assets from acquisition (7.9) (8.
Slide 3: Growth Analysis
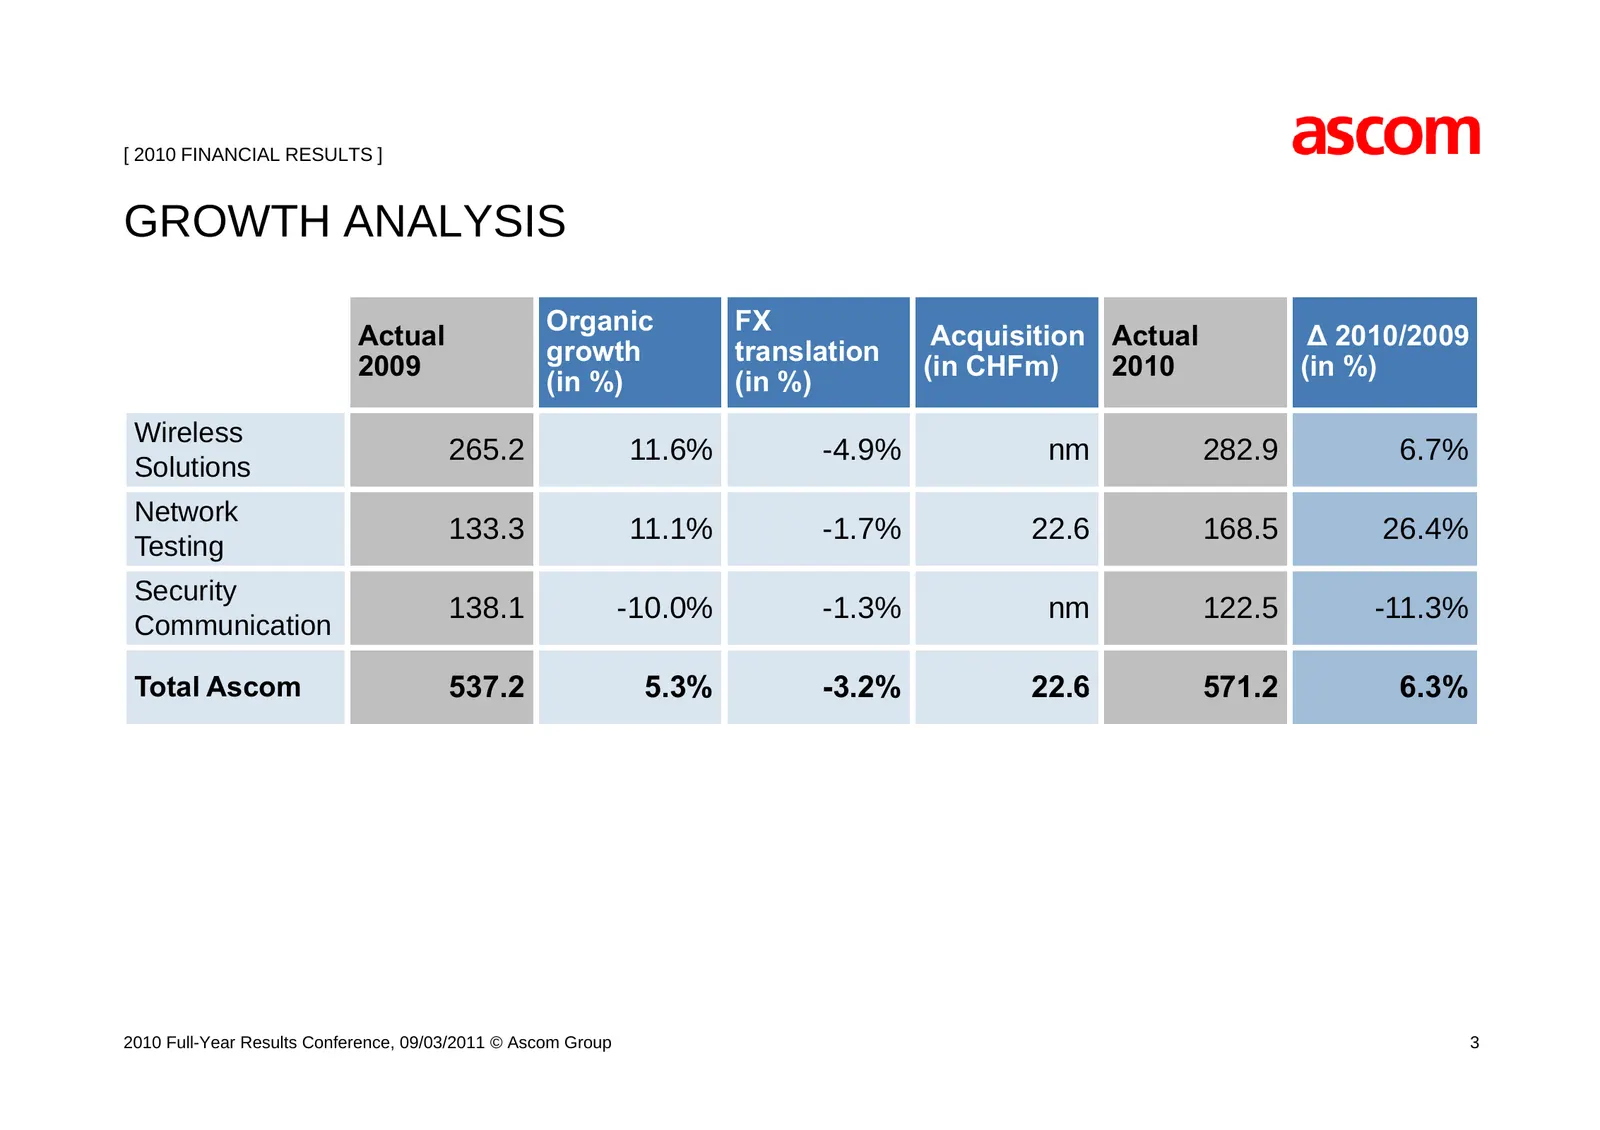
[ 2010 FINANCIAL RESULTS ] GROWTH ANALYSIS Organic FX Actual Acquisition Actual Δ 2010/2009 growth translation 2009 (in CHFm) 2010 (in %) (in %) (in %) Wireless 265.2 11.6% -4.9% nm 282.9 6.7% Solutions Network 133.3 11.1% -1.7% 22.6 168.5 26.4% Testing Security 138.1 -10.0% -1.3% nm 122.5 -11.3% Co
Slide 4: Revenue Split per Region (in %)
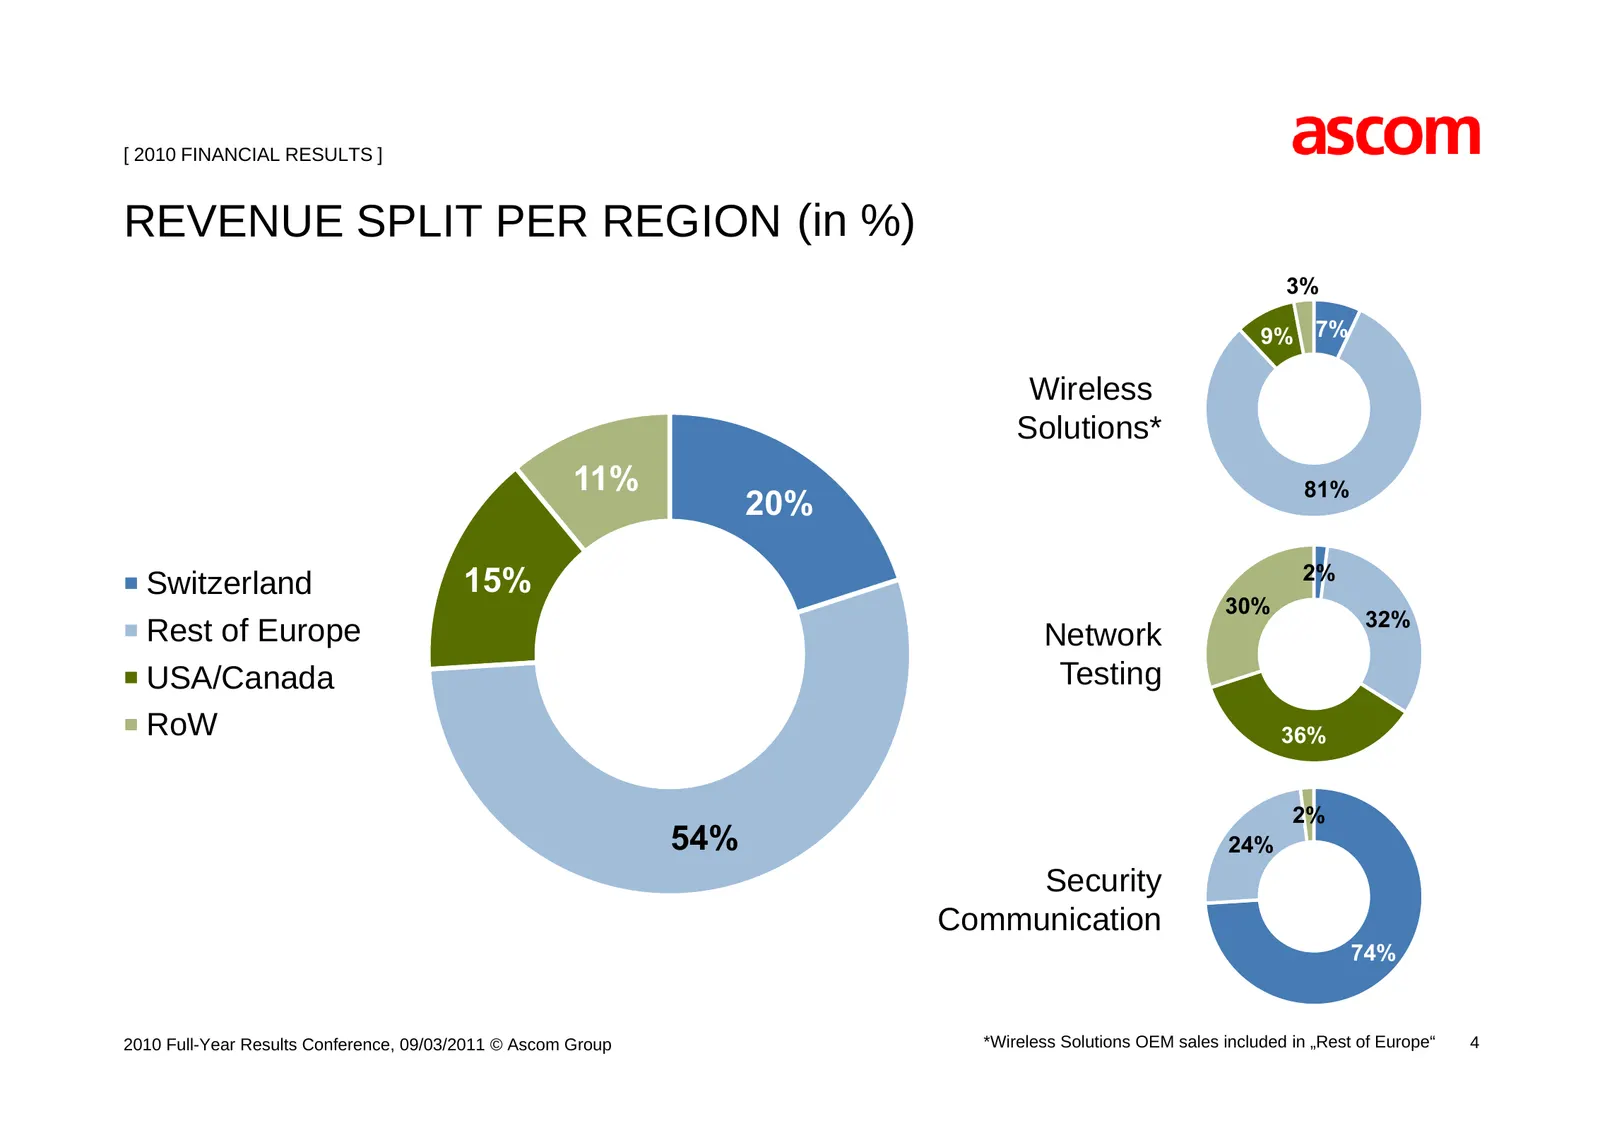
[ 2010 FINANCIAL RESULTS ] REVENUE SPLIT PER REGION (in %) 3% 9% 7% Wireless Solutions* Solutions 11% 81% 20% 15% 2% Switzerland 30% 32% Rest of Europe Network USA/Canada Testing RoW 36% 2% 54% 24% Security Communication 74% 2010 Full-Year Results Conference, 09/03/2011 © Ascom Group *Wireless Solut
Slide 5: Functional Costs Development (in CHFm)
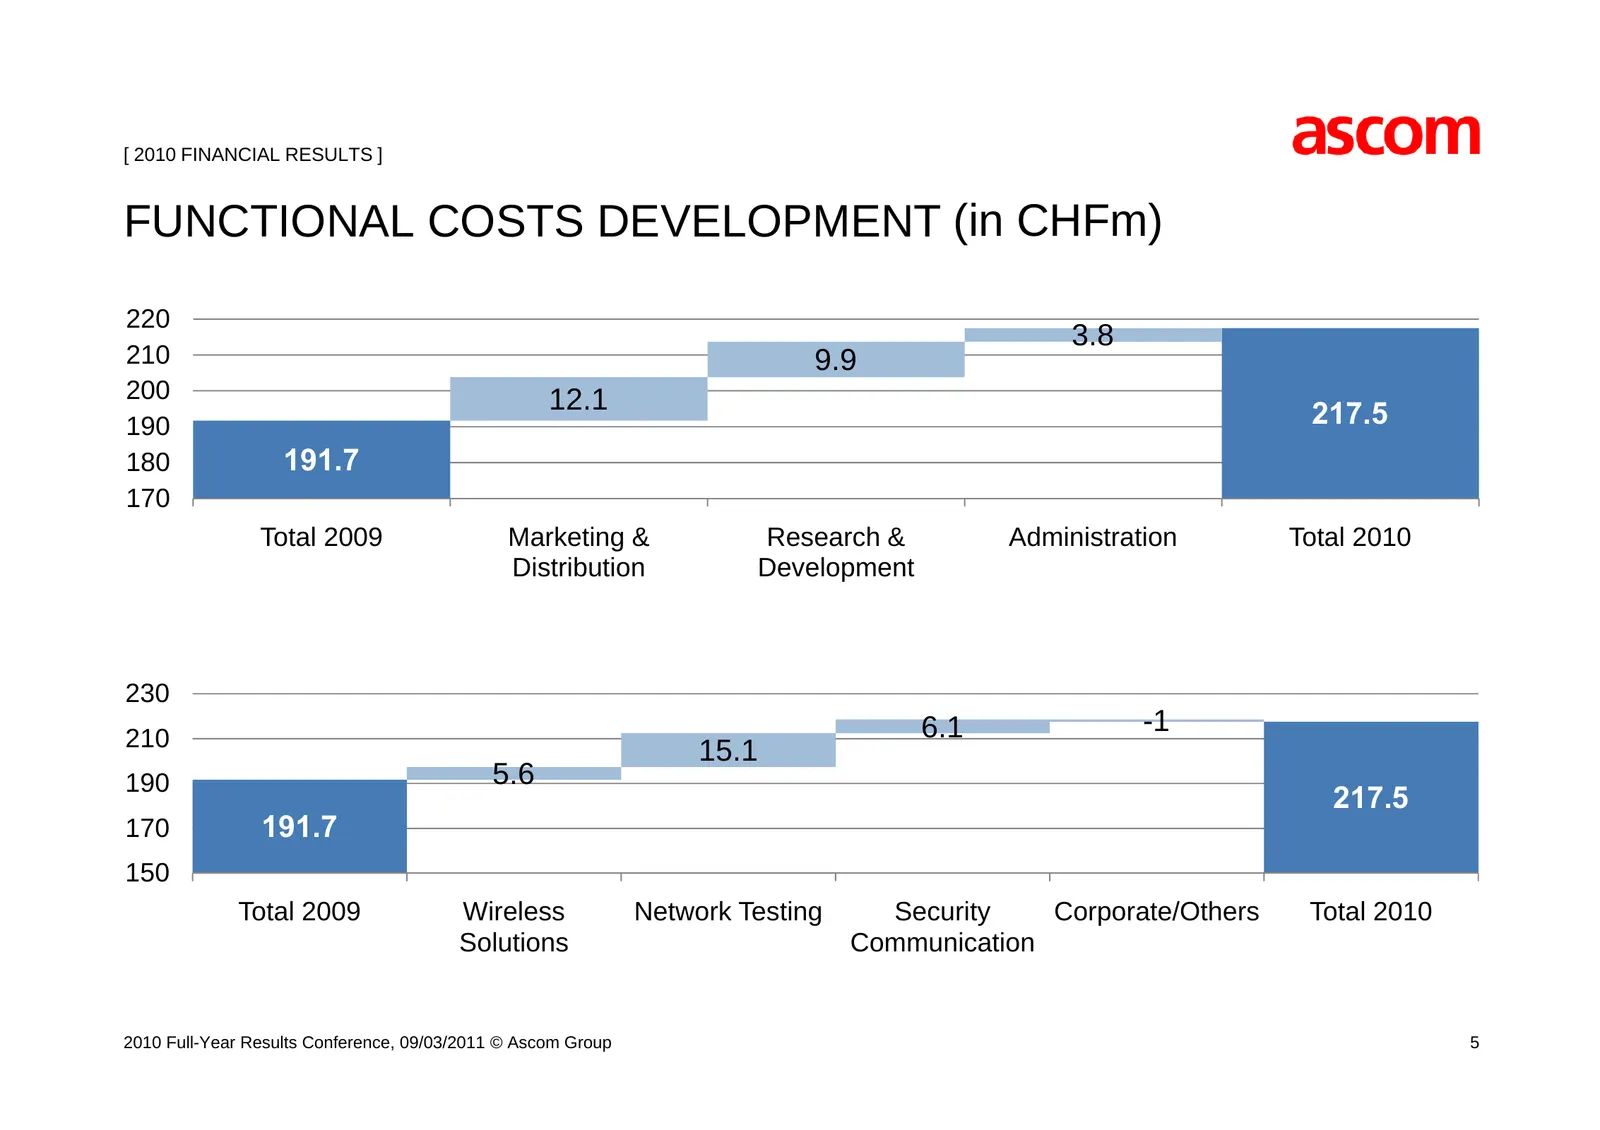
[ 2010 FINANCIAL RESULTS ] FUNCTIONAL COSTS DEVELOPMENT (in CHFm) 220 3.8 210 9.9 200 12.1 190 217.5 180 191.7 170 Total 2009 Marketing & Research & Administration Total 2010 Distribution Development 230 6.1 -1 210 15.1 190 5.6 217.5 170 191 7 191.7 150 Total 2009 Wireless Network Testing Security C
Slide 6: Consolidated Balance Sheet
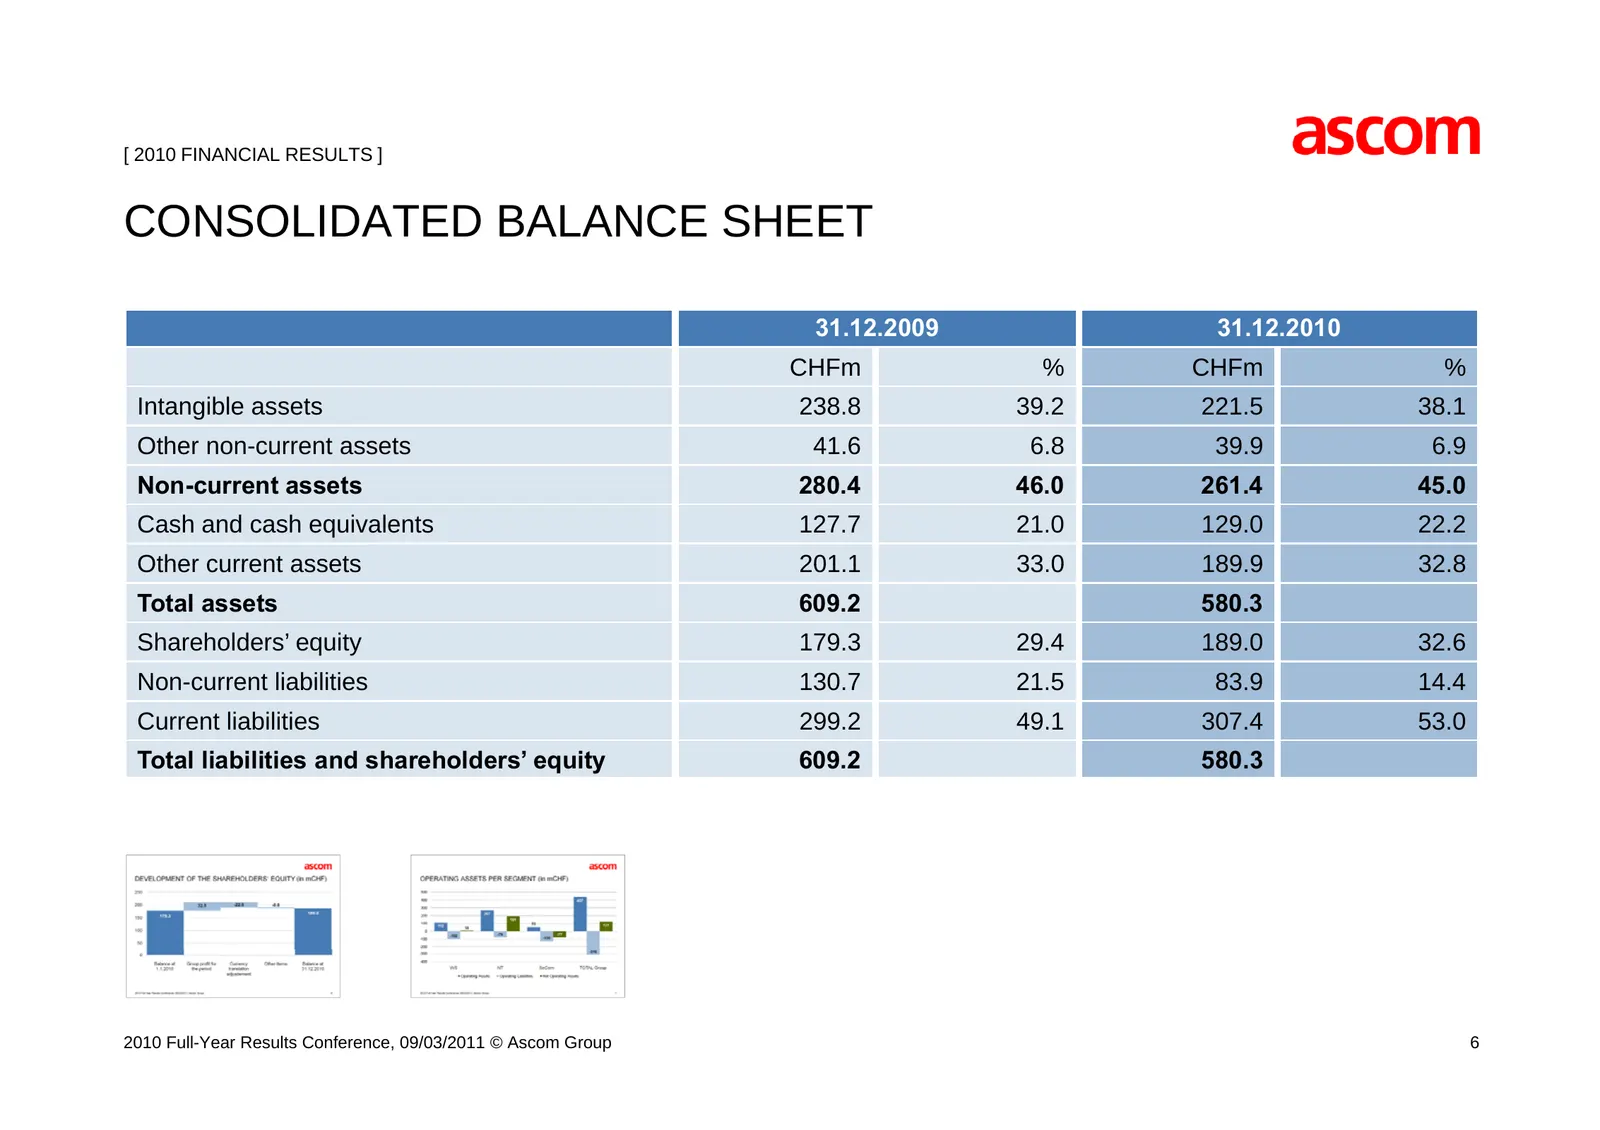
[ 2010 FINANCIAL RESULTS ] CONSOLIDATED BALANCE SHEET 31.12.2009 31.12.2010 CHFm % CHFm % Intangible assets 238.8 39.2 221.5 38.1 O h non-current assets Other 41 6 41.6 68 6.8 39 9 39.9 69 6.9 Non-current assets 280.4 46.0 261.4 45.0 Cash and cash equivalents 127.7 21.0 129.0 22.2 Other current asse
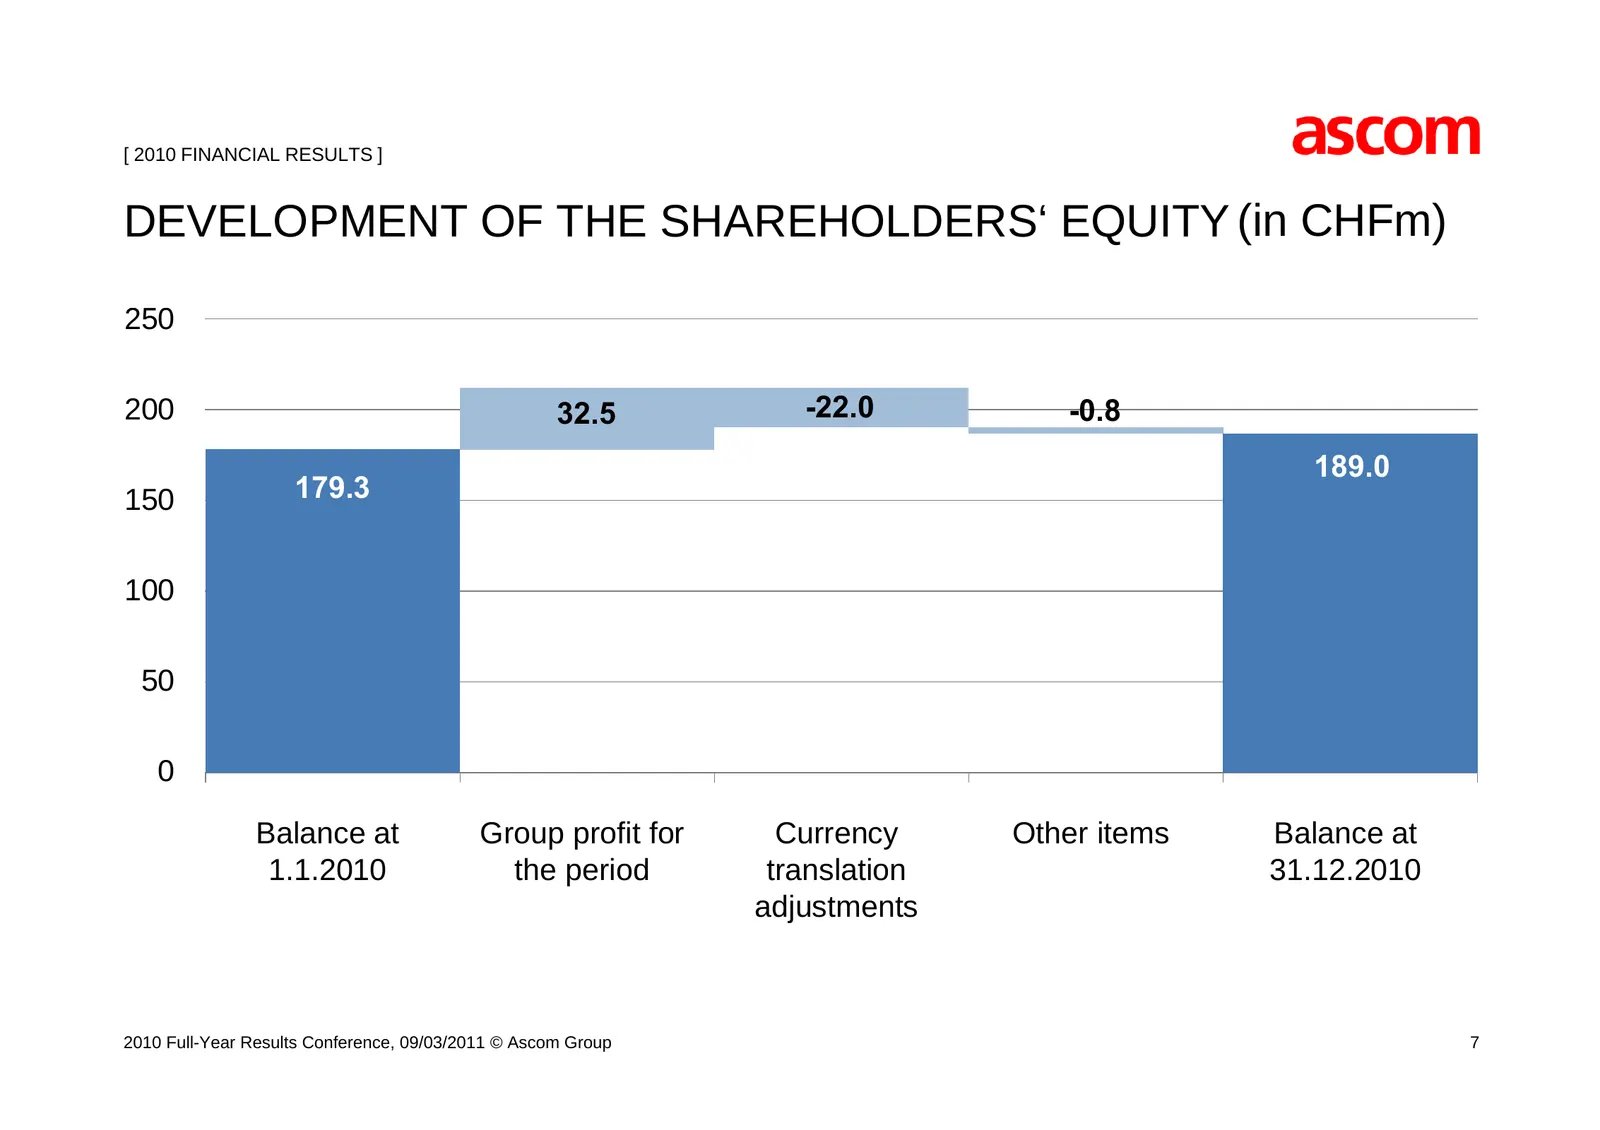
Slide 7: Development of the Shareholders' Equity (in CHFm)
[ 2010 FINANCIAL RESULTS ] DEVELOPMENT OF THE SHAREHOLDERS‘ EQUITY (in CHFm) 250 200 32.5 -22.0 -0.8 189.0 150 179.3 100 50 0 Balance at Group profit for Currency Other items Balance at 1.1.2010 the period translation 31.12.2010 adjustments 2010 Full-Year Results Conference, 09/03/2011 © Ascom Group
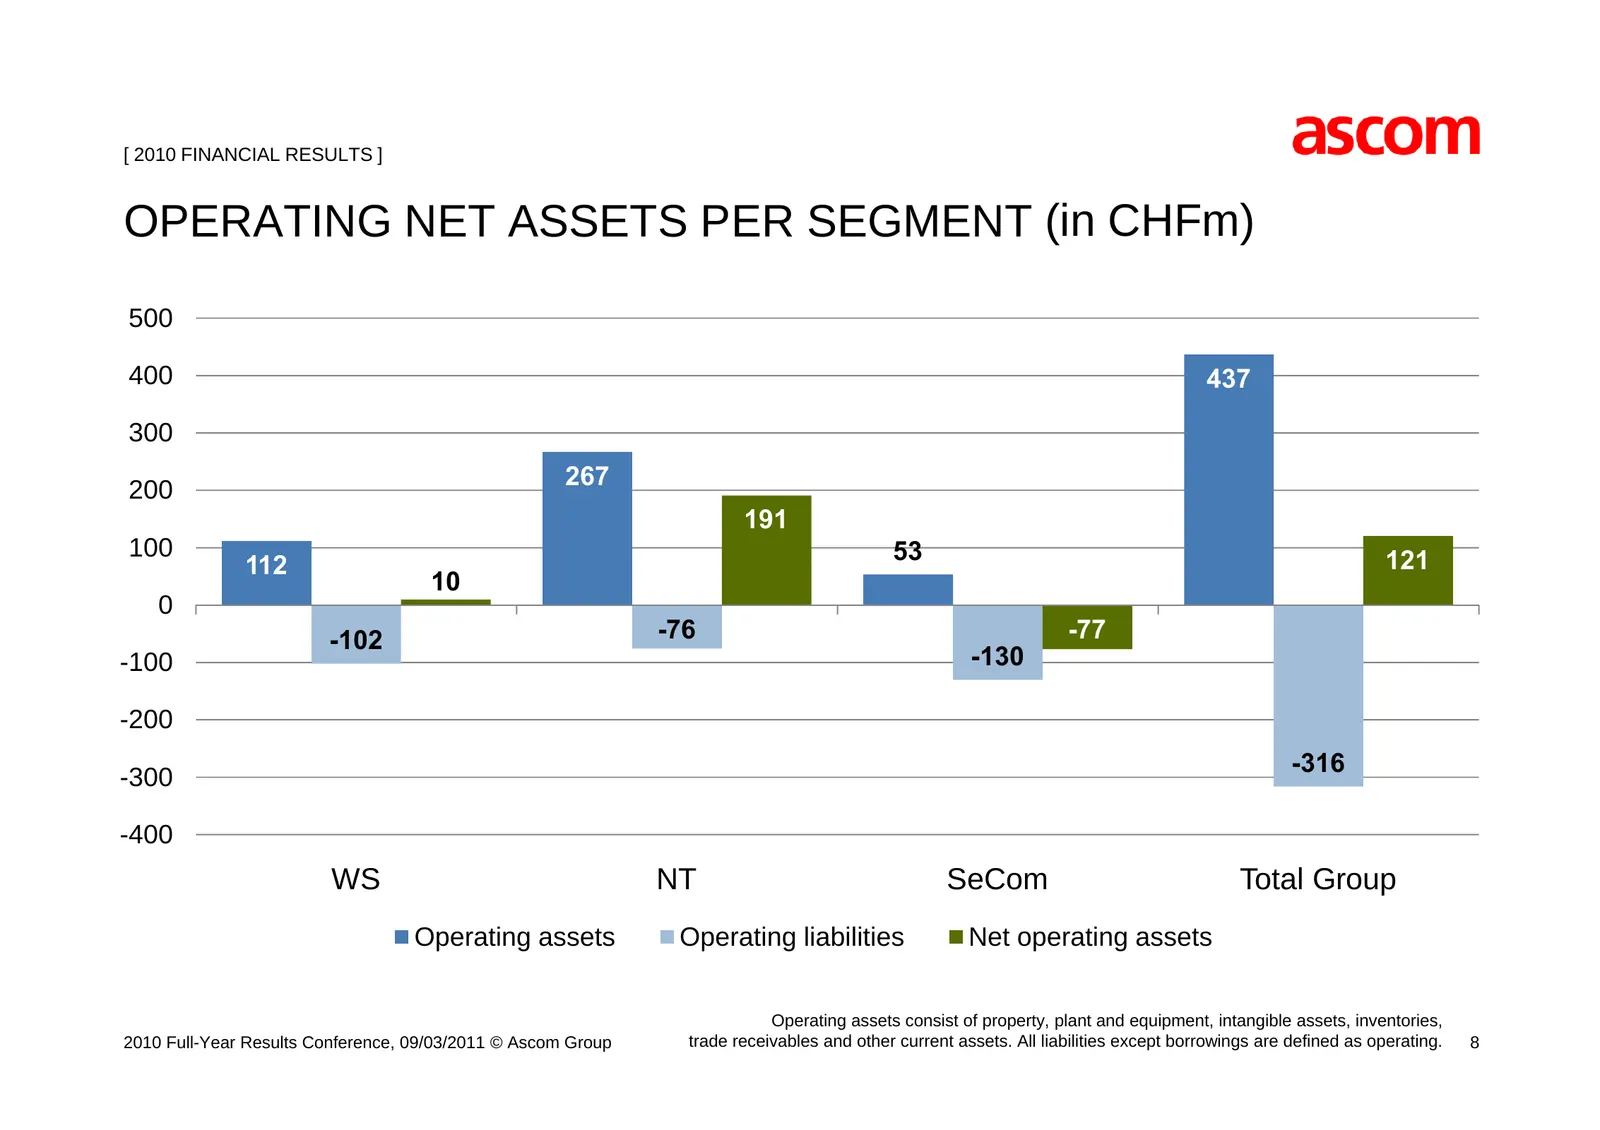
Slide 8: Operating Net Assets per Segment (in CHFm)
[ 2010 FINANCIAL RESULTS ] OPERATING NET ASSETS PER SEGMENT (in CHFm) 500 400 437 300 267 200 191 100 53 121 112 10 0 -102 -76 -77 -100 -130 -200 -316 -300 -400 WS NT SeCom Total Group Operating p g assets Operating p g liabilities Net operating p g assets Operating assets consist of property, plant
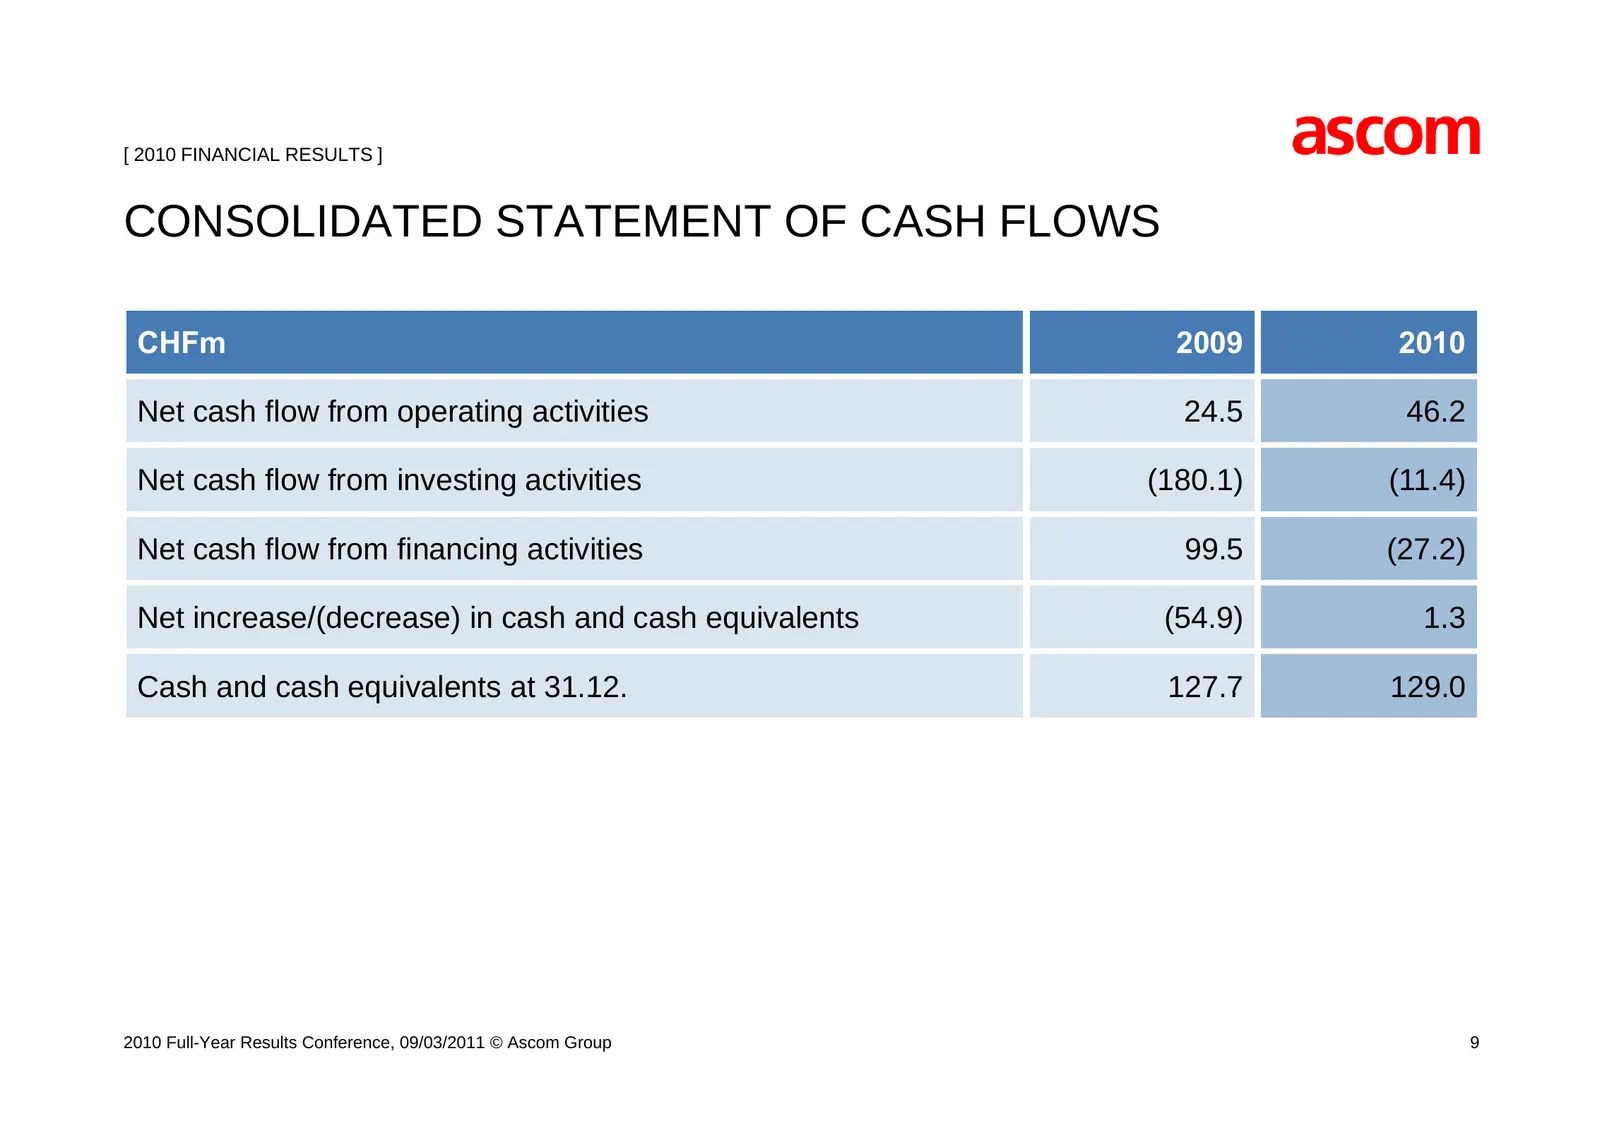
Slide 9: Consolidated Statement of Cash Flows
[ 2010 FINANCIAL RESULTS ] CONSOLIDATED STATEMENT OF CASH FLOWS CHFm 2009 2010 Net cash flow from operating activities 24.5 46.2 Net cash flow from investing activities (180.1) (11.4) g activities Net cash flow from financing 99.5 ((27.2)) Net increase/(decrease) in cash and cash equivalents (54.9)
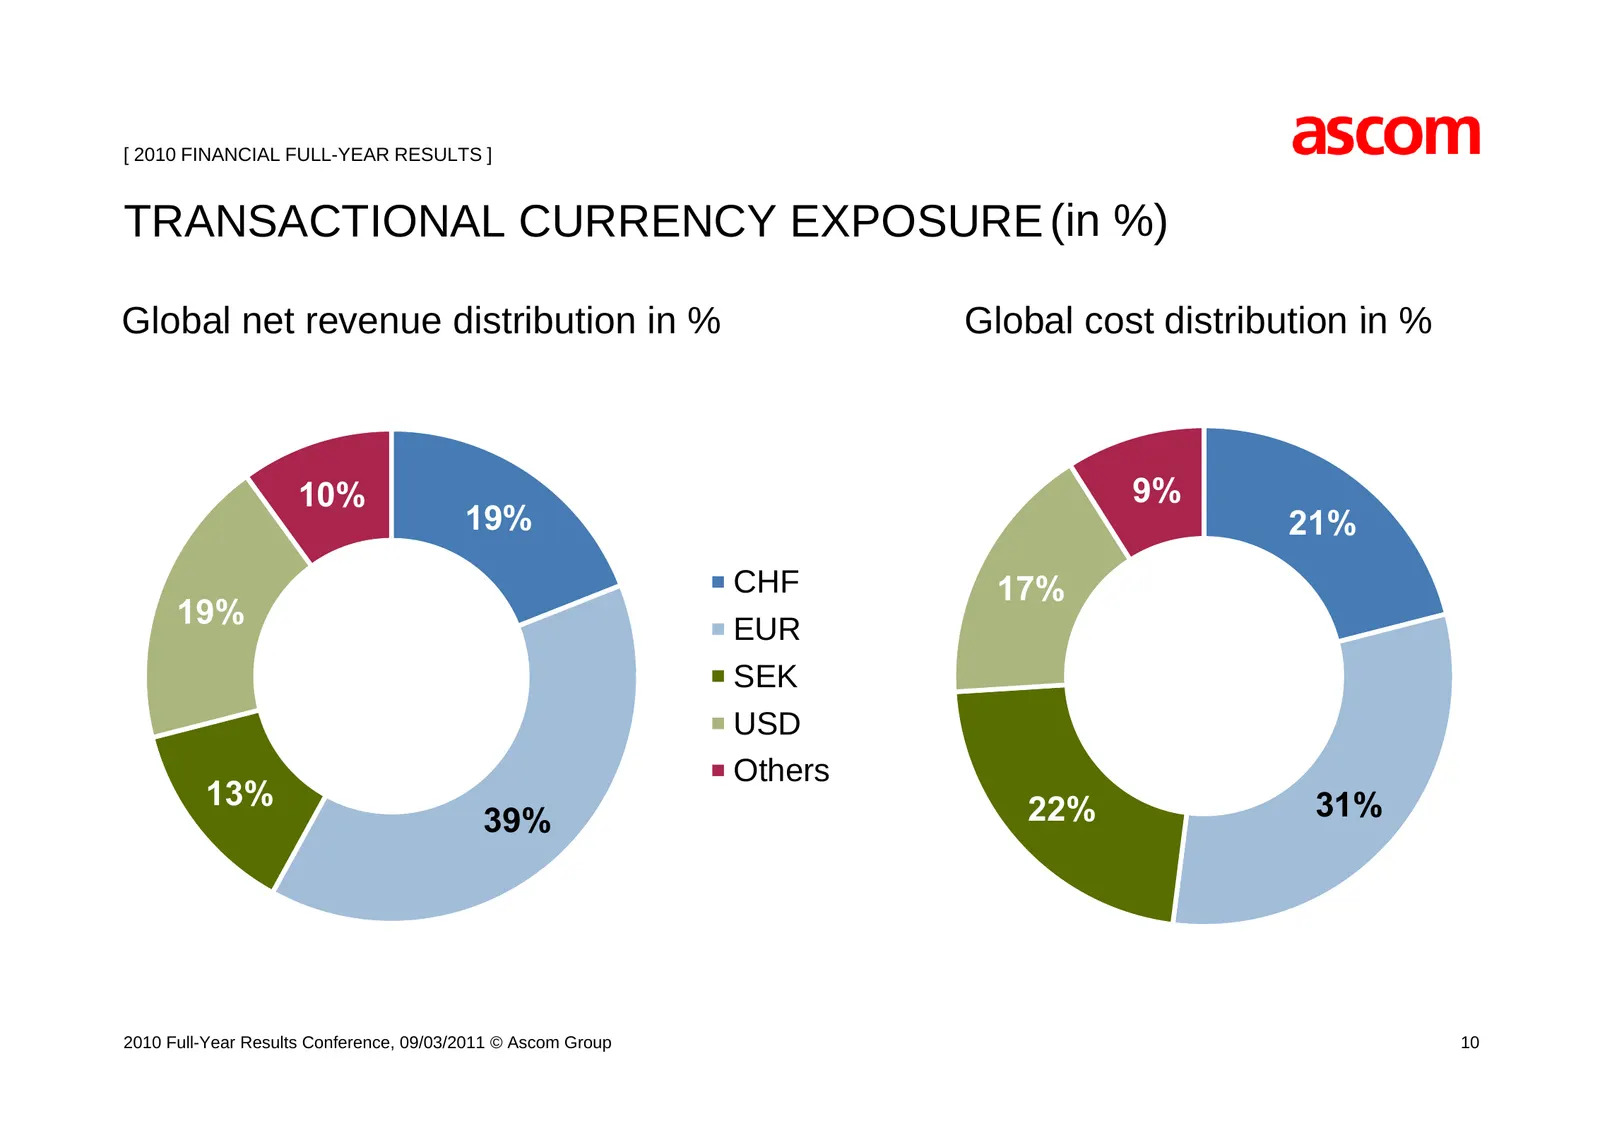
Slide 10: Transactional Currency Exposure (in %)
[ 2010 FINANCIAL FULL-YEAR RESULTS ] TRANSACTIONAL CURRENCY EXPOSURE (in %) Gl b l nett revenue distribution Global di t ib ti iin % Gl b l costt distribution Global di t ib ti iin % 10% 9% 19% 21% CHF 17% 19% EUR SEK USD Others 13% 22% % 31% 39% 2010 Full-Year Results Conference, 09/03/2011 © Ascom
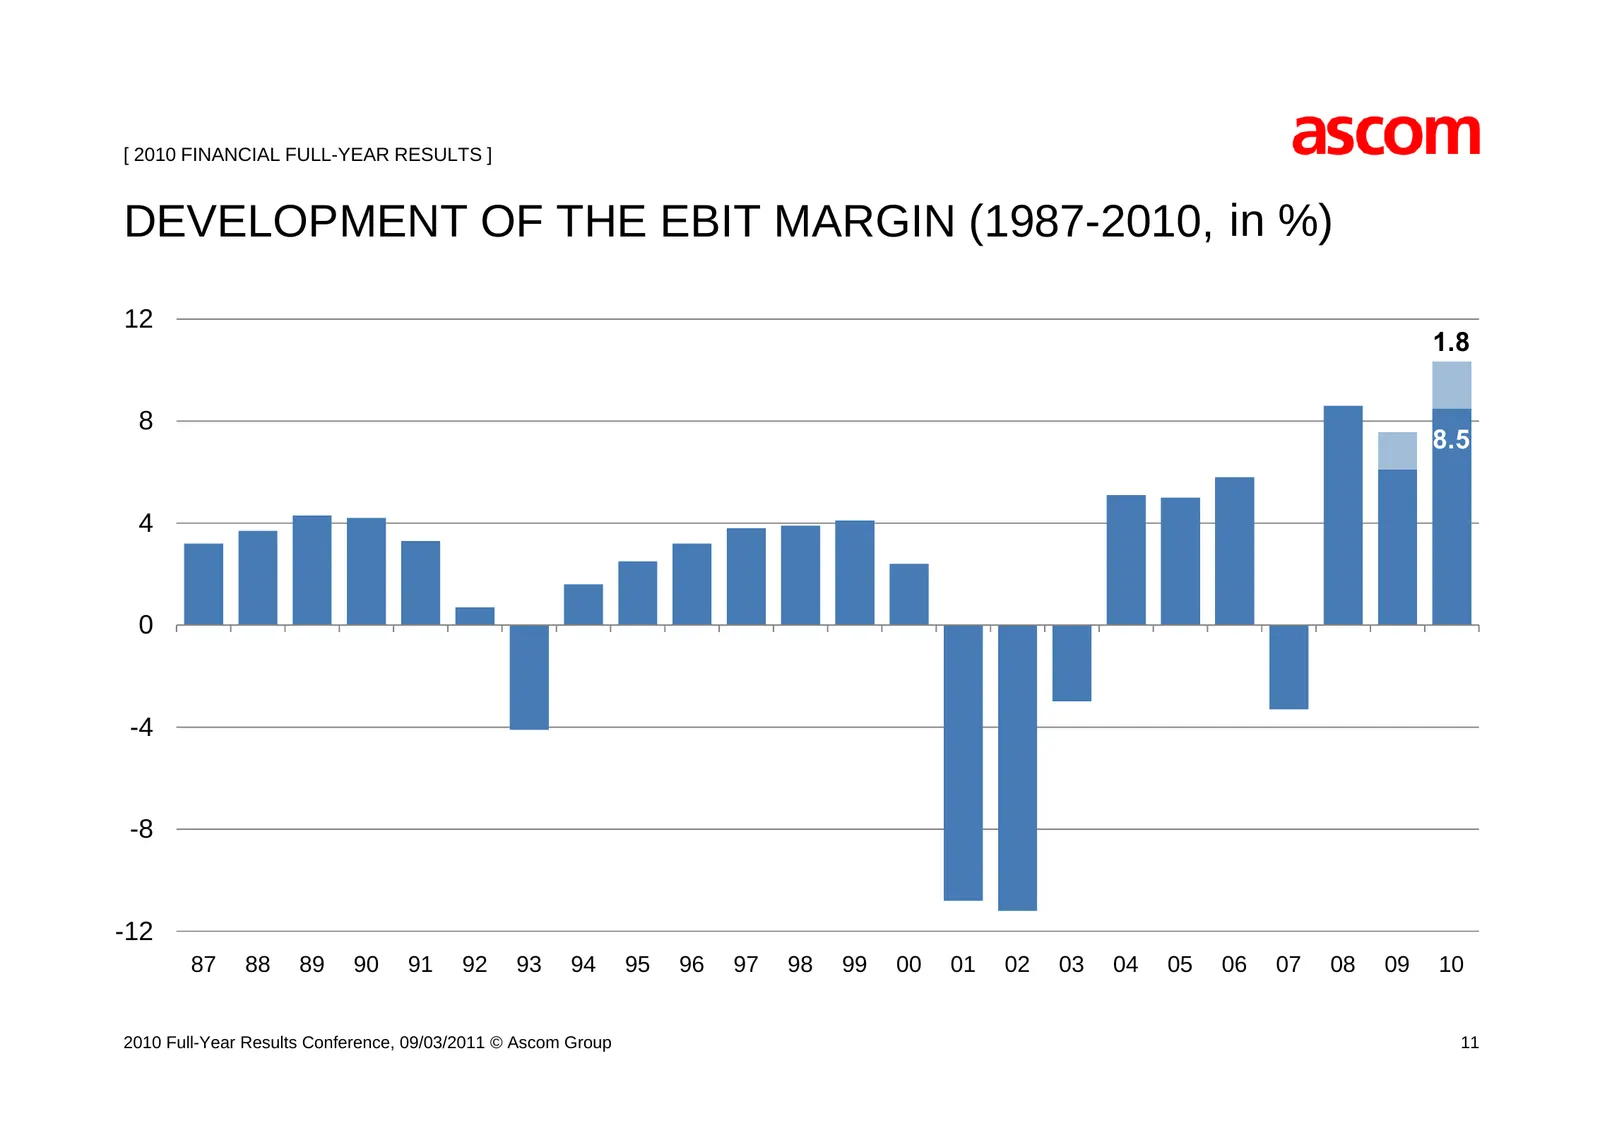
Slide 11: Development of the EBIT Margin (1987-2010, in %)
[ 2010 FINANCIAL FULL-YEAR RESULTS ] DEVELOPMENT OF THE EBIT MARGIN (1987-2010, in %) 12 1.8 8 85 8.5 4 0 -4 -8 8 -12 87 88 89 90 91 92 93 94 95 96 97 98 99 00 01 02 03 04 05 06 07 08 09 10 2010 Full-Year Results Conference, 09/03/2011 © Ascom Group 11
Source: Internet Archive copy of ascom.com