American Railcar Industries Inc
American Railcar Industries — Investor Presentation (May 2012)
27 slides from American Railcar Industries's investor presentation, May 23, 2012
Slide 1
Slide 2: Forward Looking Disclaimer Safe Harbor Statement
Forward Looking Disclaimer Safe Harbor Statement This presentation contains statements relating to expected financial performance and/or future business prospects, events and plans that are forward-looking statements. Forward-looking statements represent the Company's estimates and assumptions only
Slide 3: Management Team Leadership
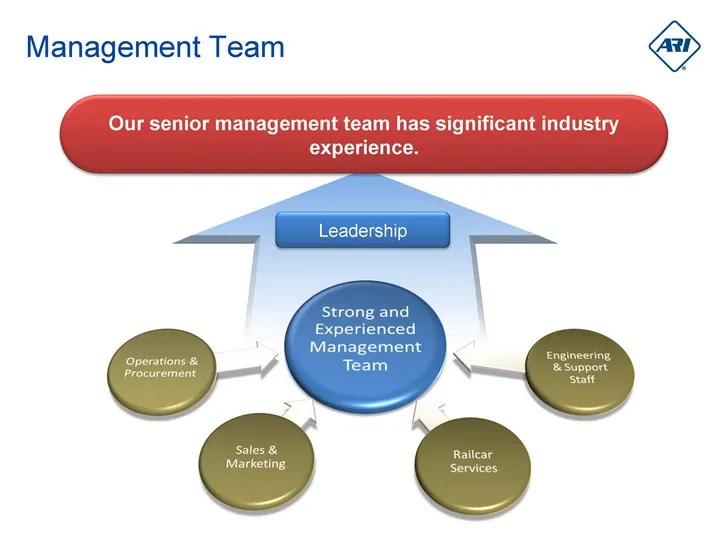
Our senior management team has significant industry experience. Management Team Leadership
Slide 4: More than half of the North American Fleet is Tank and Covered Hopper Railcars
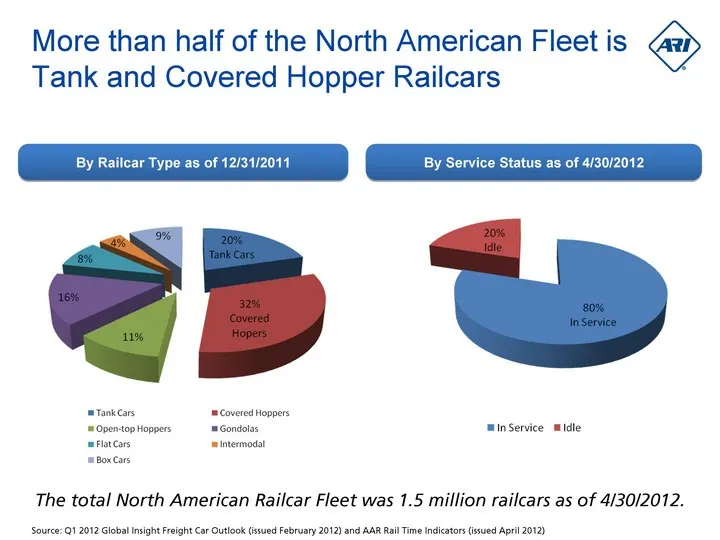
More than half of the North American Fleet is Tank and Covered Hopper Railcars The total North American Railcar Fleet was 1.5 million railcars as of 4/30/2012. By Railcar Type as of 12/31/2011 By Service Status as of 4/30/2012 Source: Q1 2012 Global Insight Freight Car Outlook (issued February 2012)
Slide 5: Age of Fleet will Drive Replacement Demand
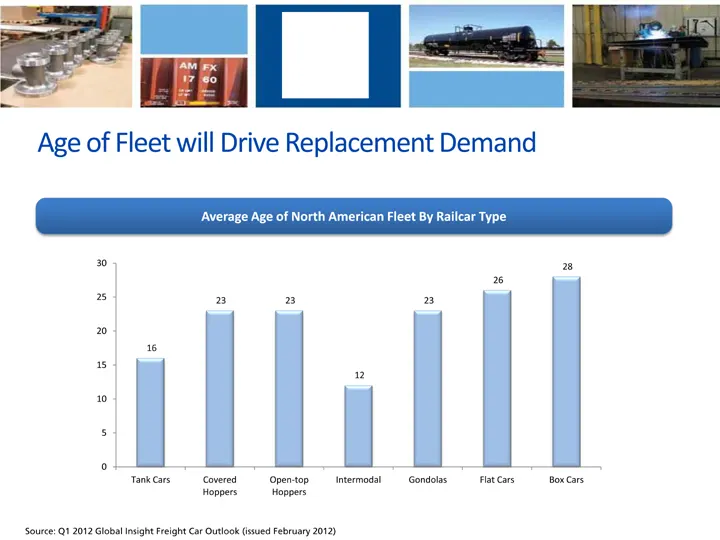
Age of Fleet will Drive Replacement Demand Average Age of North American Fleet By Railcar Type Source: Q1 2012 Global Insight Freight Car Outlook (issued February 2012)
Slide 6: Replacement and Growth Drive Tank and Hopper Demand
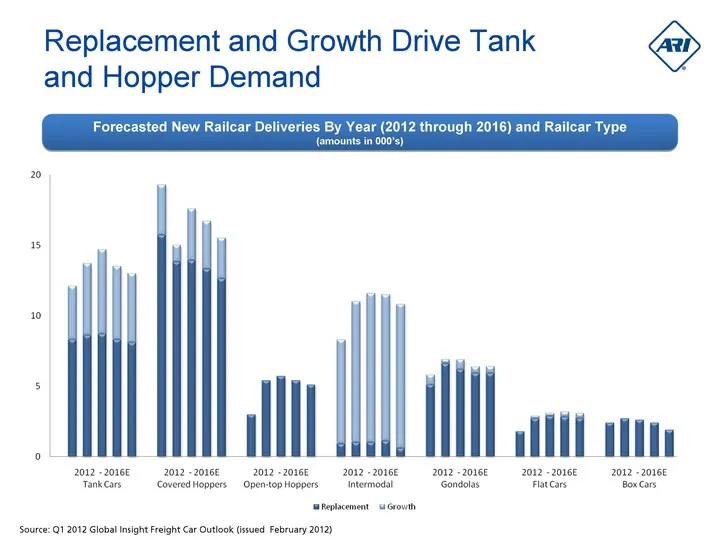
Replacement and Growth Drive Tank and Hopper Demand Forecasted New Railcar Deliveries By Year (2012 through 2016) and Railcar Type (amounts in 000's) Source: Q1 2012 Global Insight Freight Car Outlook (issued February 2012)
Slide 7: Cyclical Industry Trends
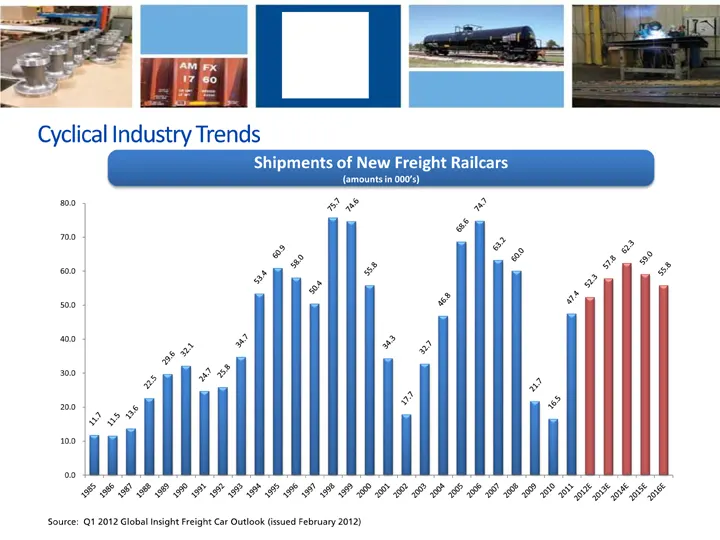
Cyclical Industry Trends Source: Q1 2012 Global Insight Freight Car Outlook (issued February 2012) Shipments of New Freight Railcars (amounts in 000's)
Slide 8: Industry Trends
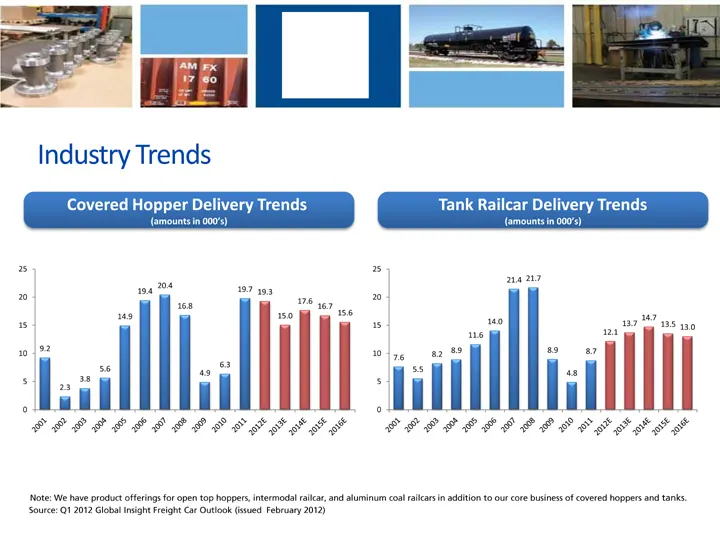
Industry Trends Note: We have product offerings for open top hoppers, intermodal railcar, and aluminum coal railcars in addition to our core business of covered hoppers and tanks. Covered Hopper Delivery Trends (amounts in 000's) Tank Railcar Delivery Trends (amounts in 000's) Source: Q1 2012 Global
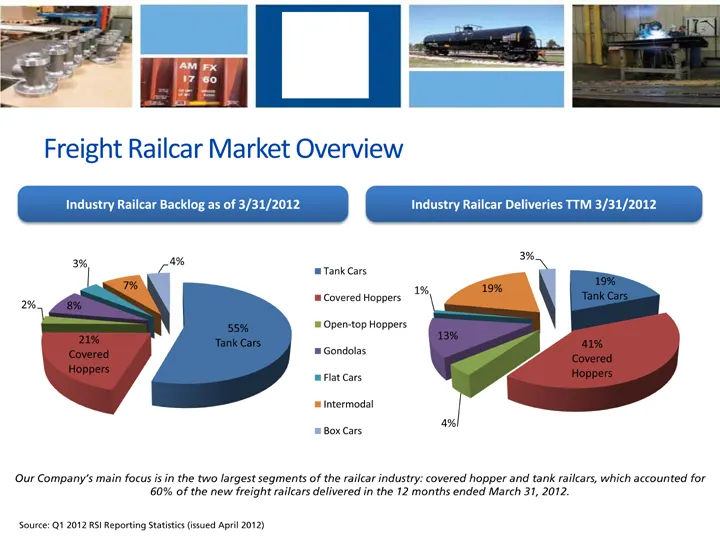
Slide 9: Freight Railcar Market Overview
Freight Railcar Market Overview Our Company's main focus is in the two largest segments of the railcar industry: covered hopper and tank railcars, which accounted for 60% of the new freight railcars delivered in the 12 months ended March 31, 2012. Industry Railcar Backlog as of 3/31/2012 Industry Ra
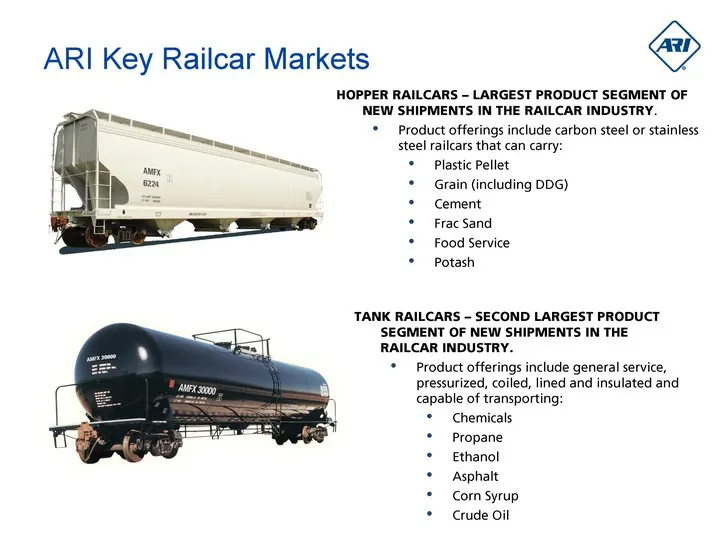
Slide 10: ARI Key Railcar Markets
ARI Key Railcar Markets HOPPER RAILCARS - LARGEST PRODUCT SEGMENT OF NEW SHIPMENTS IN THE RAILCAR INDUSTRY. Product offerings include carbon steel or stainless steel railcars that can carry: Plastic Pellet Grain (including DDG) Cement Frac Sand Food Service Potash TANK RAILCARS - SECOND LARGEST PROD
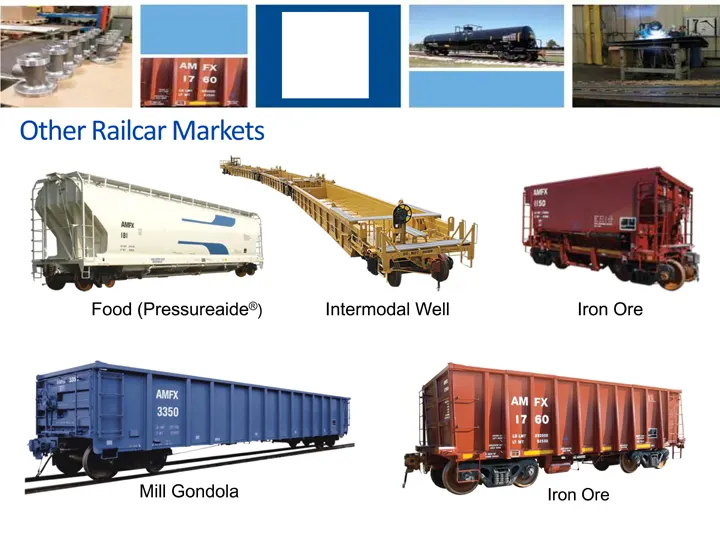
Slide 11: Other Railcar Markets
Other Railcar Markets Food (Pressureaide(r)) Intermodal Well Iron Ore Mill Gondola Iron Ore
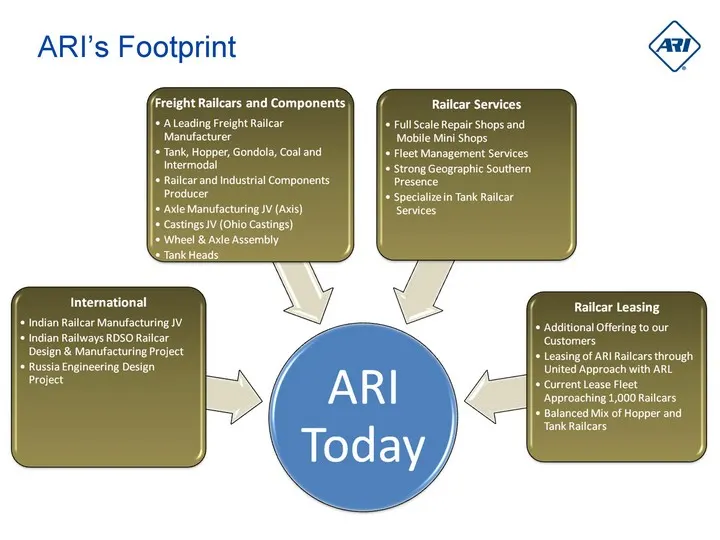
Slide 12: ARI's Footprint
ARI’s Footprint Freight Railcars and Components Railcar Services + ALeaing Freight aa Manuf CR IO ome ese Intermod: + Railcar and Industrial Components + Full Scale Repair Shops and ‘Mobile Mini Shops + Fleet Management Services * Strong Geographic Southern izein Tank Rallear + Axle Manufacturing JV
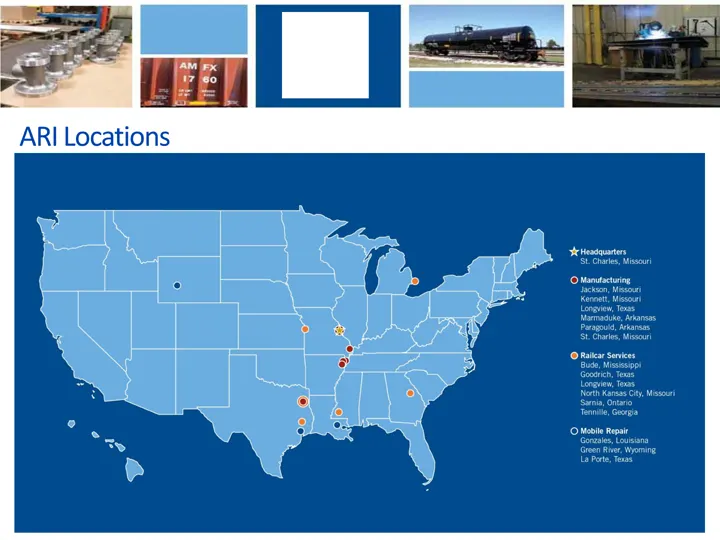
Slide 13: ARI Locations
ARI Locations
Slide 14: Main Facilities
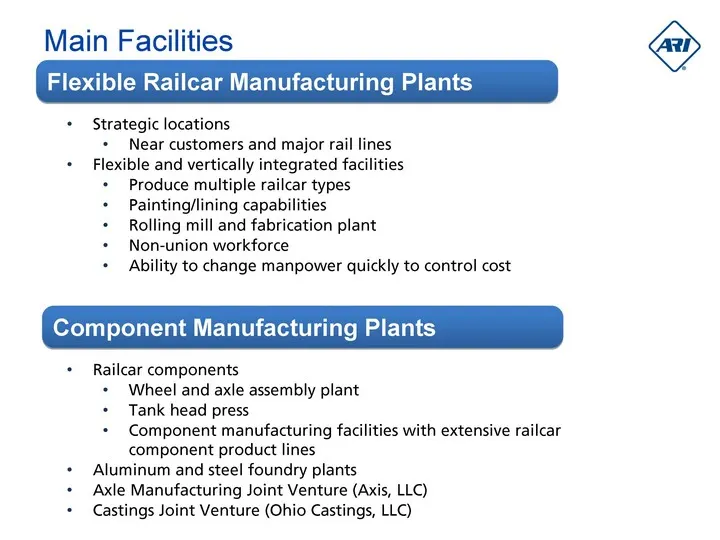
Main Facilities Strategic locations Near customers and major rail lines Flexible and vertically integrated facilities Produce multiple railcar types Painting/lining capabilities Rolling mill and fabrication plant Non-union workforce Ability to change manpower quickly to control cost Railcar componen
Slide 15: Complementary Railcar Services to Diversify Revenue Mix
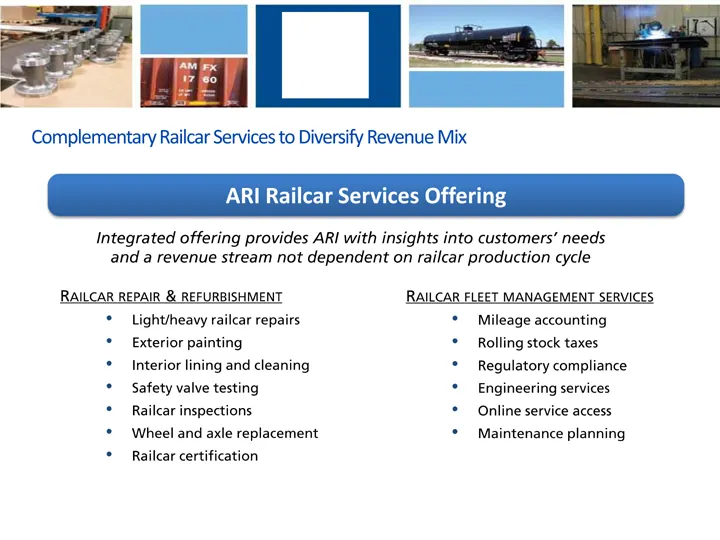
Complementary Railcar Services to Diversify Revenue Mix Integrated offering provides ARI with insights into customers' needs and a revenue stream not dependent on railcar production cycle RAILCAR REPAIR & REFURBISHMENT Light/heavy railcar repairs Exterior painting Interior lining and cleaning Safety
Slide 16: Vertical Integration
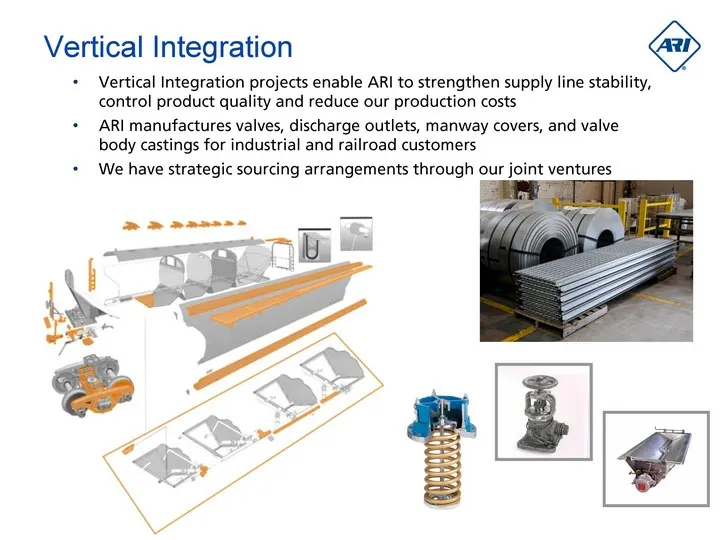
Vertical Integration Vertical Integration projects enable ARI to strengthen supply line stability, control product quality and reduce our production costs ARI manufactures valves, discharge outlets, manway covers, and valve body castings for industrial and railroad customers We have strategic sourci
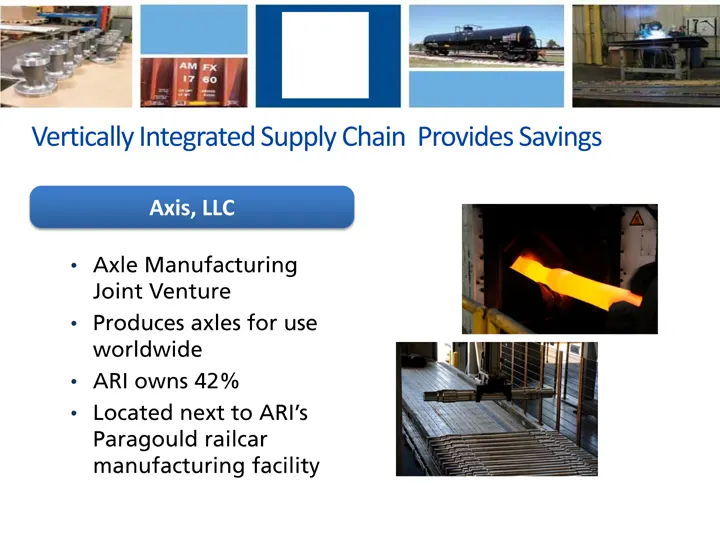
Slide 17: Vertically Integrated Supply Chain Provides Savings: Axis, LLC
Vertically Integrated Supply Chain Provides Savings Axle Manufacturing Joint Venture Produces axles for use worldwide ARI owns 42% Located next to ARI's Paragould railcar manufacturing facility Axis, LLC
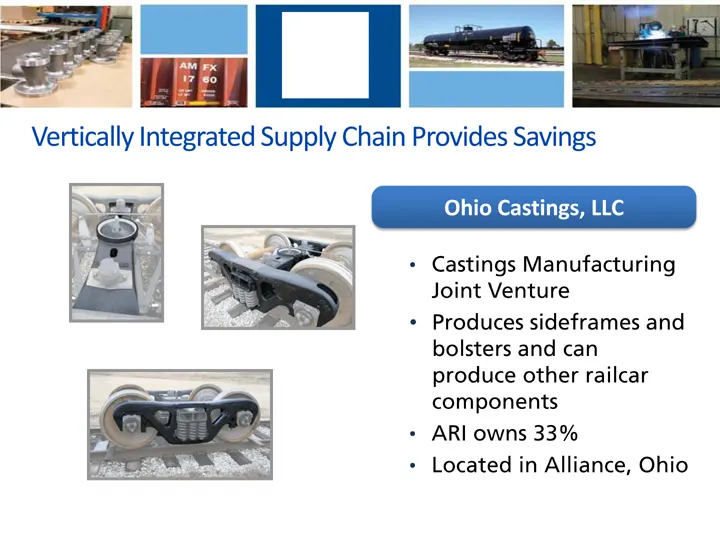
Slide 18: Vertically Integrated Supply Chain Provides Savings: Ohio Castings, LLC
Vertically Integrated Supply Chain Provides Savings Castings Manufacturing Joint Venture Produces sideframes and bolsters and can produce other railcar components ARI owns 33% Located in Alliance, Ohio Ohio Castings, LLC
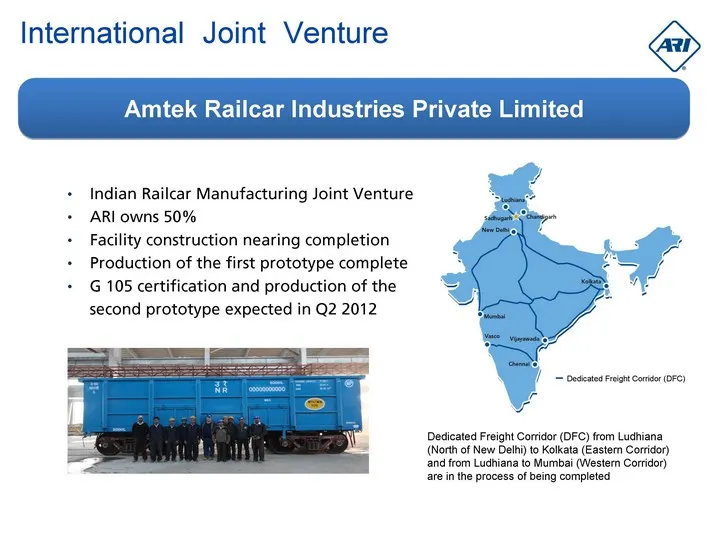
Slide 19: International Joint Venture: Indian Railcar Manufacturing
International Joint Venture Indian Railcar Manufacturing Joint Venture ARI owns 50% Facility construction nearing completion Production of the first prototype complete G 105 certification and production of the second prototype expected in Q2 2012 Amtek Railcar Industries Private Limited Dedicated Fr
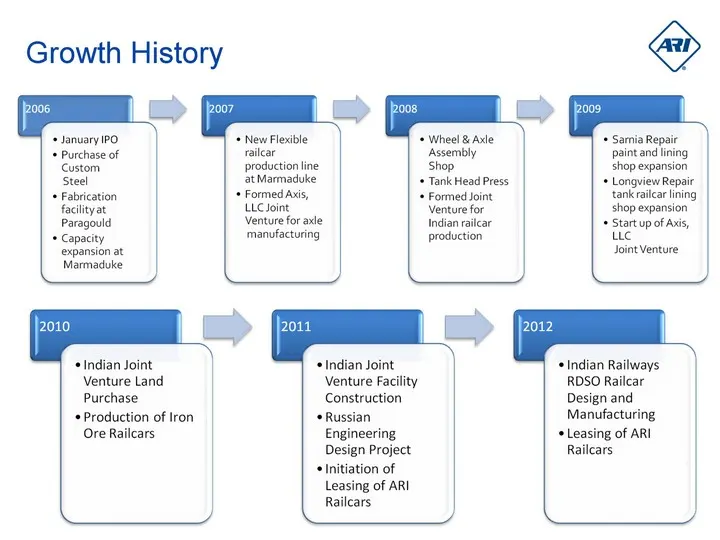
Slide 20: Growth History
Growth History BS + Wheel & Axle ‘Assembly ir ‘January IPO + Sarnia Re paint and lining ‘shop expansion * Longview Repair tankrailar lining ‘expansion + Startup of Axis, Tank Head Press * Formed Joint Venture for Indian railcar ‘manufacturing itt Joint Venture ‘Indian Joint ‘Indian Railways Venture
Slide 21: Objectives and Long-Term Strategies
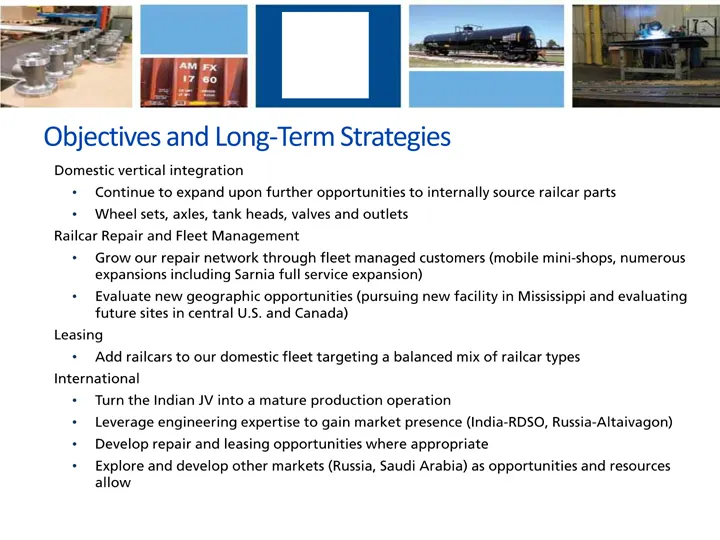
Objectives and Long-Term Strategies
Slide 22: Growth and Cost Reduction Initiatives
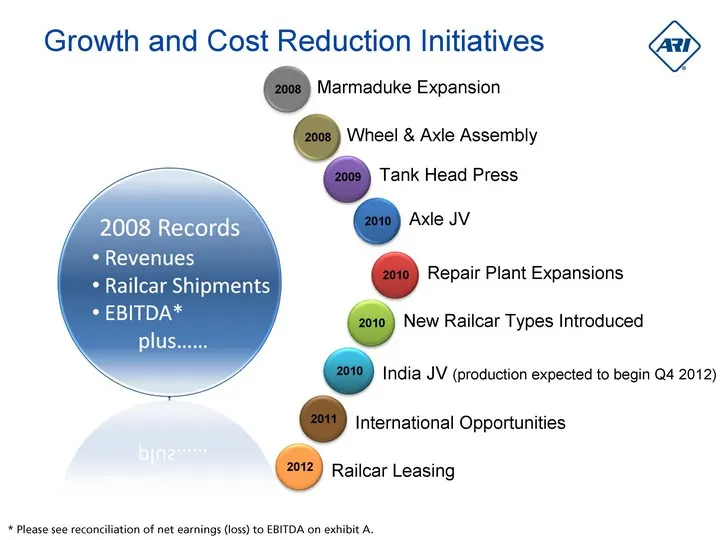
Growth and Cost Reduction Initiatives * Please see reconciliation of net earnings (loss) to EBITDA on exhibit A. 2008 2008 2010 2009 2010 2010 2010 2011 2012
Slide 23: Our Financial History
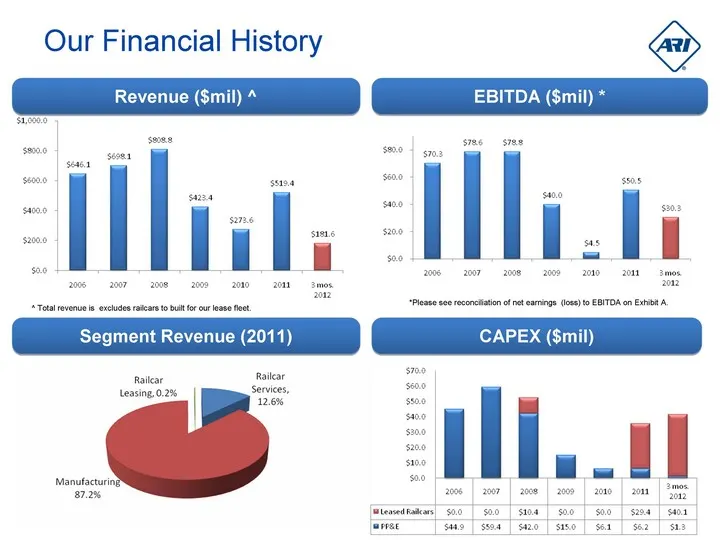
Our Financial History Revenue ($mil) ^ Segment Revenue (2011) EBITDA ($mil) * CAPEX ($mil) *Please see reconciliation of net earnings (loss) to EBITDA on Exhibit A. ^ Total revenue is excludes railcars to built for our lease fleet.
Slide 24: Quarterly Financial Comparison
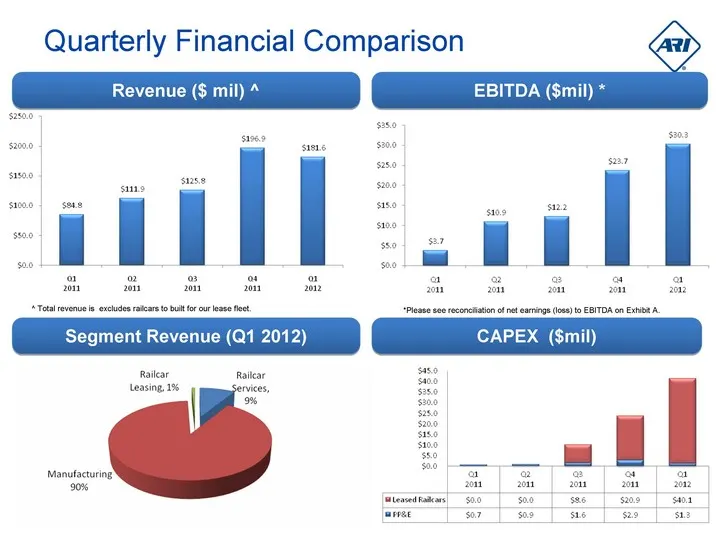
Quarterly Financial Comparison Revenue ($ mil) ^ Segment Revenue (Q1 2012) EBITDA ($mil) * CAPEX ($mil) *Please see reconciliation of net earnings (loss) to EBITDA on Exhibit A. ^ Total revenue is excludes railcars to built for our lease fleet.
Slide 25: Exhibit A - EBITDA Reconciliation
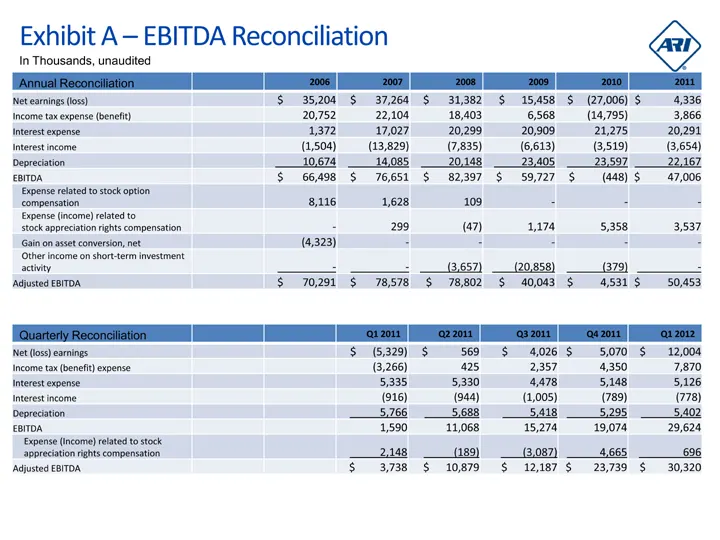
2006 2007 2008 2009 2010 2011 Net earnings (loss) $ 35,204 $ 37,264 $ 31,382 $ 15,458 $ (27,006) $ 4,336 Income tax expense (benefit) 20,752 22,104 18,403 6,568 (14,795) 3,866 Interest expense 1,372 17,027 20,299 20,909 21,275 20,291 Interest income (1,504) (13,829) (7,835) (6,613) (3,519) (3,654) D
Slide 26: EBITDA definition and non-GAAP note
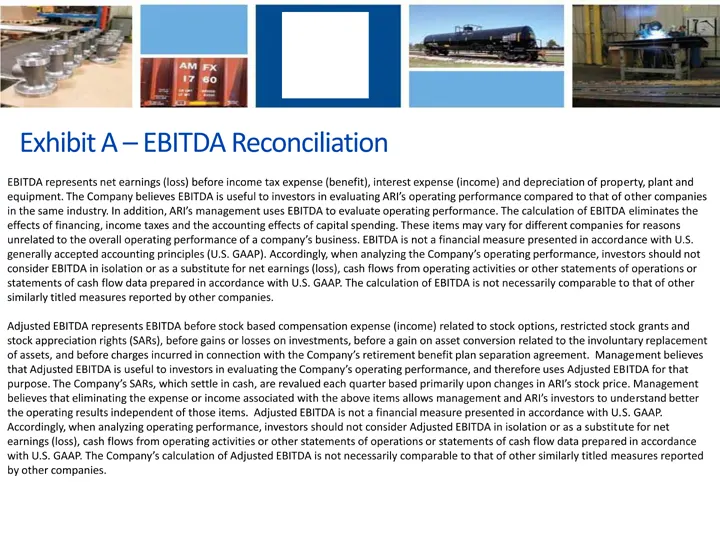
EBITDA represents net earnings (loss) before income tax expense (benefit), interest expense (income) and depreciation of property, plant and equipment. The Company believes EBITDA is useful to investors in evaluating ARI's operating performance compared to that of other companies in the same industr
Slide 27: Agile, Responsive, Innovative
AGILE RESPONSIVE INNOVATIVE Ba —=== ———_S====z=a | NO. A Ramee
Source: SEC EDGAR · 8-K filed May 23, 2012
More decks from American Railcar Industries Inc
 Q3 2018 Earnings Presentation19 slides · Oct 30, 2018
 Investor Presentation (August 2018)26 slides · Aug 24, 2018
 Q2 2018 Earnings Presentation19 slides · Aug 1, 2018
 Q1 2018 Earnings Presentation18 slides · May 1, 2018
 Q4 2017 Earnings Presentation19 slides · Feb 23, 2018
 Cowen conference 201824 slides · Feb 6, 2018