National Penn Bancshares — Investor Presentation (November 2010)
30 slides from National Penn Bancshares's investor presentation, Nov 12, 2010

Slide 1: National Penn Bancshares, Inc.
EXHIBIT 99.2 11/10/2010 National Penn Bancshares, Inc.

Slide 2: Non-GAAP Financial Measures / Safe Harbor
This presentation, including the attached Financial Highlights and financial data tables, contains supplemental financial information determined by methods other than in accordance with Accounting Principles Generally Accepted in the United States of America (“GAAP”). National Penn’s management uses
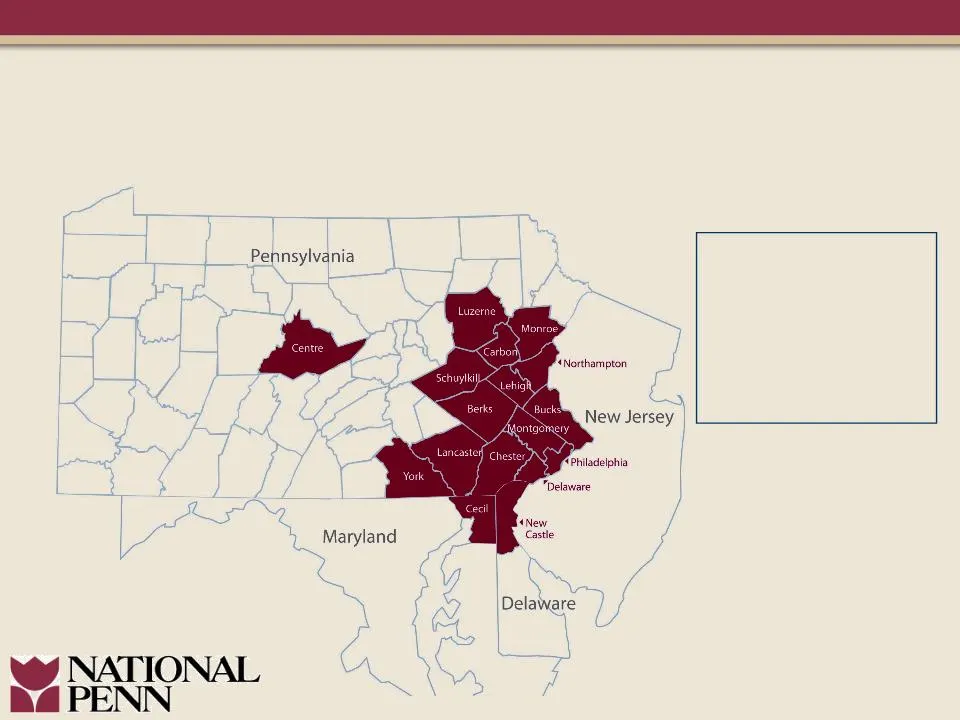
Slide 3: Attractive Franchise in the Heart of the Mid-Atlantic Region
• 4 th largest bank in PA • $9.2 billion assets • $983 million market cap* • 127 offices • 1,779 employees * 11/4/2010 Attractive Franchise in the Heart of the Mid-Atlantic Region

Slide 4: Strong Market Share in Demographically Attractive Counties
Northampton Lehigh Berks Centre Chester % of National Penn Deposits 15.8% 8.8% 22.0% 5.7% 12.9% Market Rank 2 2 2 1 5 Market Share 19.5% 9.0% 18.3% 16.8% 7.9% # Community Banking Offices 22 14 21 5 17 Median Household Income ($000) $59.5 $57.7 $58.1 $47.0 $87.1 Nationwide Median HH Income ($000) $54

Slide 5: Clean, Strong, Efficient
Clean, Strong, Efficient l Earnings improving l Favorable asset quality trends l Warburg Pincus partnership l Strong balance sheet for future growth

Slide 6: Warburg Pincus Investment Terms
Warburg Pincus Investment Terms l $150 million in common stock through the purchase of 24.8 million shares at $6.05 per share – Represents an “at the market” price on a 30-day trailing average – No warrants or other equity enhancement securities l Warburg Pincus sole investor, after significant due

Slide 7: Value of Warburg Pincus Partnership
Value of Warburg Pincus Partnership l Sophisticated global investor with growth and long term shareholder value creation focus l Performed extensive due diligence, validating asset quality, capital and balance sheet strength, and strategic vision – Firms supporting Warburg’s diligence included: KPMG
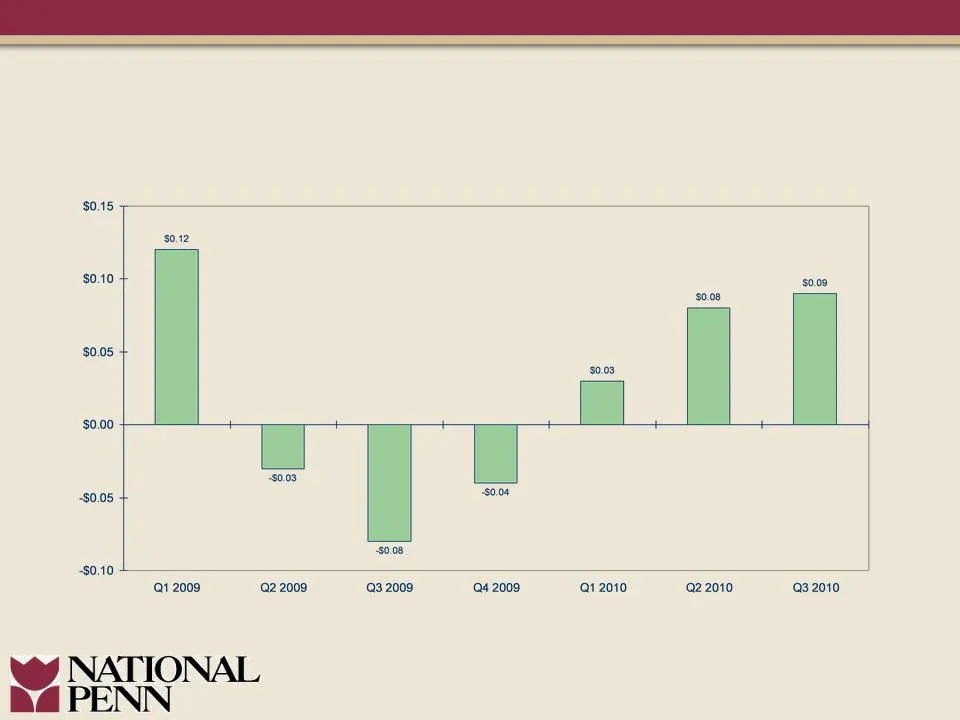
Slide 8: Improving Adjusted Earnings Per Share
($000) Note: Adjusted earnings per share is a non-GAAP measurement. Refer to appendix for reconciliation to GAAP measurement. Improving Adjusted Earnings Per Share
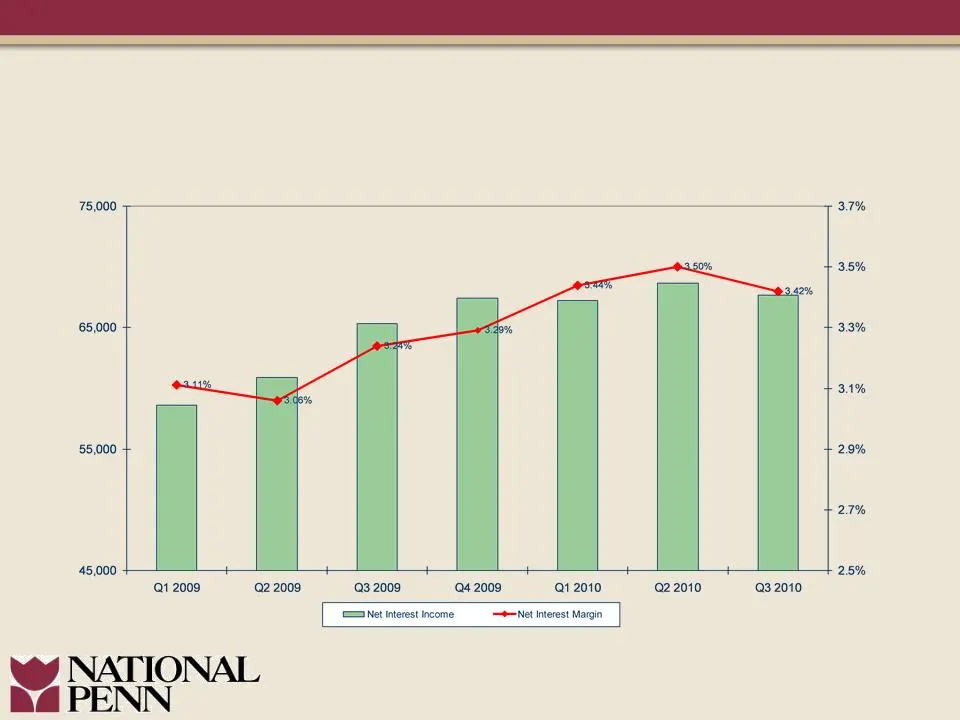
Slide 9: Net Interest Income and Net Interest Margin
75,000 65,000 55,000 45,000 Q1 2009 @22009 93.2009 4 2009 Qt 2010 Net Interest income Net interest Margin 2.2010 23.2010 3.7% 35% 3.3% 3.1% 29% 27% 25%
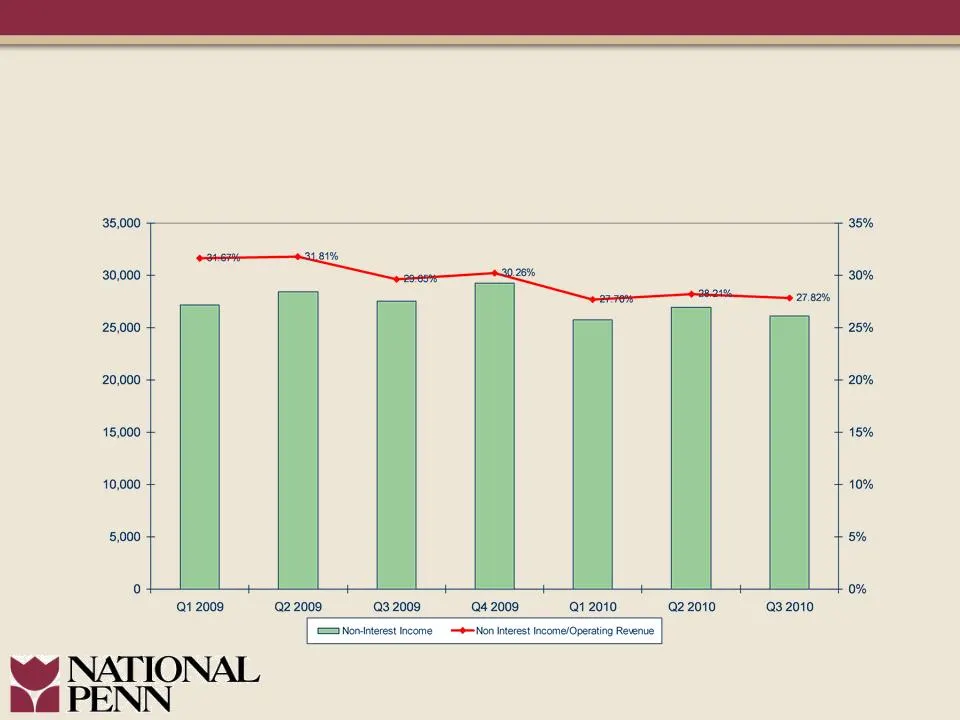
Slide 10: Non-Interest Income
($000) Note: Excludes certain items. Refer to appendix for a reconciliation to reported non-interest income and for calculation of non-interest income/ operating revenue Non-Interest Income
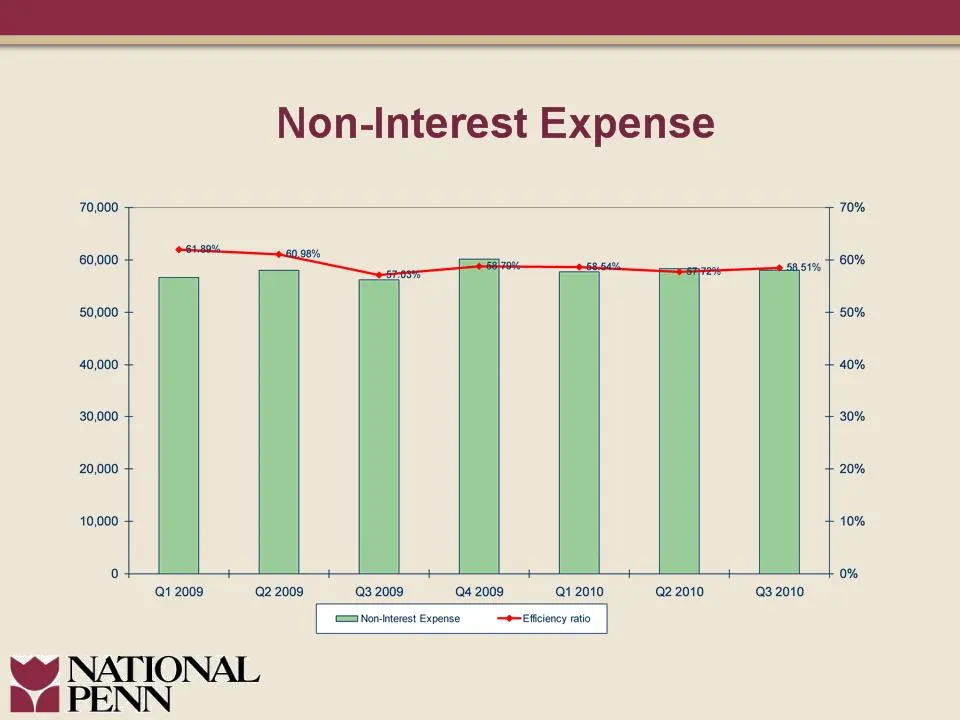
Slide 11: Non-Interest Expense and Efficiency Ratio
($000) Note: Excludes certain items. Refer to appendix for a reconciliation to reported non-interest expense and for calculation of efficiency ratio
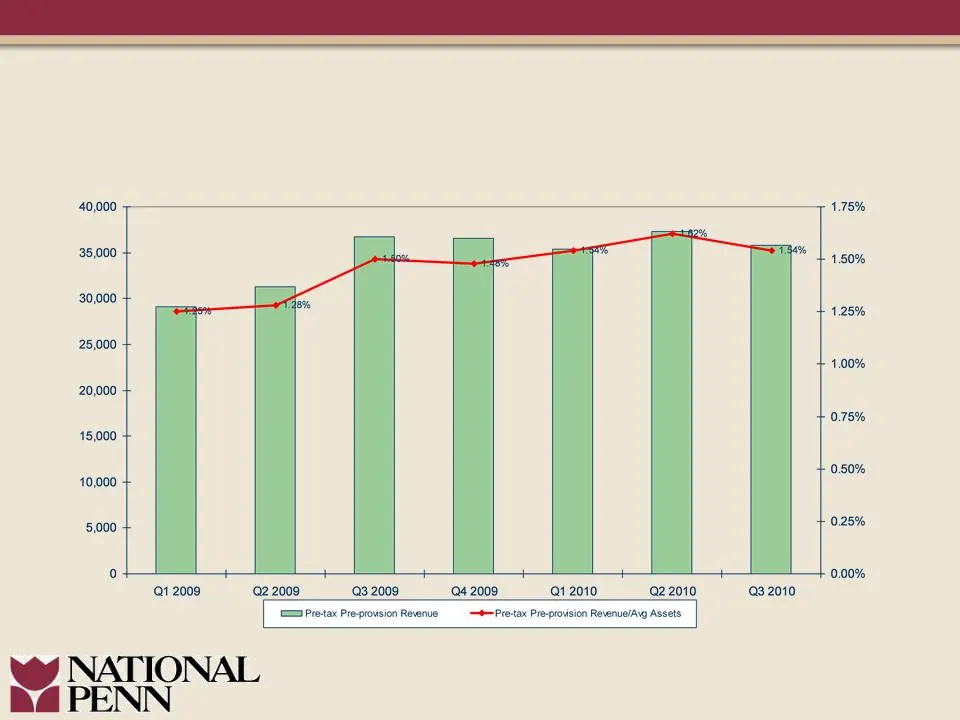
Slide 12: Pre-tax Pre-Provision Revenue
($000) Note: Refer to appendix for calculation Pre-tax Pre-Provision Revenue
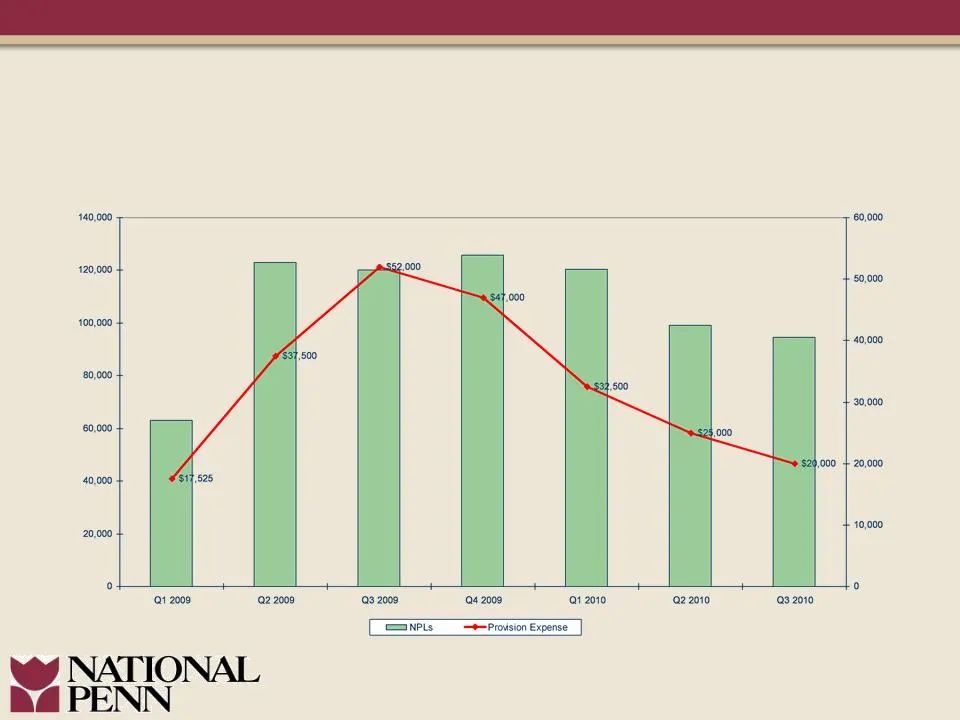
Slide 13: Non-Performing Loans Declining
($000) Note: NPL’s include non-accrual loans, renegotiated loans and loans 90+ days delinquent Non-Performing Loans Declining
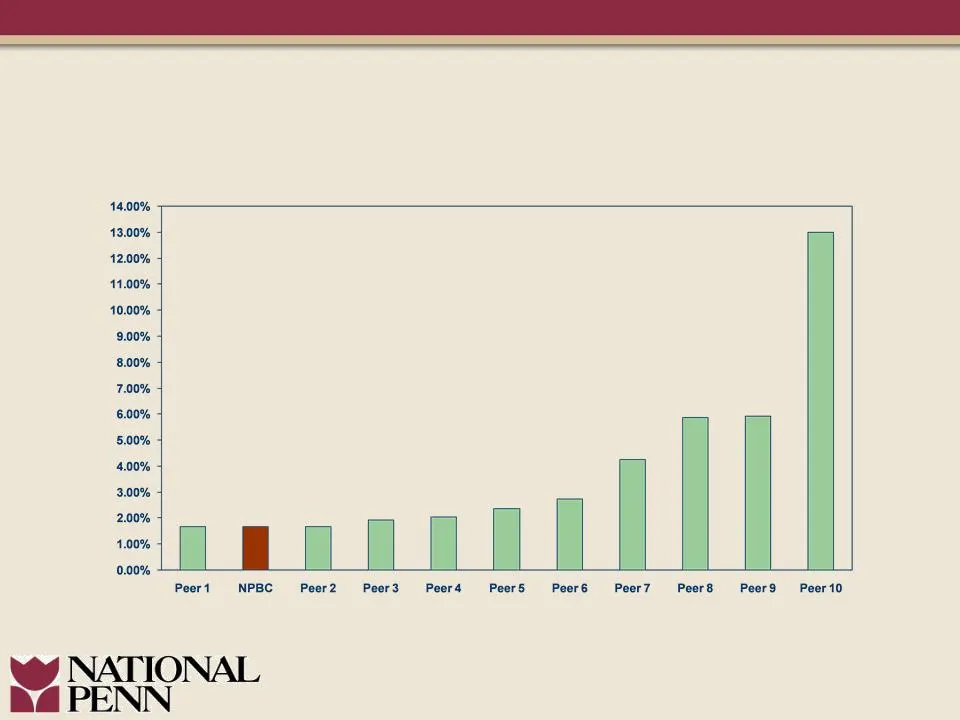
Slide 14: Strong Asset Quality
Note: NPL’s include non-accrual loans, renegotiated loans and loans 90+ days delinquent Peer data is for peer banks, as defined in April 2009 proxy statement, with 9/30/2010 data available Strong Asset Quality Non-Performing Loans as a % of Loans
Slide 15: Strong Reserve Coverage
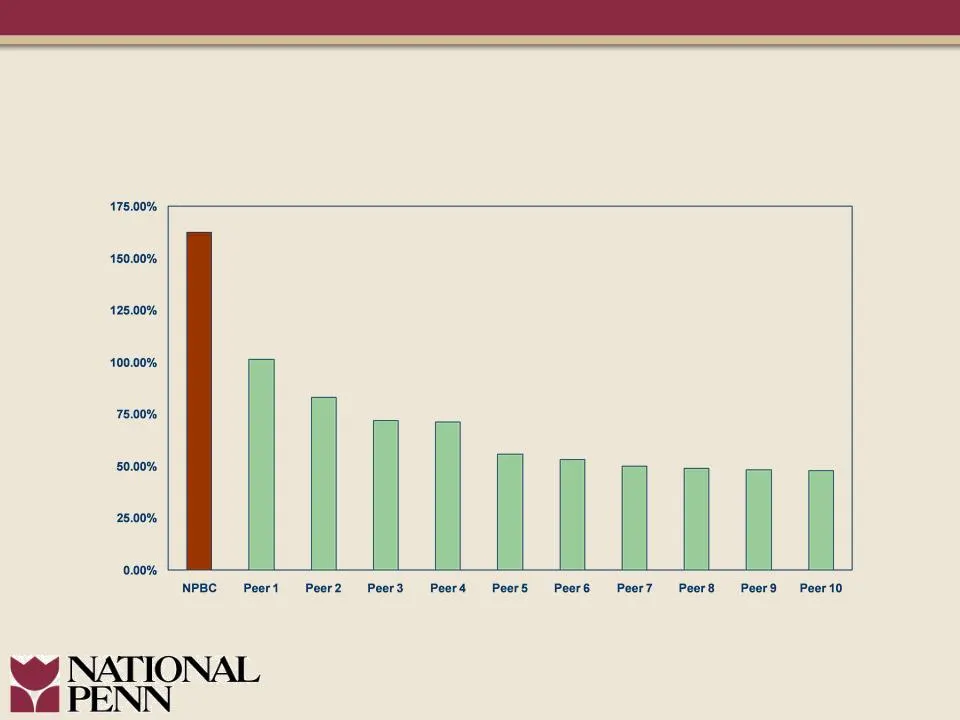
Note: NPL’s include non-accrual loans, renegotiated loans and loans 90+ days delinquent Peer data is for peer banks, as defined in April 2009 proxy statement, with 9/30/2010 data available Strong Reserve Coverage ALLL as a % of Non-Performing Loans
Slide 16: Increasing Capital Levels
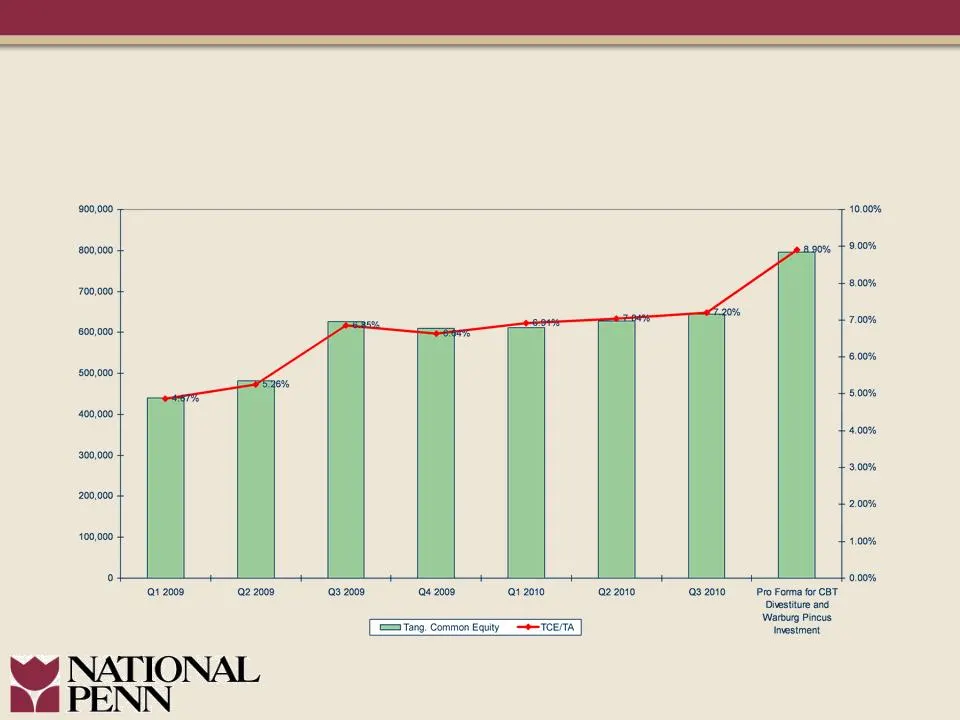
($000) Increasing Capital Levels
Slide 17: Strong Capital Ratios
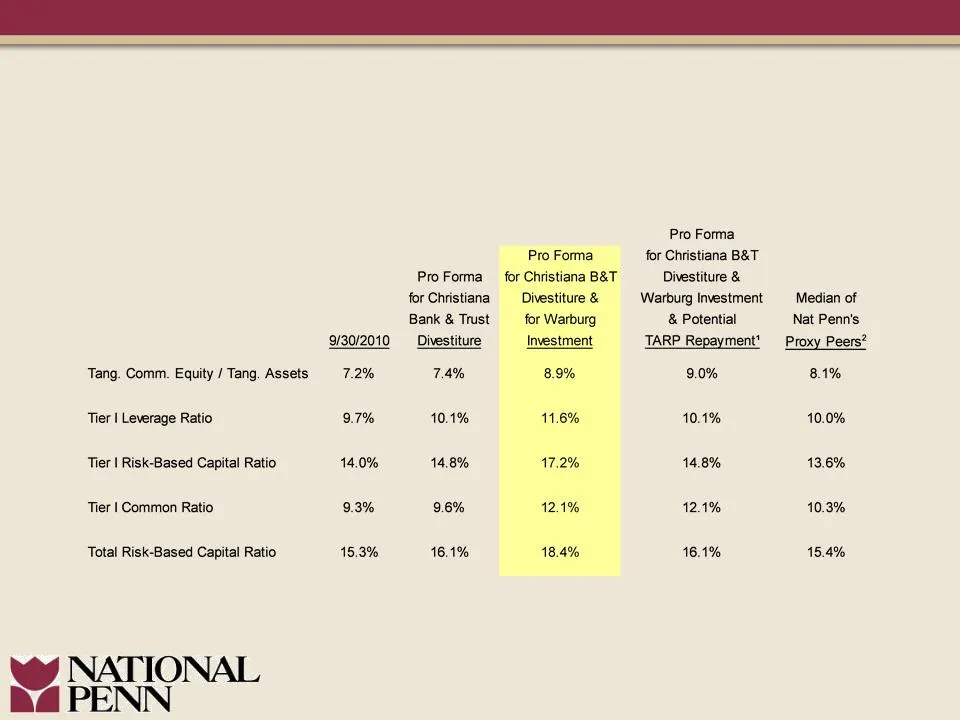
(1) Does not assume repurchase of the 735,294 outstanding warrants, valued at approximately $1.0 million based on a binomial valuation (2) Peer data as of 9/30/2010 Strong Capital Ratios
Slide 18: First Quarter 2010
First Quarter 2010 l Deleveraged balance sheet by reducing higher cost, non-retail deposits – Accretive to margin – Improved capital ratios l Continued de-risking of balance sheet – NPLs declined – Reserves/ NPLs increased to 127.8% from 116.3%
Slide 19: Second Quarter 2010
Second Quarter 2010 l Evaluated risk/ reward profile of lines of business/ products l Announced divestiture of Christiana Bank & Trust – Goodwill reduced by $24 million – Accretive to capital ratios – Enhances holding company liquidity – Improves risk profile – Utilizes 338(h)10 election l Announced
Slide 20: Third Quarter 2010
Third Quarter 2010 l Enhance ability to repay TARP l Raised $150 million from Warburg Pincus – No discount – No warrants l Evaluated ALCO initiatives to address margin pressures due to de-risking and liquidity l Continued de-risking of balance sheet – NPLs declined – Classified loans declined – Rese
Slide 21: Fourth Quarter 2010
Fourth Quarter 2010 l Complete divestiture of Christiana Bank & Trust l Complete Warburg Pincus investment l Continue to de-risk balance sheet

Slide 22: Longer-term Earnings Capacity
Longer-term Earnings Capacity l Accelerate repayment of TARP

Slide 23: Longer-term Earnings Capacity
Longer-term Earnings Capacity l Accelerate repayment of TARP l Position for improving economic conditions – Aggressively pursuing new customer relationships

Slide 24: Longer-term Earnings Capacity
Longer-term Earnings Capacity l Accelerate repayment of TARP l Position for improving economic conditions – Aggressively pursuing new customer relationships l Culture of addressing issues, not deferring – Results in a strong balance sheet

Slide 25: Longer-term Earnings Capacity
Longer-term Earnings Capacity l Accelerate repayment of TARP l Position for improving economic conditions – Aggressively pursuing new customer relationships l Culture of addressing issues not deferring – Results in a strong balance sheet l Longer term capital management opportunities
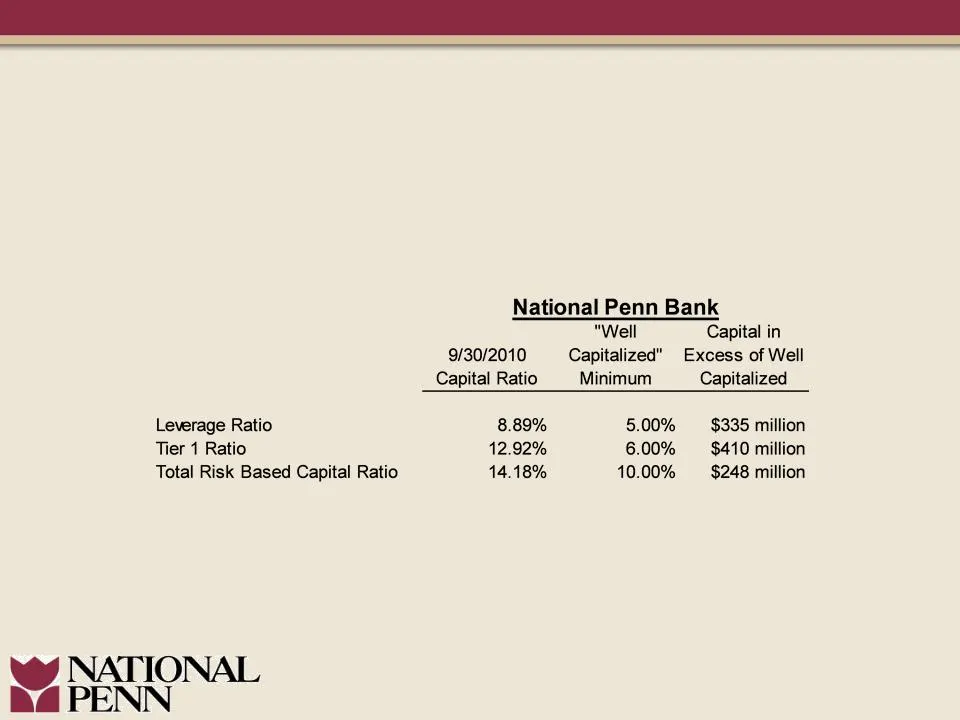
Slide 26: Significant Capital in Excess of "Well Capitalized" Requirements
Significant Capital in Excess of “Well Capitalized’ Requirements

Slide 27: Longer-term Earnings Capacity
Longer-term Earnings Capacity l Accelerate repayment of TARP l Position for improving economic conditions – Aggressively pursuing new customer relationships l Culture of addressing issues not deferring – Results in a strong balance sheet l Longer term capital management opportunities l Realize advan

Slide 28: Banking | Insurance | Investments | Trust
BANKING | INSURANCE | INVESTMENTS | TRUST

Slide 29: National Penn
NATIONAL 4 PENN
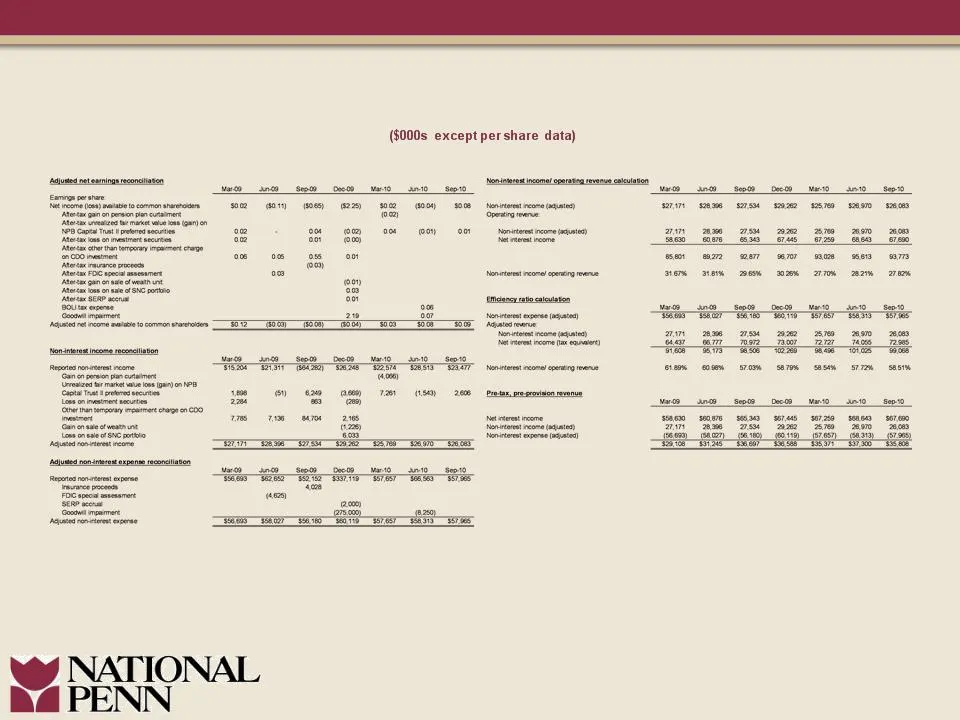
Slide 30: ($000s except per share data)
($000s except pershare data) ‘yous ntenmngnconranon een came opntgreain eaten Nemoreianweutetacomesneeten 2011) RAH) EDO) HE Nantat nce ma) ‘eta cveewonse crue tm Seocrgreene ‘oem eae rn an (eeceeterteesene «2 Sa 8080) 0m etry it ‘een creer eet oo ‘tot tee! ‘ego ovoee soe eo ‘ecm sew sus oor tnoncre
Source: SEC EDGAR · 8-K filed Nov 12, 2010
More decks from National Penn Bancshares
 BB&T Global Financial Services Conference (September 2015)33 slides · Sep 16, 2015
 Merger or Acquisition (August 2015)13 slides · Aug 18, 2015
 Q2 2015 Earnings Presentation17 slides · Jul 23, 2015
 Q1 2015 Earnings Presentation18 slides · Apr 24, 2015
 Investor Presentation (February 2015)36 slides · Feb 11, 2015
 Q4 2014 Earnings Presentation16 slides · Jan 22, 2015