NuStar Energy LP — UBS 2017 MLP One-on-One Conference
35 slides from NuStar Energy LP's conference presentation, Jan 10, 2017
Slide 1: UBS 2017 MLP One-on-One Conference
UBS 2017 MLP One-on-One Conference January 10 and 11, 2017 Exhibit 99.1
Slide 2: Forward-Looking Statements
Forward-Looking Statements 2 Statements contained in this presentation that state management’s expectations or predictions of the future are forward-looking statements. While these forward-looking statements, and any assumptions upon which they are based, are made in good faith and reflect our curre
Slide 3: NuStar Overview
NuStar Overview
Slide 4: Two Publicly Traded Companies
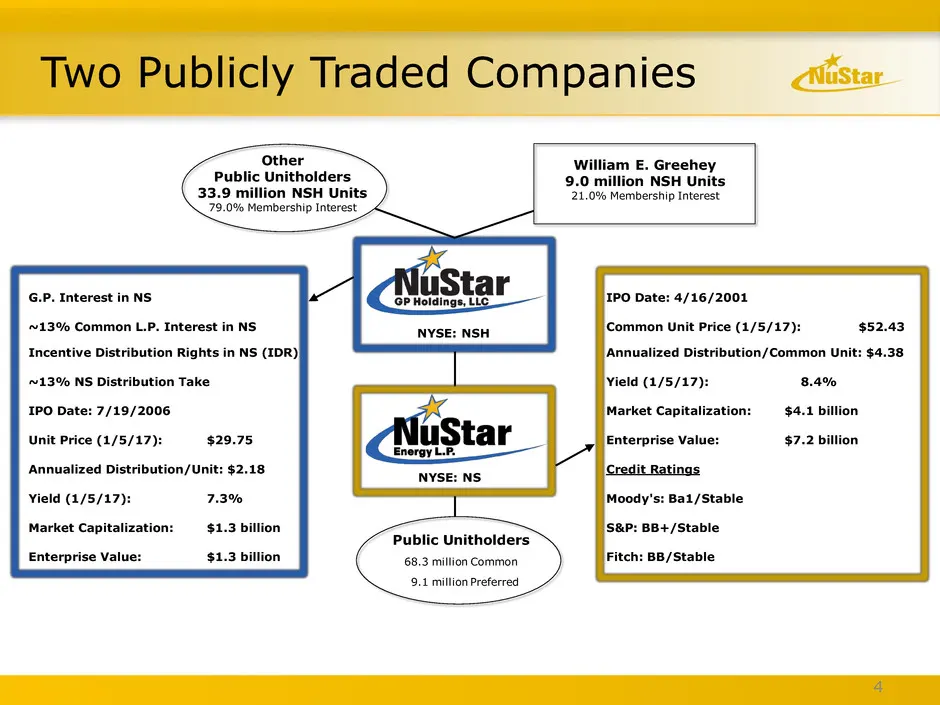
Two Publicly Traded Companies 4 G.P. Interest in NS IPO Date: 4/16/2001 ~13% Common L.P. Interest in NS Common Unit Price (1/5/17): $52.43 Incentive Distribution Rights in NS (IDR) Annualized Distribution/Common Unit: $4.38 ~13% NS Distribution Take Yield (1/5/17): 8.4% IPO Date: 7/19/2006 Market Ca
Slide 5: Large and Diverse Geographic Footprint with Assets in Key Locations
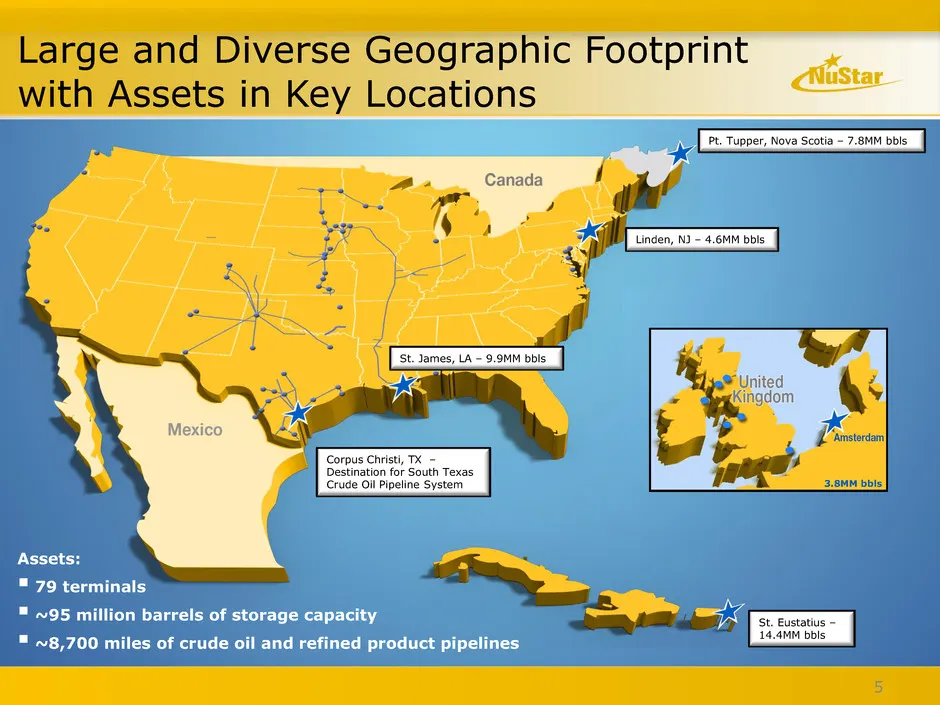
Large and Diverse Geographic Footprint with Assets in Key Locations Assets: 79 terminals ~95 million barrels of storage capacity ~8,700 miles of crude oil and refined product pipelines Corpus Christi, TX – Destination for South Texas Crude Oil Pipeline System St. James, LA – 9.9MM bbls Pt. Tup
Slide 6: NuStar Has Outperformed the Alerian Since the Beginning of the Crude Downturn
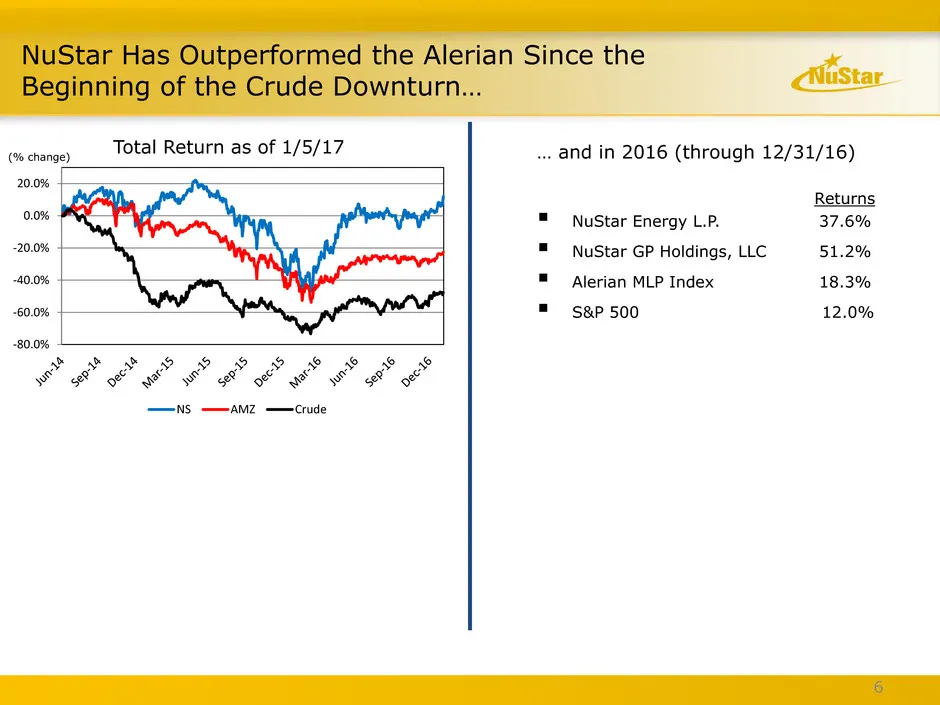
… and in 2016 (through 12/31/16) Returns NuStar Energy L.P. 37.6% NuStar GP Holdings, LLC 51.2% Alerian MLP Index 18.3% S&P 500 12.0% NuStar Has Outperformed the Alerian Since the Beginning of the Crude Downturn… 6 (% change) Total Return as of 1/5/17 -80.0% -60.0% -40.0% -20.0% 0.0% 20.0% N
Slide 7: Our 2016 Accomplishments in the Face of Challenges
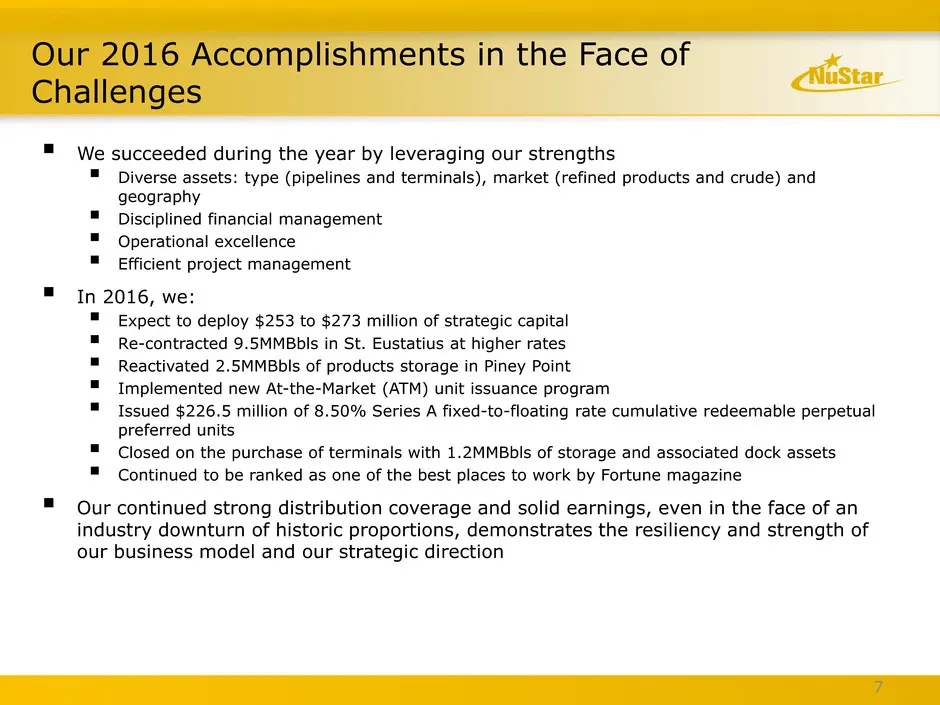
Our 2016 Accomplishments in the Face of Challenges We succeeded during the year by leveraging our strengths Diverse assets: type (pipelines and terminals), market (refined products and crude) and geography Disciplined financial management Operational excellence Efficient project management
Slide 8: Resilient and Strong Core Operations, No Matter the Price of a Barrel of Crude
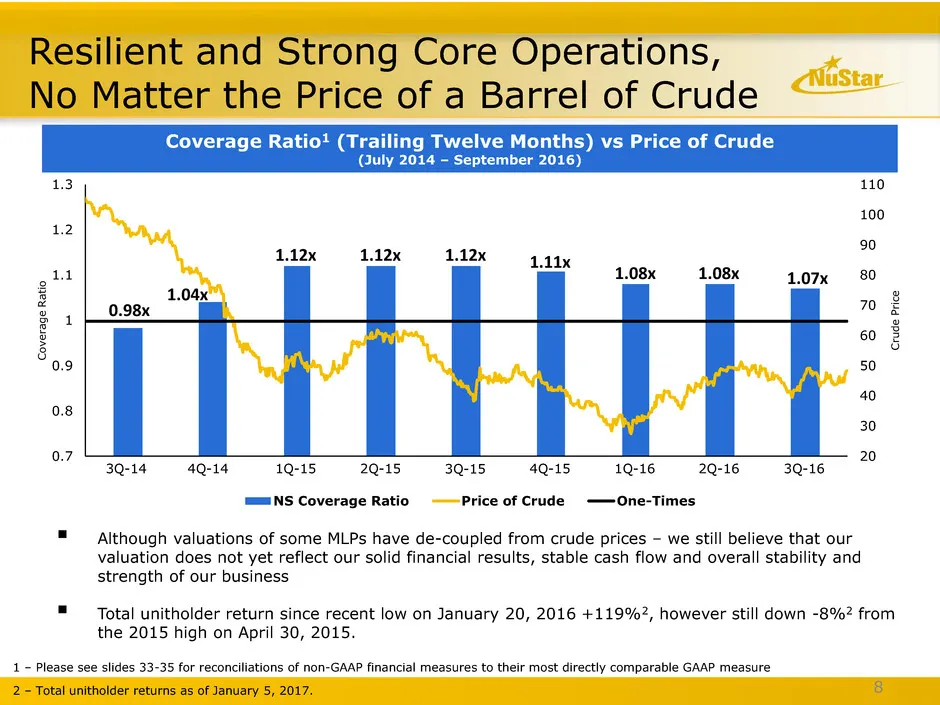
Resilient and Strong Core Operations, No Matter the Price of a Barrel of Crude 8 20 30 40 50 60 70 80 90 100 110 0.7 0.8 0.9 1 1.1 1.2 1.3 7/1/2014 2/1/2015 9/1/2015 4/1/2016 C ru d e P ri c e C o v e ra g e R a ti o NS Coverage Ratio Price of Crude One-Times Although valuations of some MLPs have
Slide 9: Percentage of Expected 2016 Annual Segment EBITDA
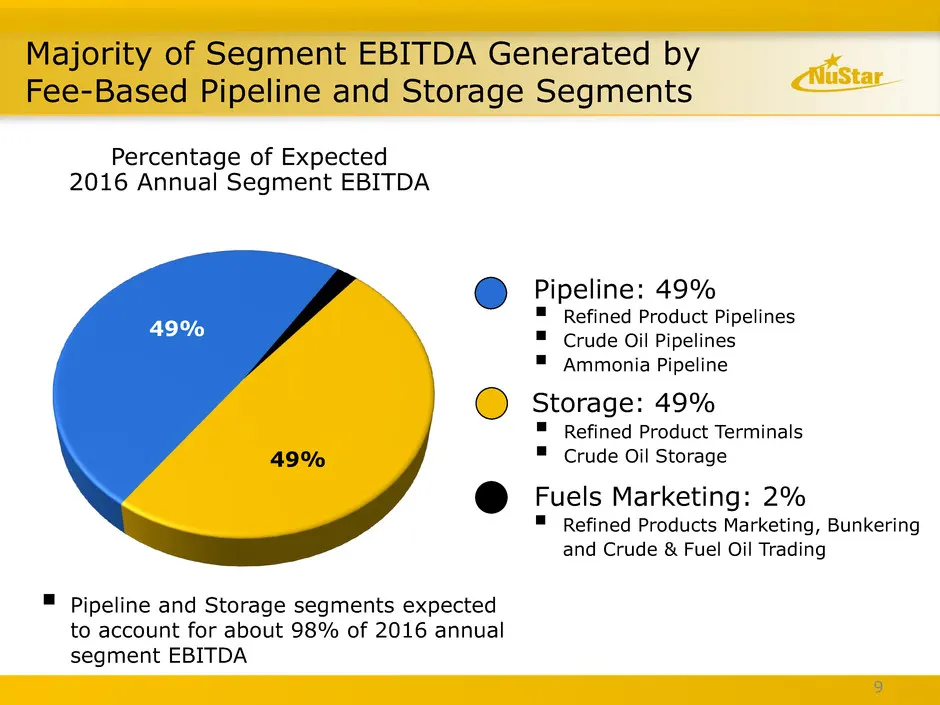
Percentage of Expected 2016 Annual Segment EBITDA Refined Product Pipelines Crude Oil Pipelines Ammonia Pipeline Refined Product Terminals Crude Oil Storage Fuels Marketing: 2% Refined Products Marketing, Bunkering and Crude & Fuel Oil Trading Majority of Segment EBITDA Generated by Fee-
Slide 10: Guidance Summary
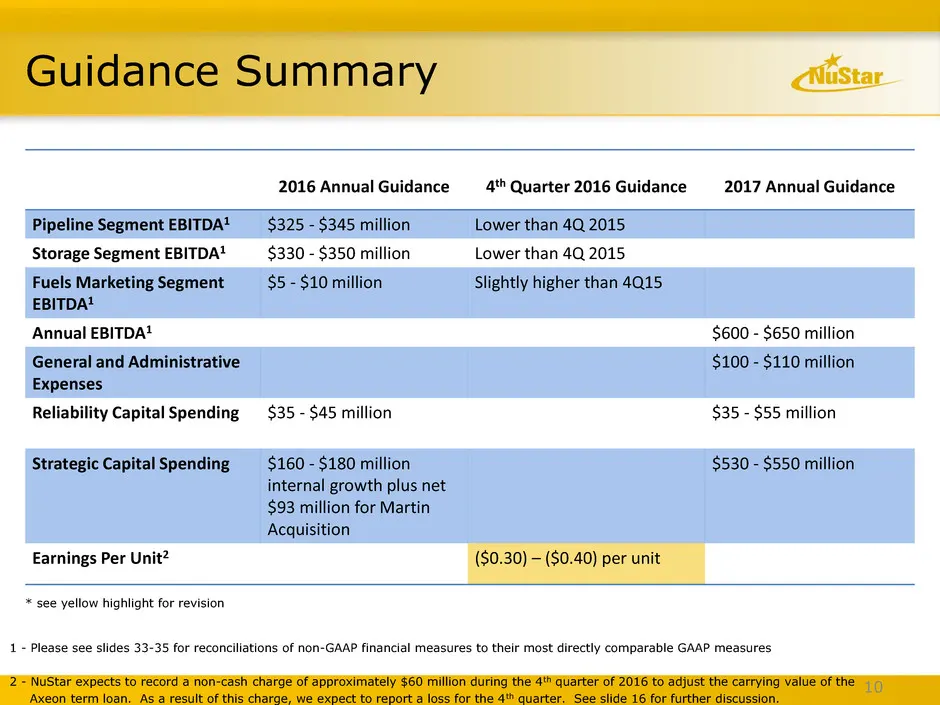
Guidance Summary 10 2016 Annual Guidance 4th Quarter 2016 Guidance 2017 Annual Guidance Pipeline Segment EBITDA1 $325 - $345 million Lower than 4Q 2015 Storage Segment EBITDA1 $330 - $350 million Lower than 4Q 2015 Fuels Marketing Segment EBITDA1 $5 - $10 million Slightly higher than 4Q15 Annual EBI
Slide 11: Building on Our Strengths - Stable, Diversified Business
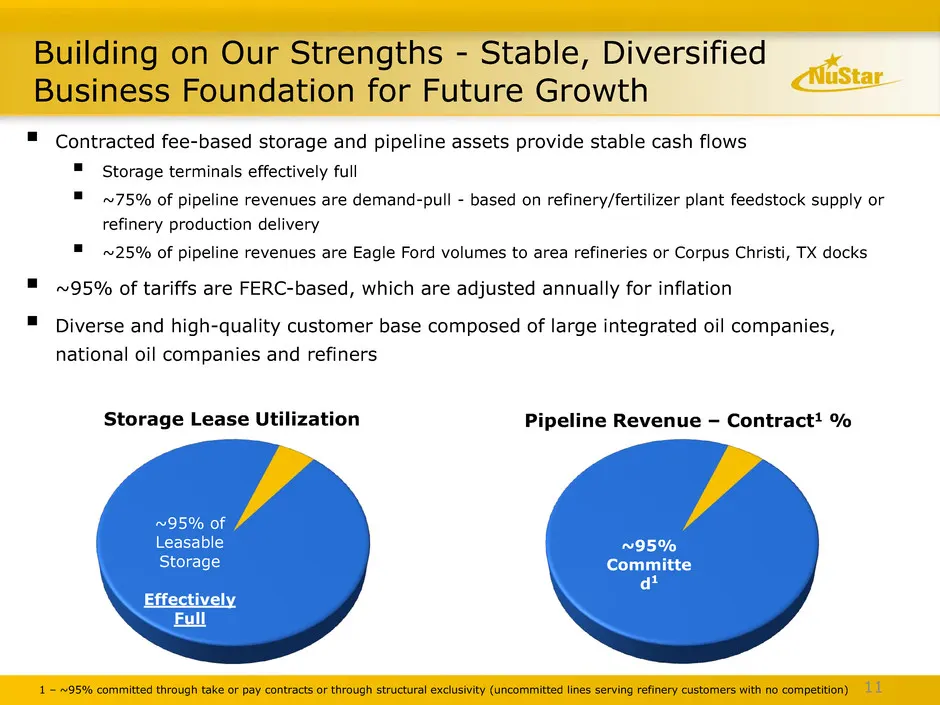
11 Building on Our Strengths - Stable, Diversified Business Foundation for Future Growth Contracted fee-based storage and pipeline assets provide stable cash flows Storage terminals effectively full ~75% of pipeline revenues are demand-pull - based on refinery/fertilizer plant feedstock supply
Slide 12: On Track for Strategic Spending in 2016 and 2017
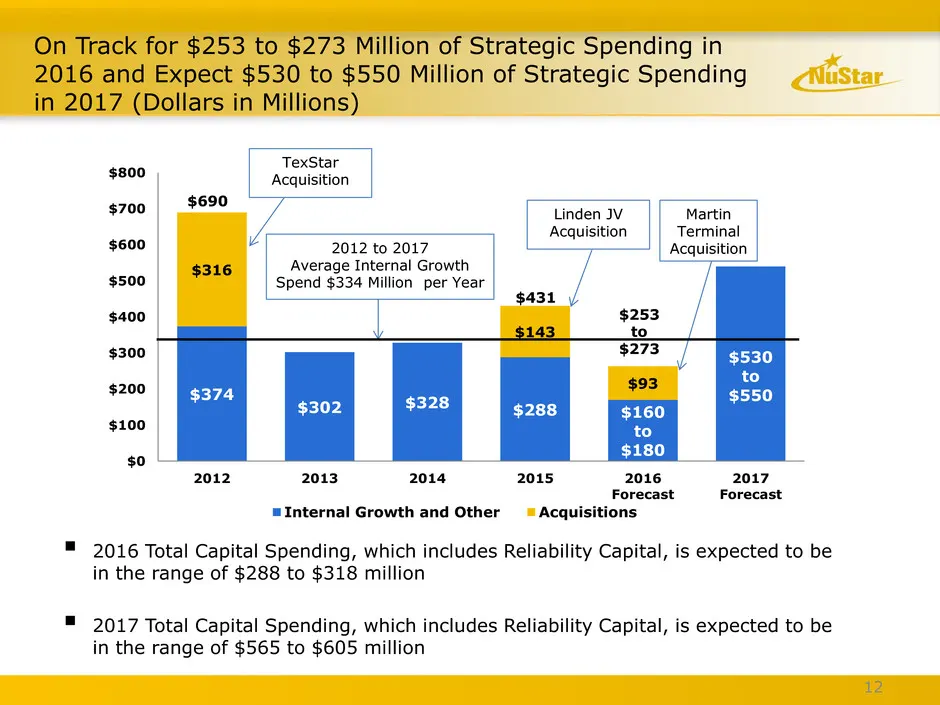
TexStar Acquisition On Track for $253 to $273 Million of Strategic Spending in 2016 and Expect $530 to $550 Million of Strategic Spending in 2017 (Dollars in Millions) $374 $302 $328 $288 $160 to $180 $530 to $550 $316 $143 $93 $0 $100 $200 $300 $400 $500 $600 $700 $800 2012 2013 2014 2015 2016 Fore
Slide 13: Pursuing Pipeline and Storage Opportunities
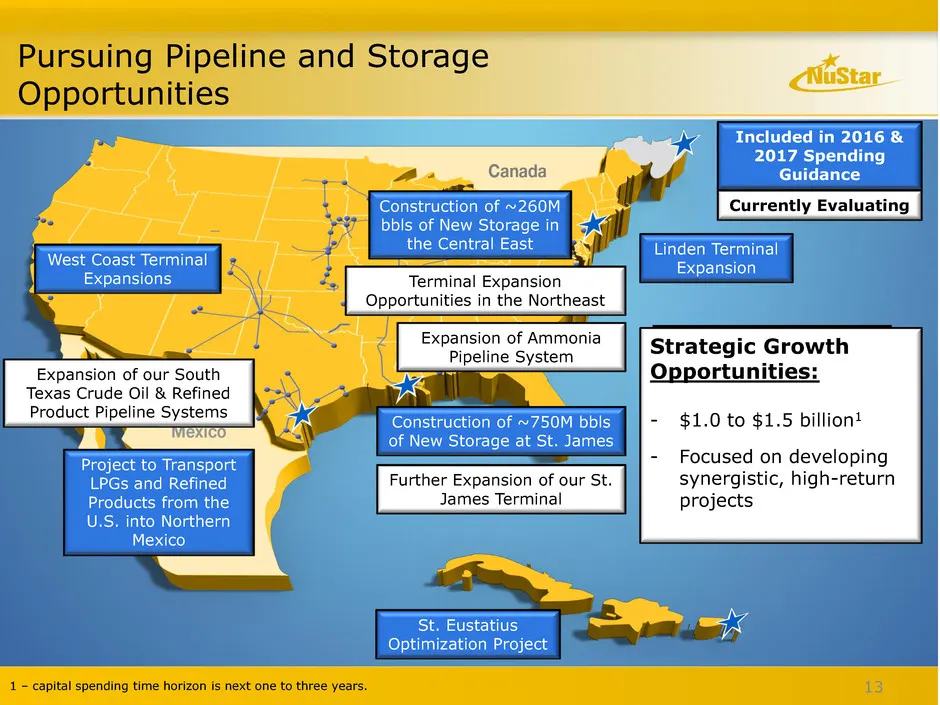
Pursuing Pipeline and Storage Opportunities 3.8MM bbls 13 Expansion of Ammonia Pipeline System Included in 2016 & 2017 Spending Guidance Currently Evaluating West Coast Terminal Expansions Construction of ~750M bbls of New Storage at St. James Linden Terminal Expansion Project to Transport LPGs and
Slide 14: No Debt Maturities until 2018
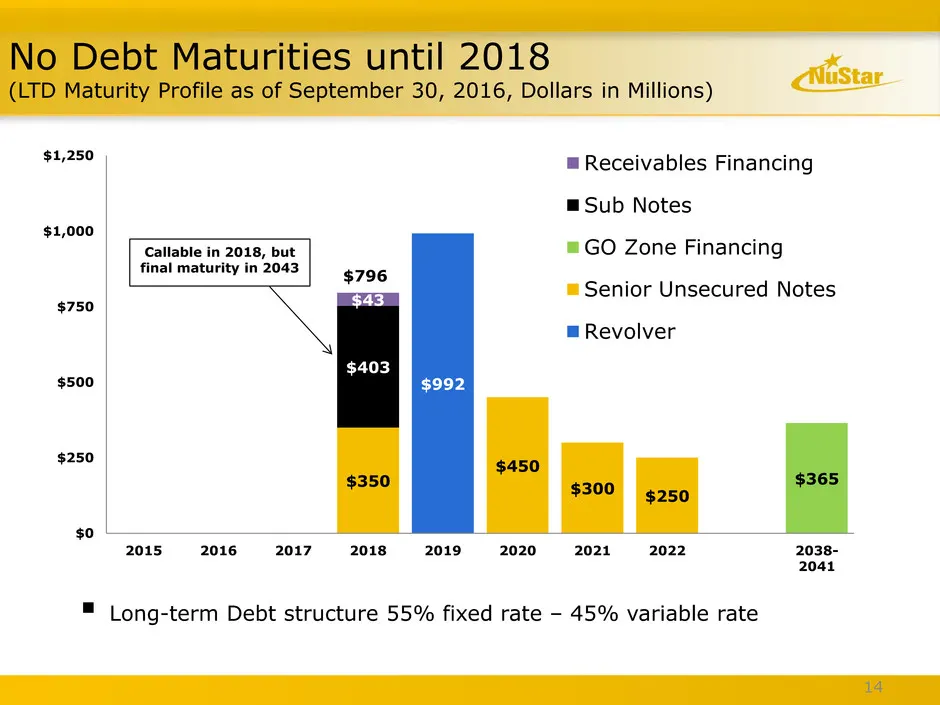
No Debt Maturities until 2018 (LTD Maturity Profile as of September 30, 2016, Dollars in Millions) Long-term Debt structure 55% fixed rate – 45% variable rate Callable in 2018, but final maturity in 2043 14 $992 $350 $450 $300 $250 $365 $403 $43 $0 $250 $500 $750 $1,000 $1,250 2015 2016 2017 2018
Slide 15: NuStar Energy Recently Issued $226.5 Million of Perpetual Preferred Equity
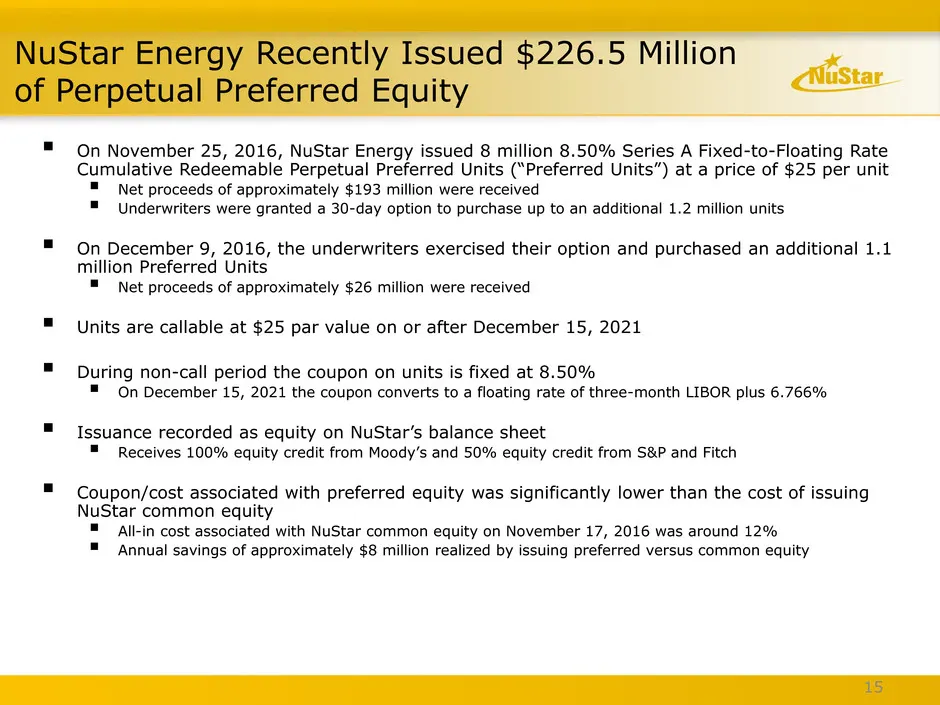
NuStar Energy Recently Issued $226.5 Million of Perpetual Preferred Equity 15 On November 25, 2016, NuStar Energy issued 8 million 8.50% Series A Fixed-to-Floating Rate Cumulative Redeemable Perpetual Preferred Units (“Preferred Units”) at a price of $25 per unit Net proceeds of approximately $1
Slide 16: Axeon Term Loan Update
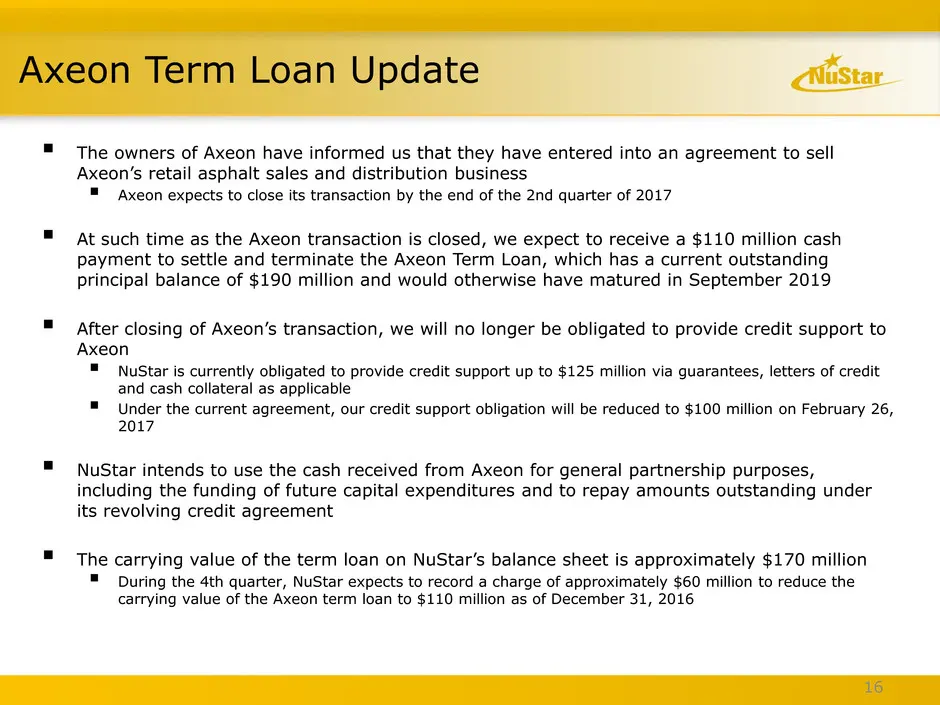
Axeon Term Loan Update 16 The owners of Axeon have informed us that they have entered into an agreement to sell Axeon’s retail asphalt sales and distribution business Axeon expects to close its transaction by the end of the 2nd quarter of 2017 At such time as the Axeon transaction is closed, w
Slide 17: Pipeline Segment
Pipeline Segment
Slide 18: Pipeline Segment Overview
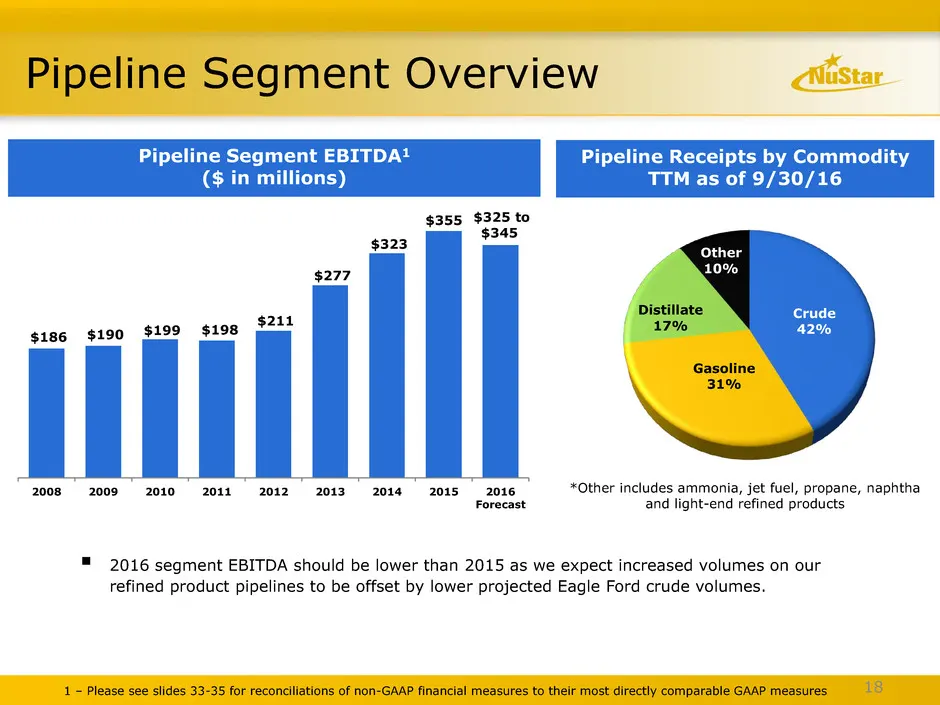
18 2016 segment EBITDA should be lower than 2015 as we expect increased volumes on our refined product pipelines to be offset by lower projected Eagle Ford crude volumes. Pipeline Segment Overview Pipeline Segment EBITDA1 ($ in millions) Pipeline Receipts by Commodity TTM as of 9/30/16 *Other incl
Slide 19: Throughputs in NuStar's South Texas Crude Oil Pipeline System
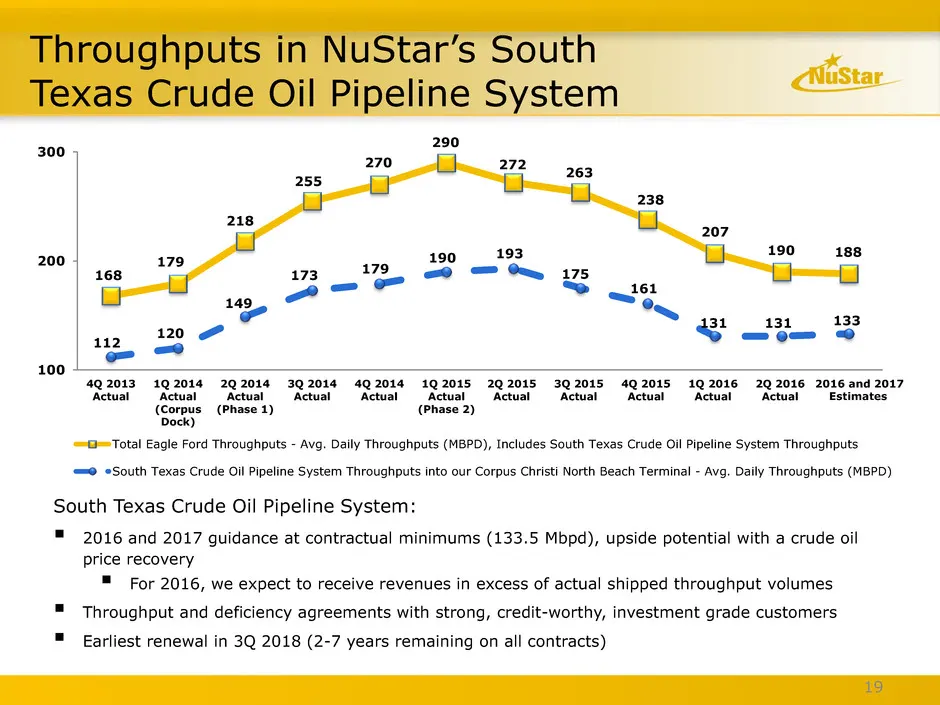
Throughputs in NuStar’s South Texas Crude Oil Pipeline System 19 South Texas Crude Oil Pipeline System: 2016 and 2017 guidance at contractual minimums (133.5 Mbpd), upside potential with a crude oil price recovery For 2016, we expect to receive revenues in excess of actual shipped throughput vol
Slide 20: NuStar's South Texas Crude Oil Pipeline Presence
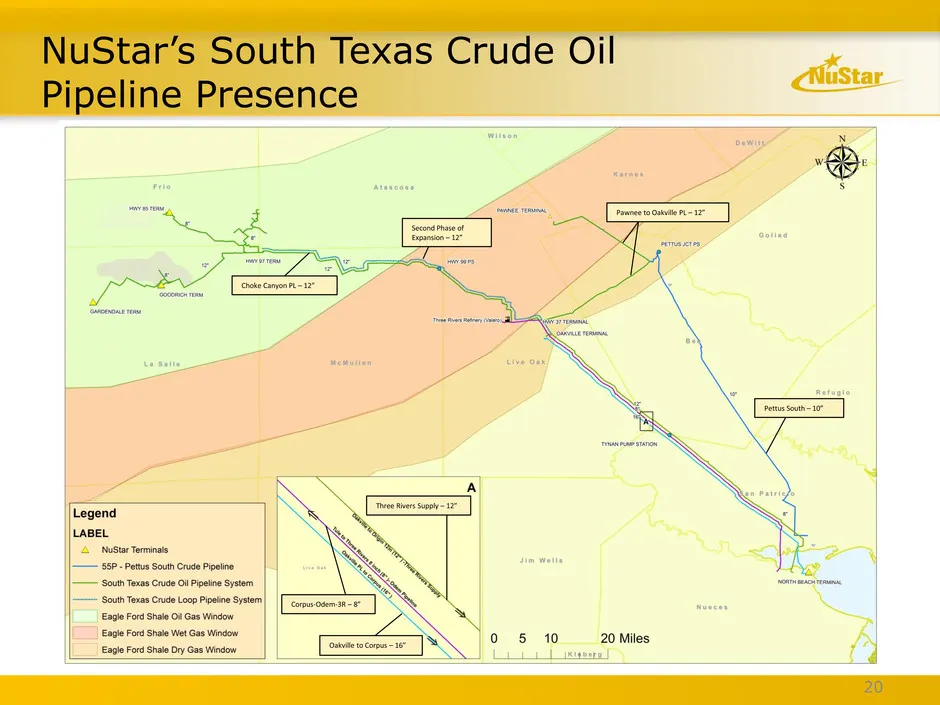
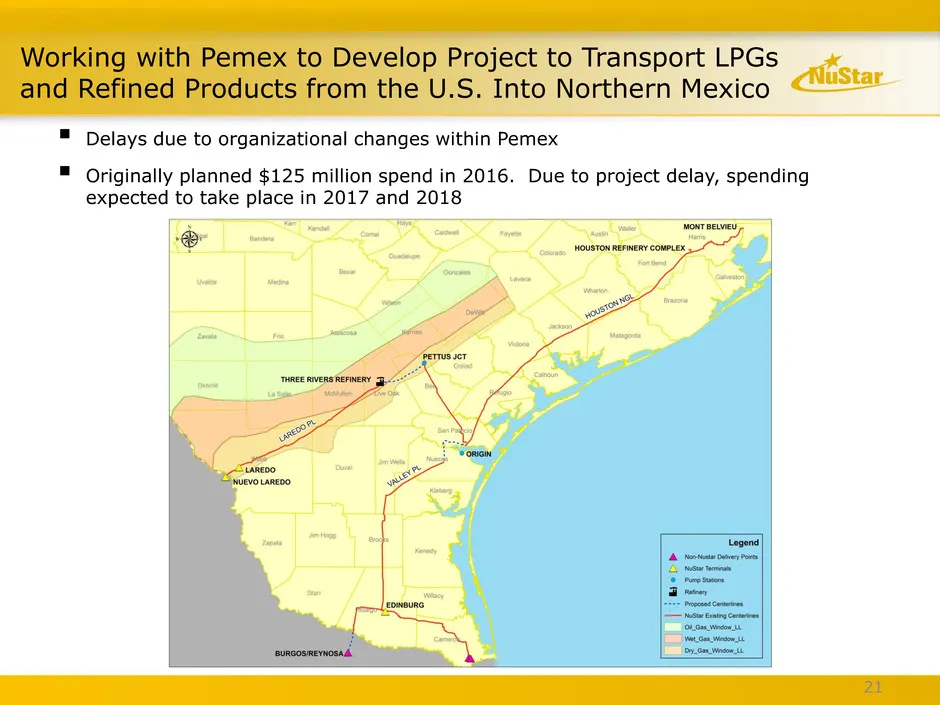
NuStar’s South Texas Crude Oil Pipeline Presence 20 Choke Canyon PL – 12” Pettus South – 10” Pawnee to Oakville PL – 12” Three Rivers Supply – 12” Corpus-Odem-3R – 8” Oakville to Corpus – 16” Second Phase of Expansion – 12”
Slide 21: Working with Pemex to Develop Project to Transport LPGs and Refined Products
Working with Pemex to Develop Project to Transport LPGs and Refined Products from the U.S. Into Northern Mexico 21 Delays due to organizational changes within Pemex Originally planned $125 million spend in 2016. Due to project delay, spending expected to take place in 2017 and 2018
Slide 22: NuStar Expanding Mid-Continent Pipeline and Terminal Network
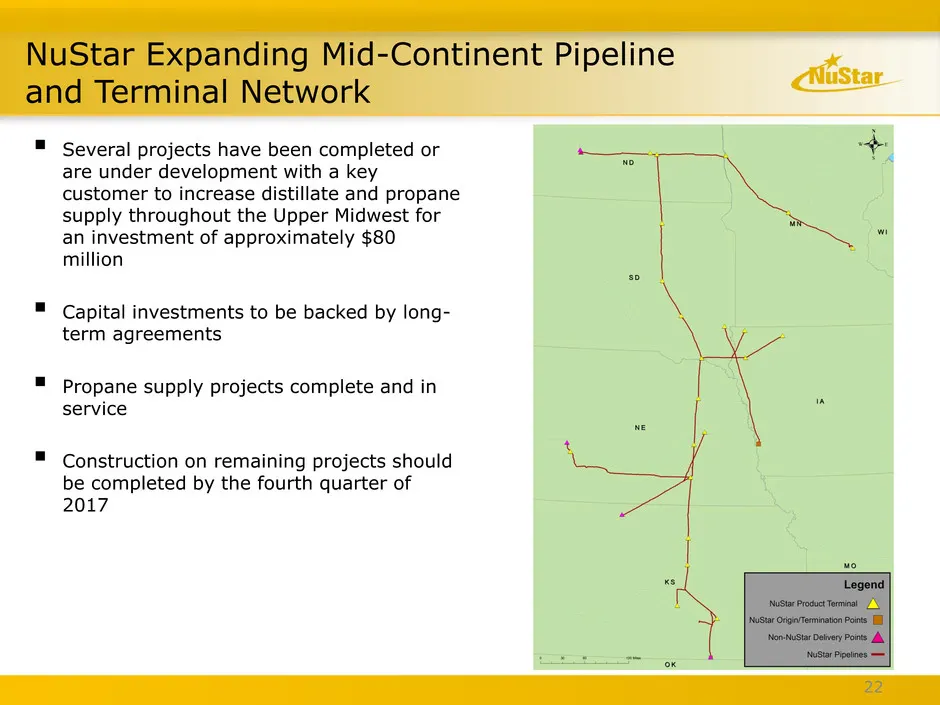
NuStar Expanding Mid-Continent Pipeline and Terminal Network Several projects have been completed or are under development with a key customer to increase distillate and propane supply throughout the Upper Midwest for an investment of approximately $80 million Capital investments to be backed by
Slide 23: Storage Segment
Storage Segment
Slide 24: Storage Segment Overview
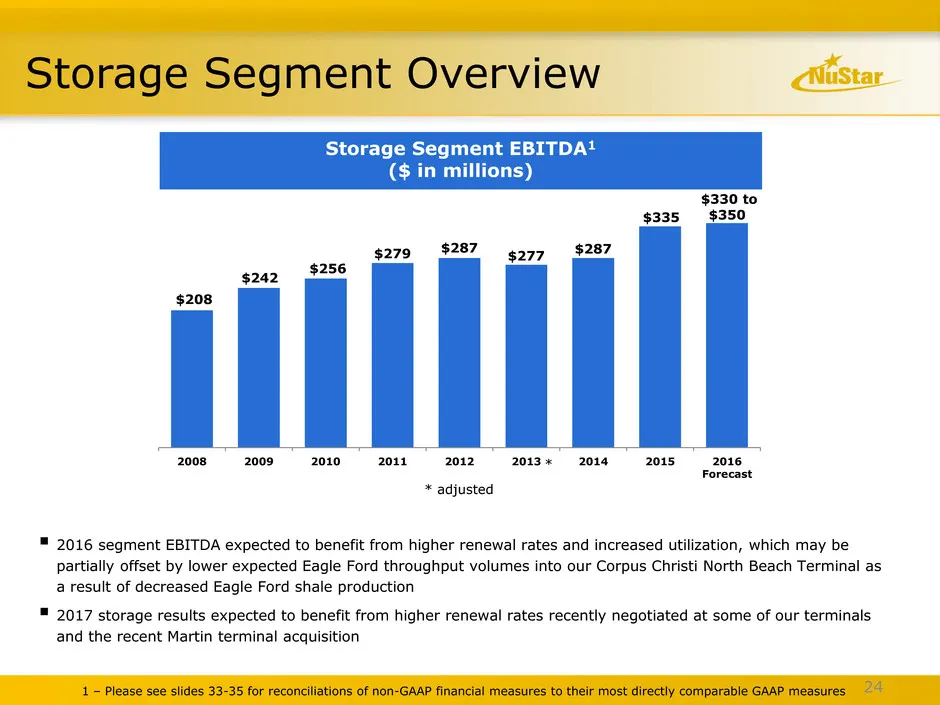
2016 segment EBITDA expected to benefit from higher renewal rates and increased utilization, which may be partially offset by lower expected Eagle Ford throughput volumes into our Corpus Christi North Beach Terminal as a result of decreased Eagle Ford shale production 2017 storage results expect
Slide 25: Building Our Strategic Alliances in Europe For Future Growth
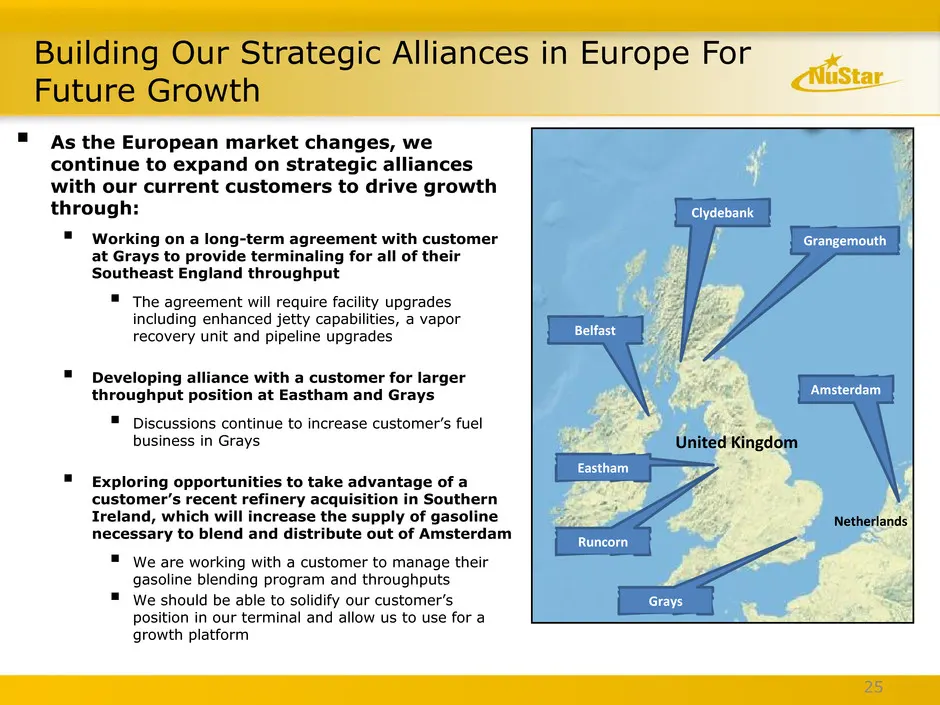
25 Building Our Strategic Alliances in Europe For Future Growth As the European market changes, we continue to expand on strategic alliances with our current customers to drive growth through: Working on a long-term agreement with customer at Grays to provide terminaling for all of their Southea
Slide 26: We Are Exploring Expansion in the New York Harbor
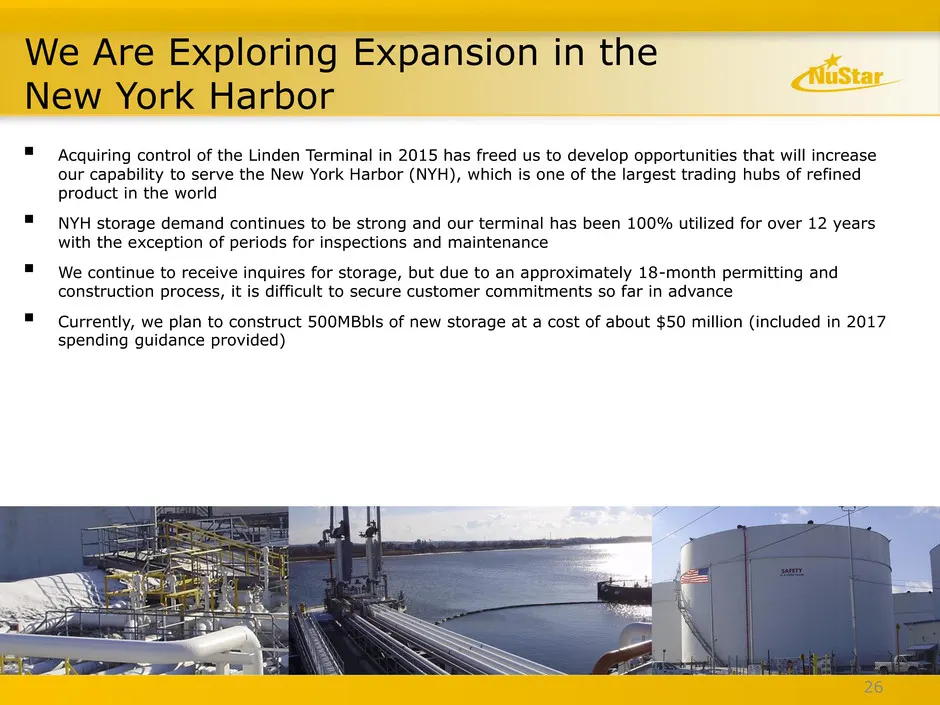
26 Acquiring control of the Linden Terminal in 2015 has freed us to develop opportunities that will increase our capability to serve the New York Harbor (NYH), which is one of the largest trading hubs of refined product in the world NYH storage demand continues to be strong and our terminal has
Slide 27: Piney Point Terminal Back in Service
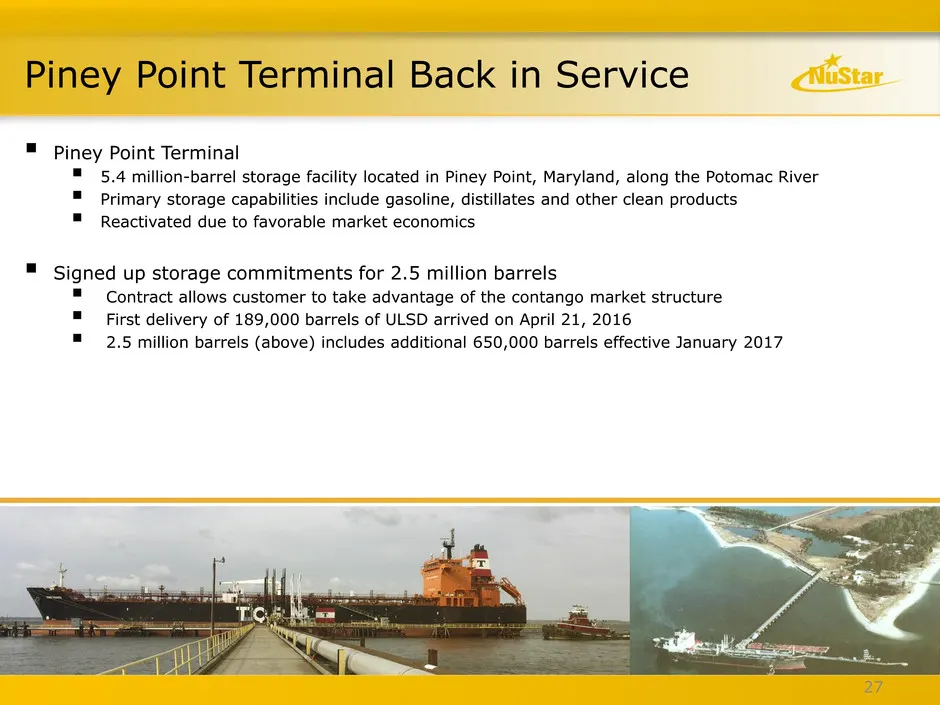
Piney Point Terminal 5.4 million-barrel storage facility located in Piney Point, Maryland, along the Potomac River Primary storage capabilities include gasoline, distillates and other clean products Reactivated due to favorable market economics Signed up storage commitments for 2.5 million
Slide 28: Majority of St. Eustatius Terminal Tankage Recently Leased through 1Q 2020
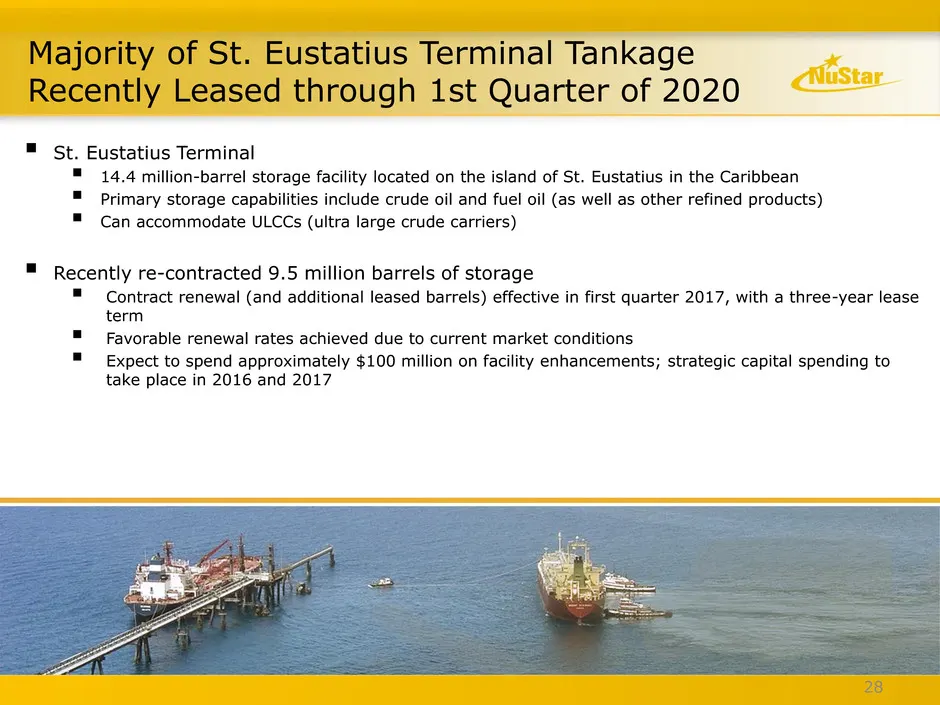
28 Majority of St. Eustatius Terminal Tankage Recently Leased through 1st Quarter of 2020 St. Eustatius Terminal 14.4 million-barrel storage facility located on the island of St. Eustatius in the Caribbean Primary storage capabilities include crude oil and fuel oil (as well as other refined pr
Slide 29: Adapting to Market Flows: Renewables Opportunities on the West Coast
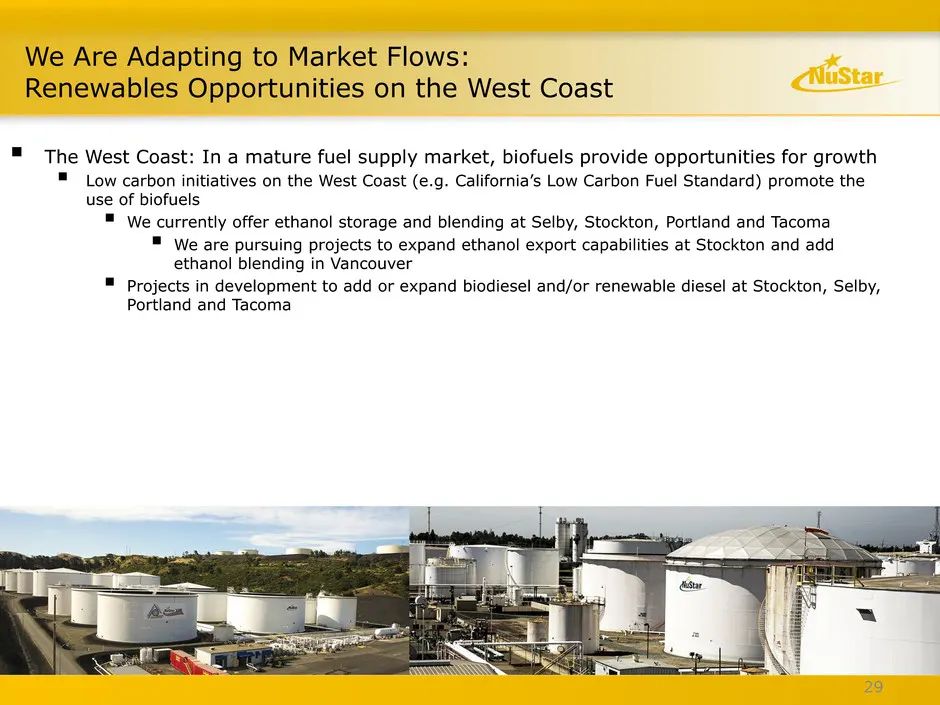
We Are Adapting to Market Flows: Renewables Opportunities on the West Coast The West Coast: In a mature fuel supply market, biofuels provide opportunities for growth Low carbon initiatives on the West Coast (e.g. California’s Low Carbon Fuel Standard) promote the use of biofuels We currently o
Slide 30: Martin Midstream terminal assets
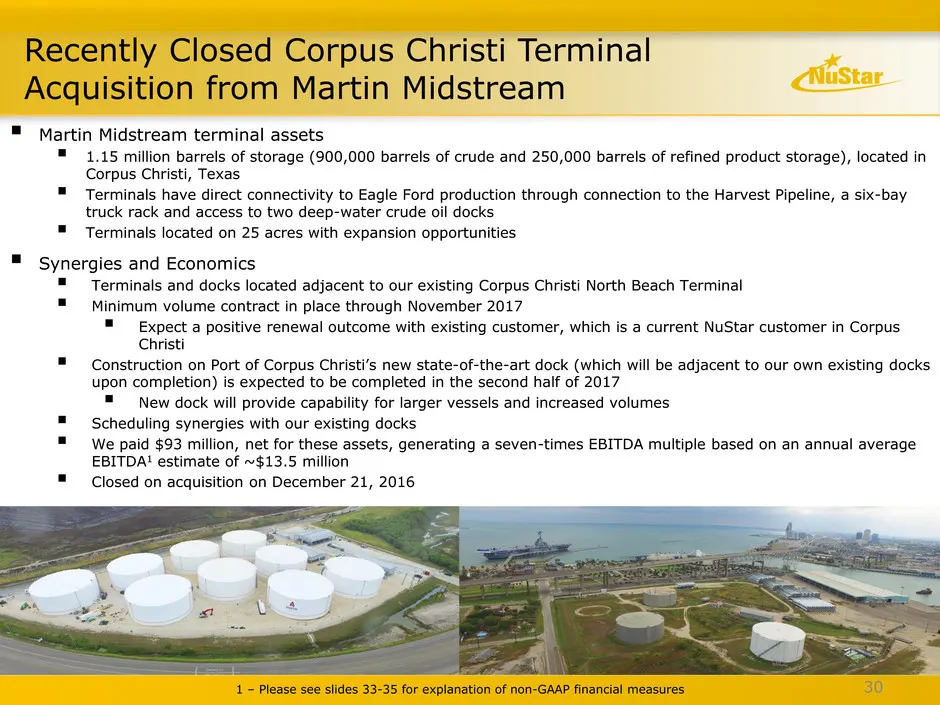
30 Martin Midstream terminal assets 1.15 million barrels of storage (900,000 barrels of crude and 250,000 barrels of refined product storage), located in Corpus Christi, Texas Terminals have direct connectivity to Eagle Ford production through connection to the Harvest Pipeline, a six-bay truc
Slide 31: Appendix
Appendix
Slide 32: Capital Structure after Perpetual Preferred Equity Issuance
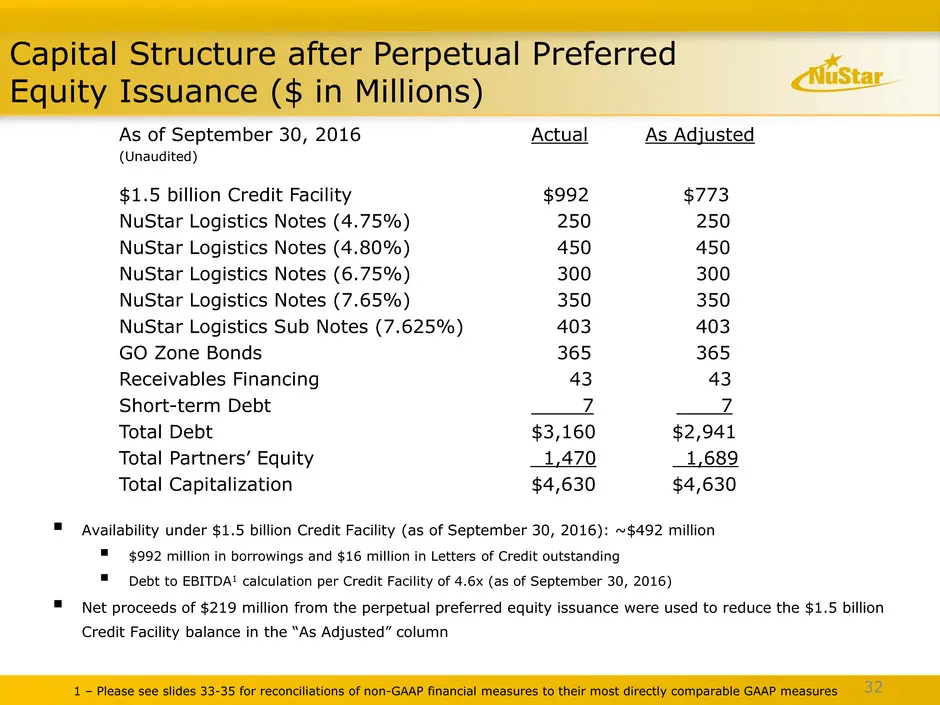
Capital Structure after Perpetual Preferred Equity Issuance ($ in Millions) As of September 30, 2016 Actual As Adjusted (Unaudited) $1.5 billion Credit Facility $992 $773 NuStar Logistics Notes (4.75%) 250 250 NuStar Logistics Notes (4.80%) 450 450 NuStar Logistics Notes (6.75%) 300 300 NuStar Logis
Slide 33: Reconciliation of Non-GAAP Financial Information
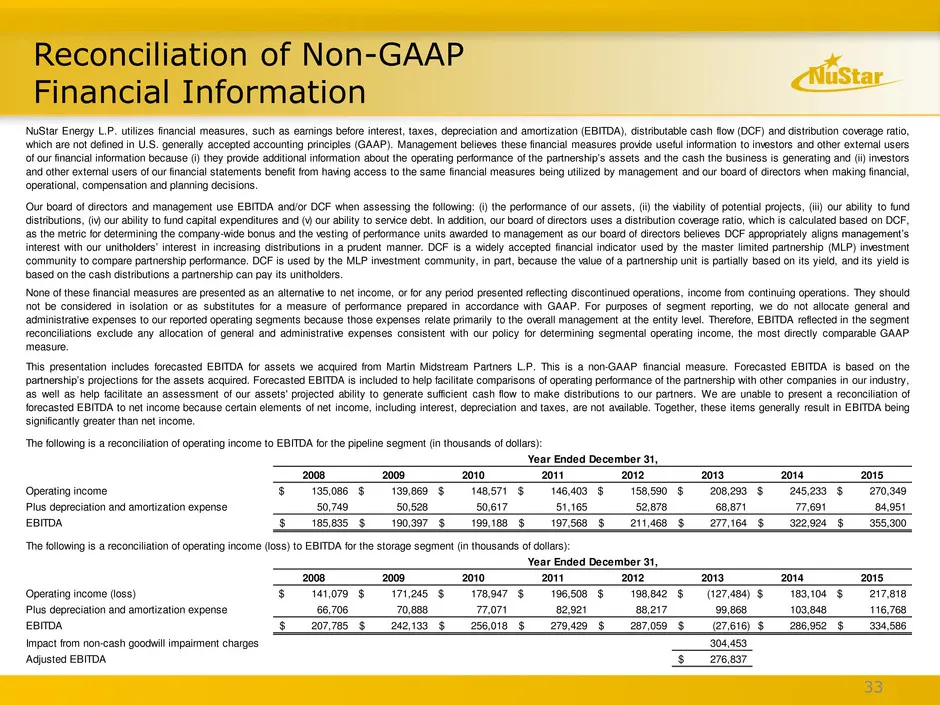
Reconciliation of Non-GAAP Financial Information 33 2008 2009 2010 2011 2012 2013 2014 2015 Operating income 135,086$ 139,869$ 148,571$ 146,403$ 158,590$ 208,293$ 245,233$ 270,349$ Plus depreciation and amortization expense 50,749 50,528 50,617 51,165 52,878 68,871 77,691 84,951 EBITDA 185,835$ 190,
Slide 34: Reconciliation of Non-GAAP Financial Information (continued)
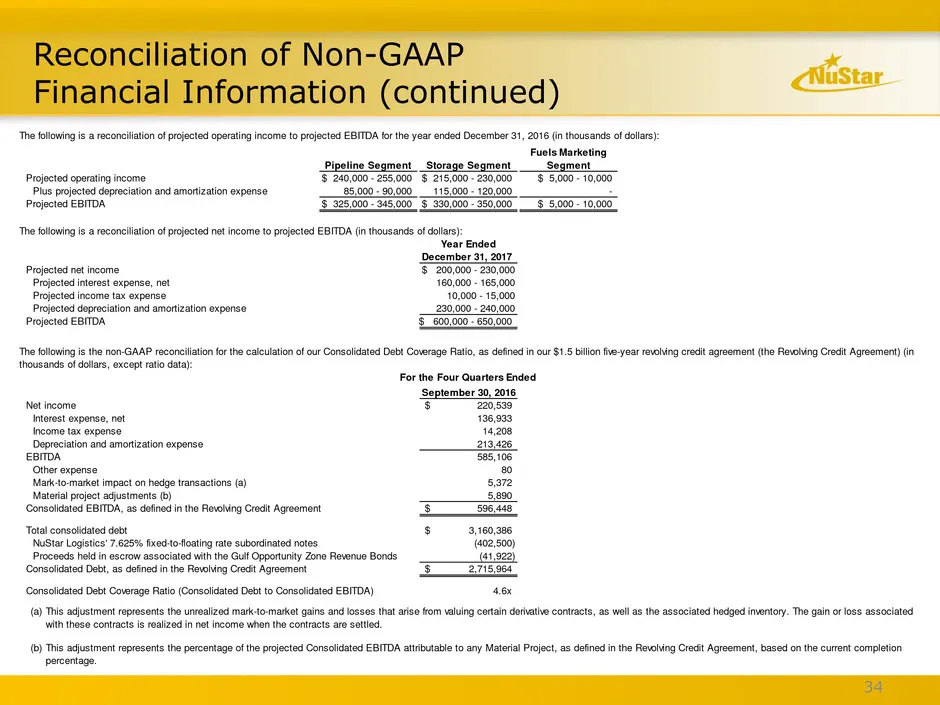
Reconciliation of Non-GAAP Financial Information (continued) 34 Pipeline Segment Storage Segment Fuels Marketing Segment Projected operating income $ 240,000 - 255,000 $ 215,000 - 230,000 $ 5,000 - 10,000 Plus projected depreciation and amortization expense 85,000 - 90,000 115,000 - 120,000 - Projec
Slide 35: Reconciliation of Non-GAAP Financial Information (continued)
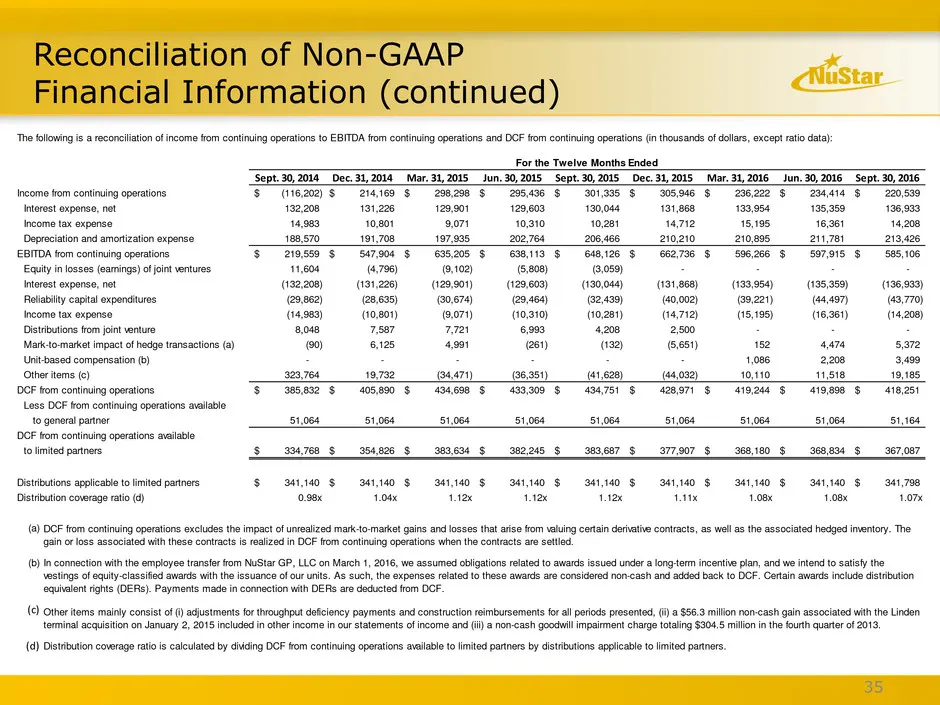
Reconciliation of Non-GAAP Financial Information (continued) 35 Sept. 30, 2014 Dec. 31, 2014 Mar. 31, 2015 Jun. 30, 2015 Sept. 30, 2015 Dec. 31, 2015 Mar. 31, 2016 Jun. 30, 2016 Sept. 30, 2016 Income from continuing operations (116,202)$ 214,169$ 298,298$ 295,436$ 301,335$ 305,946$ 236,222$ 234,414$
Source: SEC EDGAR · 8-K filed Jan 10, 2017
More decks from NuStar Energy LP
 Merger or Acquisition (January 2024)14 slides · Jan 22, 2024
 Investor Presentation (December 2023)35 slides · Dec 5, 2023
 Raymond James Virtual Energy Supply Chain Conference 2023; Pickering Energy Partners TE&MF36 slides · Sep 19, 2023
 Barclays CEO Energy-Power Conference 202336 slides · Sep 6, 2023
 Citi One-on-One Midstream/Energy Infrastructure Conference 202336 slides · Aug 22, 2023
 8th Annual J.P. Morgan Energy, Power & Renewables Conference 202336 slides · Jun 21, 2023