Grenergy Renovables S.A · BME:GRE
Grenergy Renovables — H1 2024 Earnings Presentation
28 slides from Grenergy Renovables's earnings presentation, Sep 23, 2024
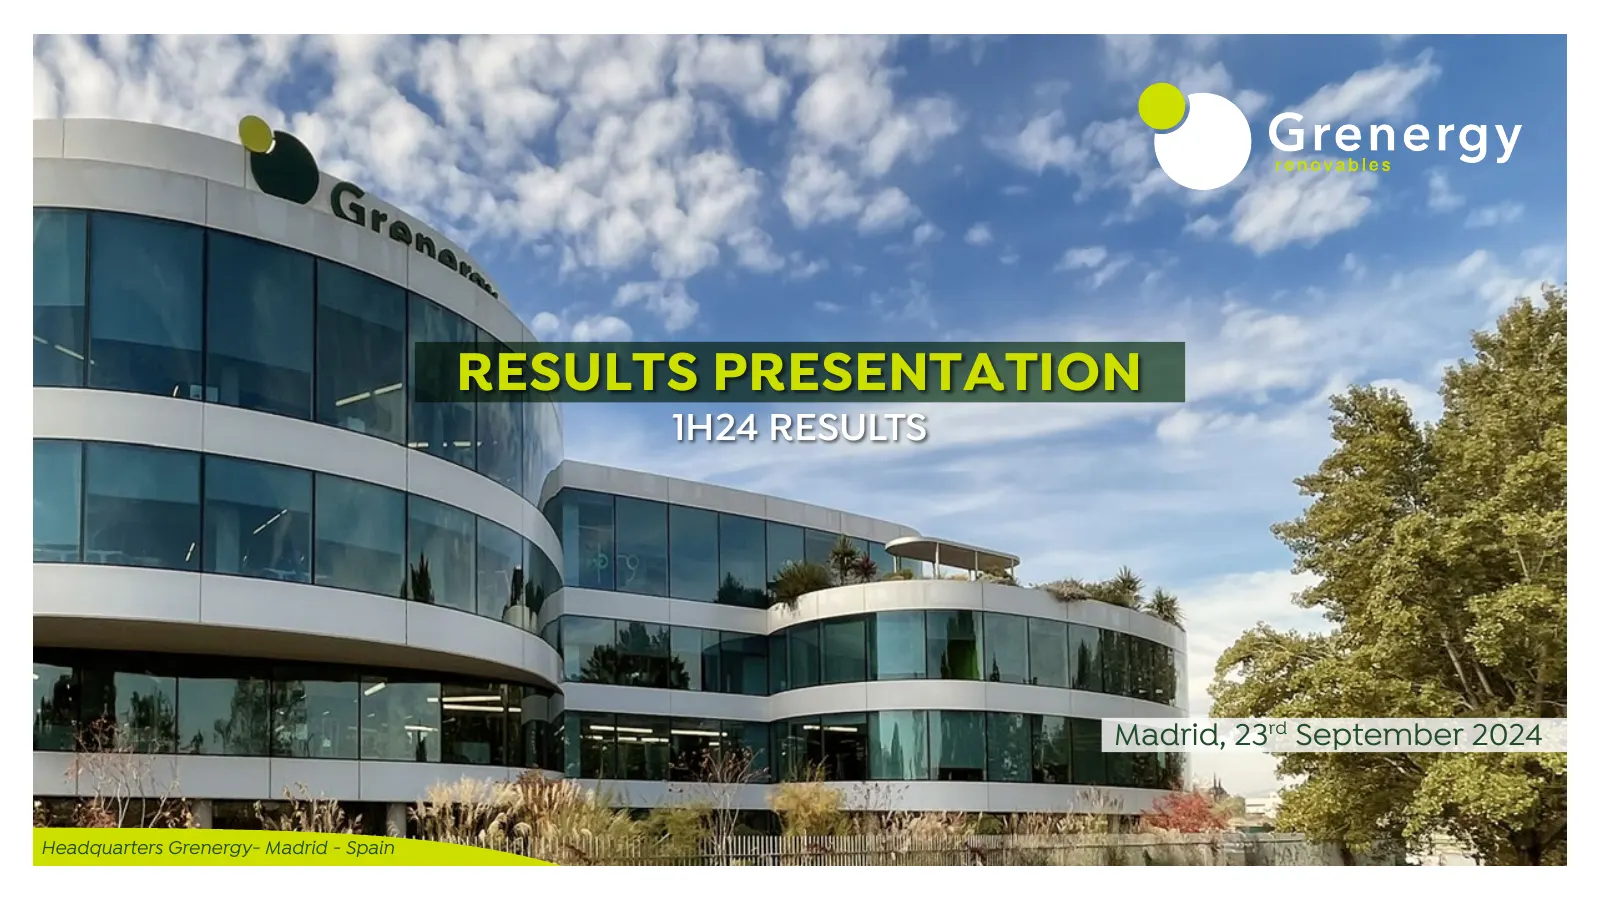
Slide 1: 1H24 Results Presentation
RESULTS PRESENTATION 1H24 RESULTS Madrid, 23rd September 2024 Headquarters Grenergy- Madrid - Spain
Slide 2: Disclaimer
DISCLAIMER By attending this presentation and/or by accepting this presentation you will be cial condition or results of operations by the Company and should not be relied upon taken to have represented, warranted and undertaken that you have read and when making an investment decision. Certain finan
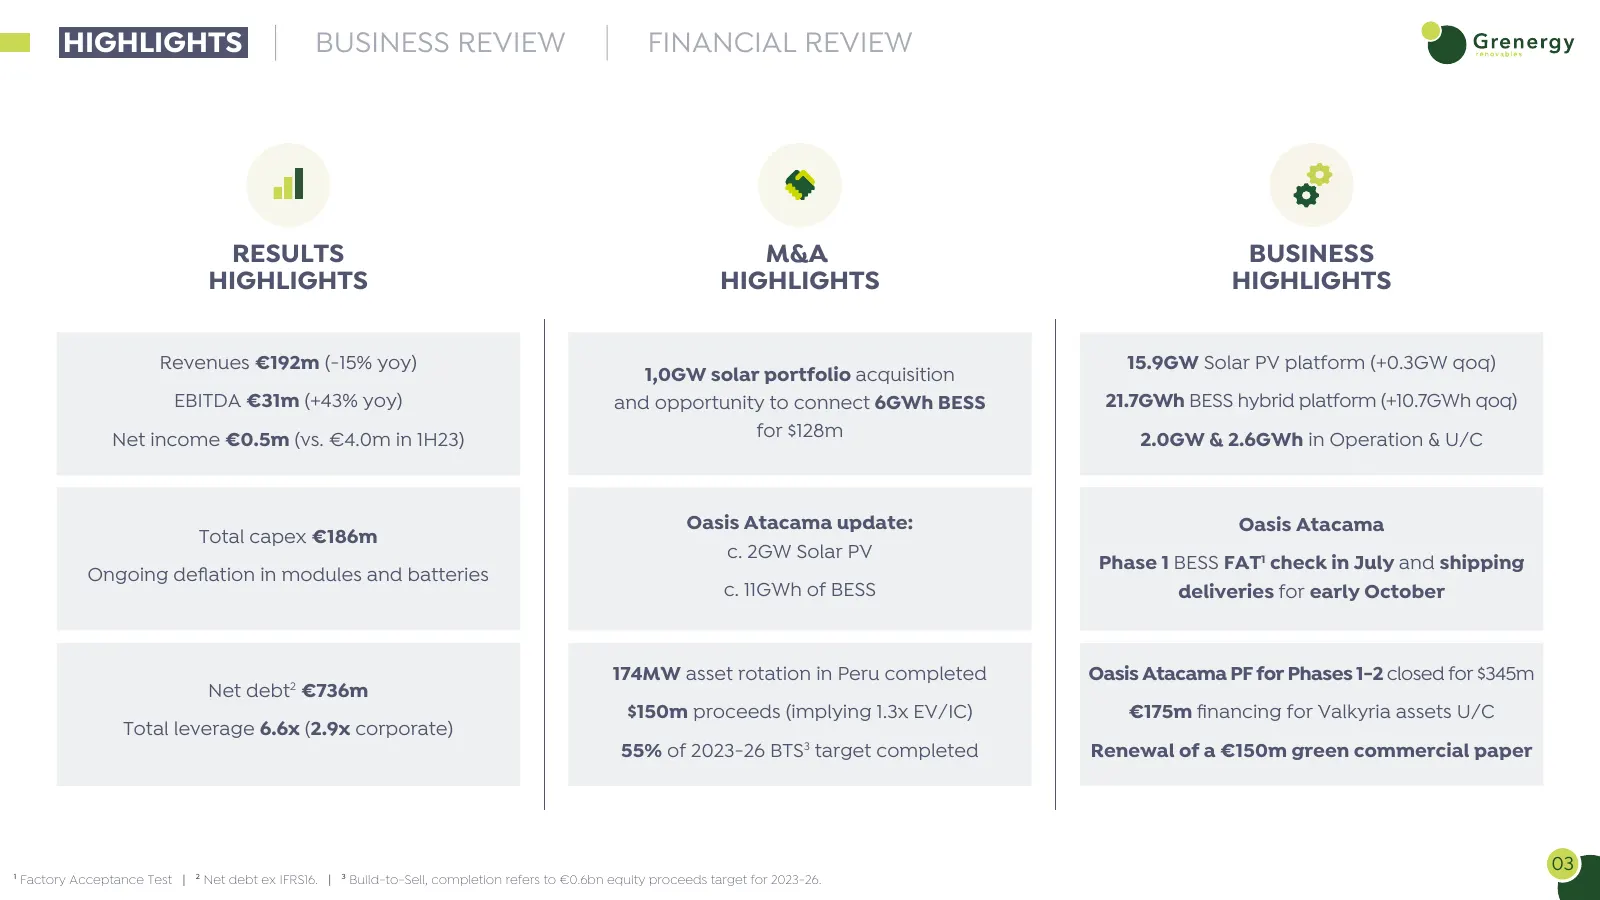
Slide 3: Highlights: Results, M&A and Business
HIGHLIGHTS BUSINESS REVIEW FINANCIAL REVIEW RESULTS M&A BUSINESS HIGHLIGHTS HIGHLIGHTS HIGHLIGHTS Revenues €192m (-15% yoy) 15.9GW Solar PV platform (+0.3GW qoq) 1,0GW solar portfolio acquisition EBITDA €31m (+43% yoy) and opportunity to connect 6GWh BESS 21.7GWh BESS hybrid platform (+10.7GWh qoq)
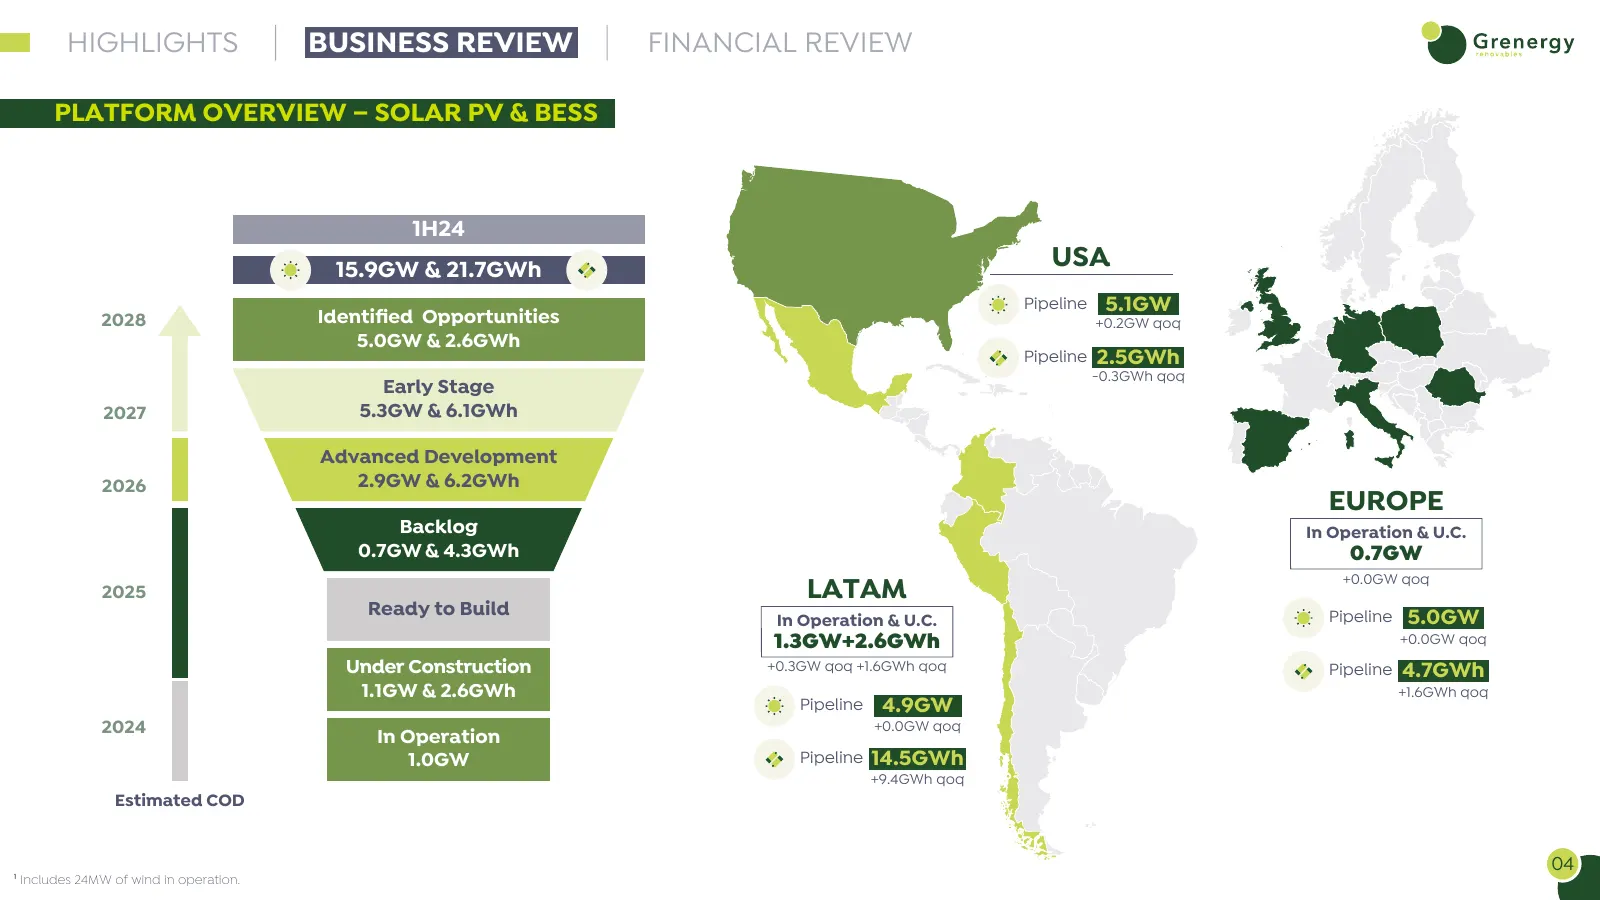
Slide 4: Platform Overview – Solar PV & BESS
HIGHLIGHTS BUSINESS REVIEW FINANCIAL REVIEW PLATFORM OVERVIEW – SOLAR PV & BESS 1H24 15.9GW & 21.7GWh USA Pipeline 5.1GW 2028 Identified Opportunities +0.2GW qoq 5.0GW & 2.6GWh Pipeline 2.5GWh -0.3GWh qoq Early Stage 2027 5.3GW & 6.1GWh Advanced Development 2026 2.9GW & 6.2GWh EUROPE Backlog In Opera
Slide 5: Solar PV & BESS Pipeline Update
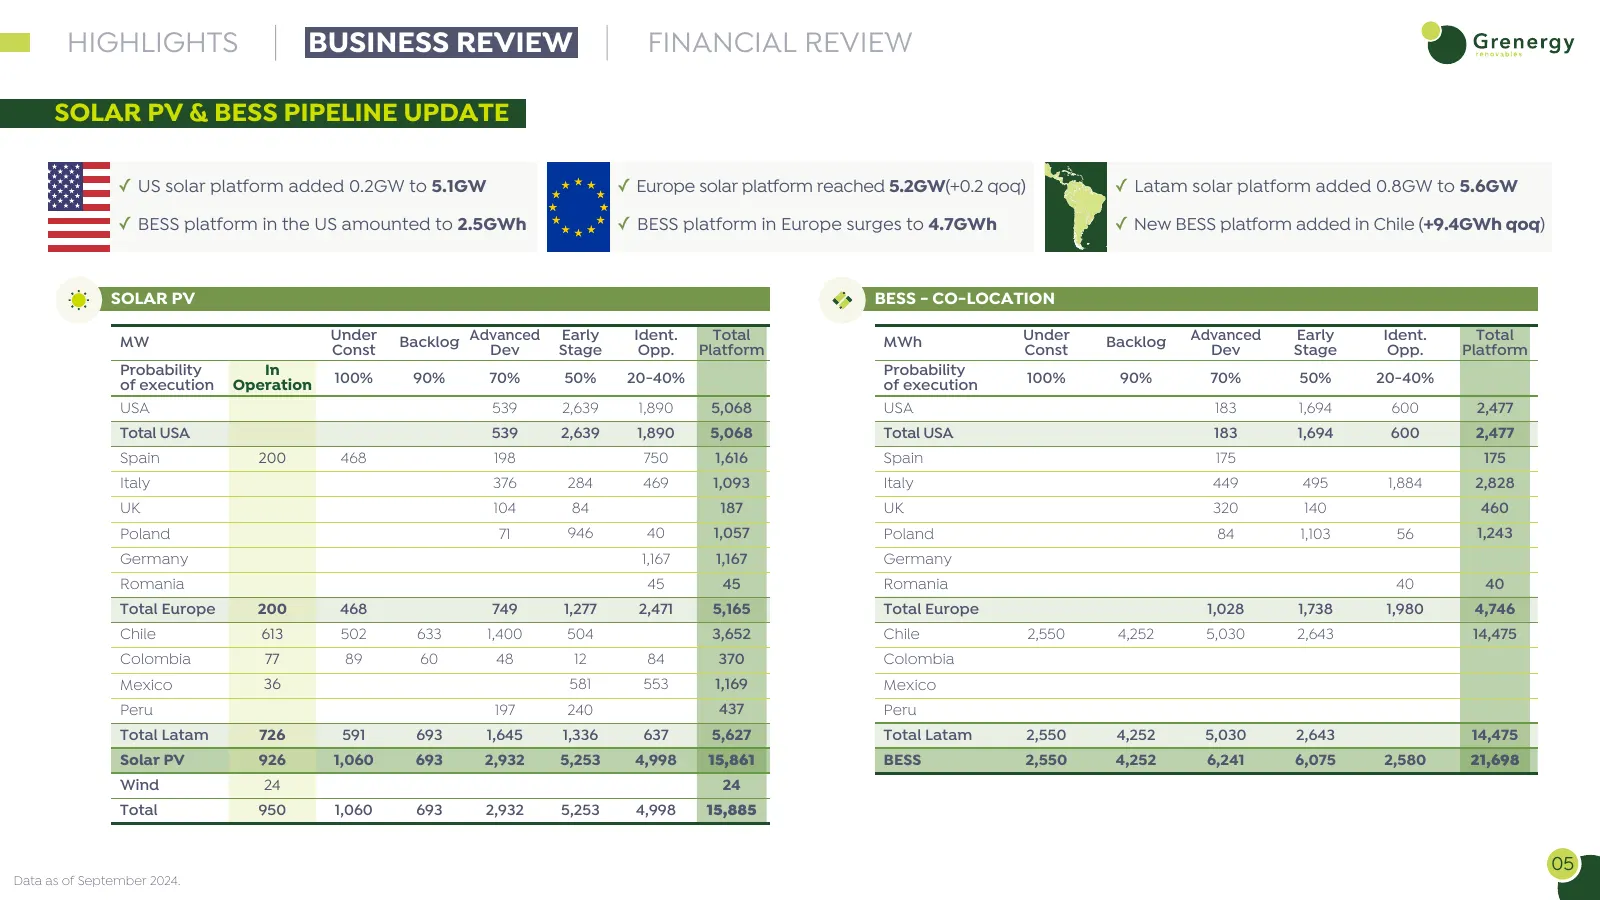
HIGHLIGHTS BUSINESS REVIEW FINANCIAL REVIEW SOLAR PV & BESS PIPELINE UPDATE ✓ US solar platform added 0.2GW to 5.1GW ✓ Europe solar platform reached 5.2GW(+0.2 qoq) ✓ Latam solar platform added 0.8GW to 5.6GW ✓ BESS platform in the US amounted to 2.5GWh ✓ BESS platform in Europe surges to 4.7GWh ✓ N
Slide 6: Oasis of Atacama Current Situation – From 4.1GWh to 5.0GWh
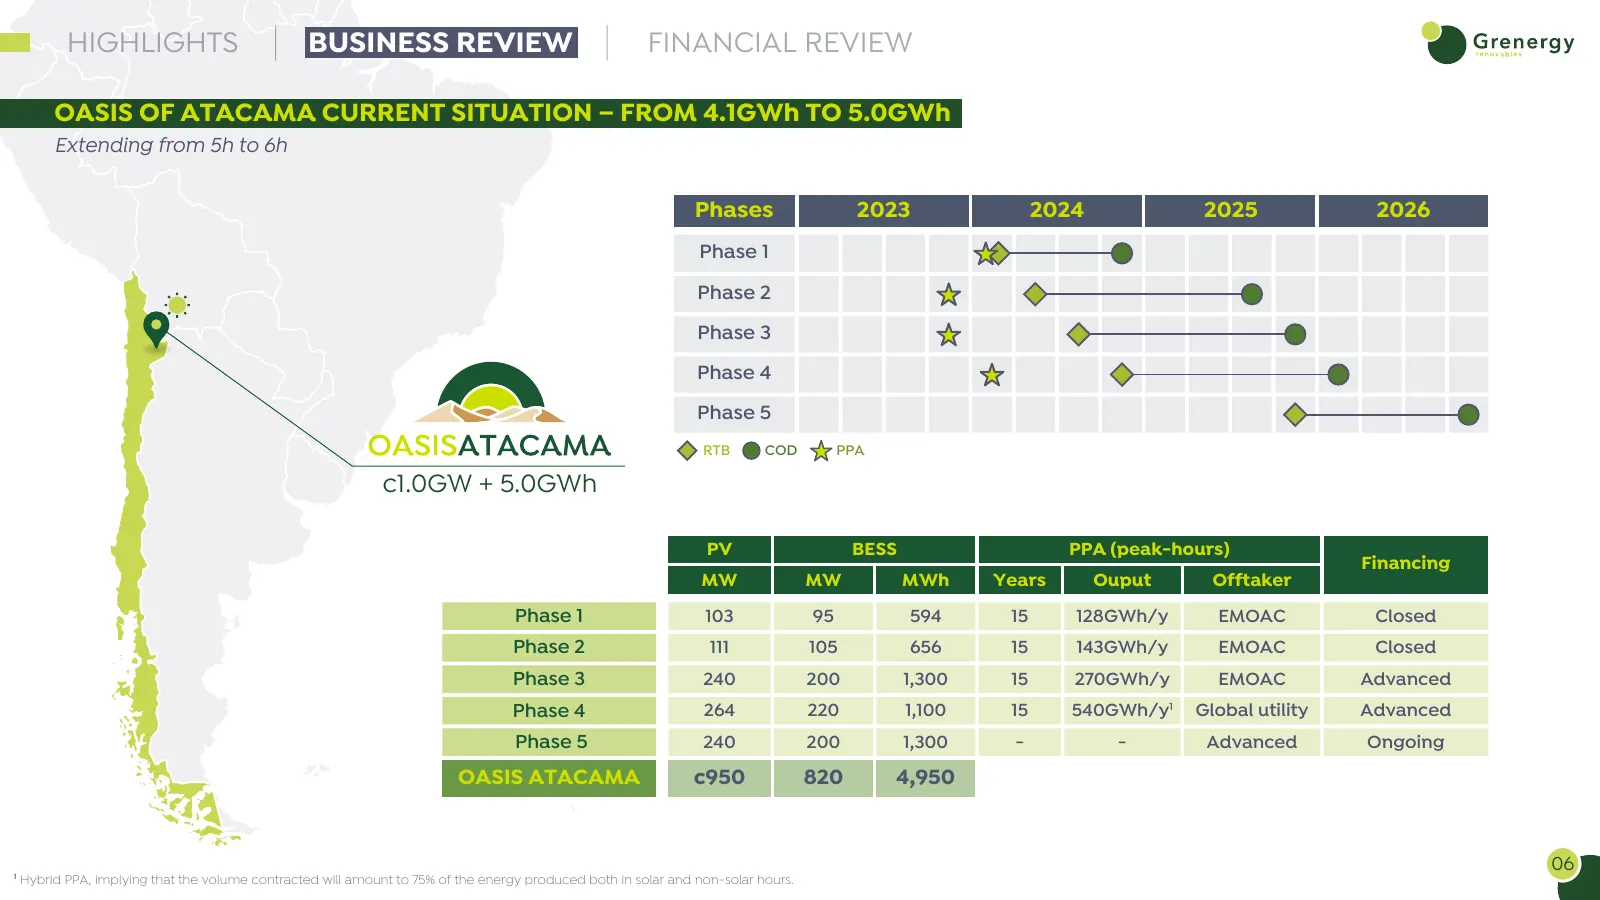
HIGHLIGHTS BUSINESS REVIEW FINANCIAL REVIEW OASIS OF ATACAMA CURRENT SITUATION – FROM 4.1GWh TO 5.0GWh Extending from 5h to 6h Phases 2023 2024 2025 2026 Phase 1 Phase 2 Phase 3 Phase 4 Phase 5 RTB COD PPA c1.0GW + 5.0GWh PV BESS PPA (peak-hours) Financing MW MW MWh Years Ouput Offtaker Phase 1 103
Slide 7: New Opportunity to Connect 6GWh BESS Thanks to the M&A Deal
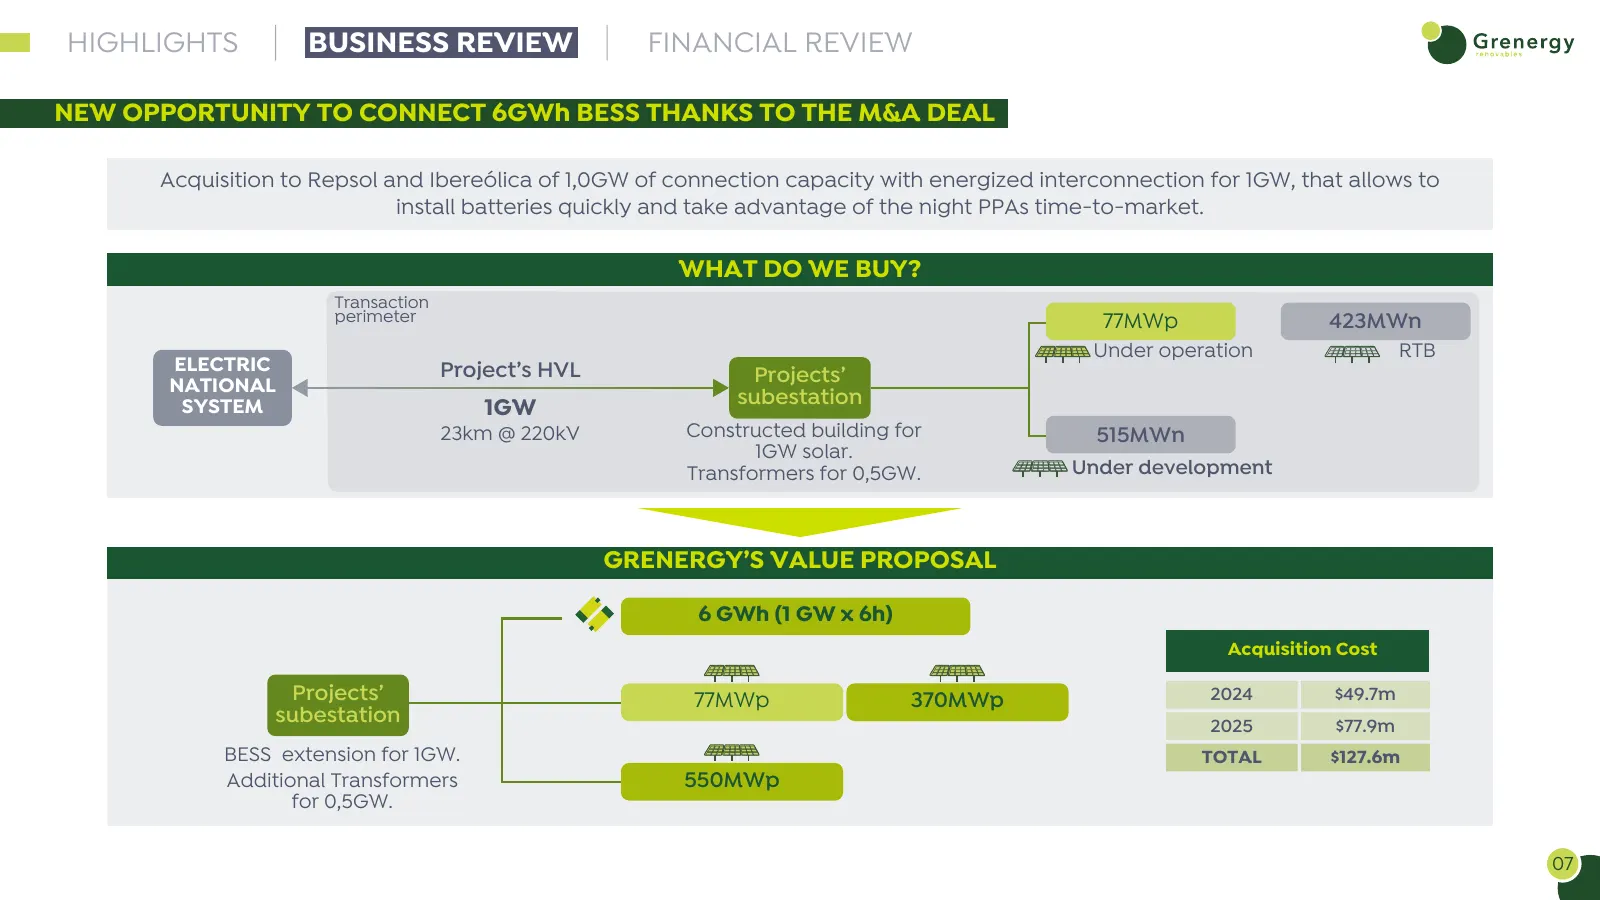
HIGHLIGHTS BUSINESS REVIEW FINANCIAL REVIEW NEW OPPORTUNITY TO CONNECT 6GWh BESS THANKS TO THE M&A DEAL Acquisition to Repsol and Ibereólica of 1,0GW of connection capacity with energized interconnection for 1GW, that allows to install batteries quickly and take advantage of the night PPAs time-to-m
Slide 8: Oasis of Atacama 2.0 – From 5.0GWh to c11.0GWh
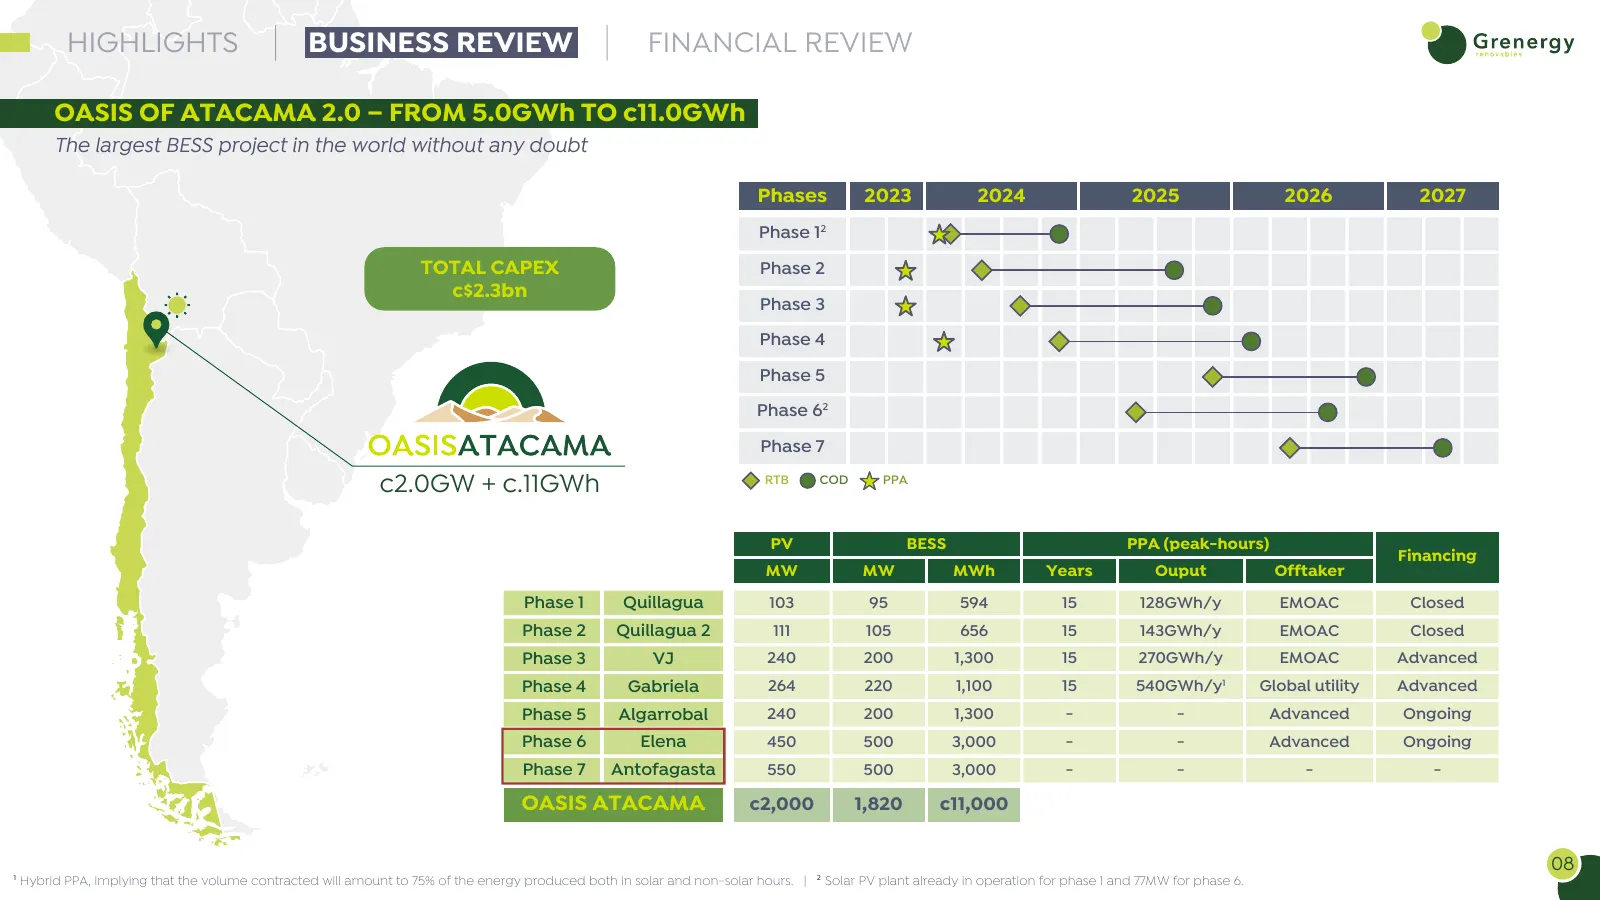
HIGHLIGHTS BUSINESS REVIEW FINANCIAL REVIEW OASIS OF ATACAMA 2.0 – FROM 5.0GWh TO c11.0GWh The largest BESS project in the world without any doubt Phases 2023 2024 2025 2026 2027 Phase 12 TOTAL CAPEX Phase 2 c$2.3bn Phase 3 Phase 4 Phase 5 Phase 62 Phase 7 c2.0GW + c.11GWh RTB COD PPA PV BESS PPA (p
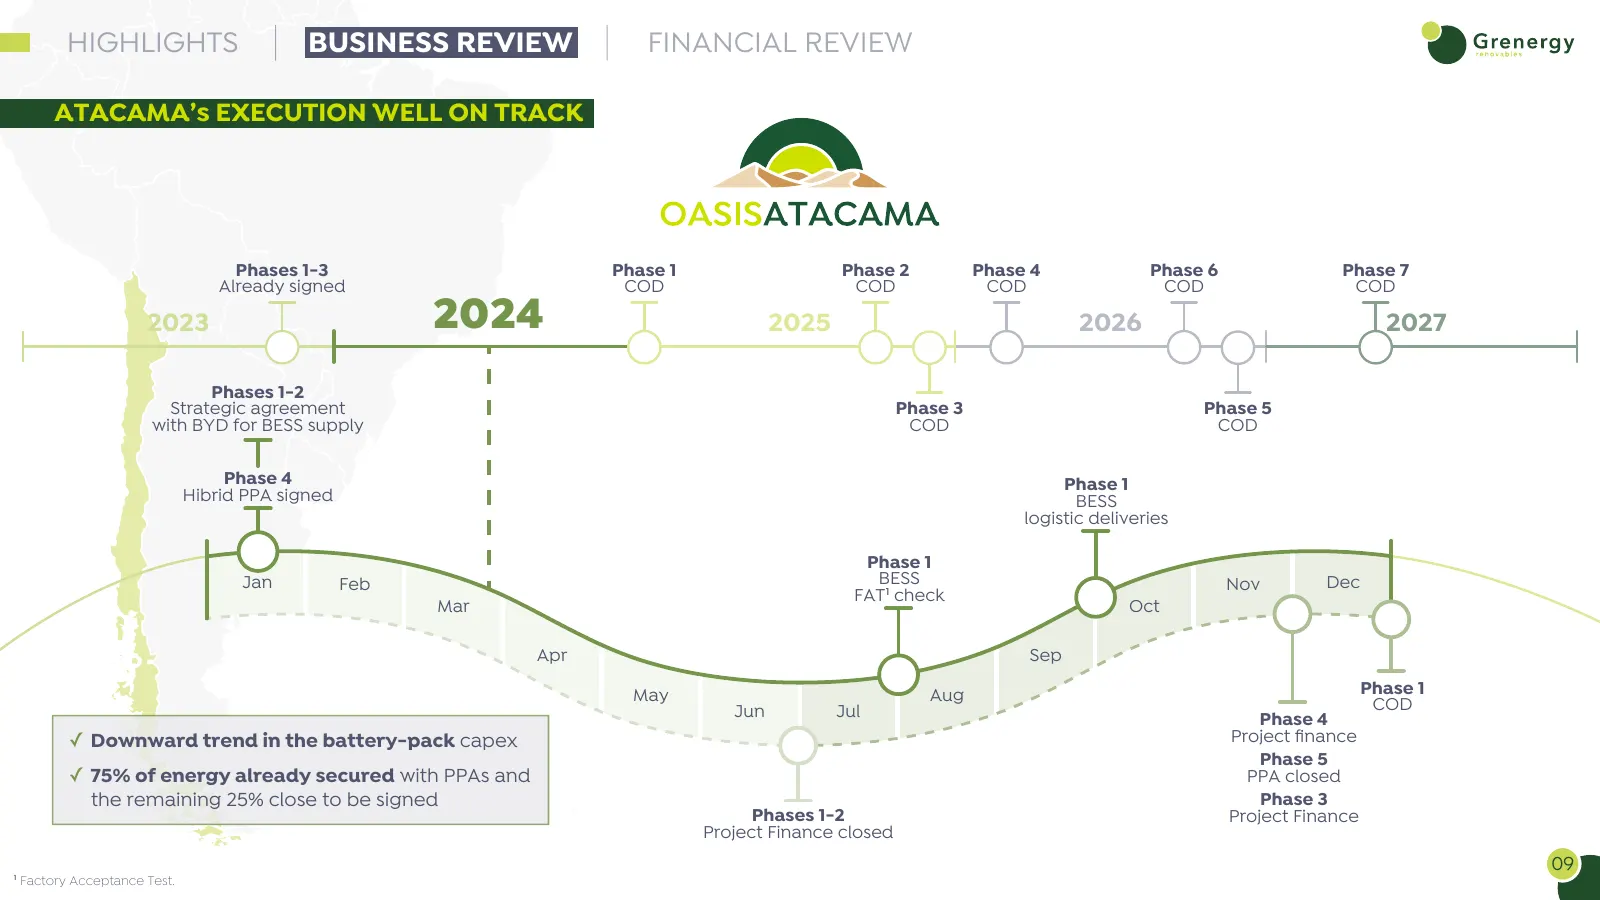
Slide 9: Atacama's Execution Well on Track
HIGHLIGHTS BUSINESS REVIEW FINANCIAL REVIEW ATACAMA’s EXECUTION WELL ON TRACK Phases 1-3 Phase 1 Phase 2 Phase 4 Phase 6 Phase 7 Already signed COD COD COD COD COD 2023 2024 2025 2026 2027 Phases 1-2 Strategic agreement Phase 3 Phase 5 with BYD for BESS supply COD COD Phase 4 Phase 1 Hibrid PPA sign
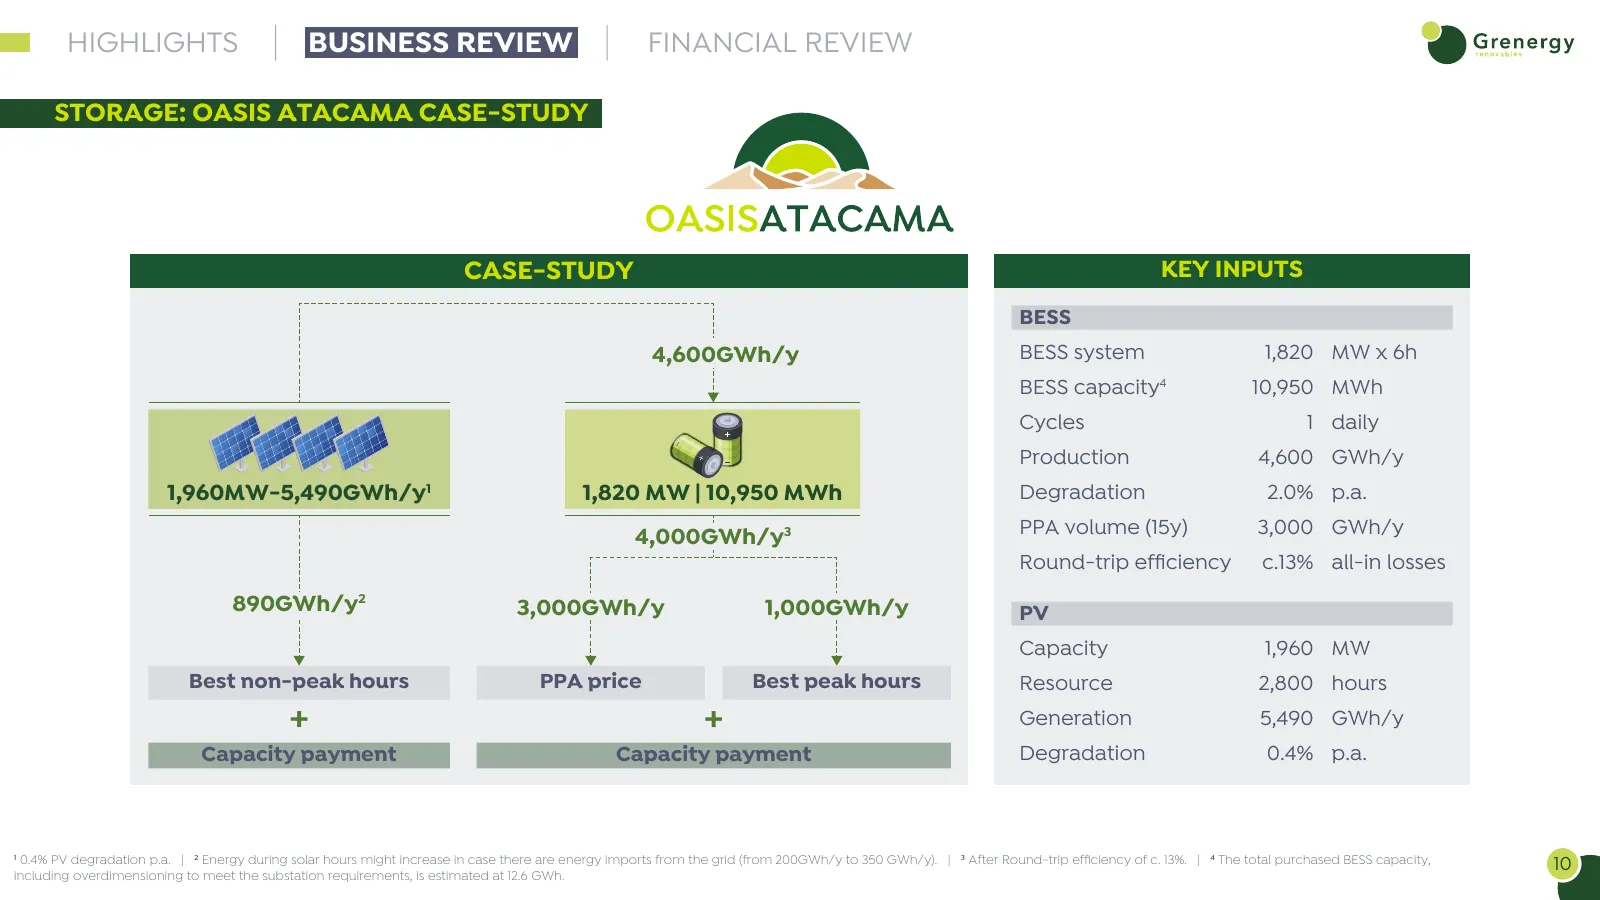
Slide 10: Storage: Oasis Atacama Case-Study
HIGHLIGHTS BUSINESS REVIEW FINANCIAL REVIEW STORAGE: OASIS ATACAMA CASE-STUDY CASE-STUDY KEY INPUTS BESS 4,600GWh/y BESS system 1,820 MW x 6h BESS capacity4 10,950 MWh Cycles 1 daily Production 4,600 GWh/y 1,960MW-5,490GWh/y1 1,820 MW | 10,950 MWh Degradation 2.0% p.a. 4,000GWh/y3 PPA volume (15y) 3
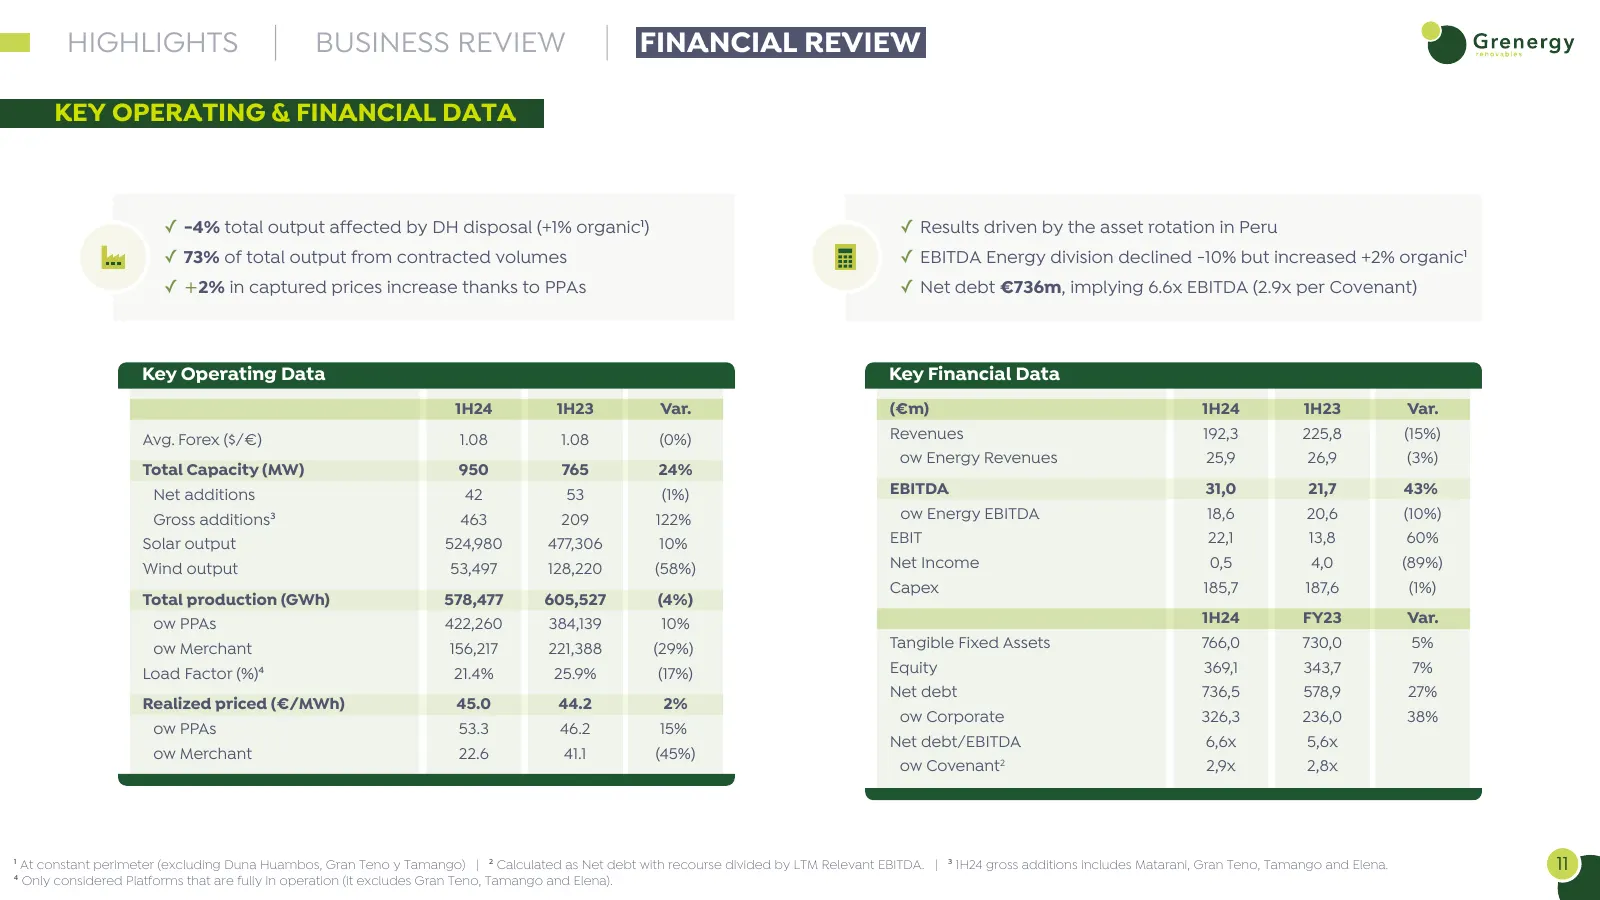
Slide 11: Key Operating & Financial Data
HIGHLIGHTS BUSINESS REVIEW FINANCIAL REVIEW KEY OPERATING & FINANCIAL DATA ✓ -4% total output affected by DH disposal (+1% organic1) ✓ Results driven by the asset rotation in Peru ✓ 73% of total output from contracted volumes ✓ EBITDA Energy division declined -10% but increased +2% organic1 ✓ +2% in
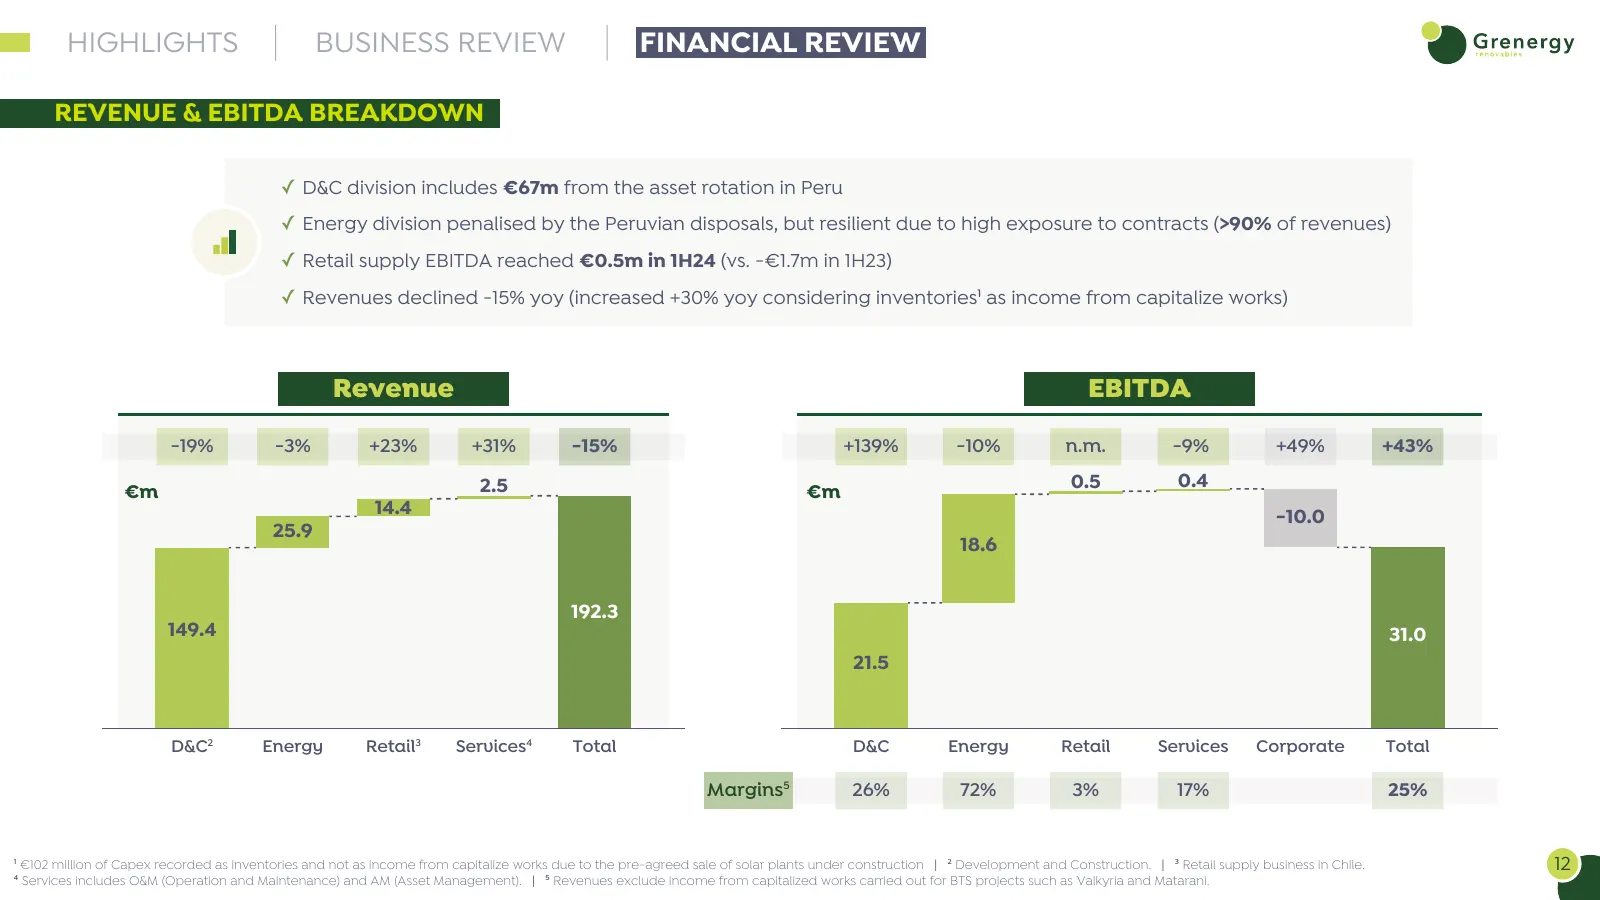
Slide 12: Revenue & EBITDA Breakdown
HIGHLIGHTS BUSINESS REVIEW FINANCIAL REVIEW REVENUE & EBITDA BREAKDOWN ✓ D&C division includes €67m from the asset rotation in Peru ✓ Energy division penalised by the Peruvian disposals, but resilient due to high exposure to contracts (>90% of revenues) ✓ Retail supply EBITDA reached €0.5m in 1H24 (
Slide 13: Capex
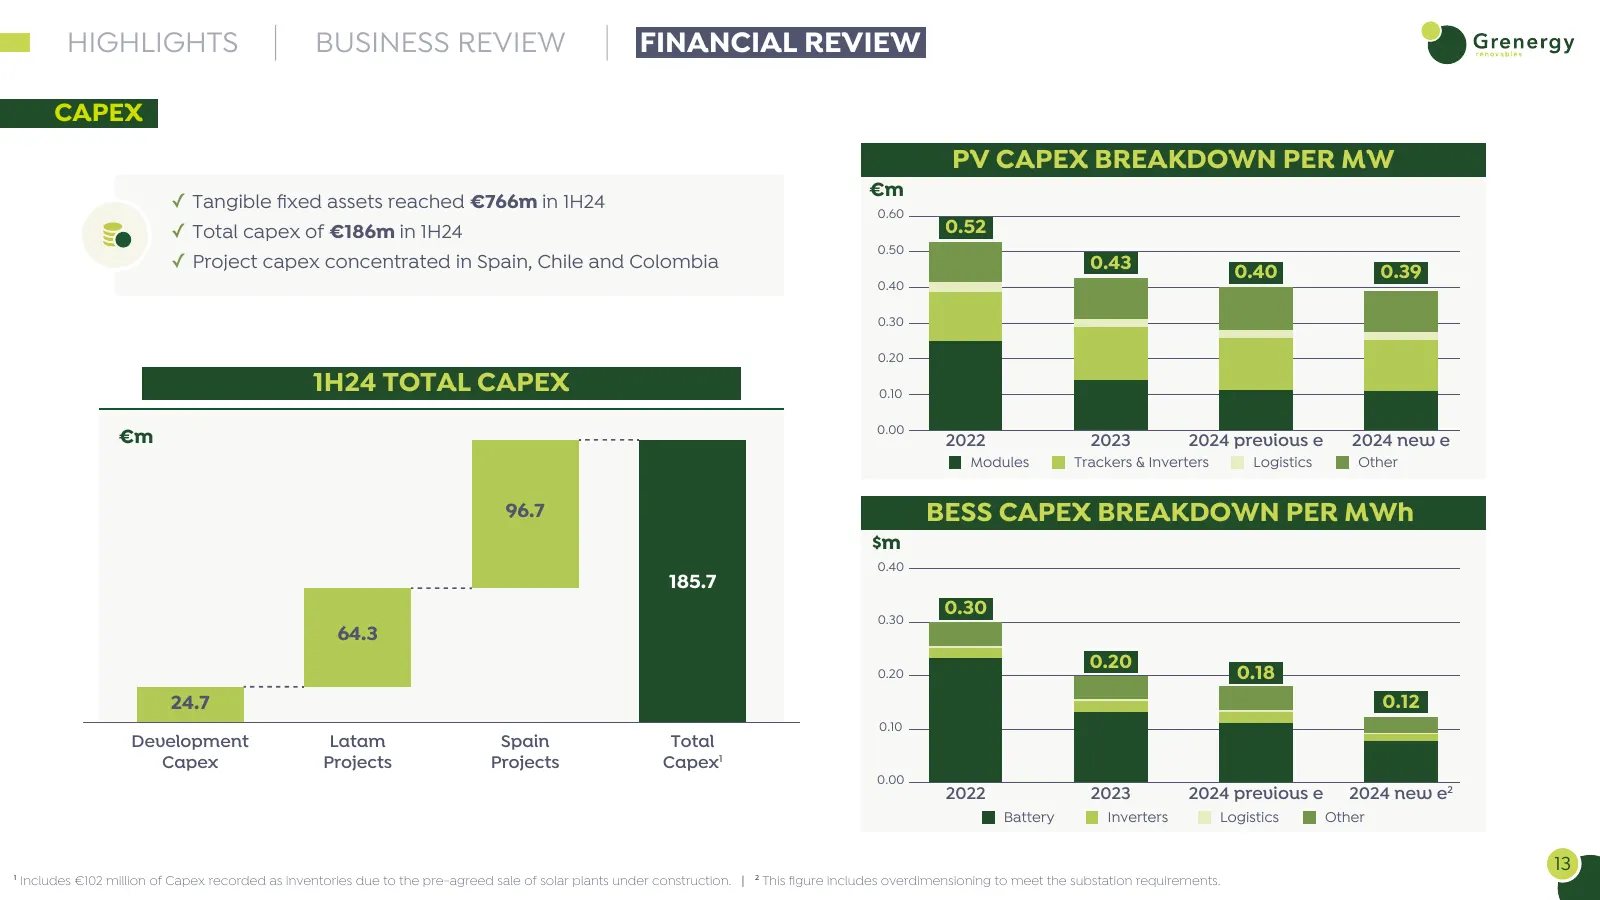
HIGHLIGHTS BUSINESS REVIEW FINANCIAL REVIEW CAPEX PV CAPEX BREAKDOWN PER MW €m ✓ Tangible fixed assets reached €766m in 1H24 0.60 ✓ Total capex of €186m in 1H24 0.52 0.50 ✓ Project capex concentrated in Spain, Chile and Colombia 0.43 0.40 0.39 0.40 0.30 0.20 1H24 TOTAL CAPEX 0.10 0.00 €m 2022 2023 2
Slide 14: Cash Flow
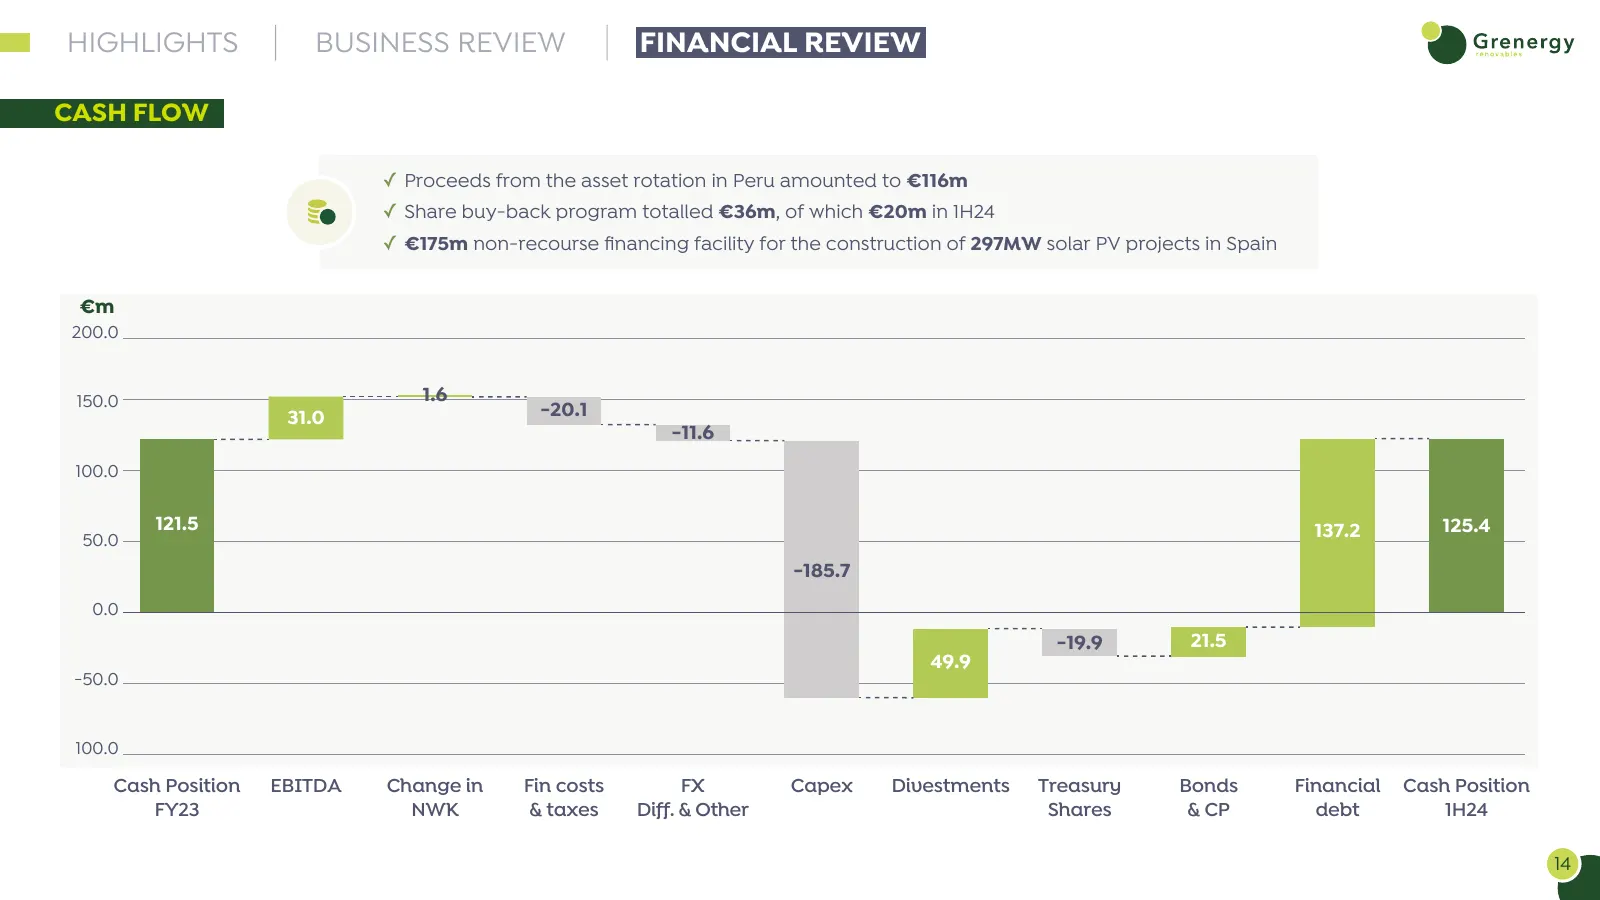
HIGHLIGHTS BUSINESS REVIEW FINANCIAL REVIEW CASH FLOW ✓ Proceeds from the asset rotation in Peru amounted to €116m ✓ Share buy-back program totalled €36m, of which €20m in 1H24 ✓ €175m non-recourse financing facility for the construction of 297MW solar PV projects in Spain €m 200.0 150.0 1.6 31.0 -2
Slide 15: Leverage & Liquidity
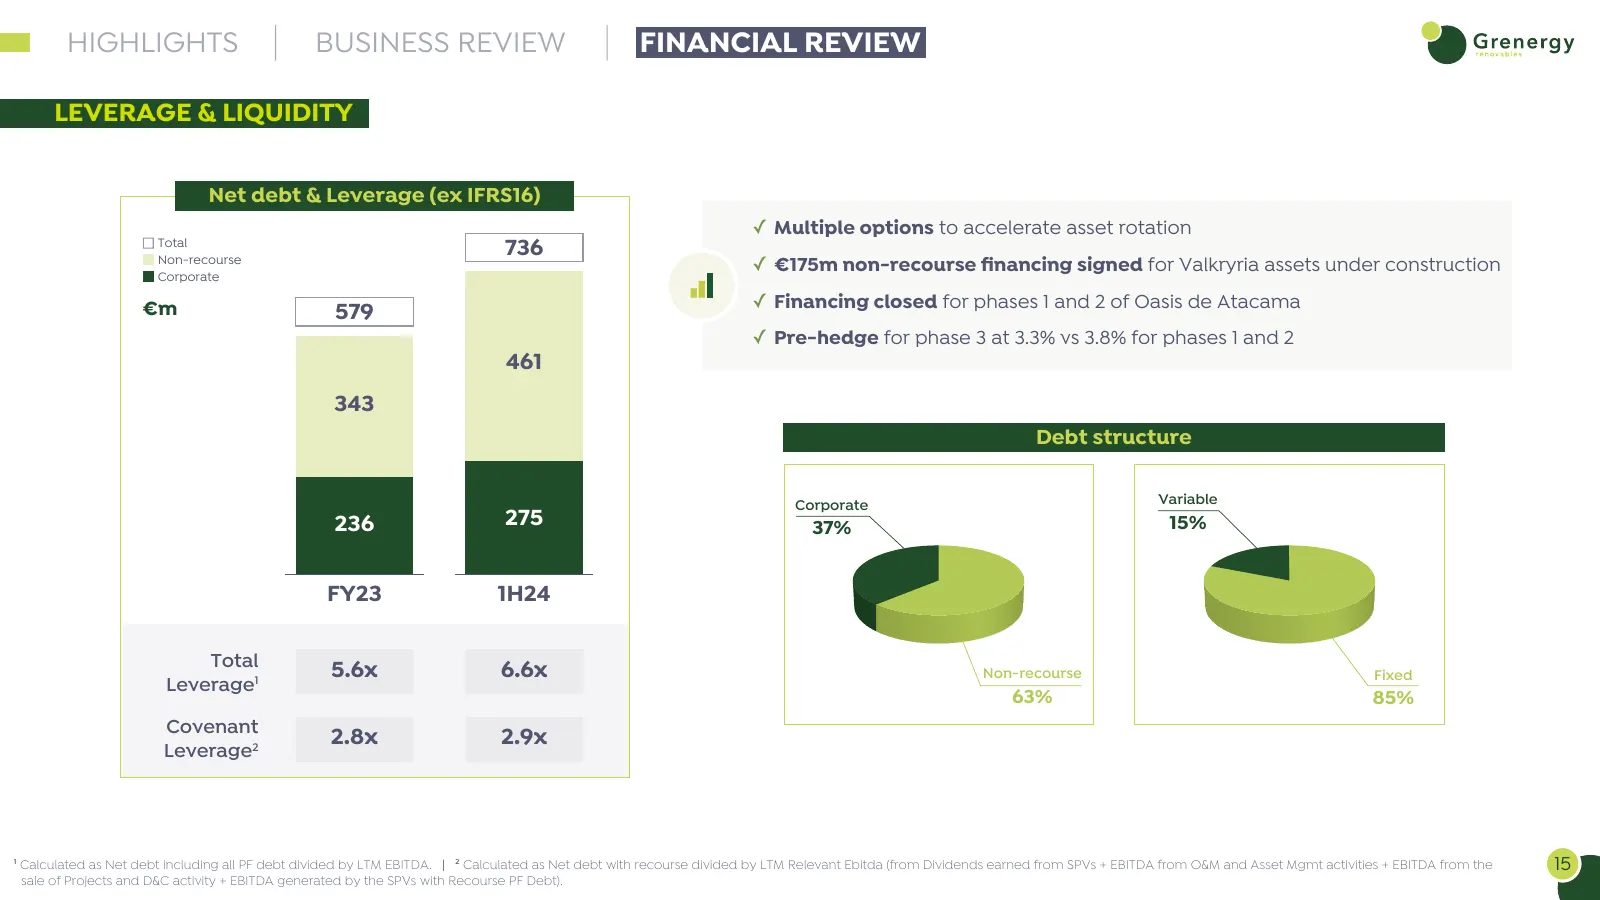
HIGHLIGHTS BUSINESS REVIEW FINANCIAL REVIEW LEVERAGE & LIQUIDITY Net debt & Leverage (ex IFRS16) ✓ Multiple options to accelerate asset rotation Total 736 Non-recourse Corporate ✓ €175m non-recourse financing signed for Valkryria assets under construction €m ✓ Financing closed for phases 1 and 2 of
Slide 16: Capex Plan – Gross Investment 2023-26
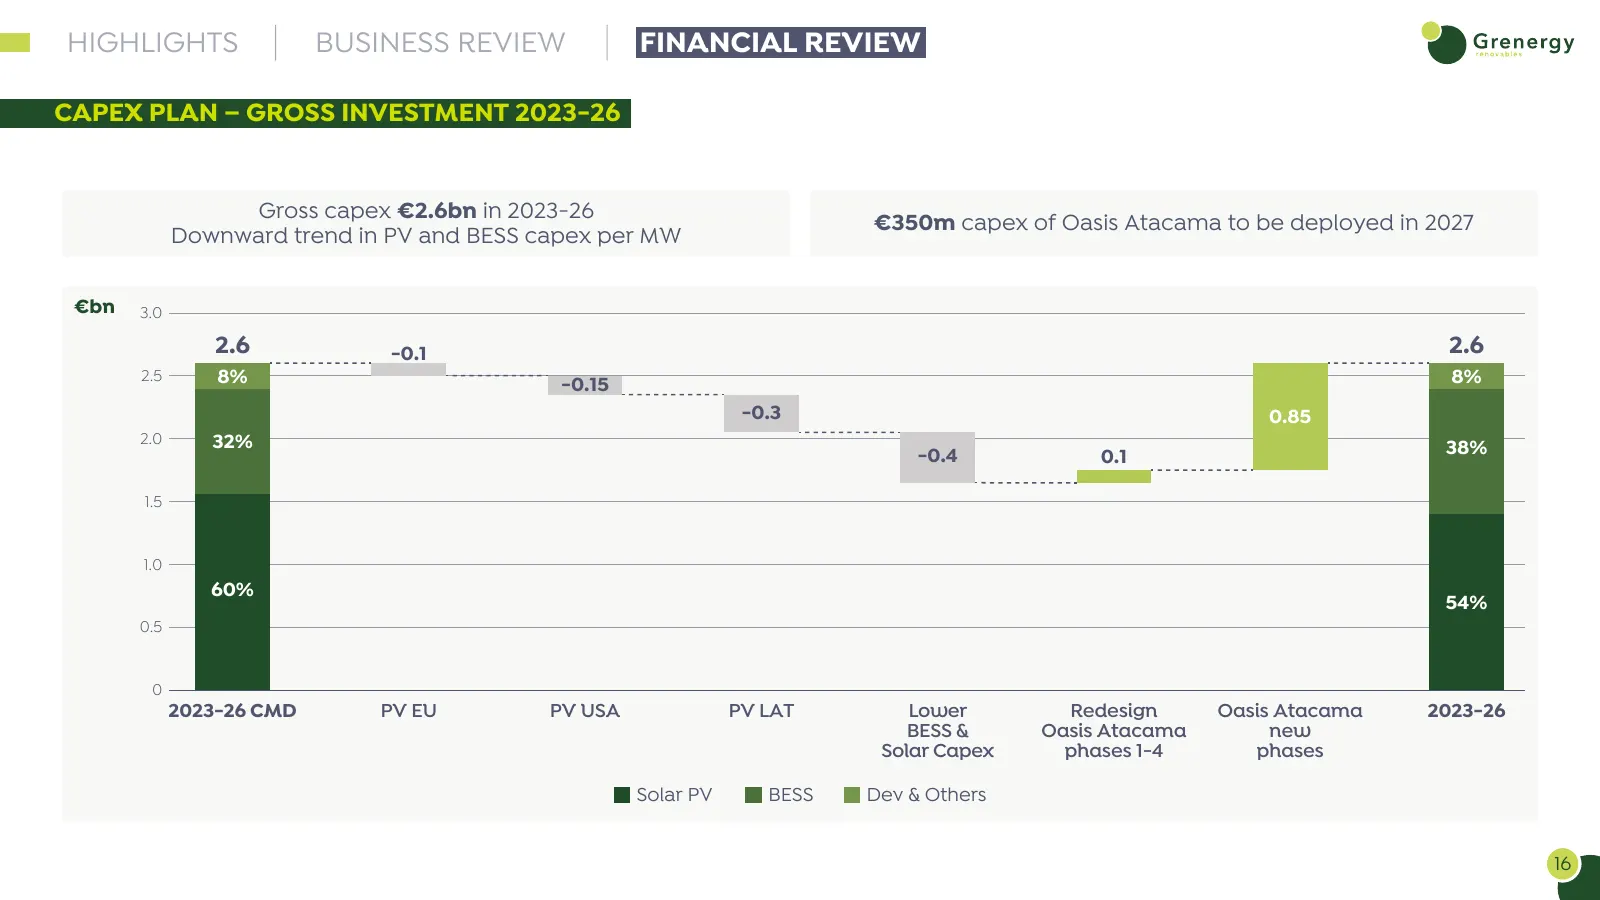
HIGHLIGHTS BUSINESS REVIEW FINANCIAL REVIEW CAPEX PLAN – GROSS INVESTMENT 2023-26 Gross capex €2.6bn in 2023-26 €350m capex of Oasis Atacama to be deployed in 2027 Downward trend in PV and BESS capex per MW €bn 3.0 2.6 -0.1 2.6 2.5 8% -0.15 8% -0.3 0.85 2.0 32% 38% -0.4 0.1 1.5 1.0 60% 54% 0.5 0 202
Slide 17: Capital Allocation & Leverage
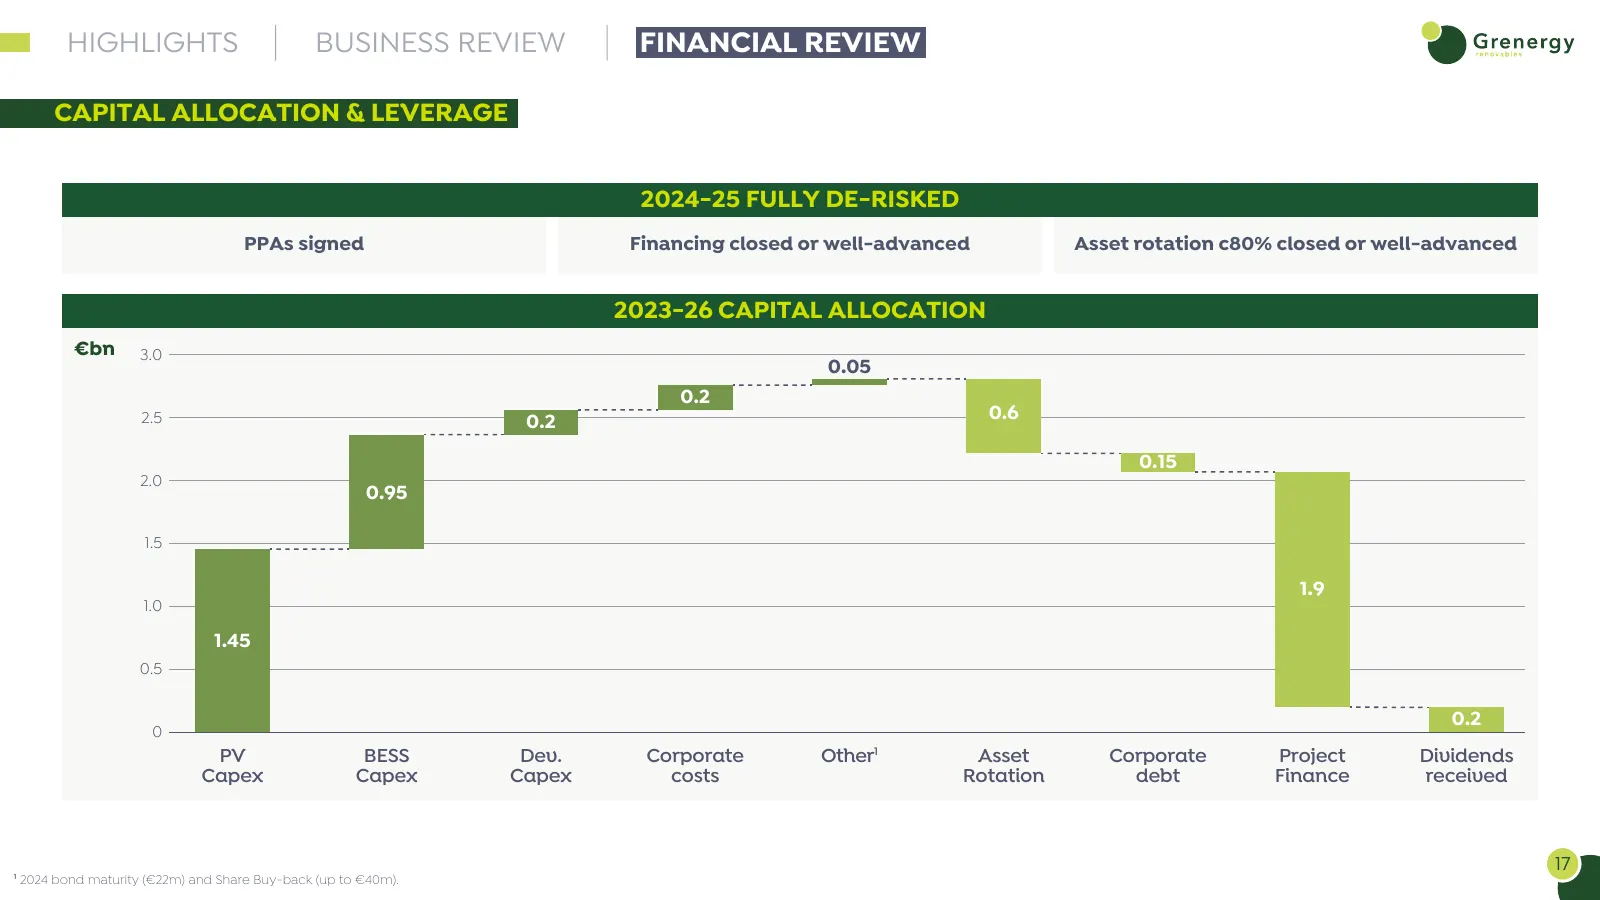
HIGHLIGHTS BUSINESS REVIEW FINANCIAL REVIEW CAPITAL ALLOCATION & LEVERAGE 2024-25 FULLY DE-RISKED PPAs signed Financing closed or well-advanced Asset rotation c80% closed or well-advanced 2023-26 CAPITAL ALLOCATION €bn 3.0 0.05 0.2 2.5 0.2 0.6 0.15 2.0 0.95 1.5 1.9 1.0 1.45 0.5 0.2 0 PV BESS Dev. Co
Slide 18: Appendices
APPENDICES
Slide 19: Platform Update: Projects in Operation, Under Construction & Backlog
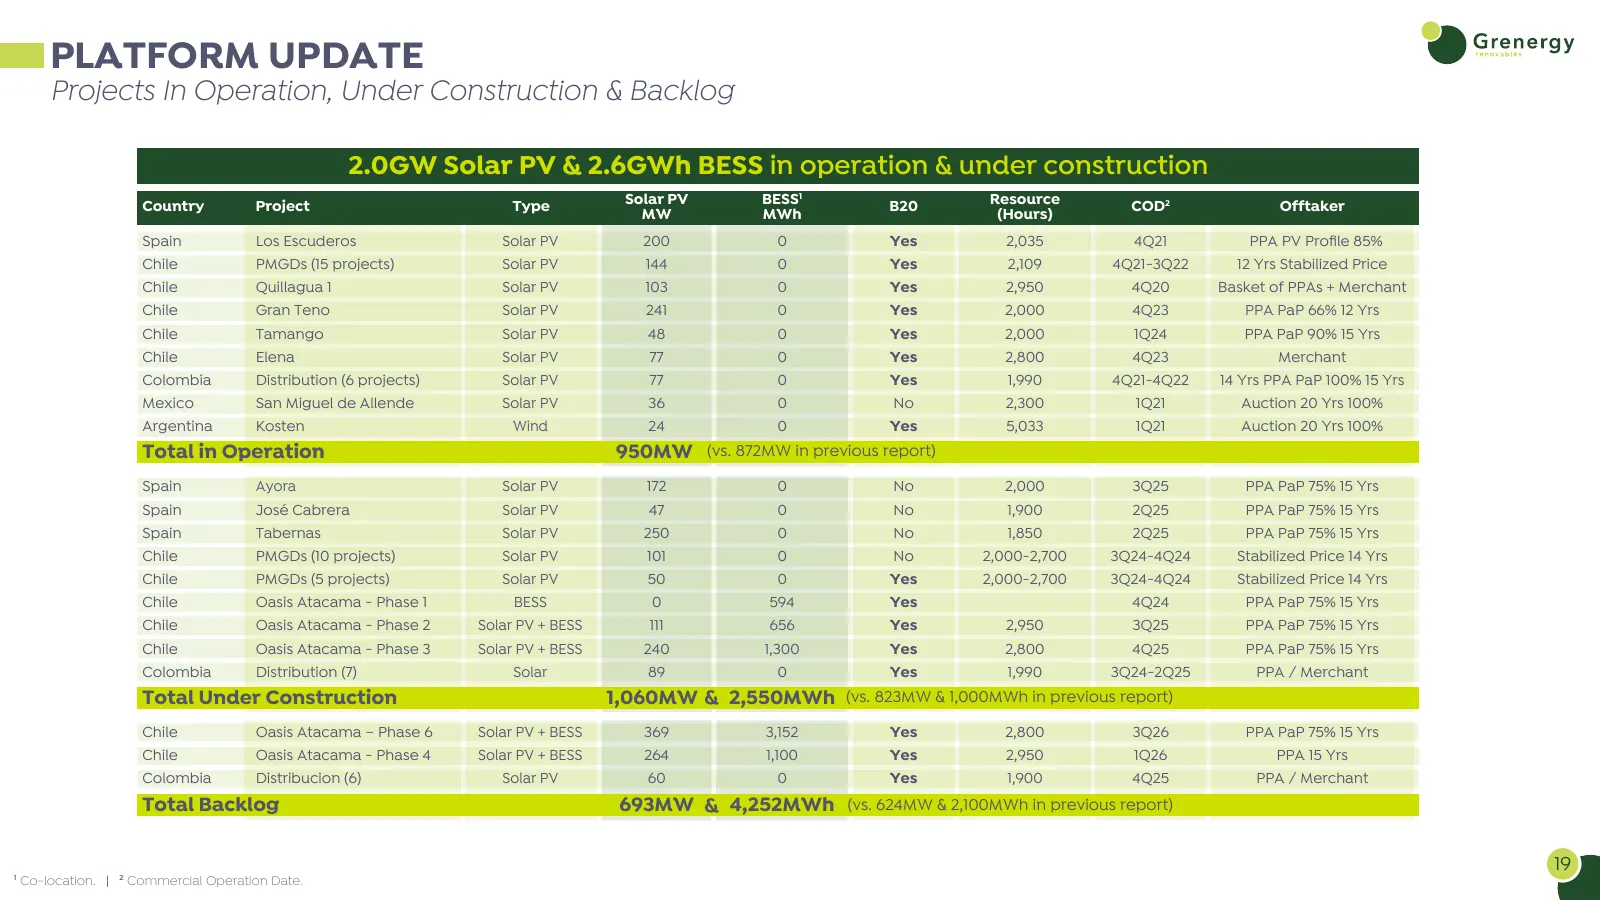
PLATFORM UPDATE Projects In Operation, Under Construction & Backlog 2.0GW Solar PV & 2.6GWh BESS in operation & under construction Country Project Type Solar PV BESS1 B20 Resource COD2 Offtaker MW MWh (Hours) Spain Los Escuderos Solar PV 200 0 Yes 2,035 4Q21 PPA PV Profile 85% Chile PMGDs (15 project
Slide 20: Platform Update: Projects in Advanced Development
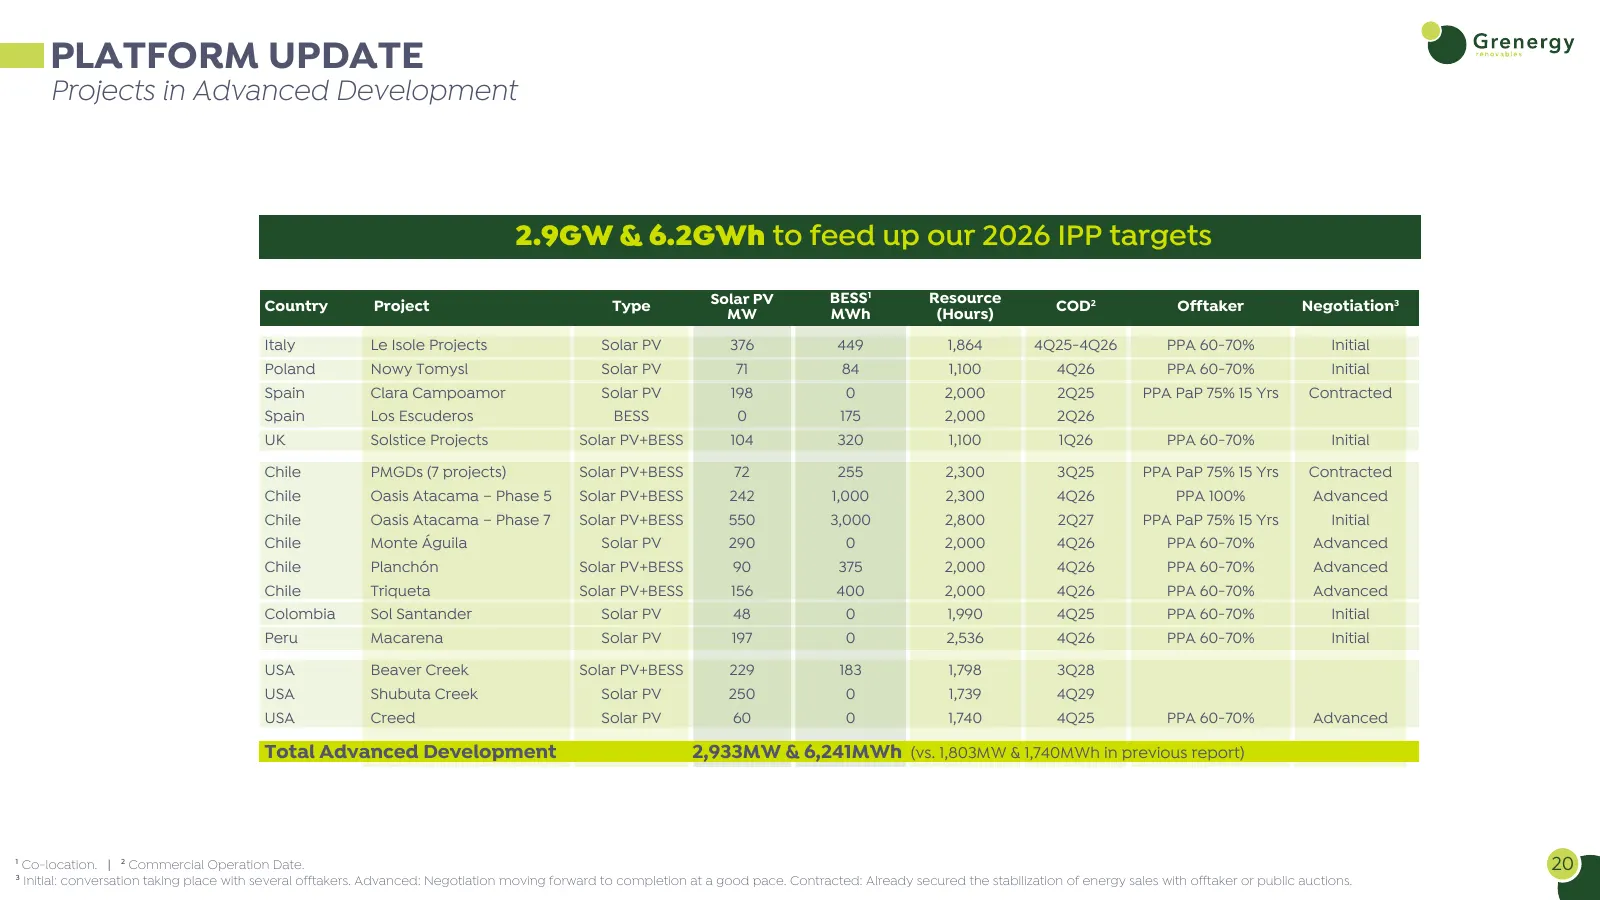
PLATFORM UPDATE Projects in Advanced Development 2.9GW & 6.2GWh to feed up our 2026 IPP targets Country Project Type Solar PV BESS1 Resource COD2 Offtaker Negotiation3 MW MWh (Hours) Italy Le Isole Projects Solar PV 376 449 1,864 4Q25-4Q26 PPA 60-70% Initial Poland Nowy Tomysl Solar PV 71 84 1,100 4
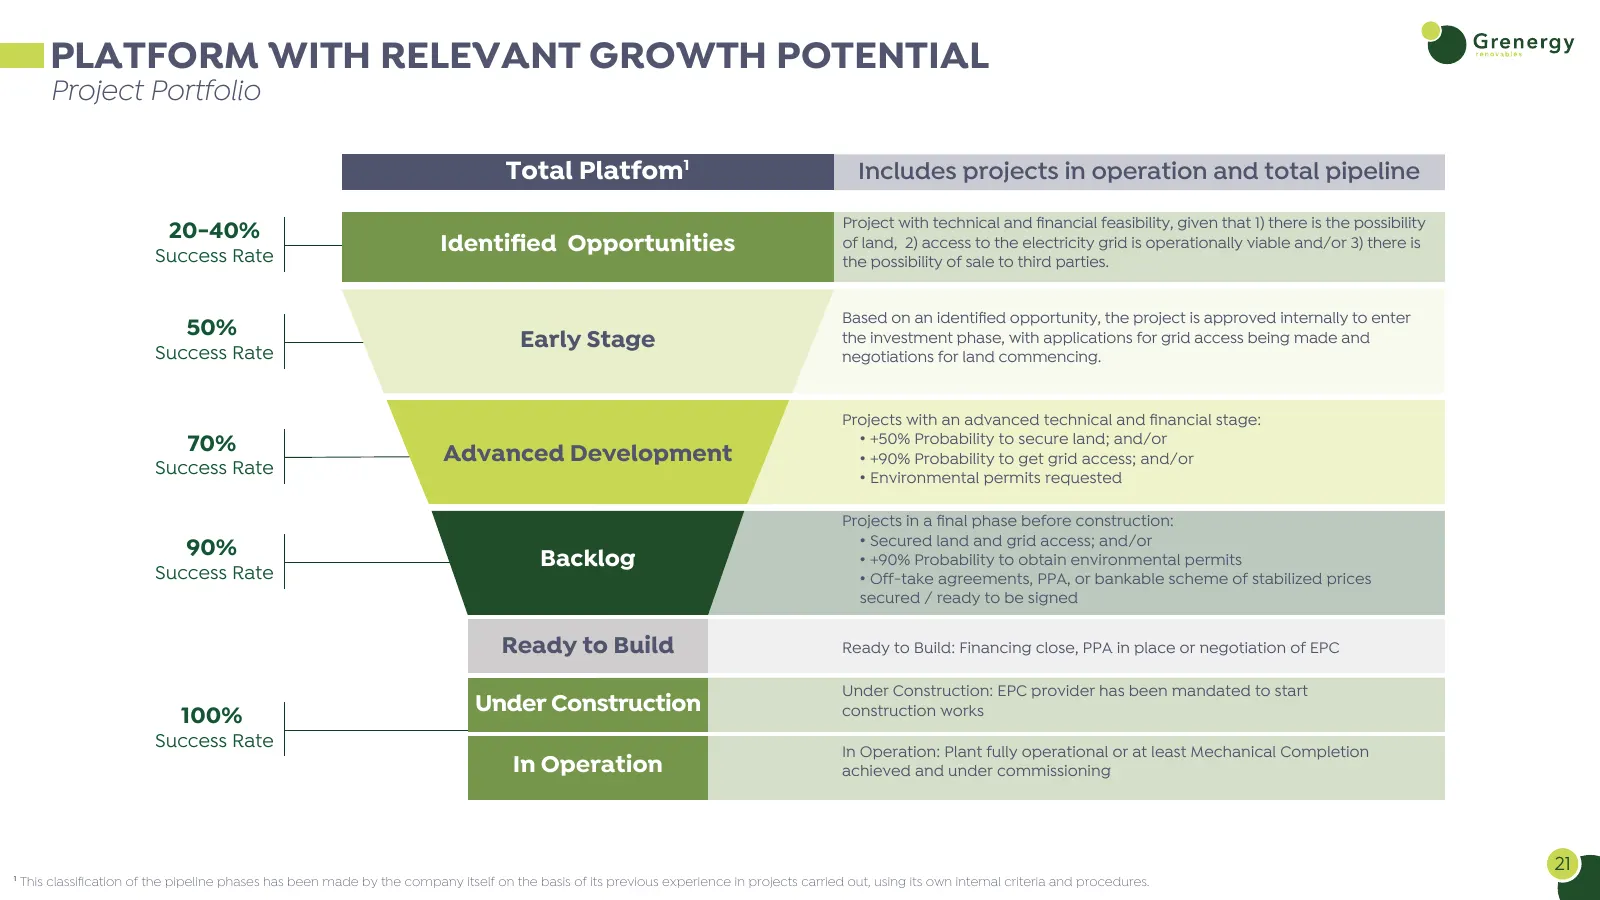
Slide 21: Platform with Relevant Growth Potential
PLATFORM WITH RELEVANT GROWTH POTENTIAL Project Portfolio Total Platfom1 Includes projects in operation and total pipeline Project with technical and financial feasibility, given that 1) there is the possibility 20-40% Success Rate Identified Opportunities of land, 2) access to the electricity grid is
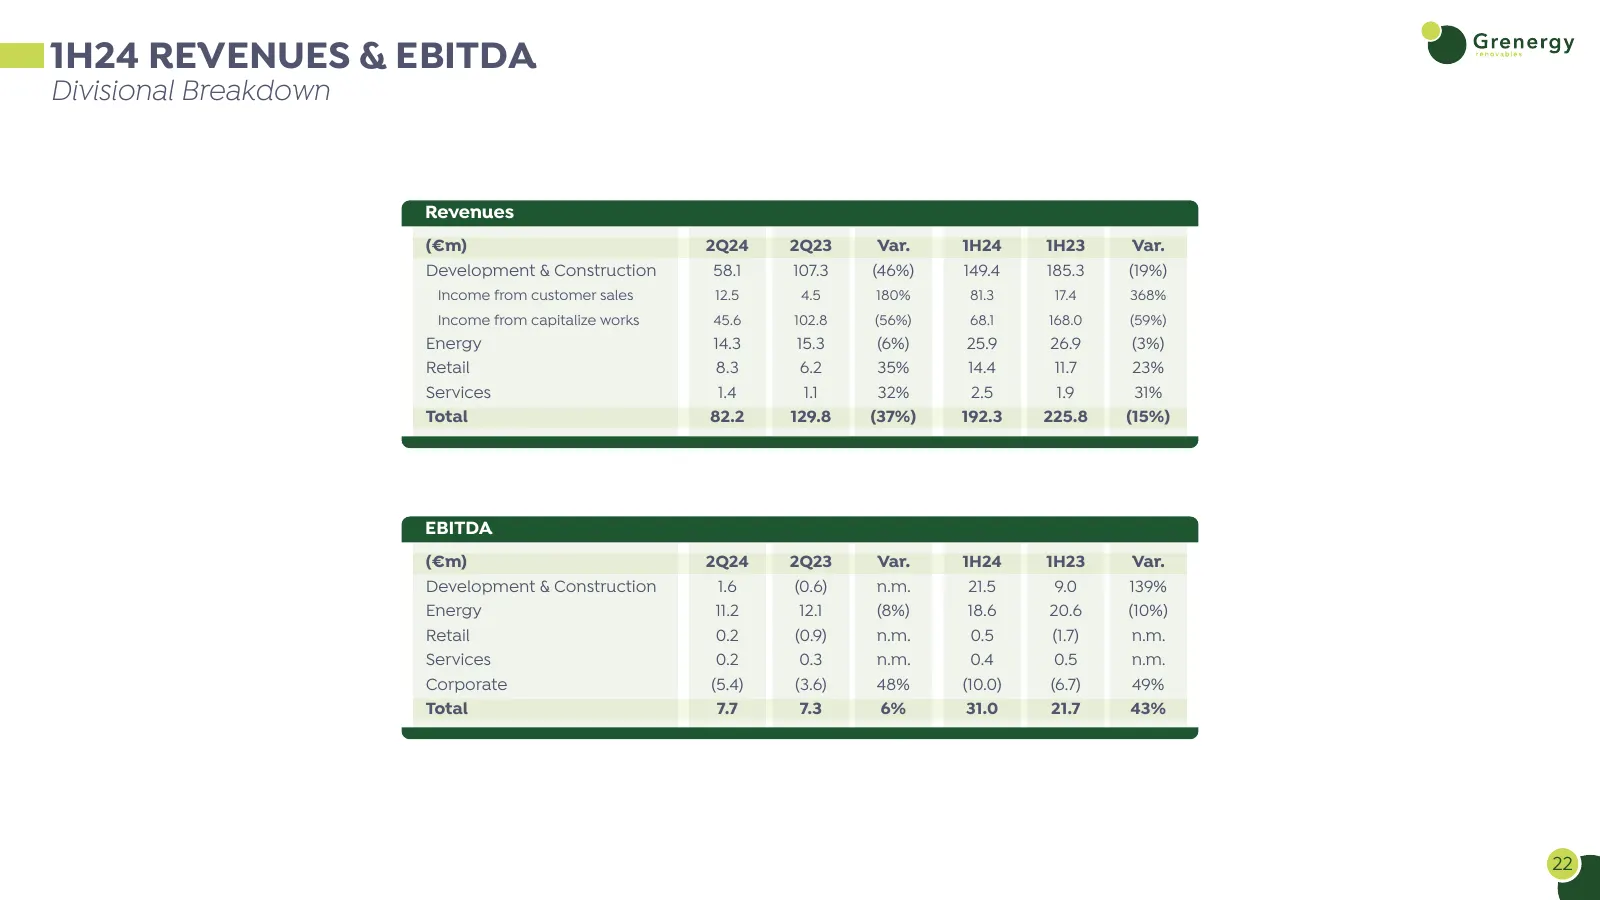
Slide 22: 1H24 Revenues & EBITDA
1H24 REVENUES & EBITDA Divisional Breakdown Revenues (€m) 2Q24 2Q23 Var. 1H24 1H23 Var. Development & Construction 58.1 107.3 (46%) 149.4 185.3 (19%) Income from customer sales 12.5 4.5 180% 81.3 17.4 368% Income from capitalize works 45.6 102.8 (56%) 68.1 168.0 (59%) Energy 14.3 15.3 (6%) 25.9 26.9
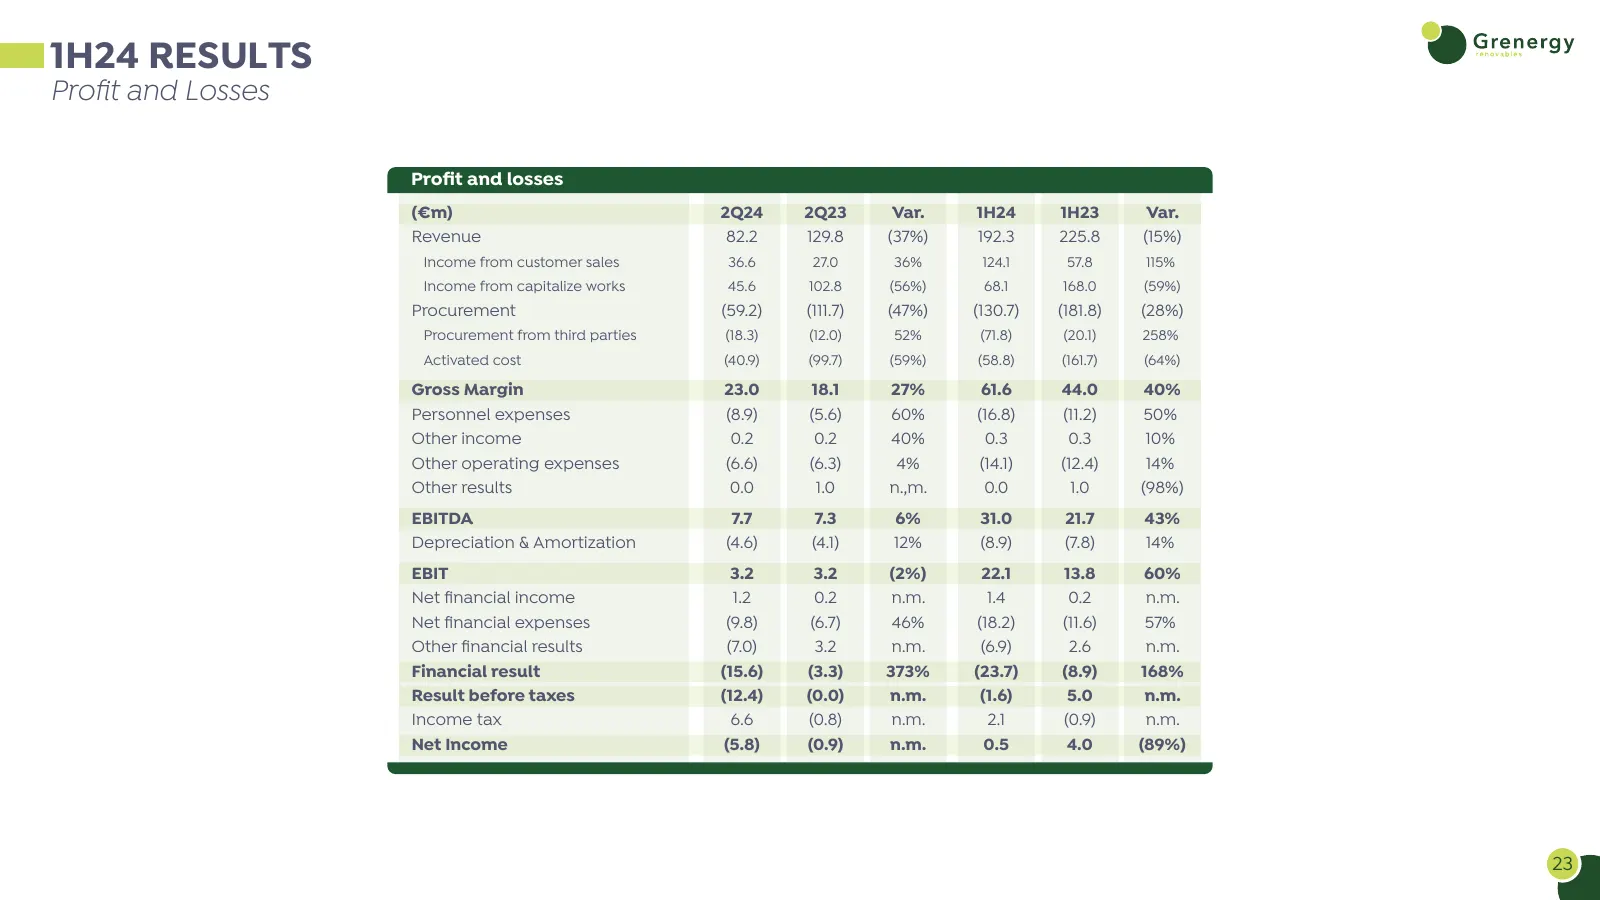
Slide 23: 1H24 Results: Profit and Losses
1H24 RESULTS Profit and Losses Profit and losses (€m) 2Q24 2Q23 Var. 1H24 1H23 Var. Revenue 82.2 129.8 (37%) 192.3 225.8 (15%) Income from customer sales 36.6 27.0 36% 124.1 57.8 115% Income from capitalize works 45.6 102.8 (56%) 68.1 168.0 (59%) Procurement (59.2) (111.7) (47%) (130.7) (181.8) (28%)
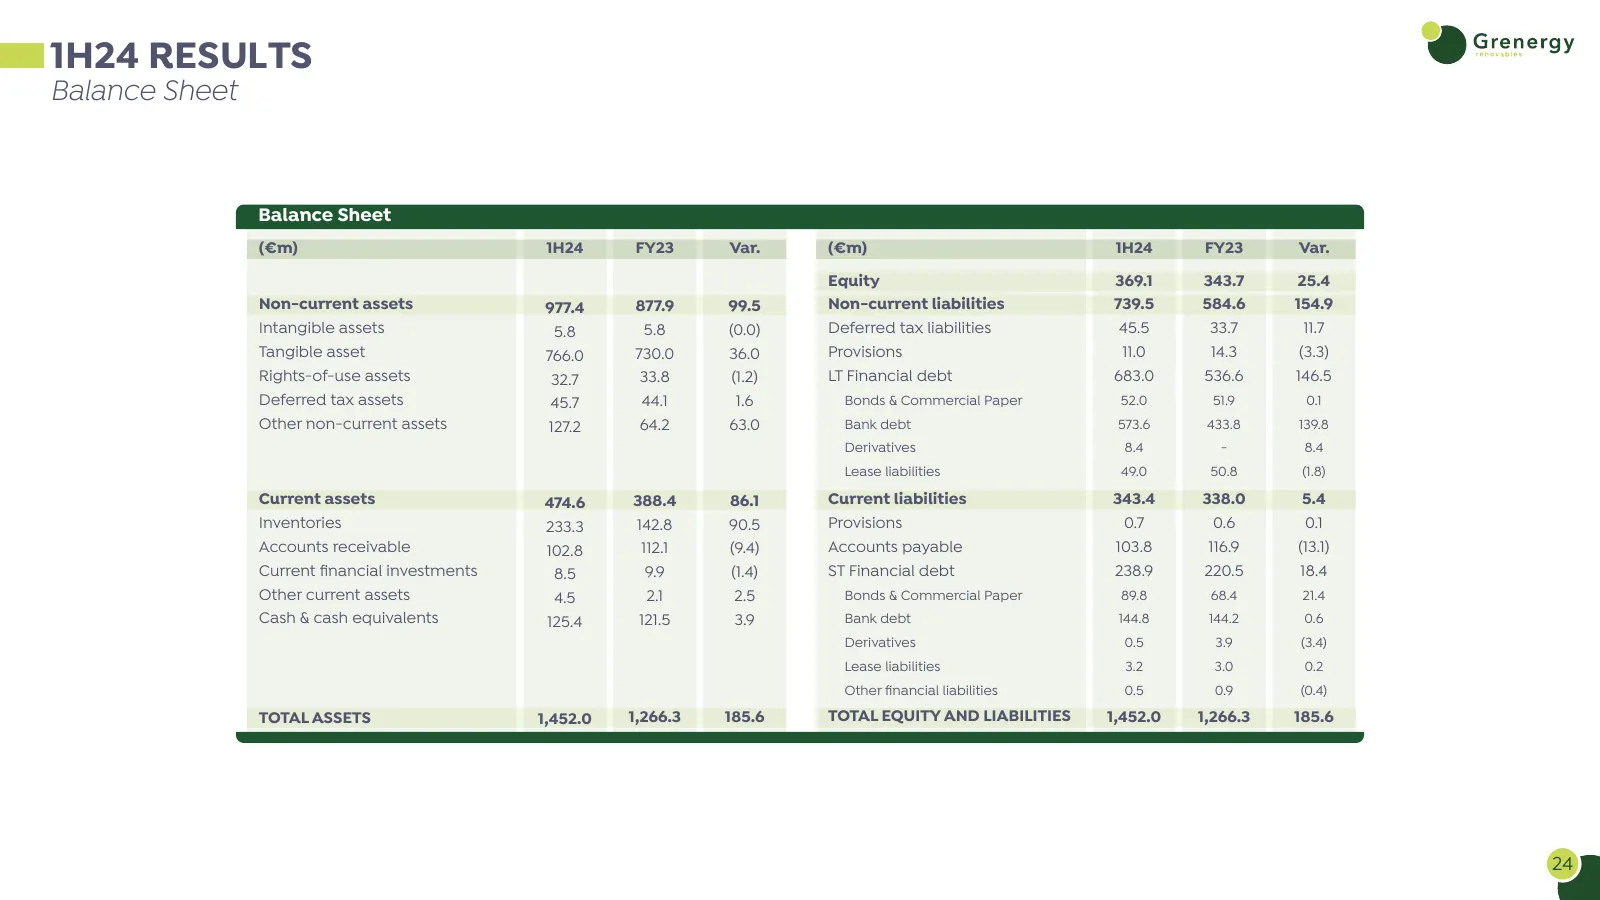
Slide 24: 1H24 Results: Balance Sheet
1H24 RESULTS Balance Sheet Balance Sheet (€m) 1H24 FY23 Var. (€m) 1H24 FY23 Var. Equity 369.1 343.7 25.4 Non-current assets 977.4 877.9 99.5 Non-current liabilities 739.5 584.6 154.9 Intangible assets 5.8 5.8 (0.0) Deferred tax liabilities 45.5 33.7 11.7 Tangible asset 766.0 730.0 36.0 Provisions 11
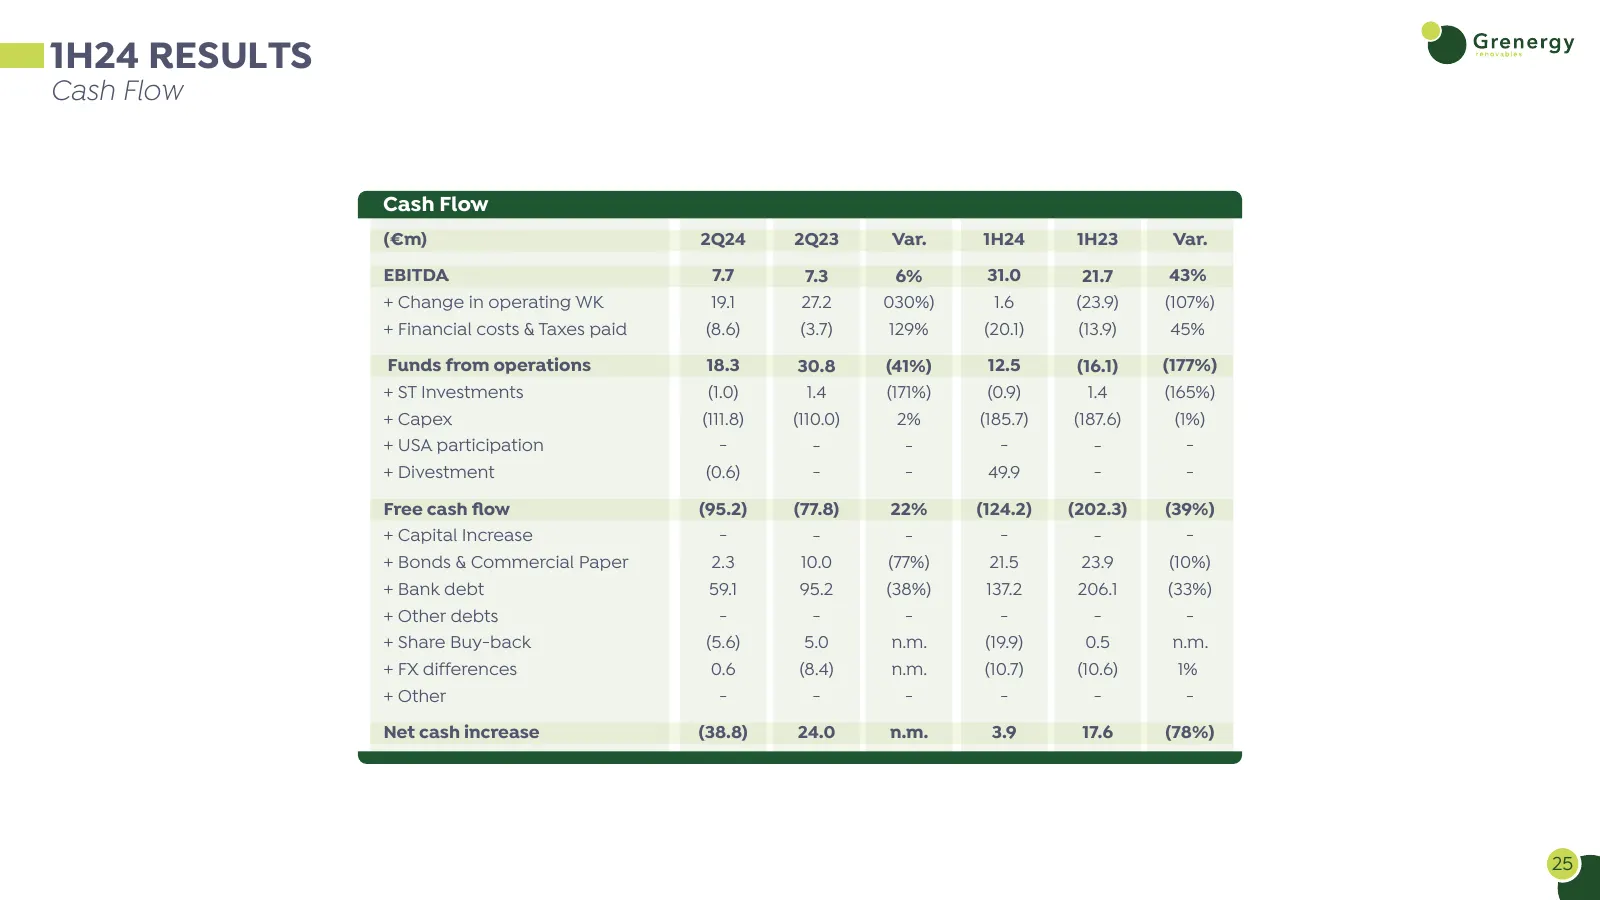
Slide 25: 1H24 Results: Cash Flow
1H24 RESULTS Cash Flow Cash Flow (€m) 2Q24 2Q23 Var. 1H24 1H23 Var. EBITDA 7.7 7.3 6% 31.0 21.7 43% + Change in operating WK 19.1 27.2 030%) 1.6 (23.9) (107%) + Financial costs & Taxes paid (8.6) (3.7) 129% (20.1) (13.9) 45% Funds from operations 18.3 30.8 (41%) 12.5 (16.1) (177%) + ST Investments (
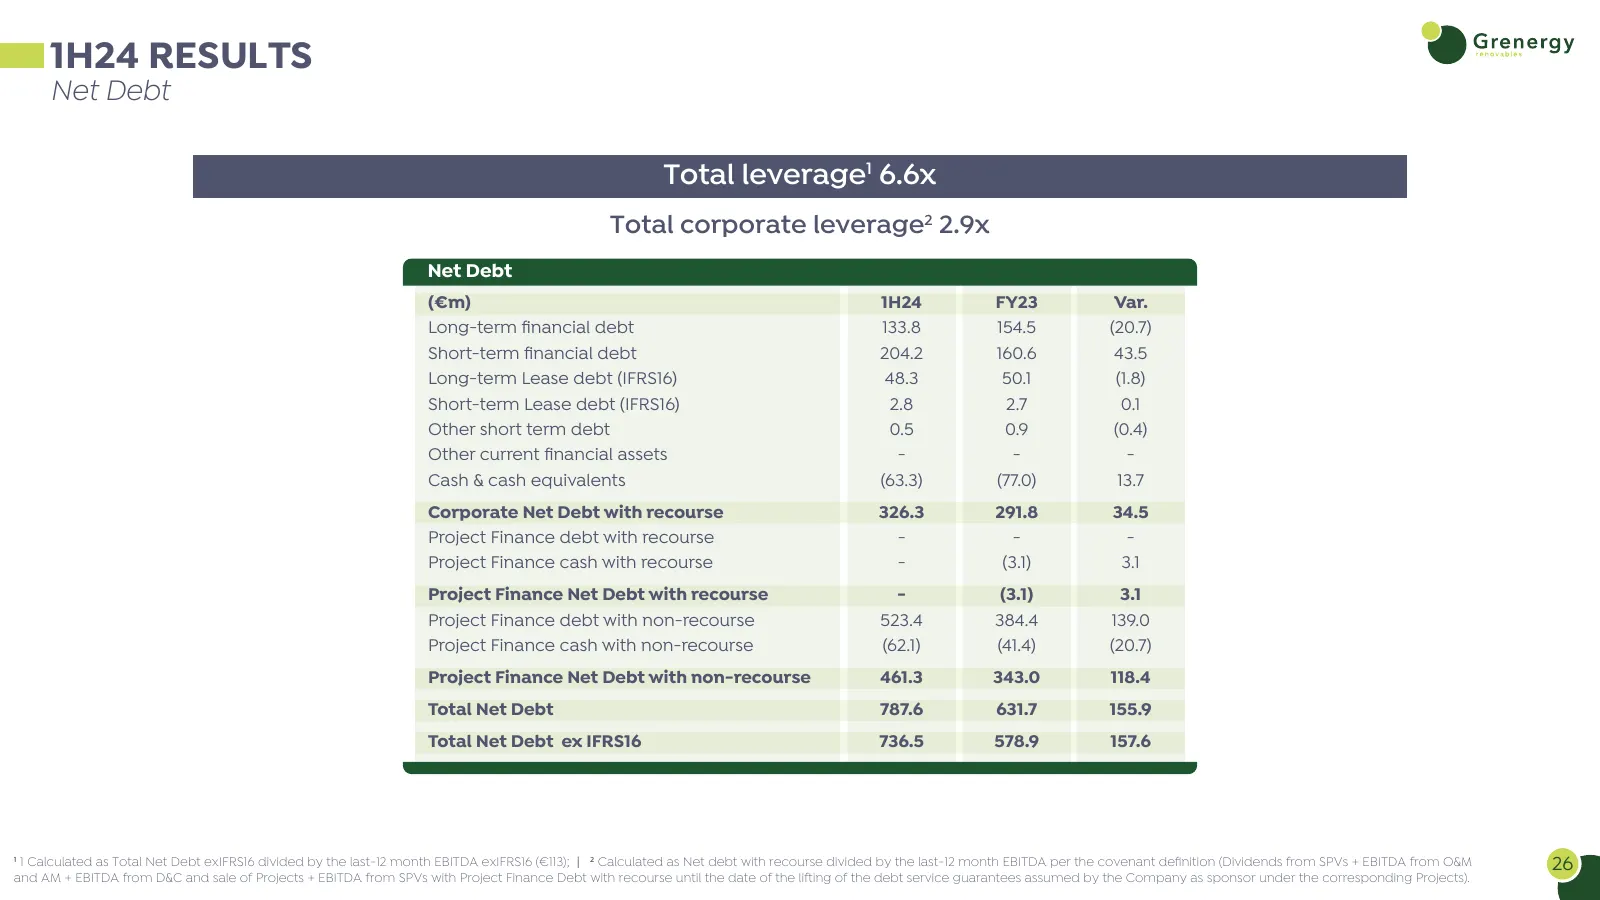
Slide 26: 1H24 Results: Net Debt
1H24 RESULTS Net Debt Total leverage1 6.6x Total corporate leverage2 2.9x Net Debt (€m) 1H24 FY23 Var. Long-term financial debt 133.8 154.5 (20.7) Short-term financial debt 204.2 160.6 43.5 Long-term Lease debt (IFRS16) 48.3 50.1 (1.8) Short-term Lease debt (IFRS16) 2.8 2.7 0.1 Other short term debt
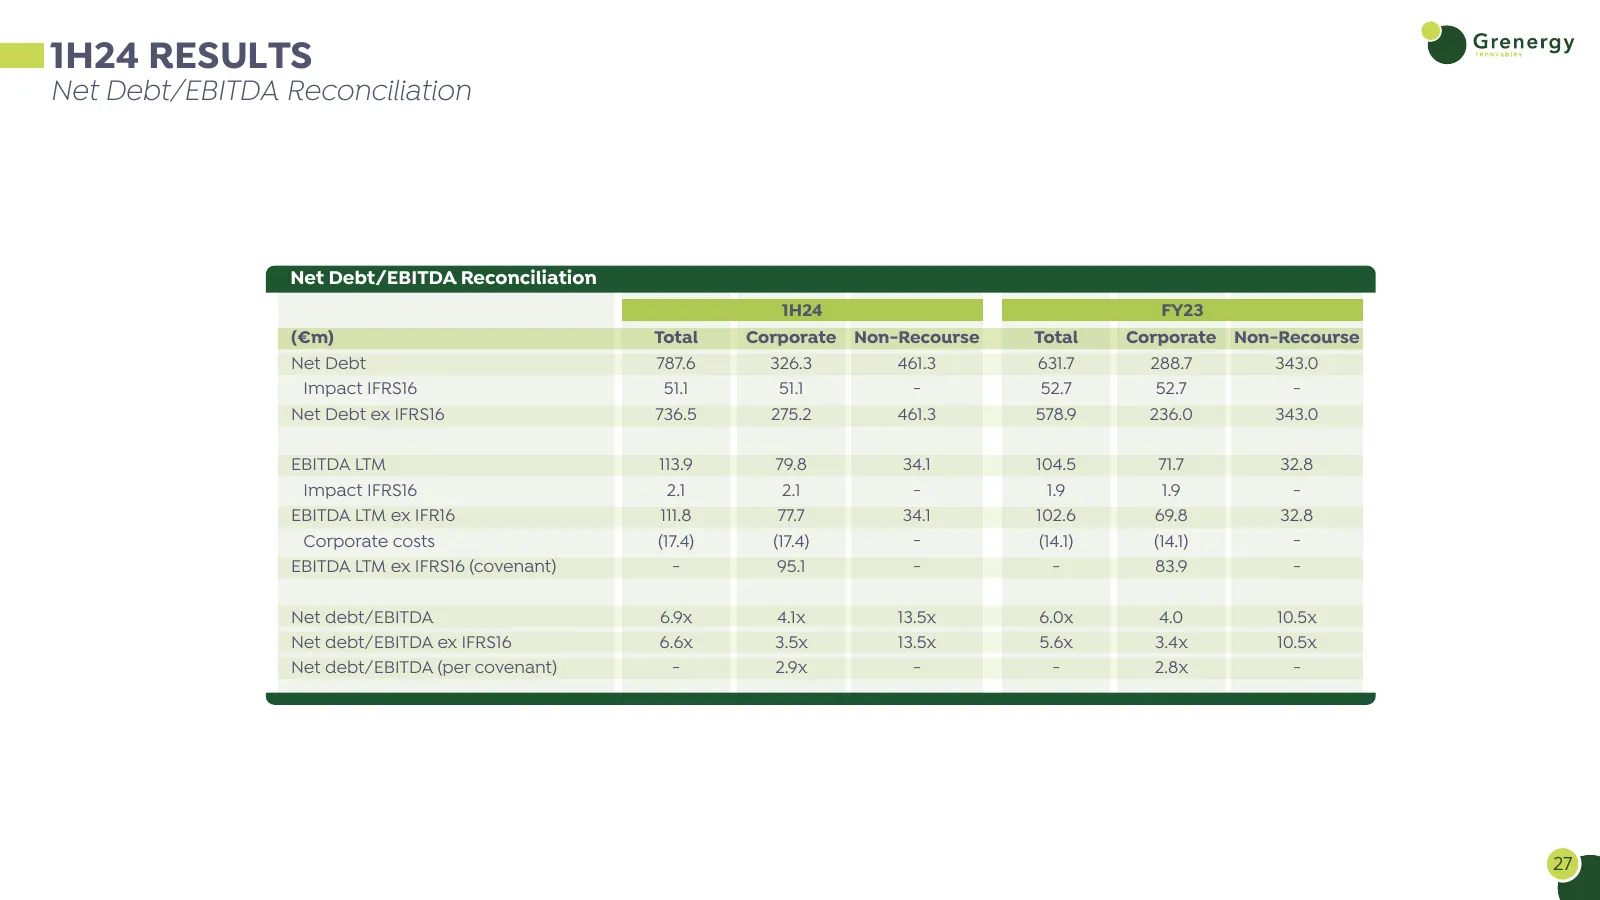
Slide 27: Net Debt/EBITDA Reconciliation
1H24 RESULTS Net Debt/EBITDA Reconciliation Net Debt/EBITDA Reconciliation 1H24 FY23 (€m) Total Corporate Non-Recourse Total Corporate Non-Recourse Net Debt 787.6 326.3 461.3 631.7 288.7 343.0 Impact IFRS16 51.1 51.1 - 52.7 52.7 - Net Debt ex IFRS16 736.5 275.2 461.3 578.9 236.0 343.0 EBITDA LTM 113
Slide 28: Solar PV + Storage
L SOLAR PV + STORAGE EUROPE - USA - LATAM
Source: Internet Archive copy of grenergy.eu
More decks from Grenergy Renovables S.A
 H1 2026 Earnings Presentation38 slides · Sep 16, 2026
 Investor Presentation (September 2026)55 slides · September 2026
 Investor Presentation (July 2026)46 slides · July 2026
 Q1 2026 Earnings Presentation50 slides · May 27, 2026
 9M 2025 Earnings Presentation36 slides · Nov 27, 2025
 Investor Day (May 2025)50 slides · May 28, 2025