Arabian Internet and Communications Services Company · TADAWUL:7202
Arabian Internet and Communications Services — FY2022 Earnings Presentation
26 slides from Arabian Internet and Communications Services's earnings presentation, Feb 27, 2023
Slide 1: FY 2022 Results Presentation
FY 2022 Results Presentation Riyadh, 27 February 2023
Slide 2: Agenda
Agenda 4Q 2022 Results Presentation 1 Key Messages 2 M&A Strategy and Update 3 Financial Performance 4 Appendix

Slide 3: Key Messages
4Q 2022 Results Presentation 1 Key Messages
Slide 4: Key Messages
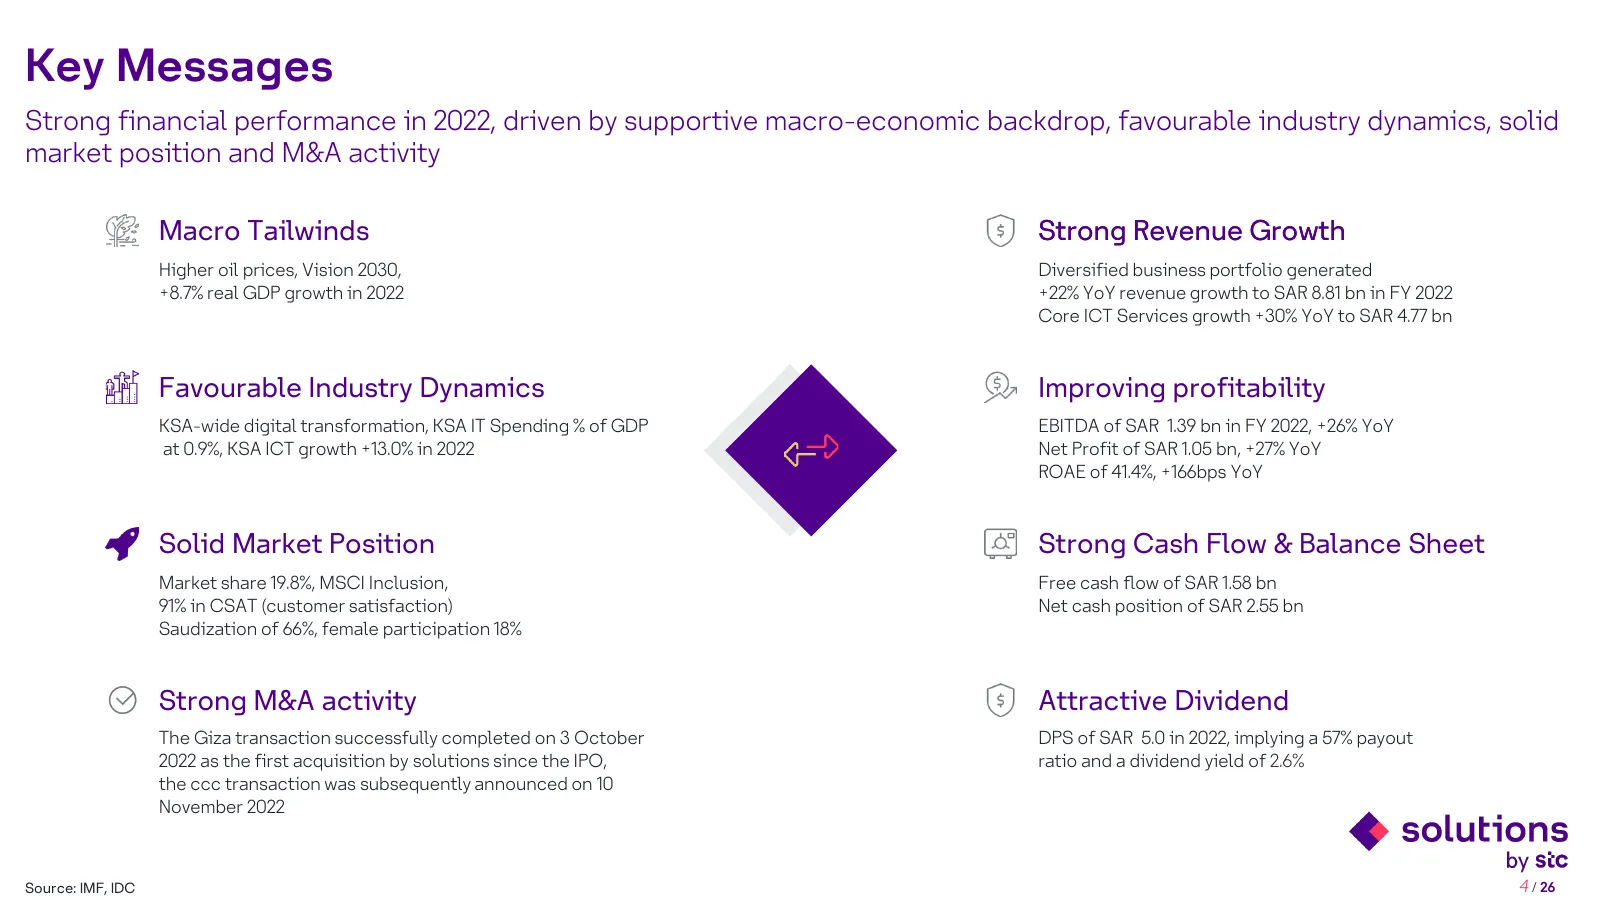
Key Messages Strong financial performance in 2022, driven by supportive macro-economic backdrop, favourable industry dynamics, solid market position and M&A activity Macro Tailwinds Strong Revenue Growth Higher oil prices, Vision 2030, Diversified business portfolio generated +8.7% real GDP growth i
Slide 5: M&A Strategy and Update
4Q 2022 Results Presentation 2 M&A Strategy and Update
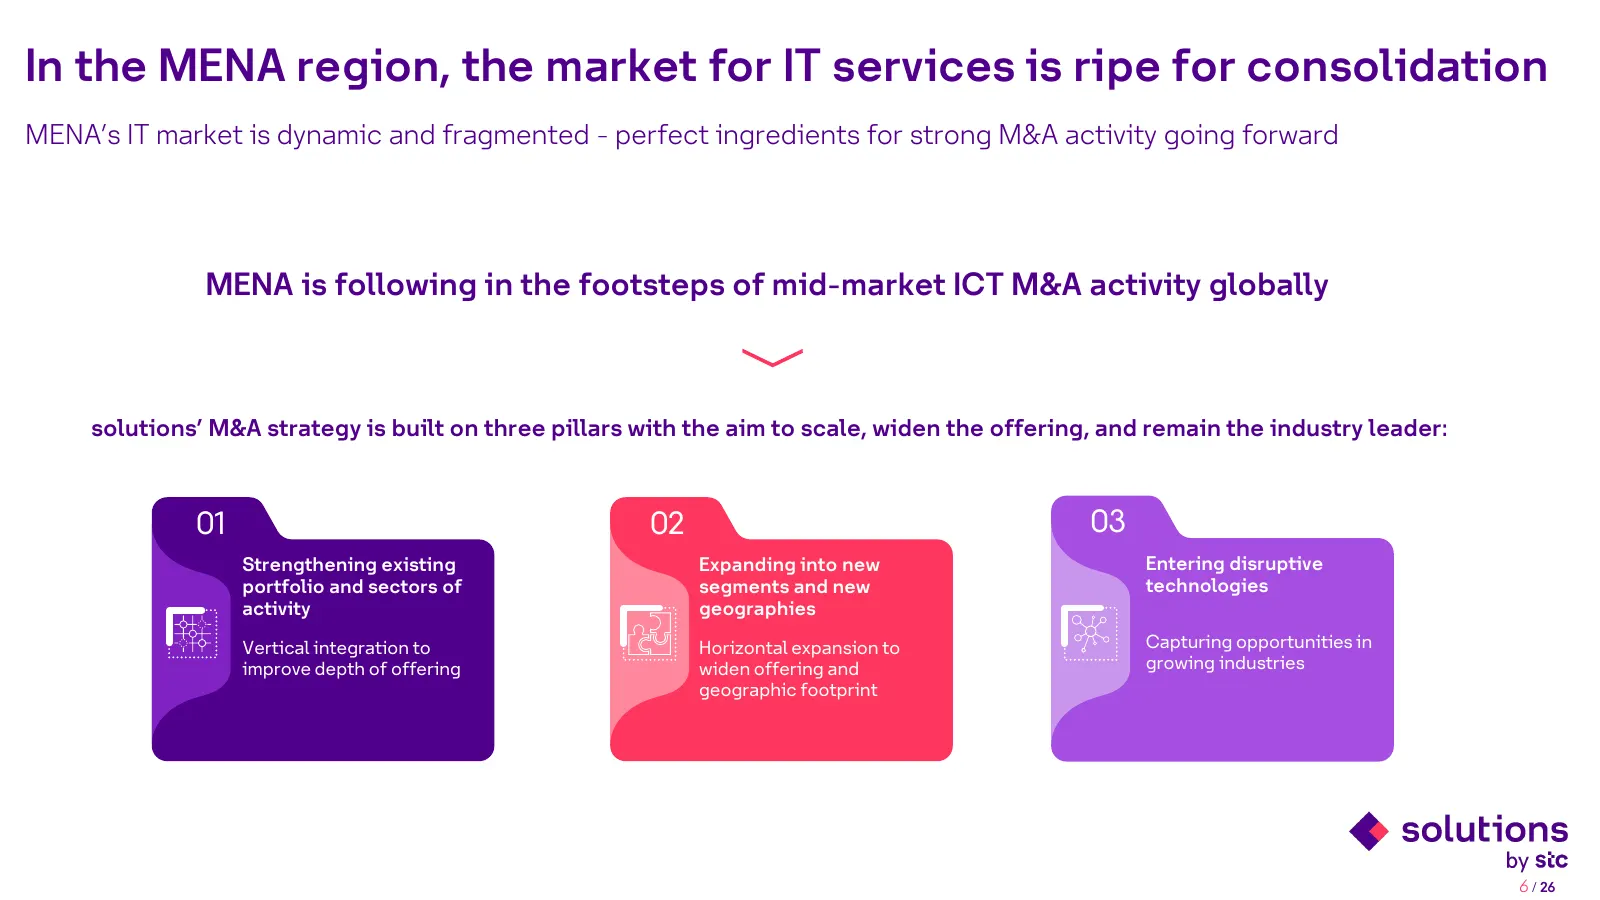
Slide 6: In the MENA region, the market for IT services is ripe for consolidation
In the MENA region, the market for IT services is ripe for consolidation MENA’s IT market is dynamic and fragmented - perfect ingredients for strong M&A activity going forward MENA is following in the footsteps of mid-market ICT M&A activity globally solutions’ M&A strategy is built on three pillars
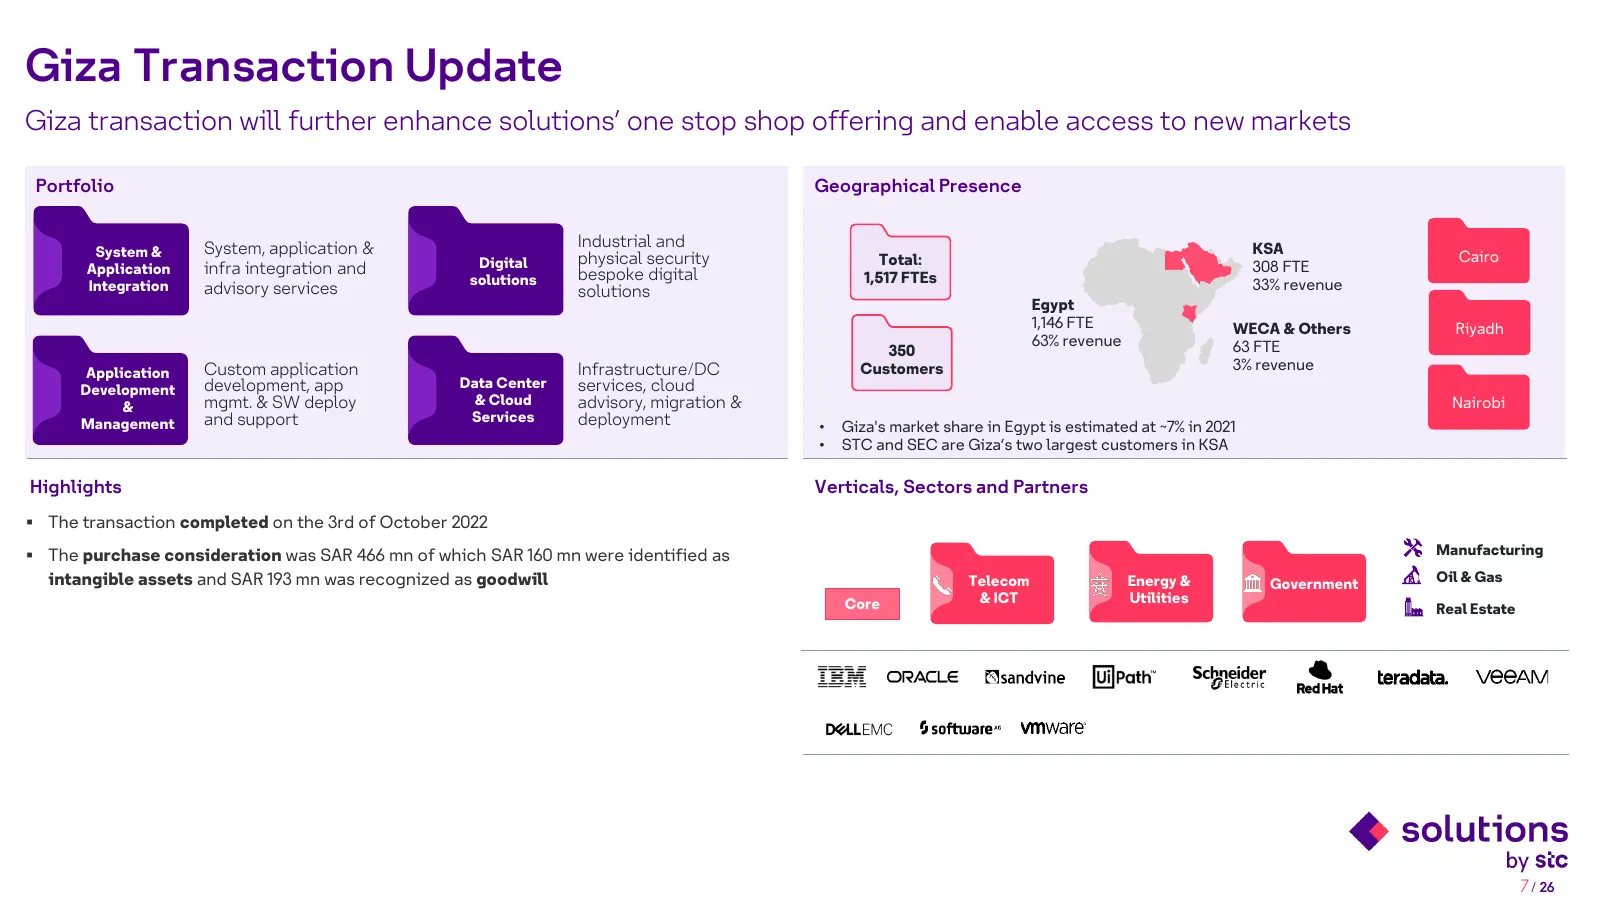
Slide 7: Giza Transaction Update
Giza Transaction Update Giza transaction will further enhance solutions’ one stop shop offering and enable access to new markets Portfolio Geographical Presence System, application & Industrial and KSA System & physical security Cairo Digital Total: 308 FTE Application infra integration and bespoke
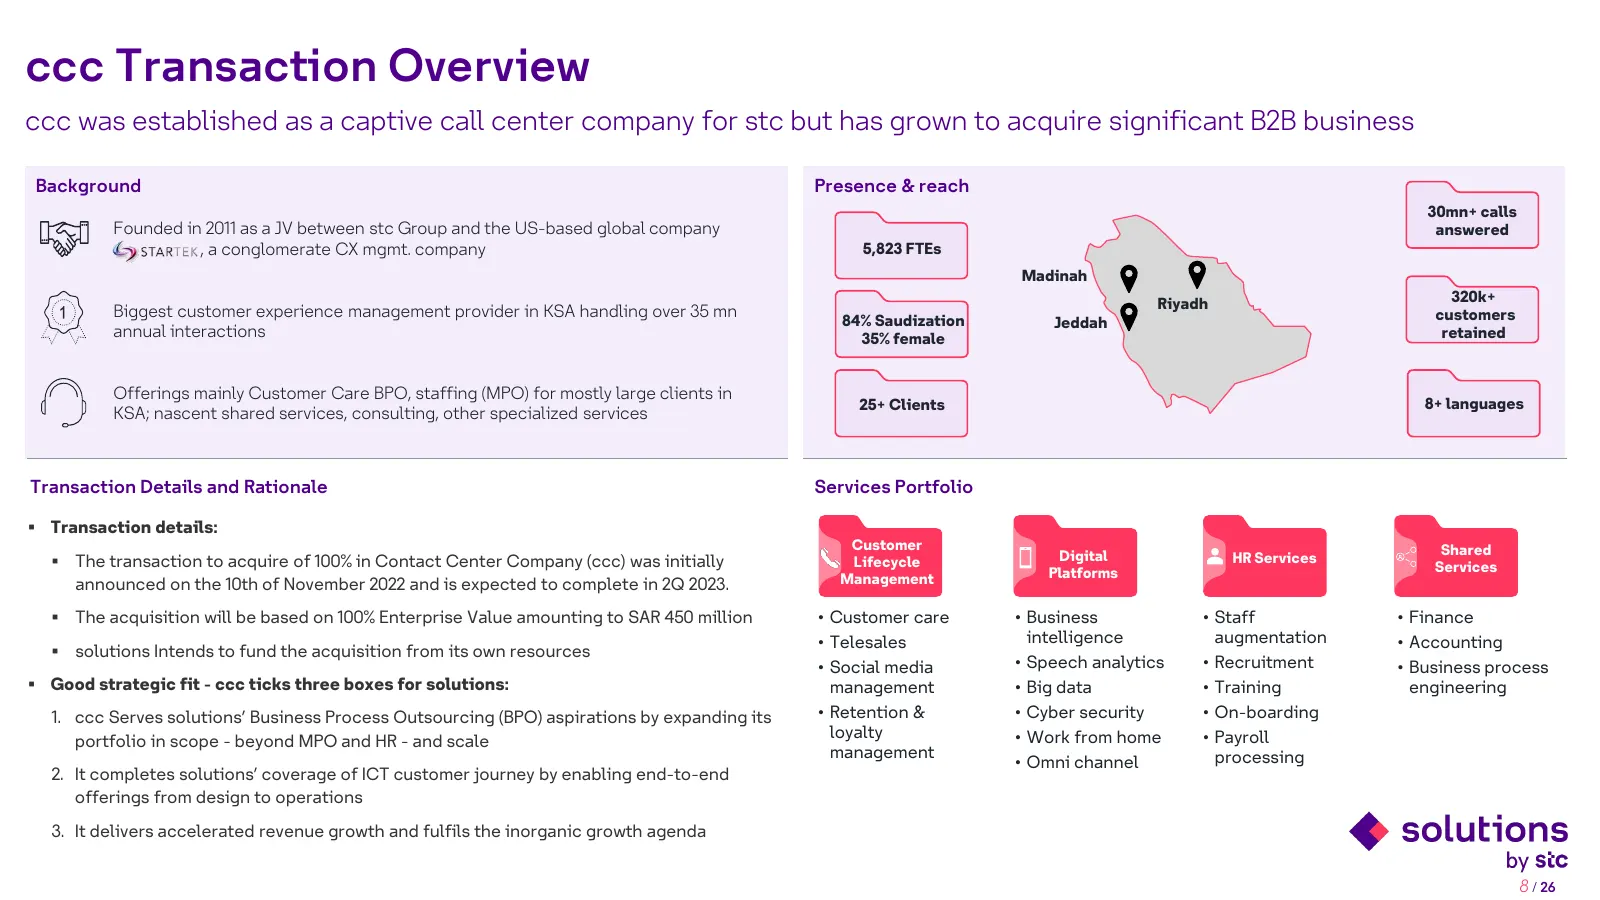
Slide 8: ccc Transaction Overview
ccc Transaction Overview ccc was established as a captive call center company for stc but has grown to acquire significant B2B business Background Presence & reach 30mn+ calls Founded in 2011 as a JV between stc Group and the US-based global company answered , a conglomerate CX mgmt. company 5,823 F
Slide 9: Financial Performance
4Q 2022 Results Presentation 3 Financial Performance
Slide 10: solutions FY 2022 Financial Dashboard
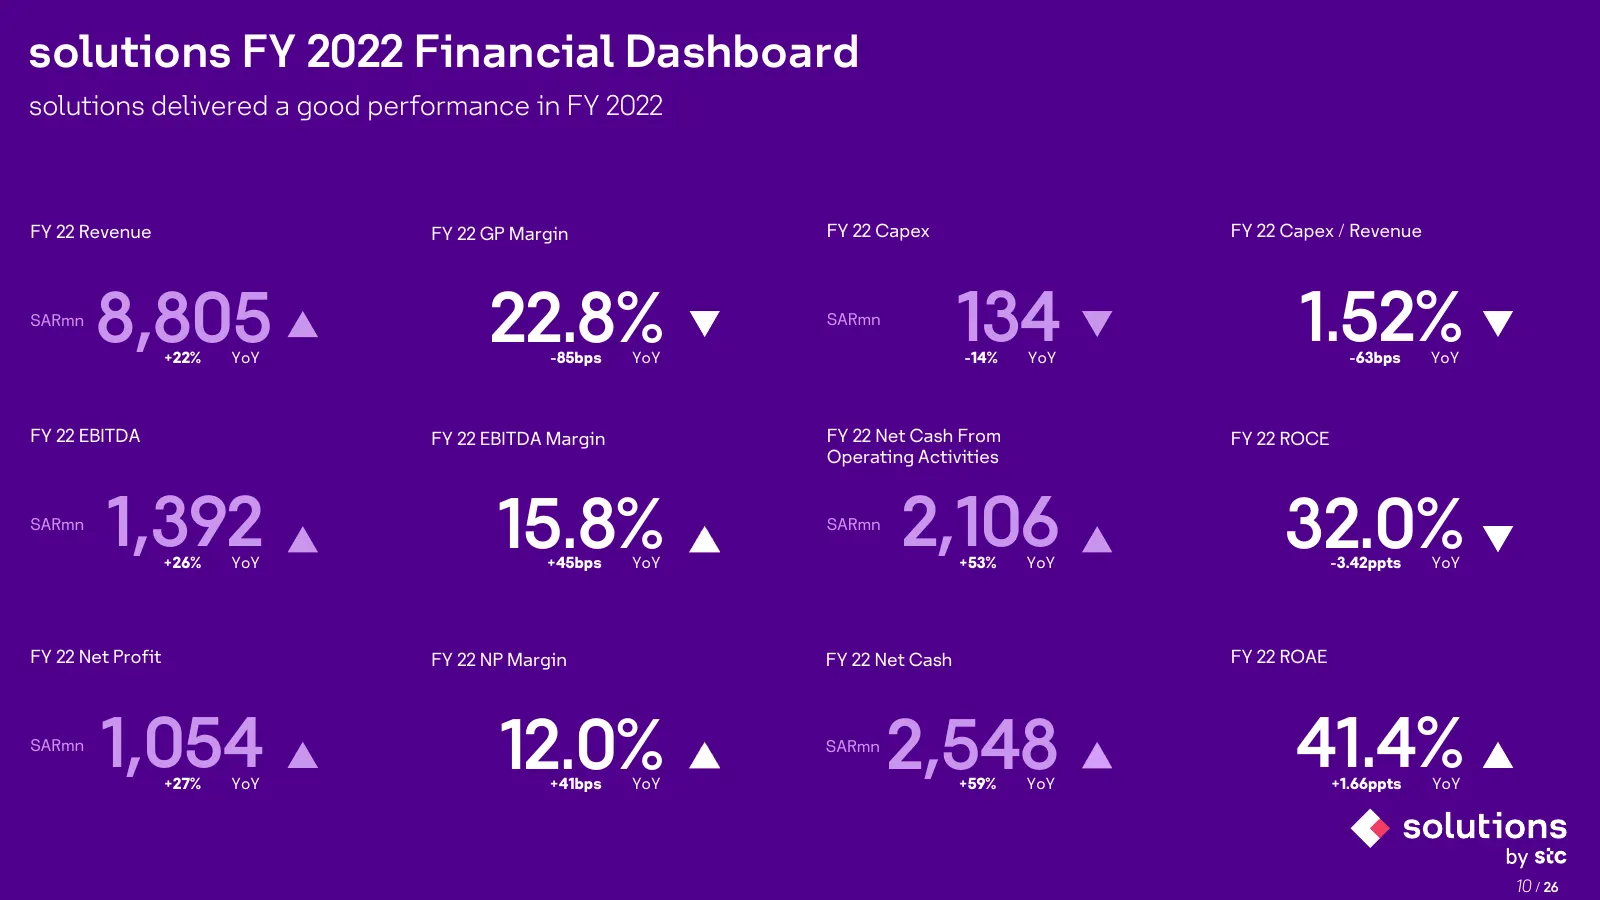
solutions FY 2022 Financial Dashboard solutions delivered a good performance in FY 2022 FY 22 Revenue FY 22 GP Margin FY 22 Capex FY 22 Capex / Revenue SARmn 8,805 +22% YoY 22.8% -85bps YoY SARmn 134 -14% YoY 1.52% -63bps YoY FY 22 EBITDA FY 22 EBITDA Margin FY 22 Net Cash From FY 22 ROCE Operating
Slide 11: Revenue Trend and Growth Drivers
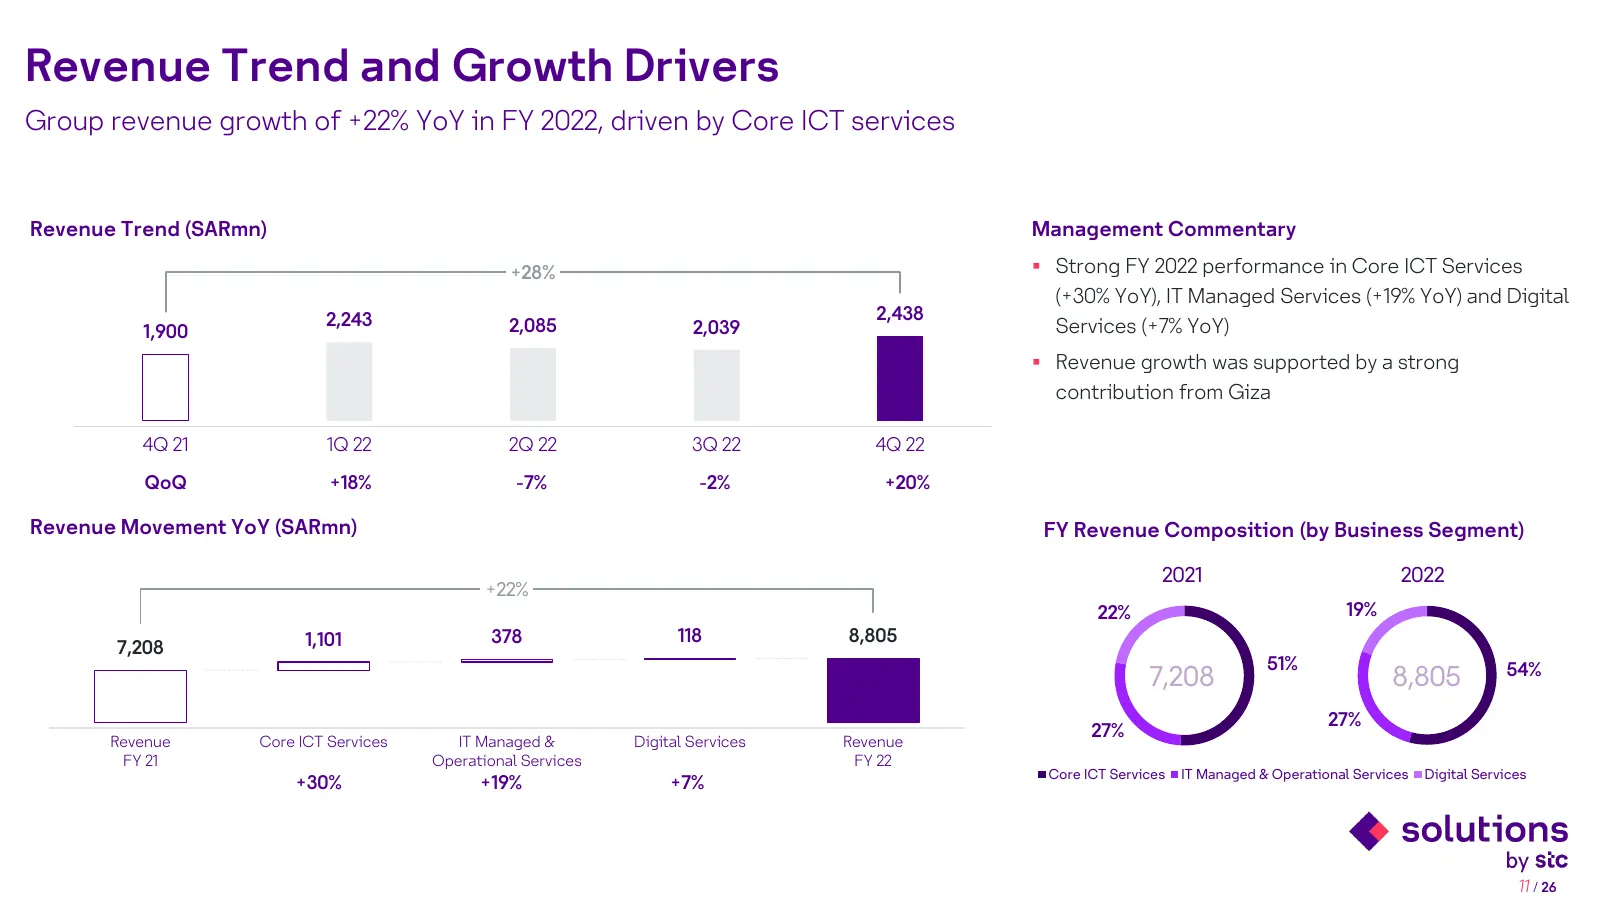
Revenue Trend and Growth Drivers Group revenue growth of +22% YoY in FY 2022, driven by Core ICT services Revenue Trend (SARmn) Management Commentary +28% Strong FY 2022 performance in Core ICT Services (+30% YoY), IT Managed Services (+19% YoY) and Digital 2,243 2,438 1,900 2,085 2,039 Services (
Slide 12: Revenue Analysis
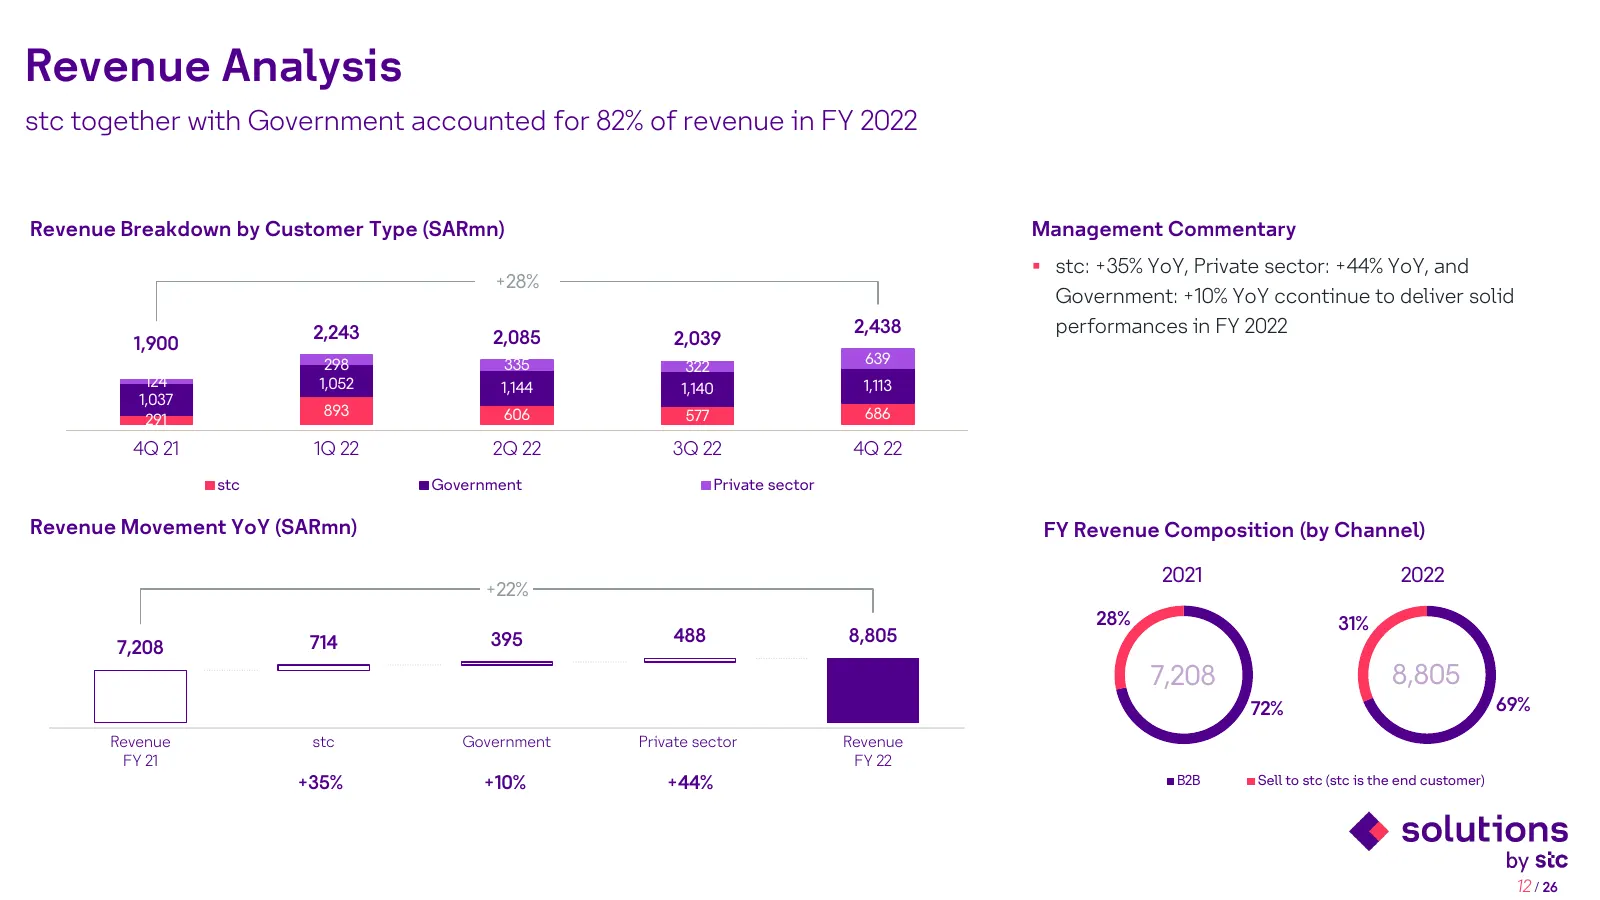
Revenue Analysis stc together with Government accounted for 82% of revenue in FY 2022 Revenue Breakdown by Customer Type (SARmn) Management Commentary stc: +35% YoY, Private sector: +44% YoY, and +28% Government: +10% YoY ccontinue to deliver solid 2,243 2,438 performances in FY 2022 1,900 2,085 2
Slide 13: Profitability - Gross Profit
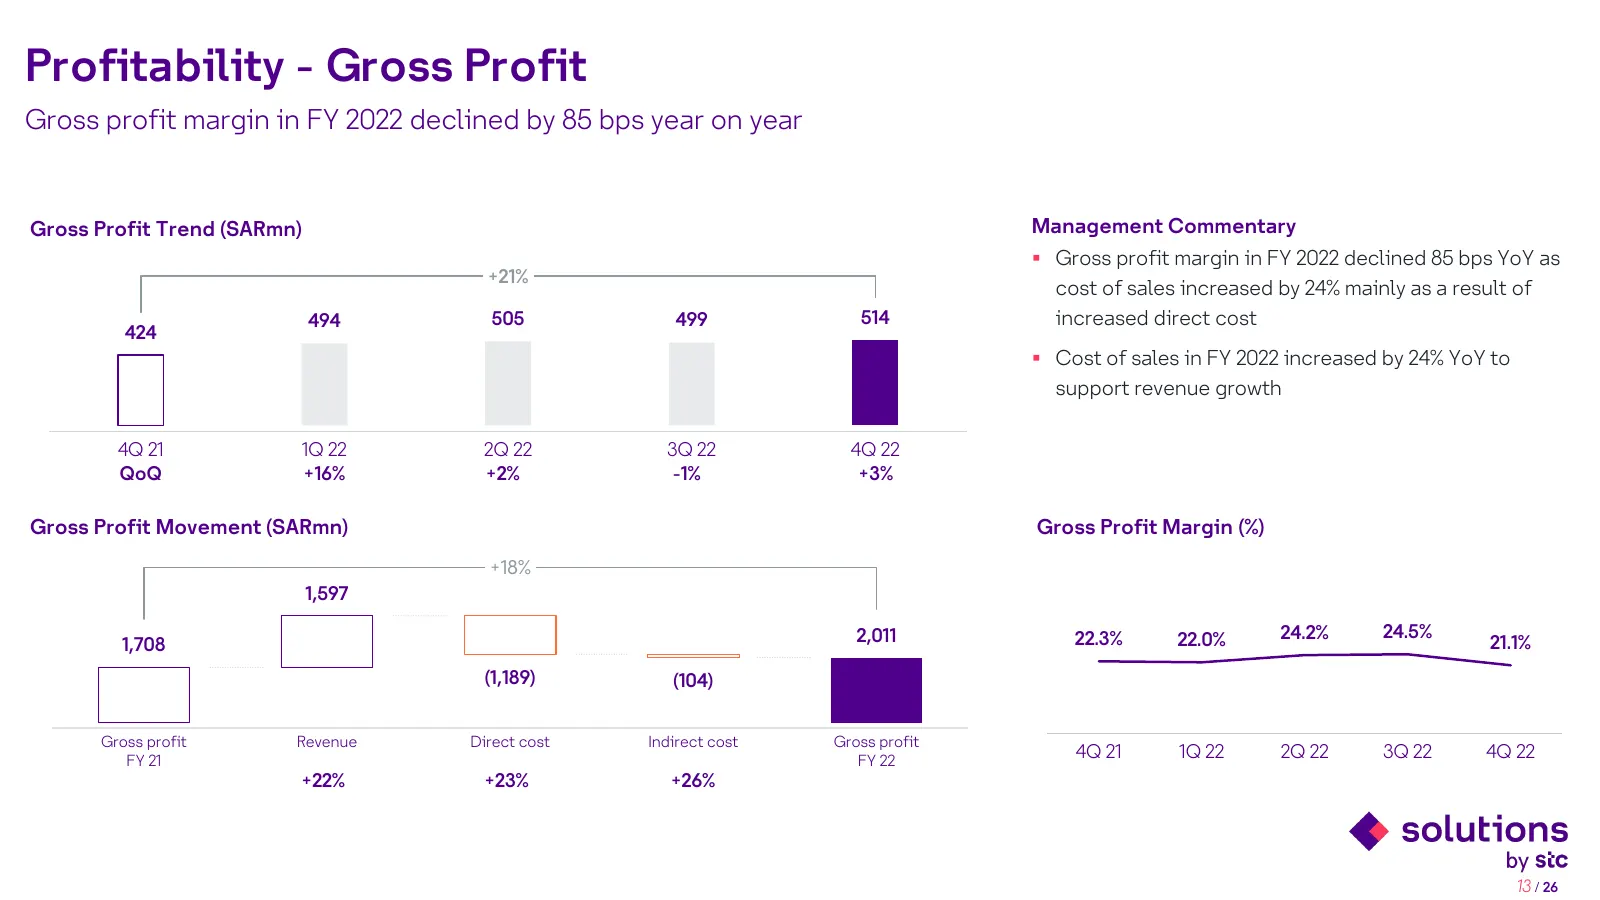
Profitability - Gross Profit Gross profit margin in FY 2022 declined by 85 bps year on year Gross Profit Trend (SARmn) Management Commentary Gross profit margin in FY 2022 declined 85 bps YoY as +21% cost of sales increased by 24% mainly as a result of 494 505 499 514 increased direct cost 424 C
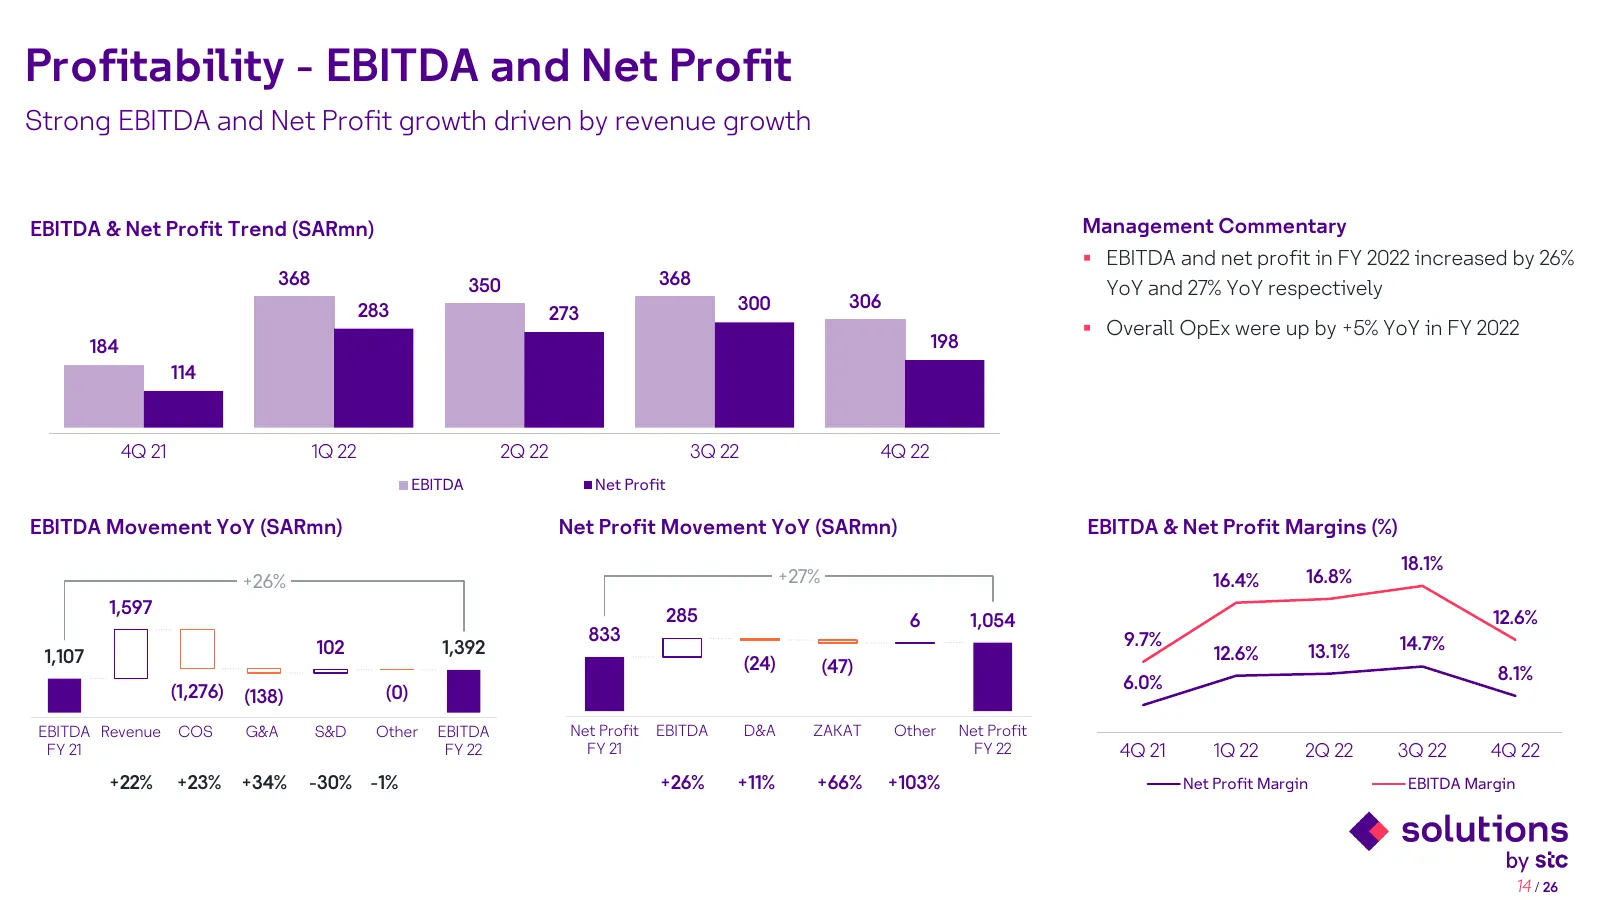
Slide 14: Profitability - EBITDA and Net Profit
Profitability - EBITDA and Net Profit Strong EBITDA and Net Profit growth driven by revenue growth EBITDA & Net Profit Trend (SARmn) Management Commentary 20.0 EBITDA and net profit in FY 2022 increased by 26% 500 450 368 350 368 400 15.0 YoY and 27% YoY respectively 350 283 300 306 273 Overall
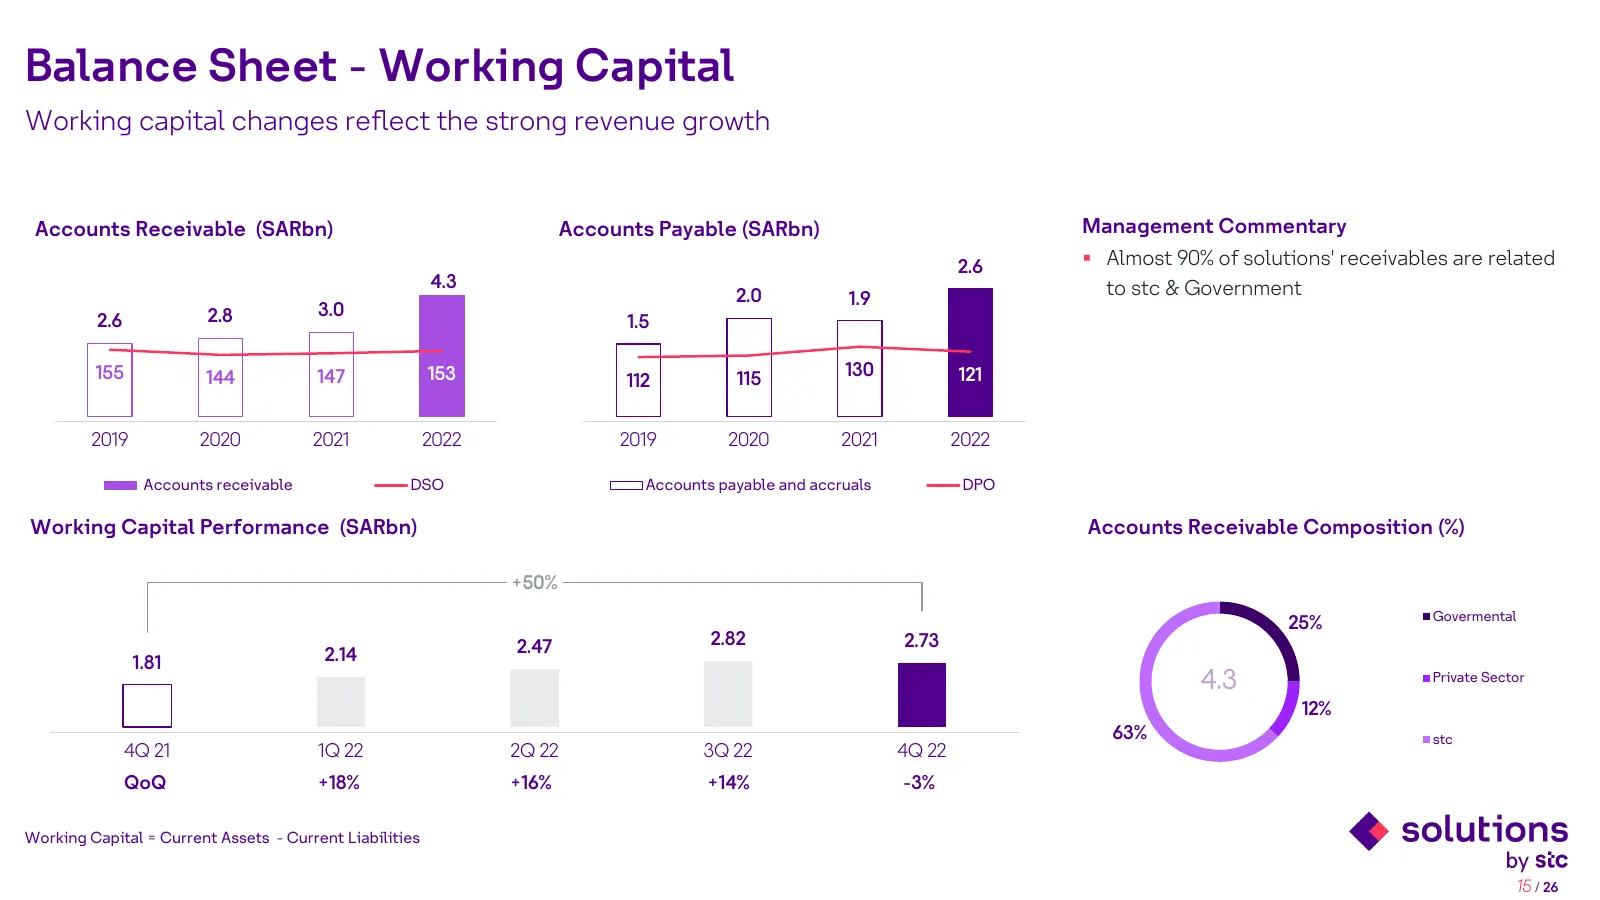
Slide 15: Balance Sheet - Working Capital
Balance Sheet - Working Capital Working capital changes reflect the strong revenue growth Accounts Receivable (SARbn) Accounts Payable (SARbn) Management Commentary 4 2.6 Almost 90% of solutions' receivables are related 3 5 4.3 to stc & Government 3 2.0 1.9 4 2.8 3.0 2.6 2 1.5 3 2 2 130 155 144 14
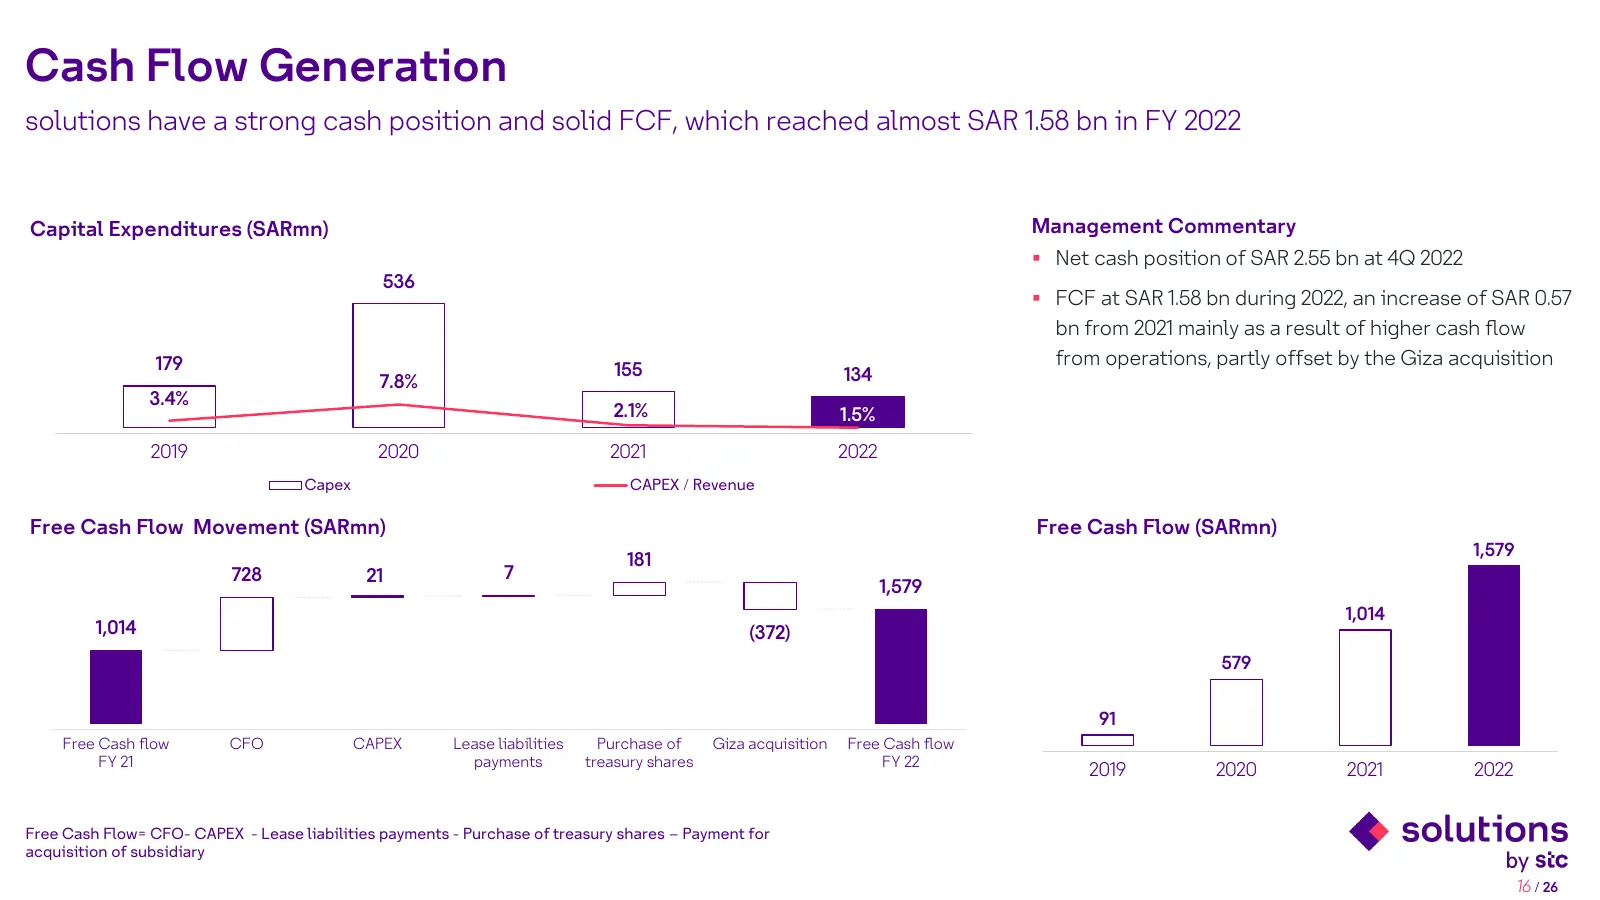
Slide 16: Cash Flow Generation
Cash Flow Generation solutions have a strong cash position and solid FCF, which reached almost SAR 1.58 bn in FY 2022 Capital Expenditures (SARmn) Management Commentary 800 700 Net cash position of SAR 2.55 bn at 4Q 2022 536 600 FCF at SAR 1.58 bn during 2022, an increase of SAR 0.57 500 400 bn
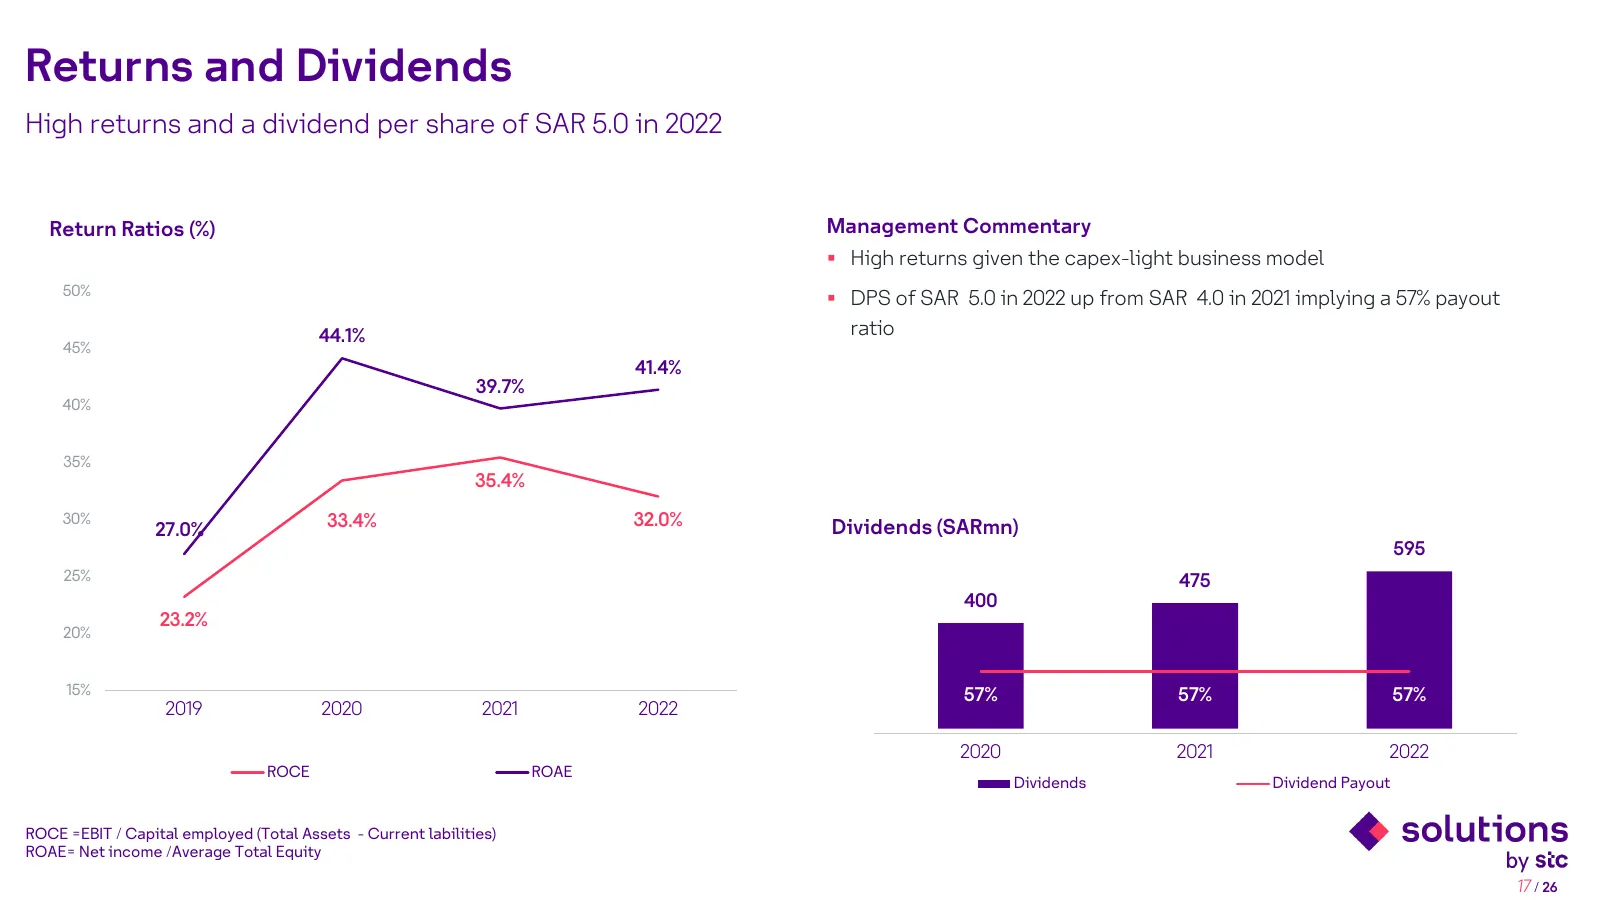
Slide 17: Returns and Dividends
Returns and Dividends High returns and a dividend per share of SAR 5.0 in 2022 Return Ratios (%) Management Commentary High returns given the capex-light business model 50% DPS of SAR 5.0 in 2022 up from SAR 4.0 in 2021 implying a 57% payout 44.1% ratio 45% 41.4% 39.7% 40% 35% 35.4% 30% 33.4% 32
Slide 18: Outlook, Guidance and Targets
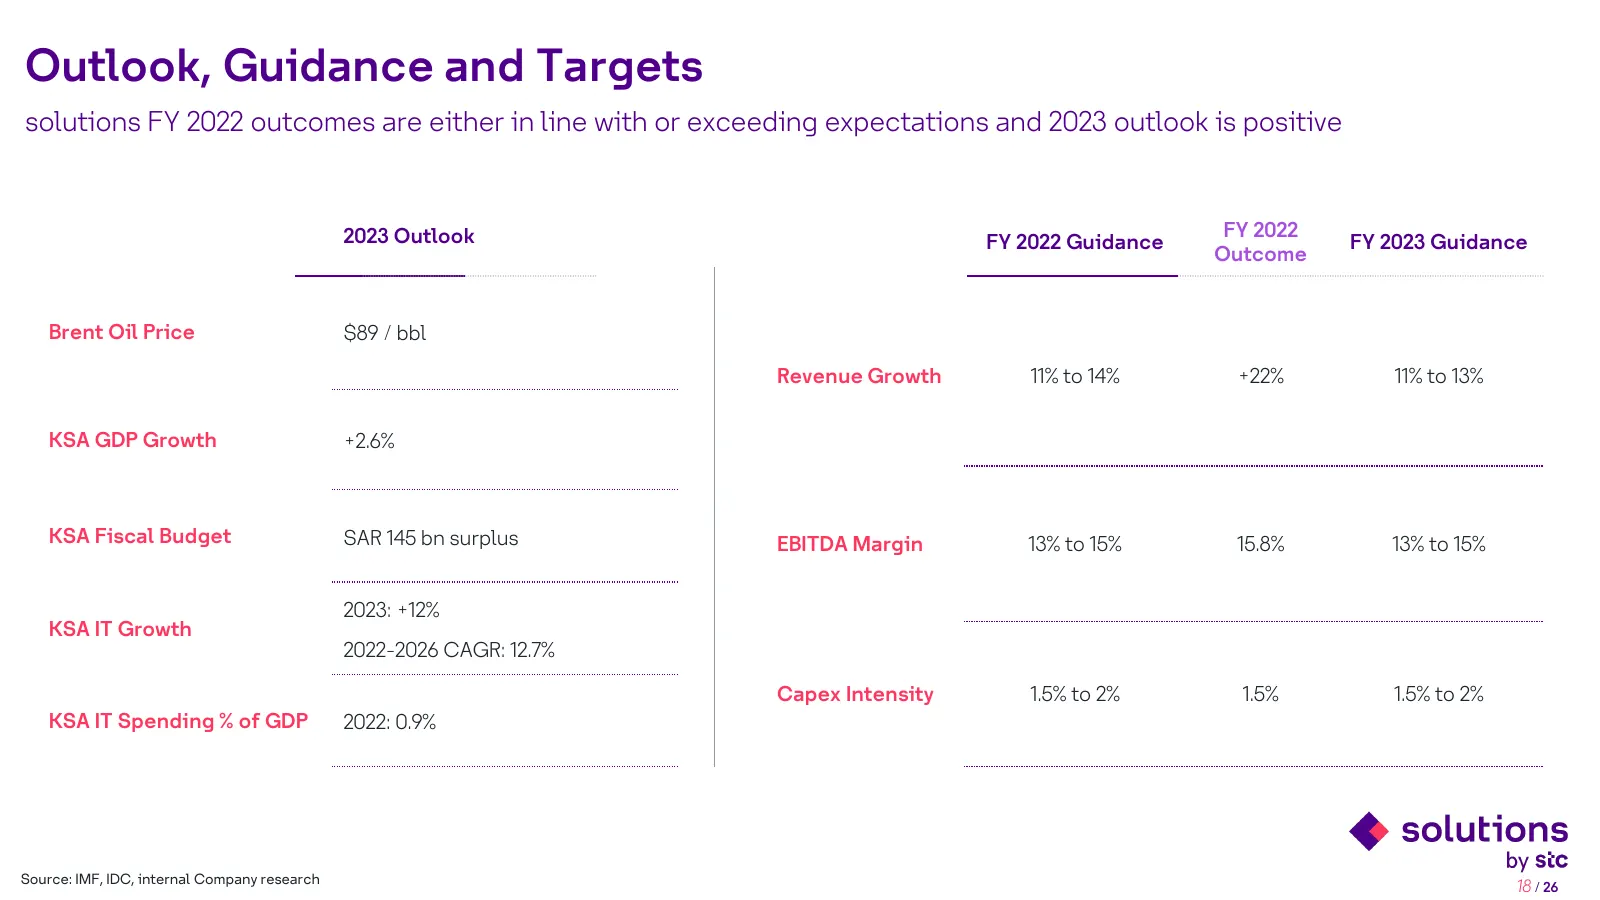
Outlook, Guidance and Targets solutions FY 2022 outcomes are either in line with or exceeding expectations and 2023 outlook is positive 2023 Outlook FY 2022 FY 2022 Guidance FY 2023 Guidance Outcome Brent Oil Price $89 / bbl Revenue Growth 11% to 14% +22% 11% to 13% KSA GDP Growth +2.6% KSA Fiscal B

Slide 19: Appendix
4Q 2022 Results Presentation 4 Appendix
Slide 20: Strategy Highlights
4Q 2022 Results Presentation a Strategy Highlights
Slide 21: Strategic Objectives
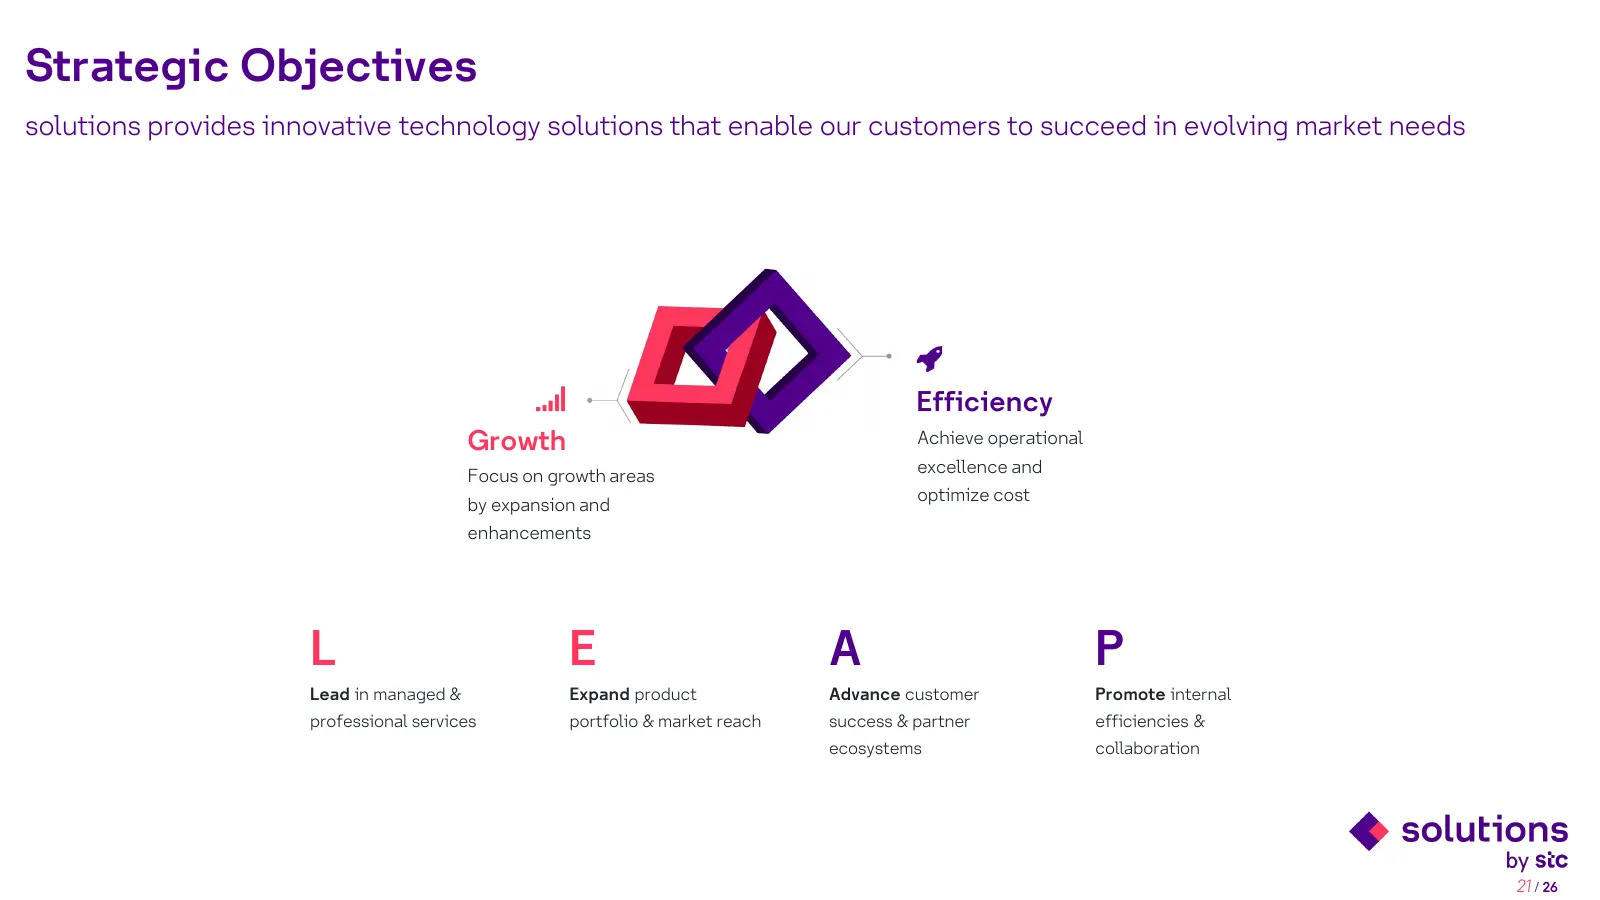
Strategic Objectives solutions provides innovative technology solutions that enable our customers to succeed in evolving market needs Efficiency Growth Achieve operational excellence and Focus on growth areas optimize cost by expansion and enhancements L E A P Lead in managed & Expand product Advanc
Slide 22: Market Positioning
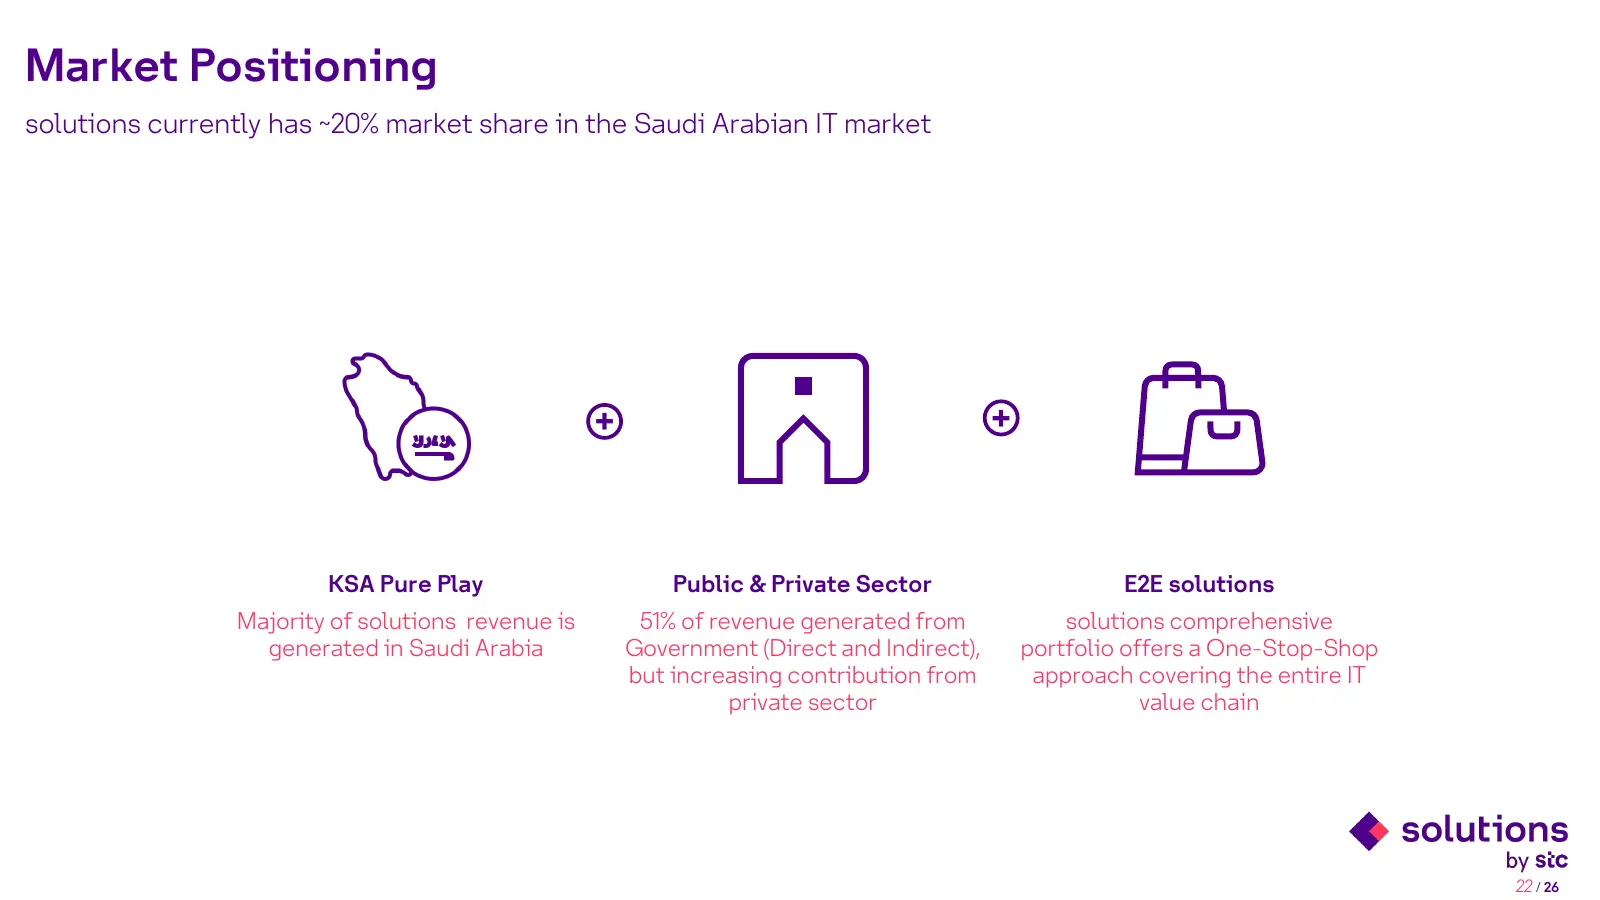
Market Positioning solutions currently has ~20% market share in the Saudi Arabian IT market + + KSA Pure Play Public & Private Sector E2E solutions Majority of solutions revenue is 51% of revenue generated from solutions comprehensive generated in Saudi Arabia Government (Direct and Indirect), portf
Slide 23: Competitive Landscape
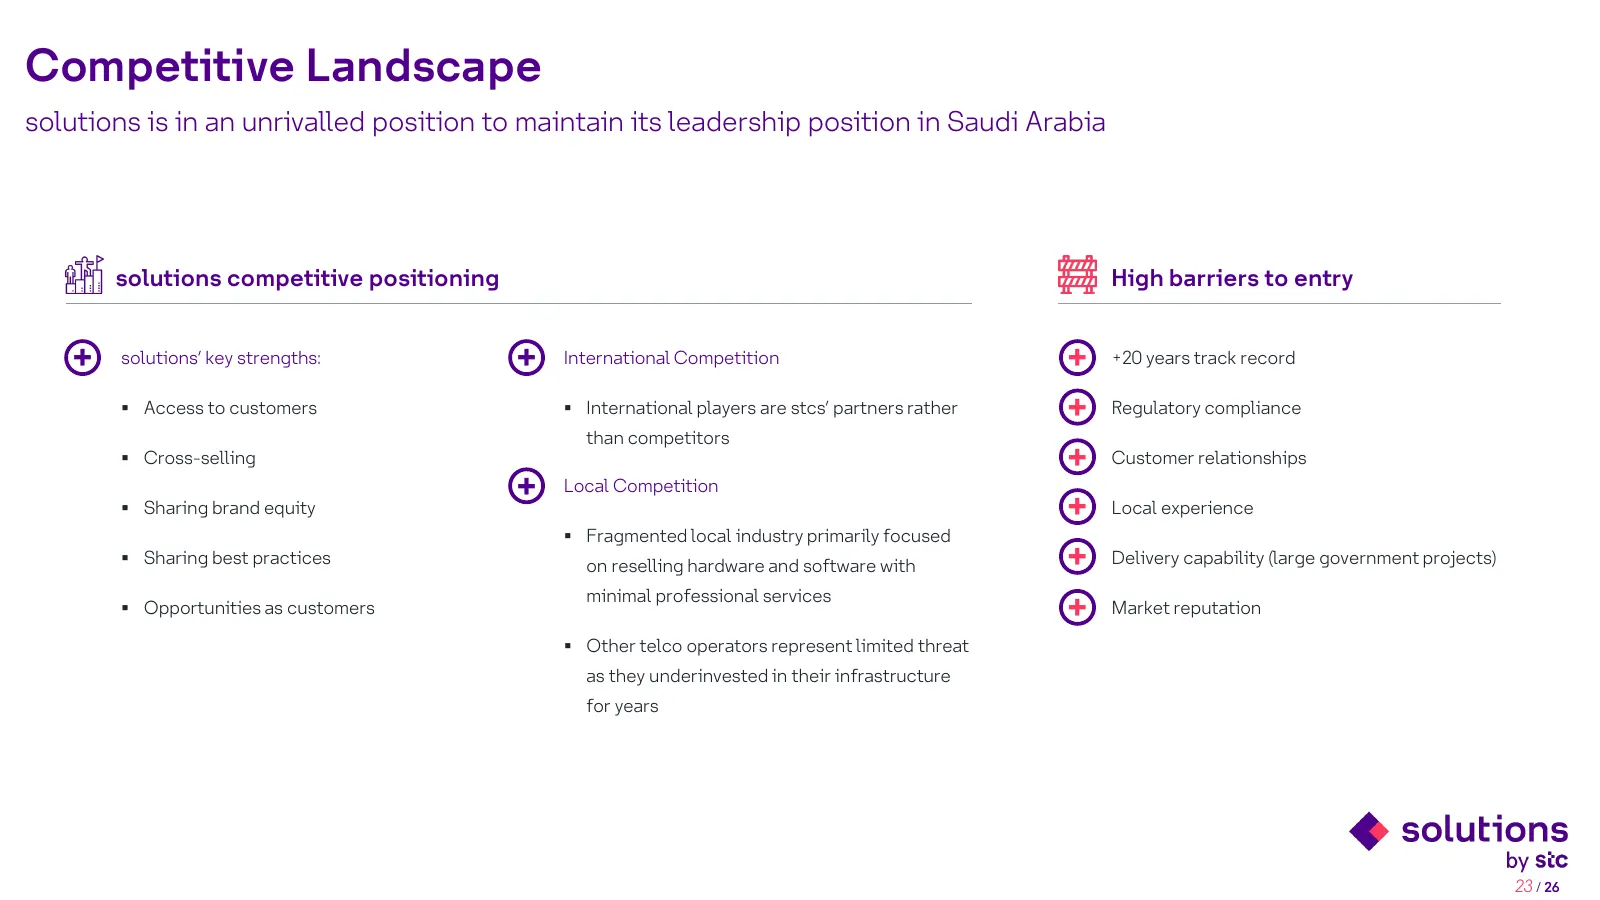
Competitive Landscape solutions is in an unrivalled position to maintain its leadership position in Saudi Arabia solutions competitive positioning High barriers to entry + solutions’ key strengths: + International Competition + +20 years track record Access to customers International players are

Slide 24: Contact Details
4Q 2022 Results Presentation b Contact Details
Slide 25: IR Contact Details
IR Contact Details Contact solutions by stc investor relations team Meet us at these upcoming investor conferences Abdullah Al-Dayal EFG Hermes Investor Relations Director Dubai +966 11 525 2985 6-7 March 2023 aaldayel@solutions.com.sa Faisal Altimyat Investor Relations Manager +966 11 525 2159 falt

Slide 26: Shukran!
Shukran! Ker ¢@ solutions by ste
Source: Internet Archive copy of solutions.com.sa
More decks from Arabian Internet and Communications Services Company
 Investor Presentation (2025)44 slides · Sep 14, 2025
 H1 2025 Earnings Presentation48 slides · August 2025
 solutions by stc — 1H 2025 Earnings Presentation22 slides · Jul 30, 2025
 Q1 2025 Earnings Presentation46 slides · May 2025
 Q1 2025 Earnings Presentation25 slides · Apr 30, 2025
 FY2024 Earnings Presentation30 slides · Feb 24, 2025