ENB Financial Corp · OTC:ENBP
ENB Financial — Debt Investor Presentation (December 2025)
43 slides from ENB Financial's debt investor presentation, Dec 18, 2025
Slide 1: Private Placement of Subordinated Notes
December 7, 2021 Private Placement of Subordinated Notes December 2, 2025 CONFIDENTIAL
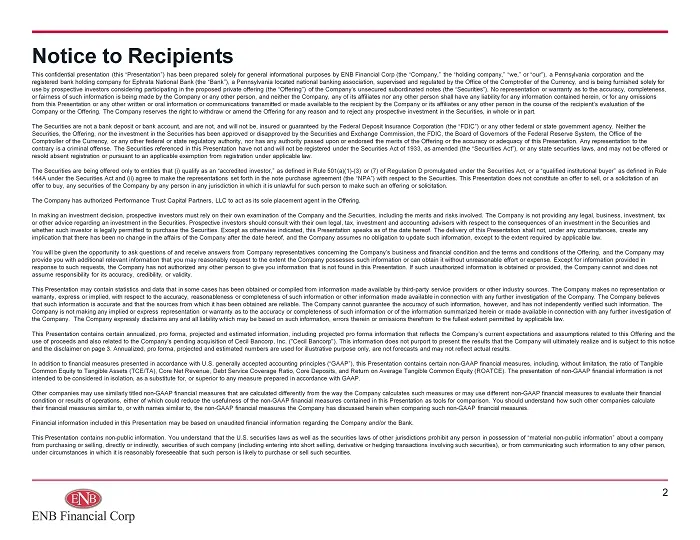
Slide 2: Notice to Recipients
Notice to Recipients 2 This confidential presentation (this “Presentation”) has been prepared solely for general informational purposes by ENB Financial Corp (the “Company,” the “holding company,” “we,” or “our”), a Pennsylvania corporation and the registered bank holding company for Ephrata Nationa
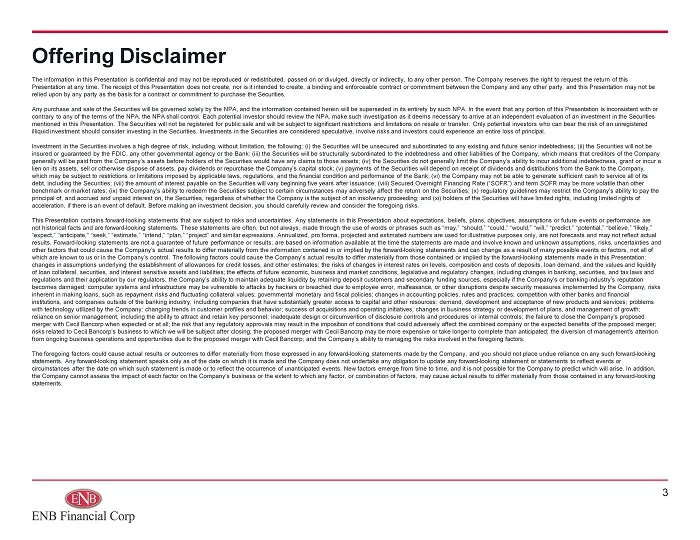
Slide 3: Offering Disclaimer
Offering Disclaimer The information in this Presentation is confidential and may not be reproduced or redistributed, passed on or divulged, directly or indirectly, to any other person. The Company reserves the right to request the return of this Presentation at any time. The receipt of this Presenta
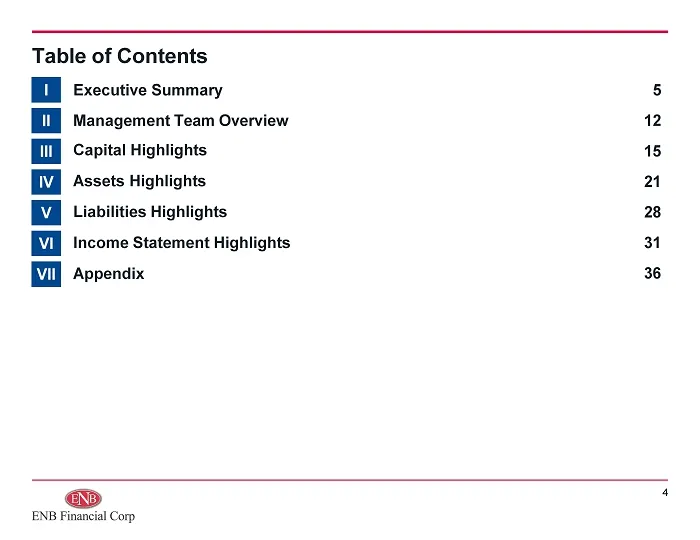
Slide 4: Table of Contents
Table of Contents Executive Summary Management Team Overview Capital Highlights Assets Highlights Liabilities Highlights Income Statement Highlights Appendix 5 12 15 21 28 31 36 I II III IV V VI VII 4
Slide 5: I. Executive Summary
|. Executive Summary ENB Financial Corp
Slide 6: Terms of the Offered Securities
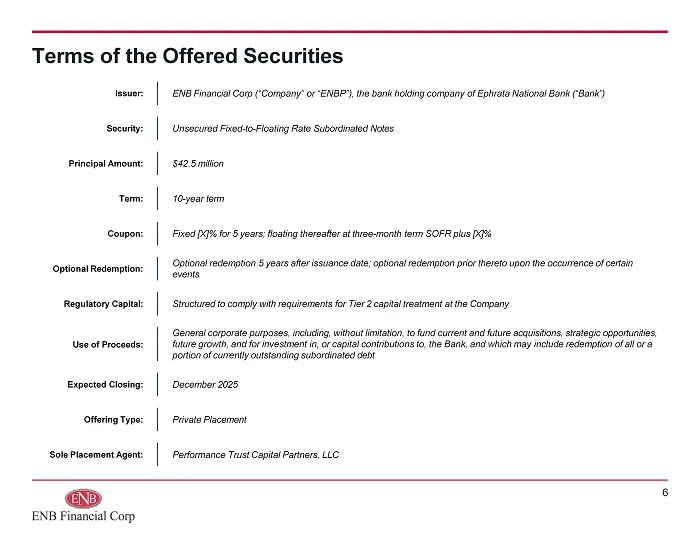
Terms of the Offered Securities ENB Financial Corp (“Company” or “ENBP”), the bank holding company of Ephrata National Bank (“Bank”) Issuer: Unsecured Fixed - to - Floating Rate Subordinated Notes Security: $42.5 million Principal Amount: 10 - year term Term: Fixed [X]% for 5 years; floating thereaf
Slide 7: Investment Highlights
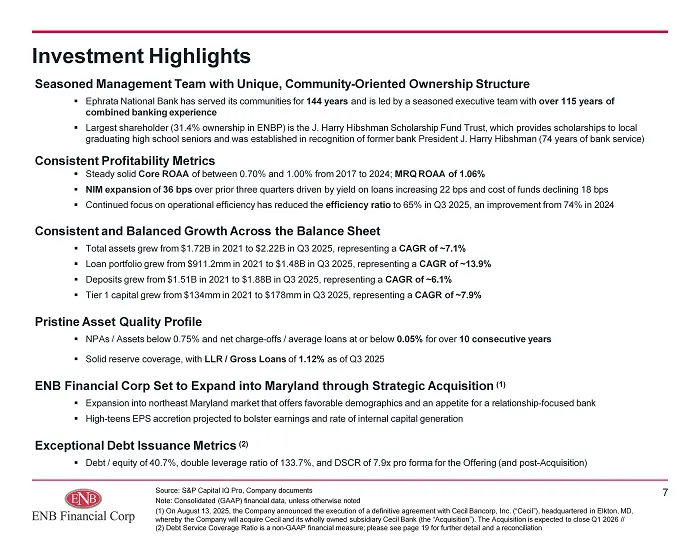
Investment Highlights Source: S&P Capital IQ Pro, Company documents Note: Consolidated (GAAP) financial data, unless otherwise noted (1) On August 13, 2025, the Company announced the execution of a definitive agreement with Cecil Bancorp, Inc. (“Cecil”), headquartered in Elkton, MD, whereby the Comp
Slide 8: ENB Financial Corp Overview
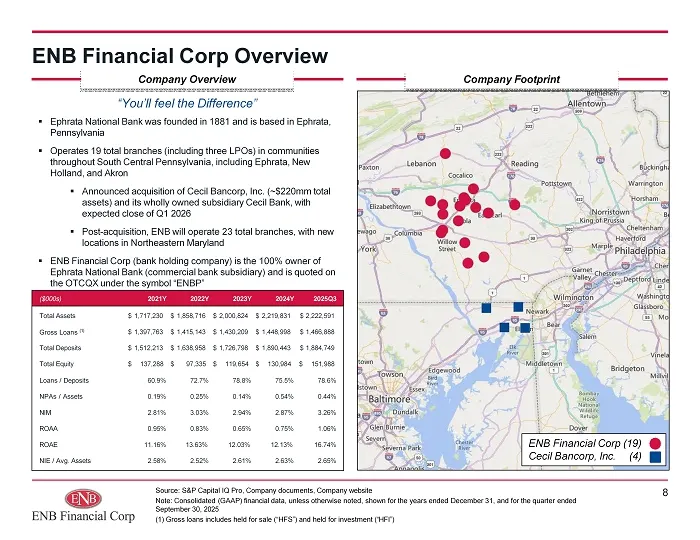
ENB Financial Corp (19) Cecil Bancorp, Inc. (4) ENB Financial Corp Overview Source: S&P Capital IQ Pro, Company documents, Company website Note: Consolidated (GAAP) financial data, unless otherwise noted, shown for the years ended December 31, and for the quarter ended September 30, 2025 (1) Gross l
Slide 9: Set to Expand into Maryland through Strategic Acquisition
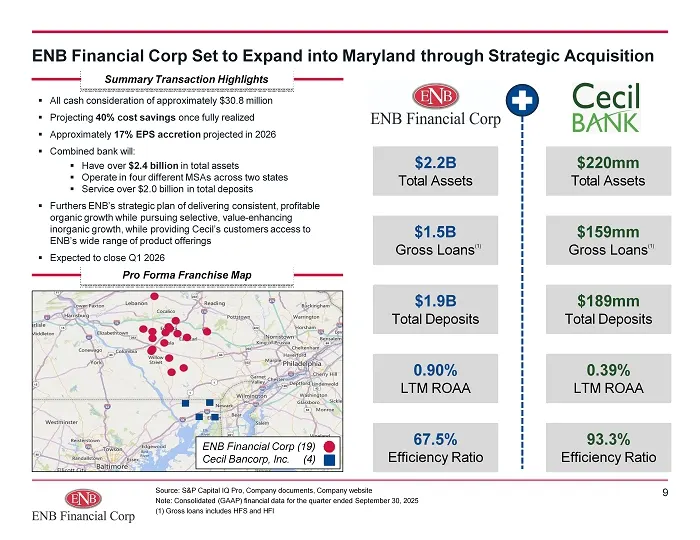
ENB Financial Corp Set to Expand into Maryland through Strategic Acquisition Source: S&P Capital IQ Pro, Company documents, Company website Note: Consolidated (GAAP) financial data for the quarter ended September 30, 2025 (1) Gross loans includes HFS and HFI 9 Summary Transaction Highlights ENB Fina
Slide 10: Market Overview | Lancaster and Reading MSAs
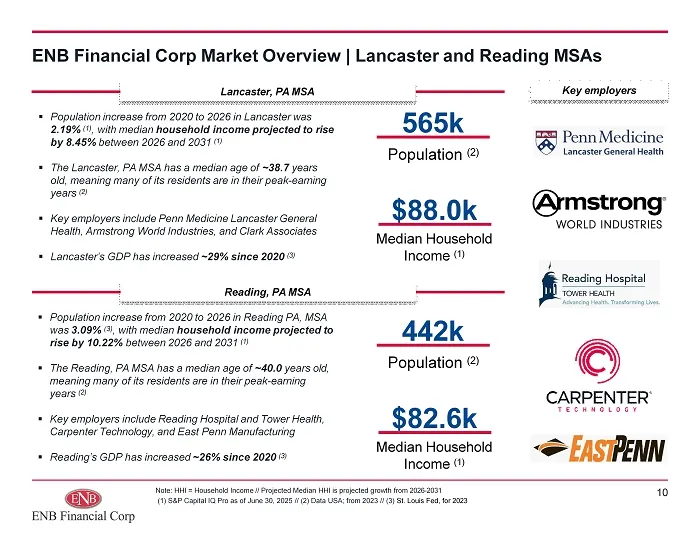
ENB Financial Corp Market Overview | Lancaster and Reading MSAs Note: HHI = Household Income // Projected Median HHI is projected growth from 2026 - 2031 (1) S&P Capital IQ Pro as of June 30, 2025 // (2) Data USA; from 2023 // (3) St. Louis Fed, for 2023 10 565k Population (2) $88.0k Median Househol
Slide 11: Market Overview | Lebanon MSA and Cecil County, MD
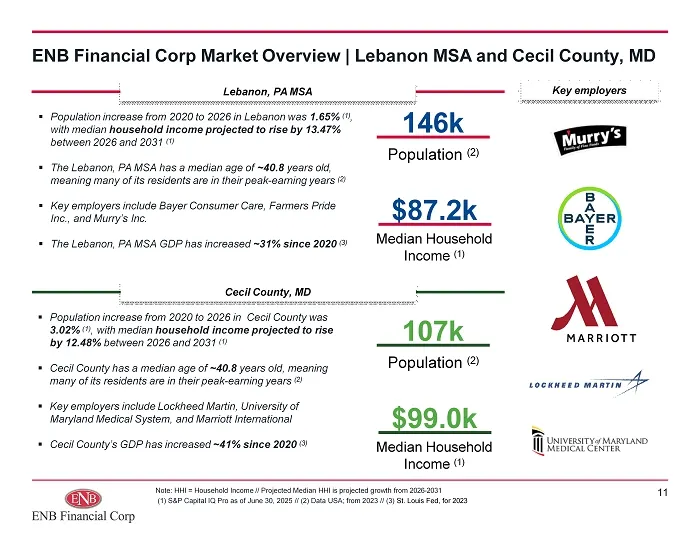
ENB Financial Corp Market Overview | Lebanon MSA and Cecil County, MD Note: HHI = Household Income // Projected Median HHI is projected growth from 2026 - 2031 (1) S&P Capital IQ Pro as of June 30, 2025 // (2) Data USA; from 2023 // (3) St. Louis Fed, for 2023 11 146k Population (2) $87.2k Median Ho
Slide 12: II. Management Team Overview
II. Management Team Overview 12
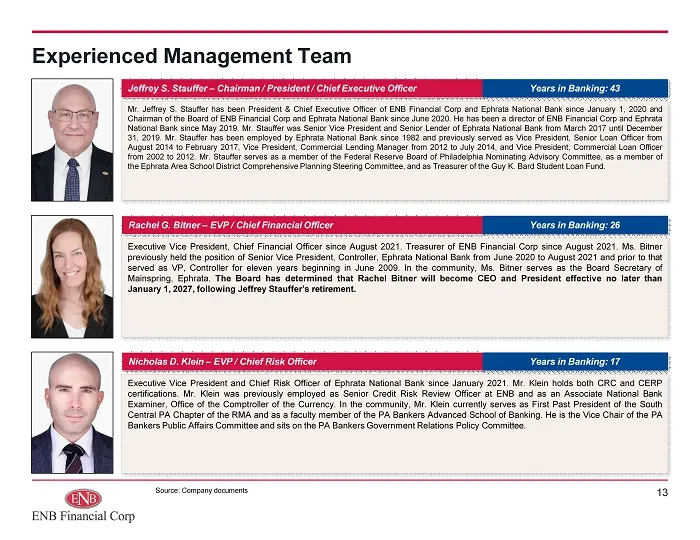
Slide 13: Experienced Management Team
Rachel G . Bitner – EVP / Chief Financial Officer Years in Banking : 26 Executive Vice President, Chief Financial Officer since August 2021 . Treasurer of ENB Financial Corp since August 2021 . Ms . Bitner previously held the position of Senior Vice President, Controller, Ephrata National Bank from
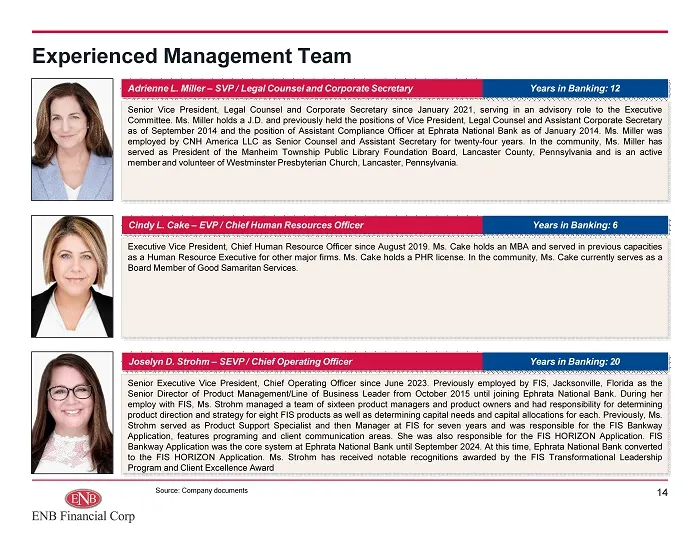
Slide 14: Experienced Management Team
Cindy L . Cake – EVP / Chief Human Resources Officer Years in Banking : 6 Executive Vice President, Chief Human Resource Officer since August 2019 . Ms . Cake holds an MBA and served in previous capacities as a Human Resource Executive for other major firms . Ms . Cake holds a PHR license . In the c
Slide 15: III. Capital Highlights
Ill. Capital Highlights ENB Financial Corp 18
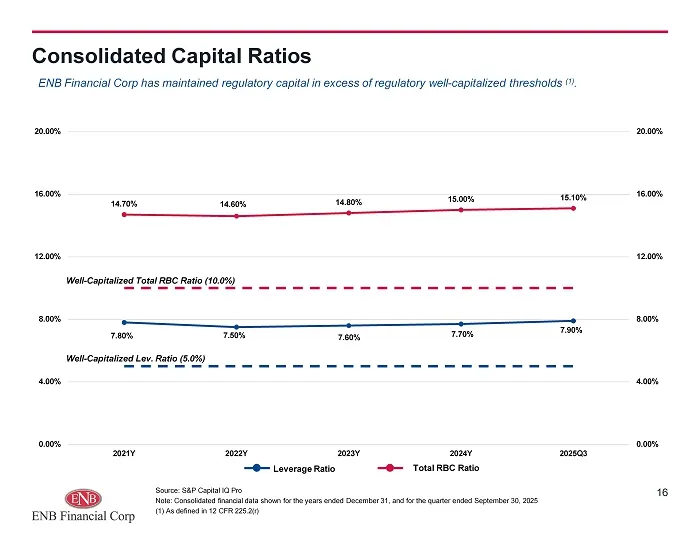
Slide 16: Consolidated Capital Ratios
7.80% 7.50% 7.60% 7.70% 7.90% 14.70% 14.60% 14.80% 15.00% 15.10% 0.00% 4.00% 8.00% 12.00% 16.00% 20.00% 0.00% 4.00% 8.00% 12.00% 16.00% 20.00% 2021Y 2022Y 2023Y 2024Y Total RBC Ratio 2025Q3 Consolidated Capital Ratios Source: S&P Capital IQ Pro Note: Consolidated financial data shown for the years e
Slide 17: Consolidated Pro Forma Capital Structure
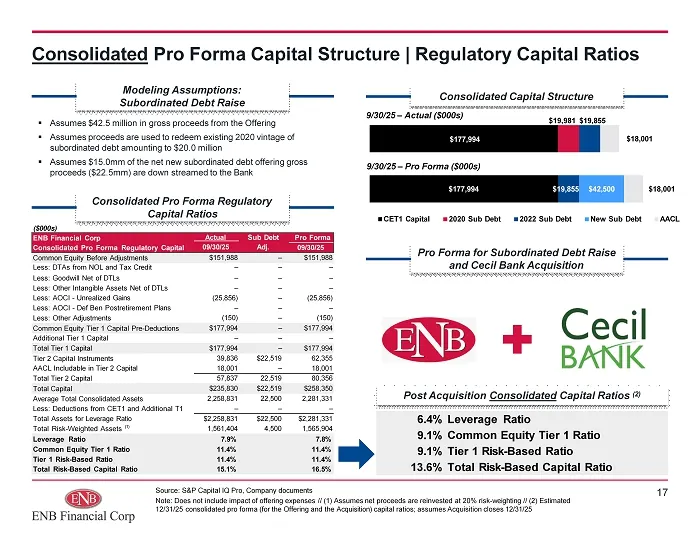
$177,994 $19,981 $19,855 $18,001 $177,994 $19,855 $42,500 $18,001 CET1 Capital 2020 Sub Debt 2022 Sub Debt New Sub Debt AACL 9/30/25 – Pro Forma ($000s) 9/30/25 – Actual ($000s) Consolidated Pro Forma Capital Structure | Regulatory Capital Ratios Source: S&P Capital IQ Pro, Company documents Note: D
Slide 18: Bank Pro Forma Capital Structure
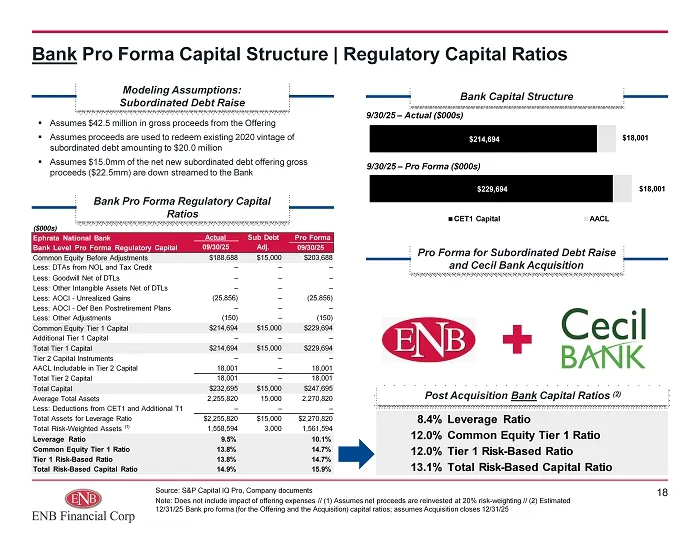
$214,694 $18,001 $229,694 $18,001 CET1 Capital AACL 9/30/25 – Pro Forma ($000s) 9/30/25 – Actual ($000s) Bank Pro Forma Capital Structure | Regulatory Capital Ratios Source: S&P Capital IQ Pro, Company documents Note: Does not include impact of offering expenses // (1) Assumes net proceeds are reinv
Slide 19: Strong Debt Service Coverage & Low Leverage
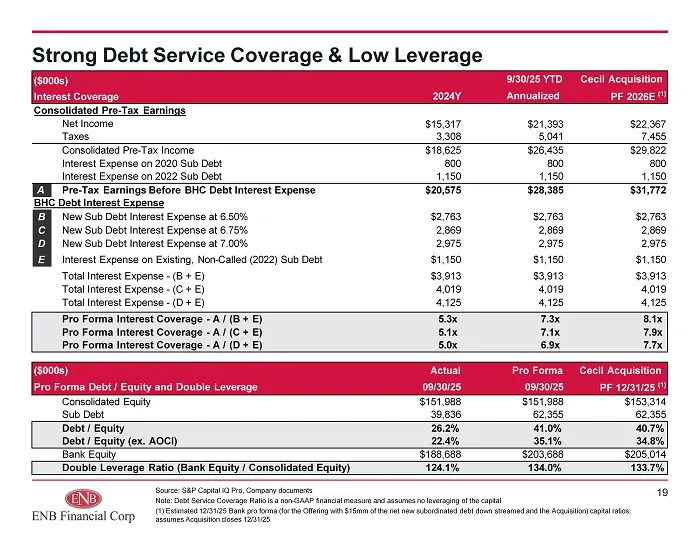
Strong Debt Service Coverage & Low Leverage Source: S&P Capital IQ Pro, Company documents Note: Debt Service Coverage Ratio is a non - GAAP financial measure and assumes no leveraging of the capital (1) Estimated 12/31/25 Bank pro forma (for the Offering with $15mm of the net new subordinated debt d
Slide 20: Current Capital Stack and Terms of Outstanding Securities
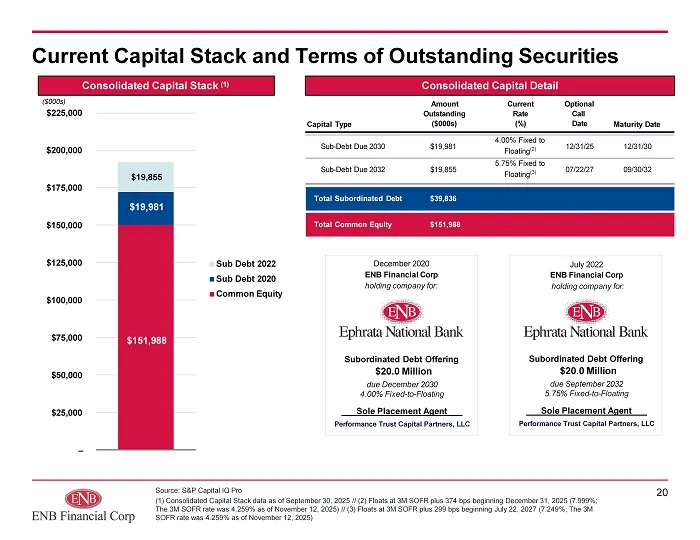
Current Capital Stack and Terms of Outstanding Securities 20 Source: S&P Capital IQ Pro (1) Consolidated Capital Stack data as of September 30, 2025 // (2) Floats at 3M SOFR plus 374 bps beginning December 31, 2025 (7.999%; The 3M SOFR rate was 4.259% as of November 12, 2025) // (3) Floats at 3M SOF
Slide 21: IV. Assets Highlights
IV. Assets Highlights ENB Financial Corp 2
Slide 22: Tactical Balance Sheet Growth
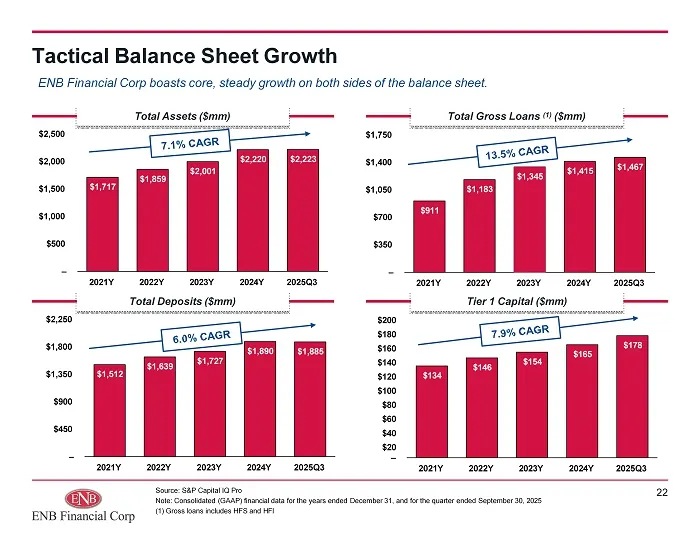
$134 $146 $154 $165 $178 – $200 $180 $160 $140 $120 $100 $80 $60 $40 $20 2021Y 2022Y 2023Y 2024Y 2025Q3 $1,512 $1,639 $1,727 $1,890 $1,885 – $450 $900 $1,350 $1,800 $2,250 2021Y 2022Y 2023Y 2024Y 2025Q3 $911 $1,183 $1,345 $1,415 $1,467 – $350 $700 $1,050 $1,400 $1,750 2021Y 2022Y 2023Y 2024Y 2025Q3
Slide 23: Loan Portfolio Diversification & Growth
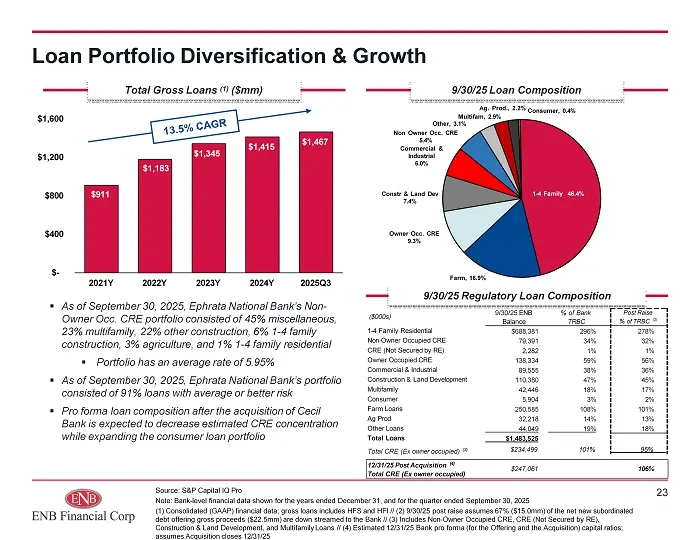
$911 $1,183 $1,345 $1,415 $1,467 $ - $400 $800 $1,200 $1,600 Loan Portfolio Diversification & Growth Source: S&P Capital IQ Pro Note: Bank - level financial data shown for the years ended December 31, and for the quarter ended September 30, 2025 (1) Consolidated (GAAP) financial data; gross loans in
Slide 24: Pro Forma Loan Portfolio
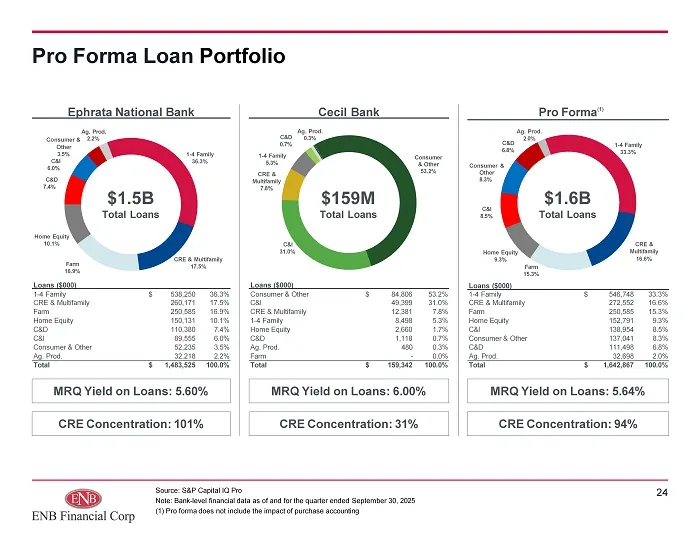
Pro Forma Loan Portfolio Source: S&P Capital IQ Pro Note: Bank - level financial data as of and for the quarter ended September 30, 2025 (1) Pro forma does not include the impact of purchase accounting 24 $1.5B Total Loans $159M Total Loans $1.6B Total Loans Loans ($000) Loans ($000) 36.3% $ 538,250
Slide 25: Historical Bank Loan Composition & Yields
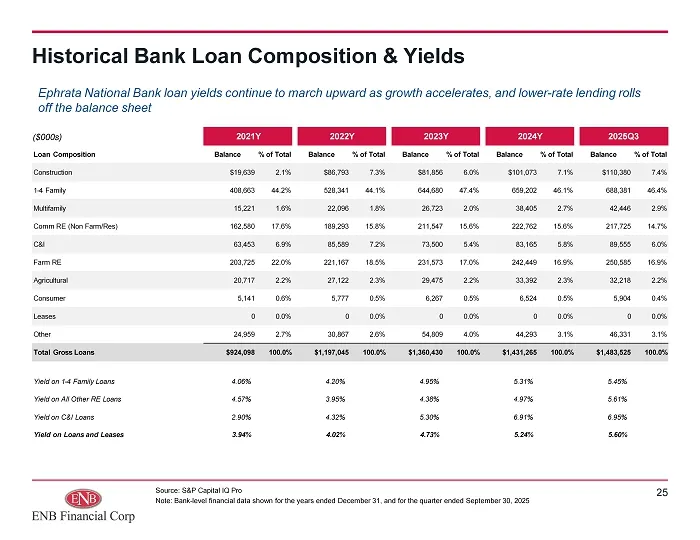
Historical Bank Loan Composition & Yields Source: S&P Capital IQ Pro Note: Bank - level financial data shown for the years ended December 31, and for the quarter ended September 30, 2025 2025Q3 2024Y 2023Y 2022Y 2021Y ($000s) % of Total Balance % of Total Balance % of Total Balance % of Total Balanc
Slide 26: Asset Quality & Reserve Coverage Ratios
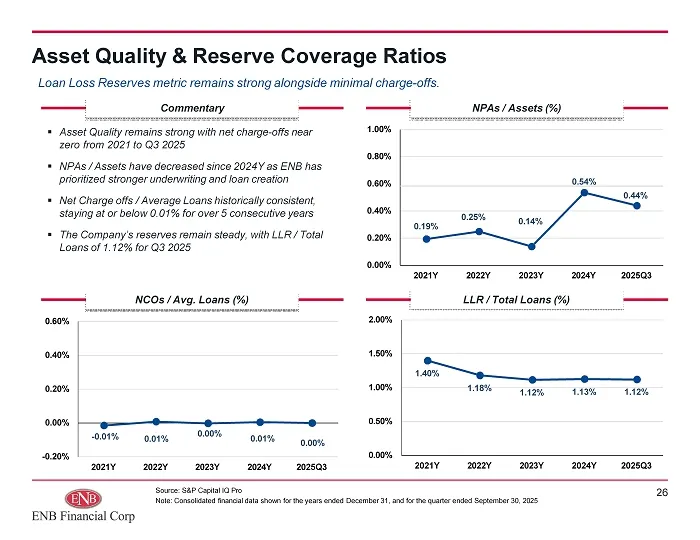
Asset Quality & Reserve Coverage Ratios Source: S&P Capital IQ Pro Note: Consolidated financial data shown for the years ended December 31, and for the quarter ended September 30, 2025 26 - 0.01% 0.01% 0.00% 0.01% 0.00% - 0.20% 0.00% 0.20% 0.40% 0.60% 2021Y 2022Y 2023Y 2024Y 2025Q3 NCOs / Avg. Loans
Slide 27: Investment Portfolio Composition & Performance
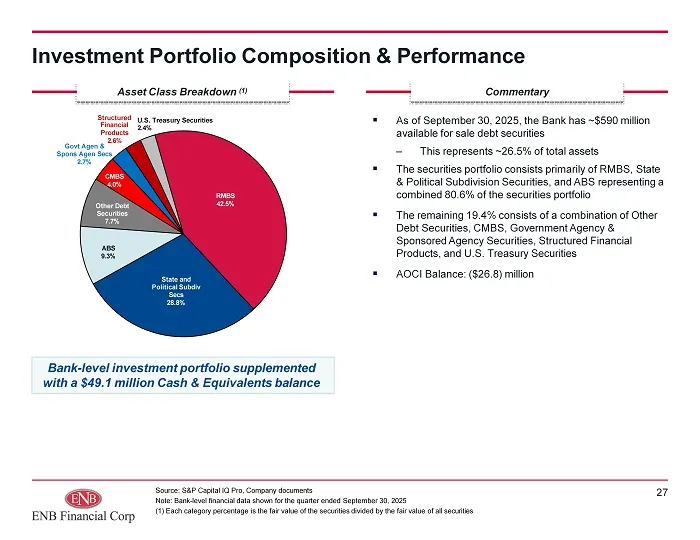
Investment Portfolio Composition & Performance ▪ As of September 30, 2025, the Bank has ~$590 million available for sale debt securities – This represents ~26.5% of total assets ▪ The securities portfolio consists primarily of RMBS, State & Political Subdivision Securities, and ABS representing a co
Slide 28: V. Liabilities Highlights
V. Liabilities Highlights 28
Slide 29: Deposit Composition
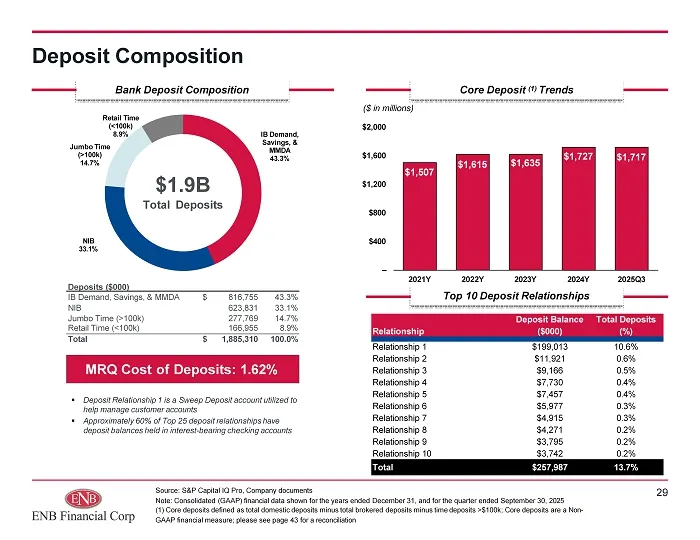
Deposit Composition Source: S&P Capital IQ Pro, Company documents Note: Consolidated (GAAP) financial data shown for the years ended December 31, and for the quarter ended September 30, 2025 (1) Core deposits defined as total domestic deposits minus total brokered deposits minus time deposits >$100k
Slide 30: Deposit Composition Pro Forma
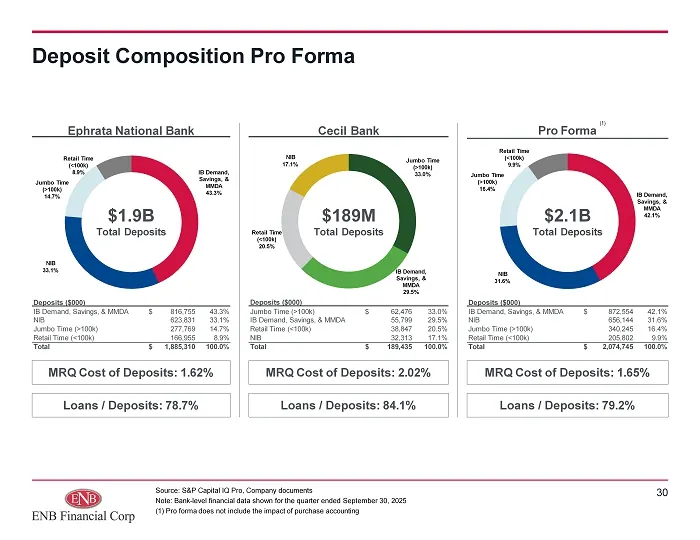
Deposit Composition Pro Forma Source: S&P Capital IQ Pro, Company documents Note: Bank - level financial data shown for the quarter ended September 30, 2025 (1) Pro forma does not include the impact of purchase accounting 30 Ephrata National Bank Cecil Bank $1.9B Total Deposits $189M Total Deposits
Slide 31: VI. Income Statement Highlights
VI. Income Statement Highlights 31
Slide 32: Core Net Revenue Detail
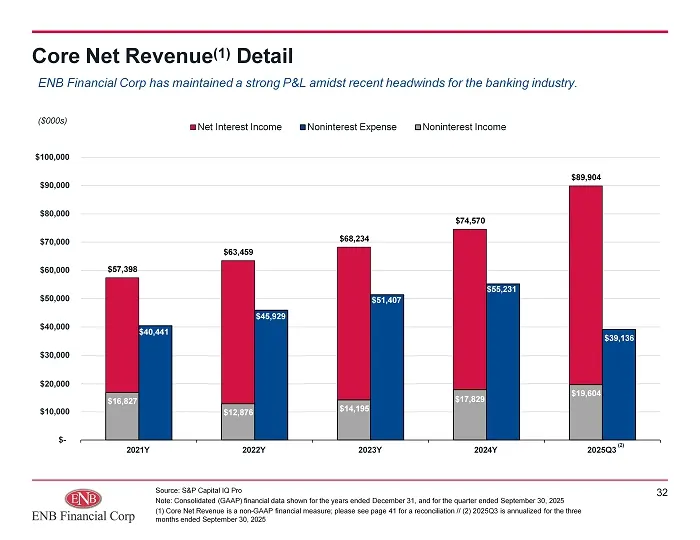
$57,398 $63,459 $68,234 $74,570 $89,904 $40,441 $45,929 $51,407 $55,231 $39,136 $16,827 $12,876 $14,195 $17,829 $19,604 $ - $10,000 $30,000 $20,000 $40,000 $50,000 $60,000 $70,000 $80,000 $90,000 $100,000 2021Y 2022Y 2023Y 2024Y 2025Q3 Net Interest Income Noninterest Expense Noninterest Income Core
Slide 33: Net Interest Income & Net Interest Margin
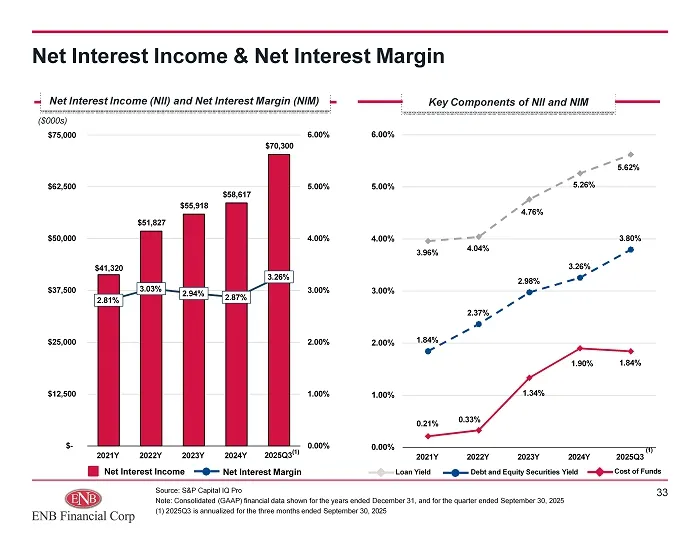
Net Interest Income & Net Interest Margin Source: S&P Capital IQ Pro Note: Consolidated (GAAP) financial data shown for the years ended December 31, and for the quarter ended September 30, 2025 (1) 2025Q3 is annualized for the three months ended September 30, 2025 33 $41,320 $51,827 $55,918 $58,617
Slide 34: ROATCE & ROAA
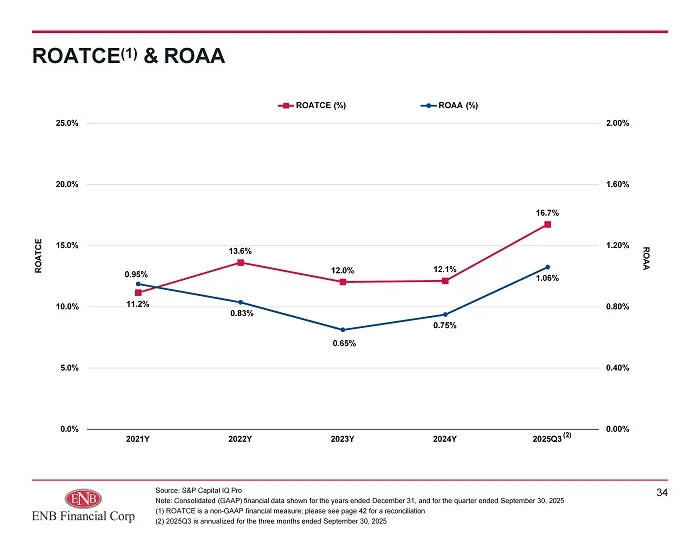
ROATCE (1) & ROAA Source: S&P Capital IQ Pro Note: Consolidated (GAAP) financial data shown for the years ended December 31, and for the quarter ended September 30, 2025 (1) ROATCE is a non - GAAP financial measure; please see page 42 for a reconciliation (2) 2025Q3 is annualized for the three month
Slide 35: Noninterest Expense / Avg. Assets & Efficiency Ratio
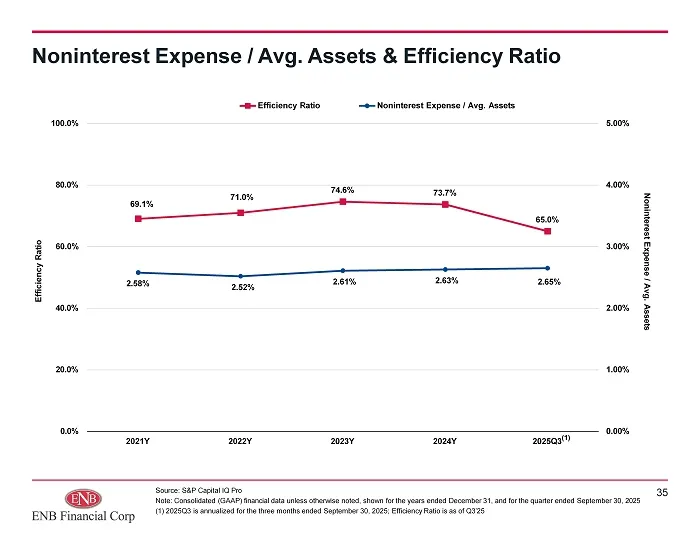
Noninterest Expense / Avg. Assets & Efficiency Ratio Source: S&P Capital IQ Pro Note: Consolidated (GAAP) financial data unless otherwise noted, shown for the years ended December 31, and for the quarter ended September 30, 2025 (1) 2025Q3 is annualized for the three months ended September 30, 2025;
Slide 36: VII. Appendix
VIL. Appendix ENB Financial Corp
Slide 37: Financial Highlights
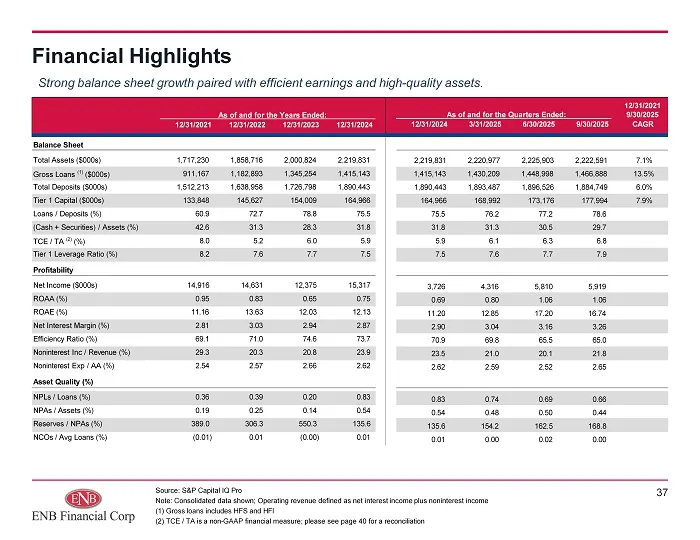
Financial Highlights Source: S&P Capital IQ Pro Note: Consolidated data shown; Operating revenue defined as net interest income plus noninterest income (1) Gross loans includes HFS and HFI (2) TCE / TA is a non - GAAP financial measure; please see page 40 for a reconciliation 12/31/2021 As of and fo
Slide 38: Historical Consolidated Balance Sheet
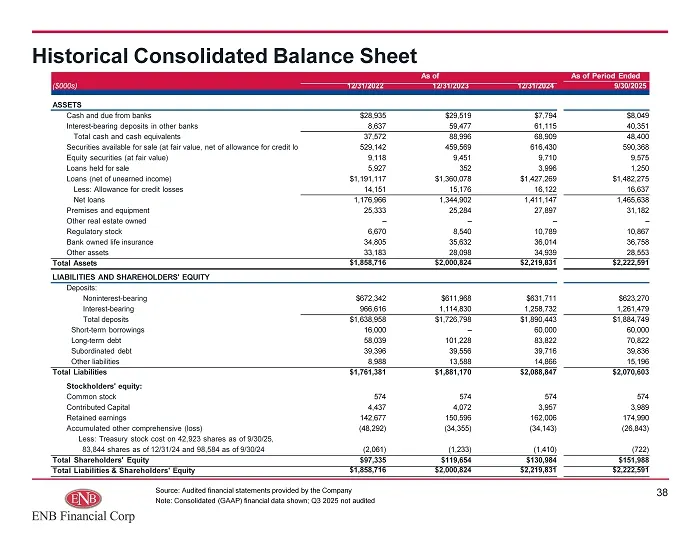
Historical Consolidated Balance Sheet Source: Audited financial statements provided by the Company Note: Consolidated (GAAP) financial data shown; Q3 2025 not audited 38 As of Period Ended As of 9/30/2025 ($000s) 12/31/2022 12/31/2023 12/31/2024 ASSETS $8,049 $7,794 $29,519 $28,935 Cash and due from
Slide 39: Historical Consolidated Income Statement
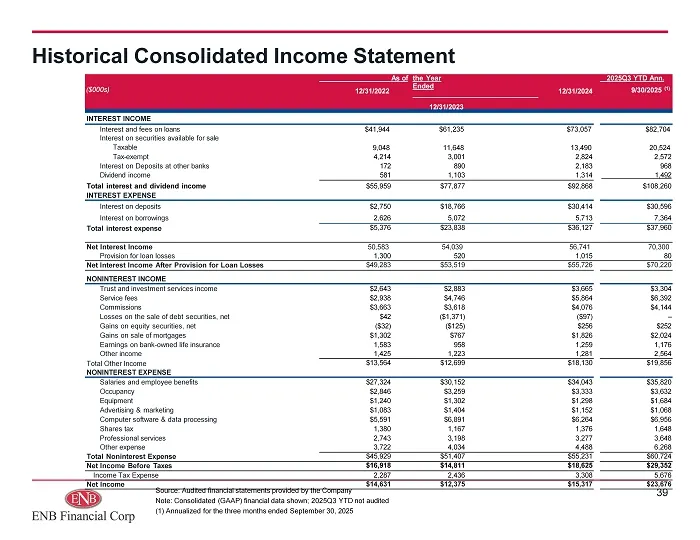
Historical Consolidated Income Statement Source: Audited financial statements provided by the Company Note: Consolidated (GAAP) financial data shown; 2025Q3 YTD not audited (1) Annualized for the three months ended September 30, 2025 39 2025Q3 YTD Ann. 9/30/2025 (1) 12/31/2024 the Year Ended 12/31/2
Slide 40: Non-GAAP Reconciliation | Consolidated TCE / TA
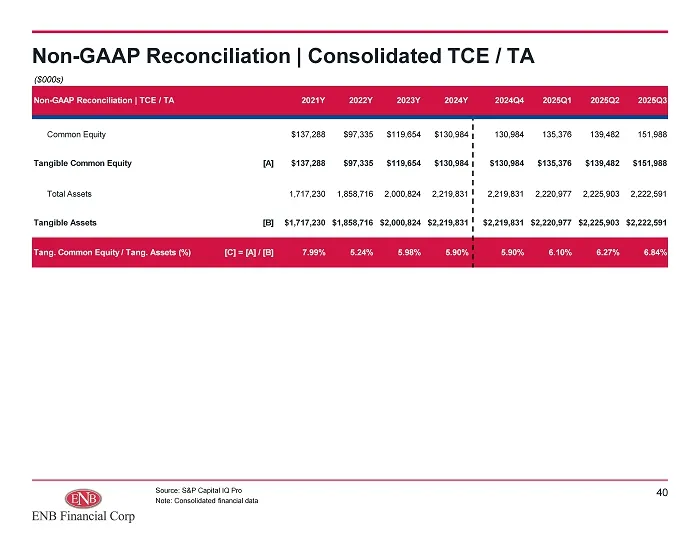
Non - GAAP Reconciliation | Consolidated TCE / TA Source: S&P Capital IQ Pro Note: Consolidated financial data 40 2025Q3 2025Q2 2025Q1 2024Q4 2024Y 2023Y 2022Y 2021Y Non - GAAP Reconciliation | TCE / TA 151,988 139,482 135,376 130,984 $130,984 $119,654 $97,335 $137,288 Common Equity $151,988 $139,48
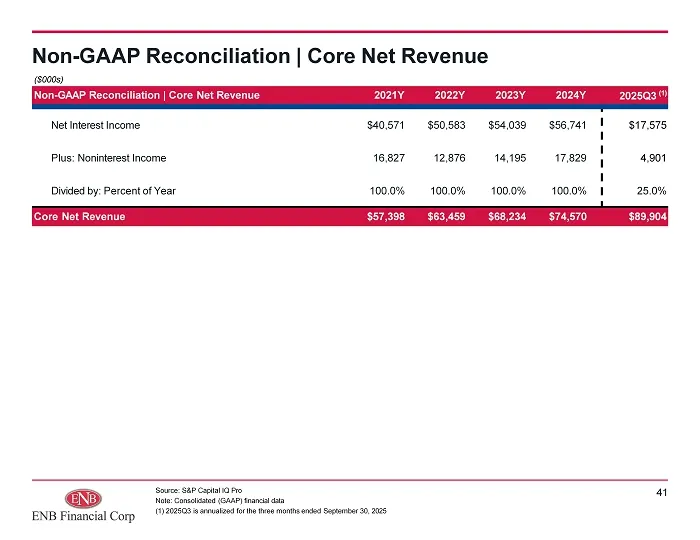
Slide 41: Non-GAAP Reconciliation | Core Net Revenue
Non - GAAP Reconciliation | Core Net Revenue Source: S&P Capital IQ Pro Note: Consolidated (GAAP) financial data (1) 2025Q3 is annualized for the three months ended September 30, 2025 41 2025Q3 (1) 2024Y 2023Y 2022Y 2021Y Non - GAAP Reconciliation | Core Net Revenue $17,575 $56,741 $54,039 $50,583 $
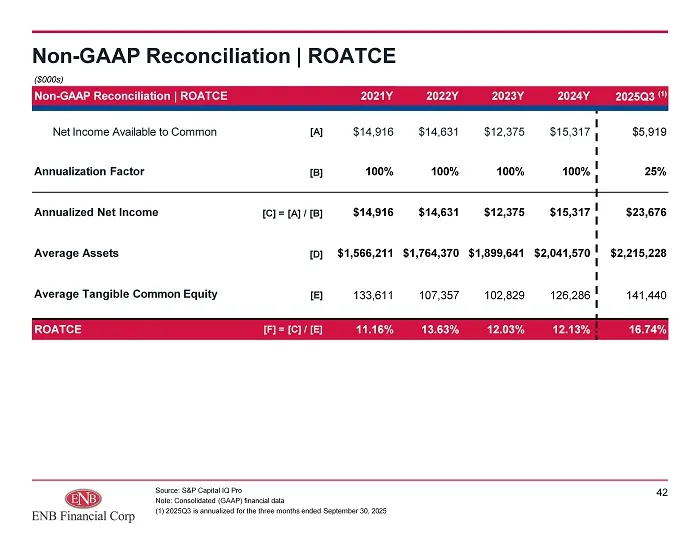
Slide 42: Non-GAAP Reconciliation | ROATCE
2025Q3 (1) 2024Y 2023Y 2022Y 2021Y Non - GAAP Reconciliation | ROATCE $5,919 $15,317 $12,375 $14,631 $14,916 [A] Net Income Available to Common 25% 100% 100% 100% 100% [B] Annualization Factor $23,676 $15,317 $12,375 $14,631 $14,916 [C] = [A] / [B] Annualized Net Income $2,215,228 $2,041,570 $1,899,
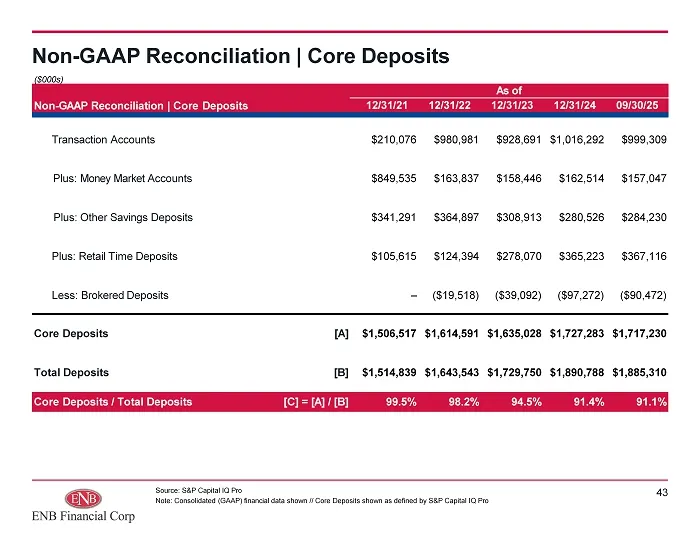
Slide 43: Non-GAAP Reconciliation | Core Deposits
Non - GAAP Reconciliation | Core Deposits Source: S&P Capital IQ Pro Note: Consolidated (GAAP) financial data shown // Core Deposits shown as defined by S&P Capital IQ Pro 43 As of Non - GAAP Reconciliation | Core Deposits 09/30/25 12/31/24 12/31/23 12/31/22 12/31/21 $999,309 $1,016,292 $928,691 $98
Source: SEC EDGAR · 8-K filed Dec 18, 2025
More decks from ENB Financial Corp
 Shareholder Meeting (May 2026)43 slides · May 5, 2026
 Shareholder Meeting (May 2025)34 slides · May 7, 2025
 Shareholder Meeting (May 2024)28 slides · May 8, 2024
 Shareholder Meeting (May 2023)28 slides · May 10, 2023
 Shareholder Meeting (May 2023)28 slides · May 9, 2023
 Shareholder Meeting (May 2022)34 slides · May 11, 2022