Bioceres Crop Solutions Corp. · NASDAQ:BIOX
Bioceres Crop Solutions — FY2021 Earnings Presentation
23 slides from Bioceres Crop Solutions's earnings presentation, 2021
Slide 1: Fourth Quarter & Full-Year 2021 Financial and Operating Results
Reports Fiscal Fourth Quarter & Full-Year 2021 Financial and Operating Results fBioceres Crop Solutions S S 4 SS
Slide 2: Disclaimer
Disclaimer This Presentation is for informational purposes only and does not constitute an offer or invitation to sell, a solicitation Financial Information Presentation of an offer to buy, or a recommendation to purchase any equity, assets, business, debt or other financial instruments Historical f
Slide 3: Key Business & Financial Highlights
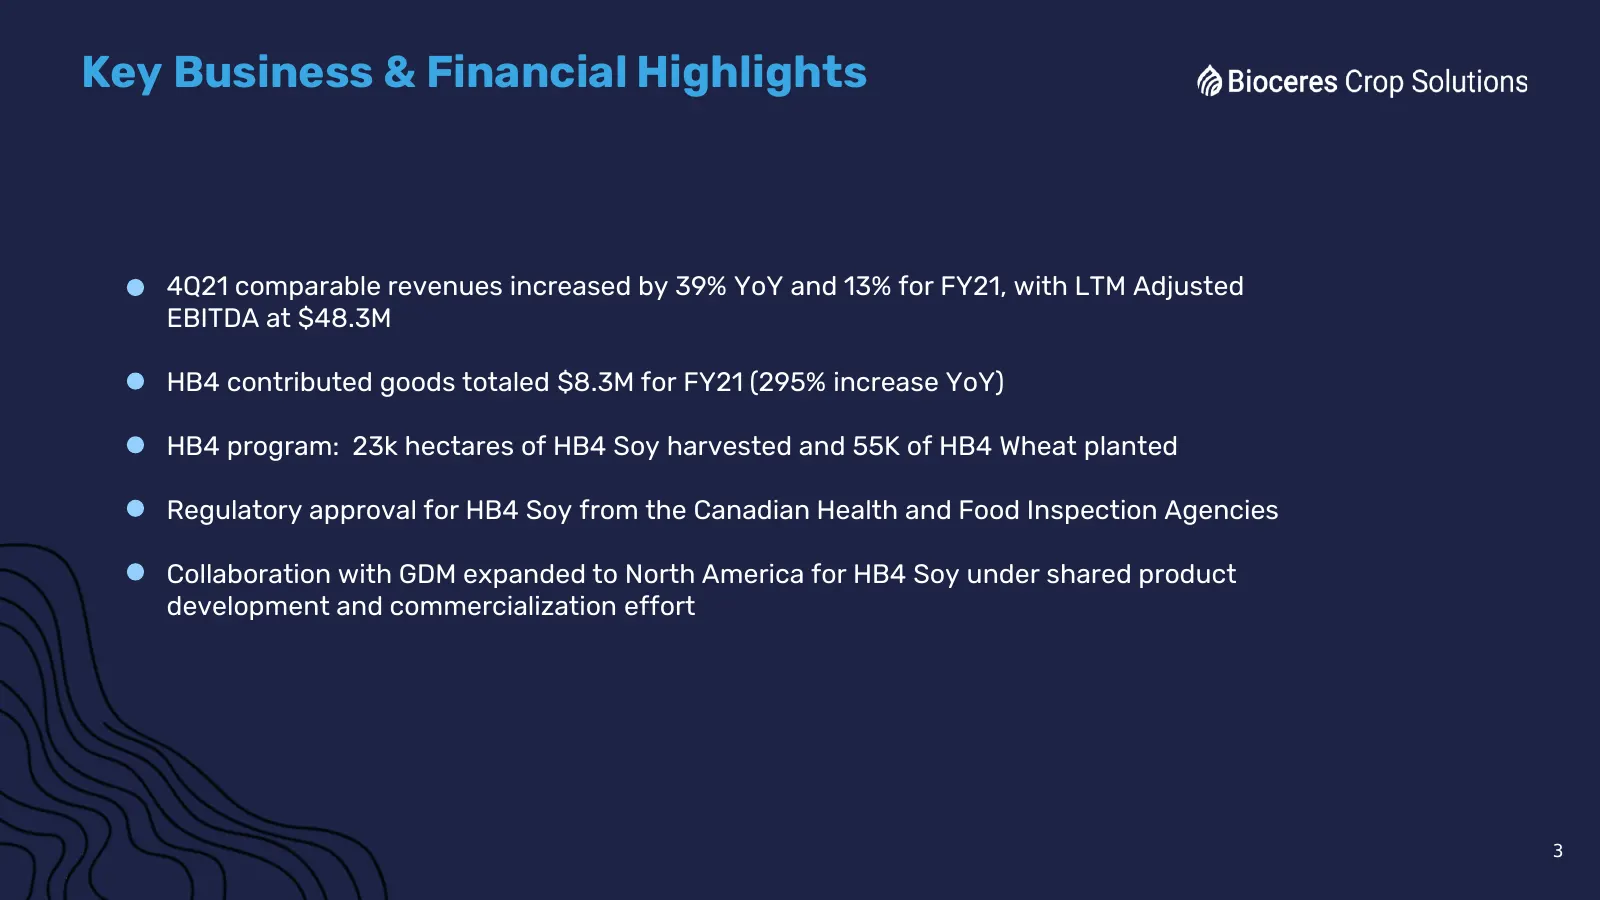
Key Business & Financial Highlights 4Q21 comparable revenues increased by 39% YoY and 13% for FY21, with LTM Adjusted EBITDA at $48.3M HB4 contributed goods totaled $8.3M for FY21 (295% increase YoY) HB4 program: 23k hectares of HB4 Soy harvested and 55K of HB4 Wheat planted Regulatory approval for
Slide 4: HB4 Wheat Update
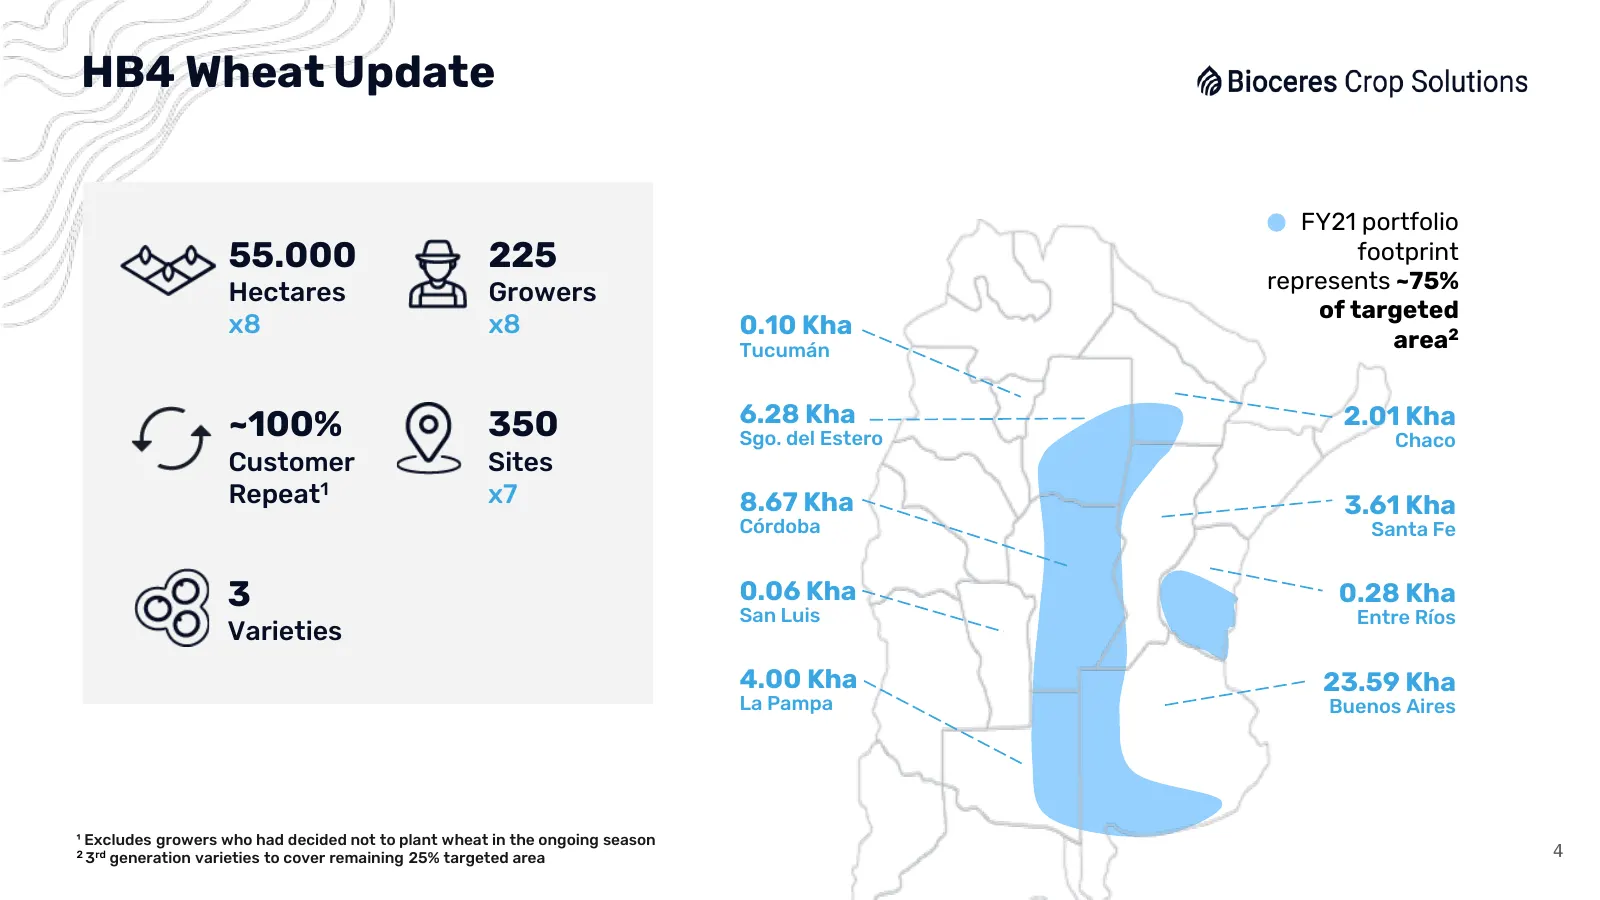
HB4 Wheat Update FY21 portfolio 55.000 225 footprint Hectares Growers represents ~75% of targeted x8 x8 0.10 Kha Tucumán area2 6.28 Kha 2.01 Kha ~100% 350 Sgo. del Estero Chaco Customer Sites Repeat1 x7 8.67 Kha 3.61 Kha Córdoba Santa Fe 3 0.06 Kha San Luis 0.28 Kha Entre Ríos Varieties 4.00 Kha 23.
Slide 5: HB4 Soy Overall Results For The Season
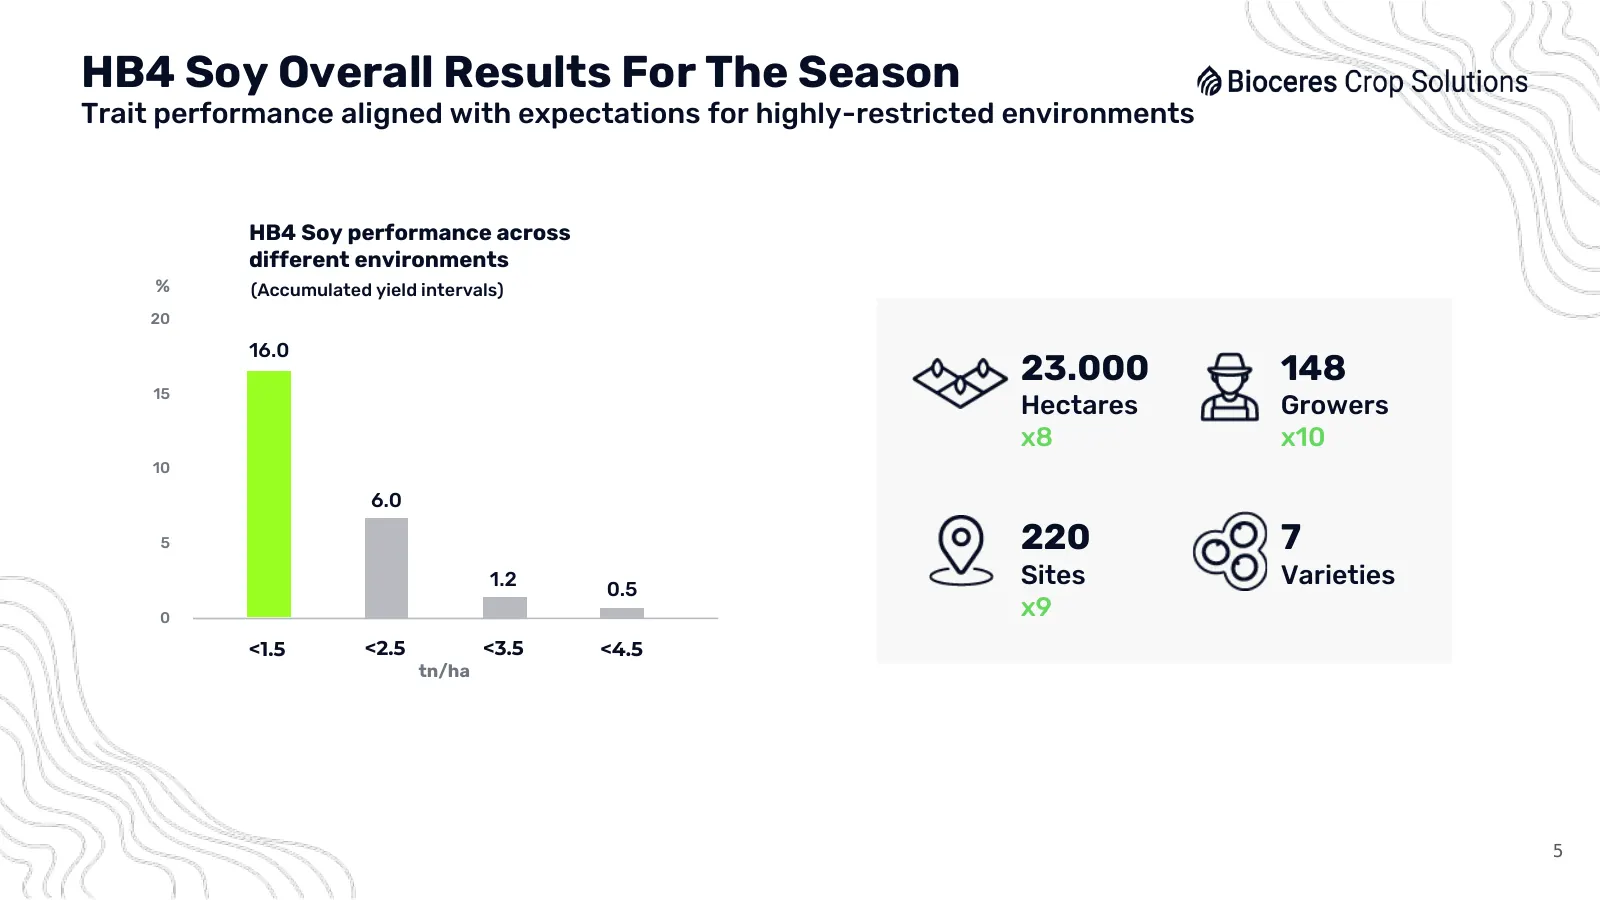
HB4 Soy Overall Results For The Season Trait performance aligned with expectations for highly-restricted environments HB4 Soy performance across different environments % (Accumulated yield intervals) 20 16.0 23.000 148 15 Hectares Growers x8 x10 10 6.0 5 220 7 1.2 0.5 Sites Varieties 0 x9 <1.5 <2.5
Slide 6: Germplasm Drag Affecting Performance in Moderate-to-Highly Productive Environments
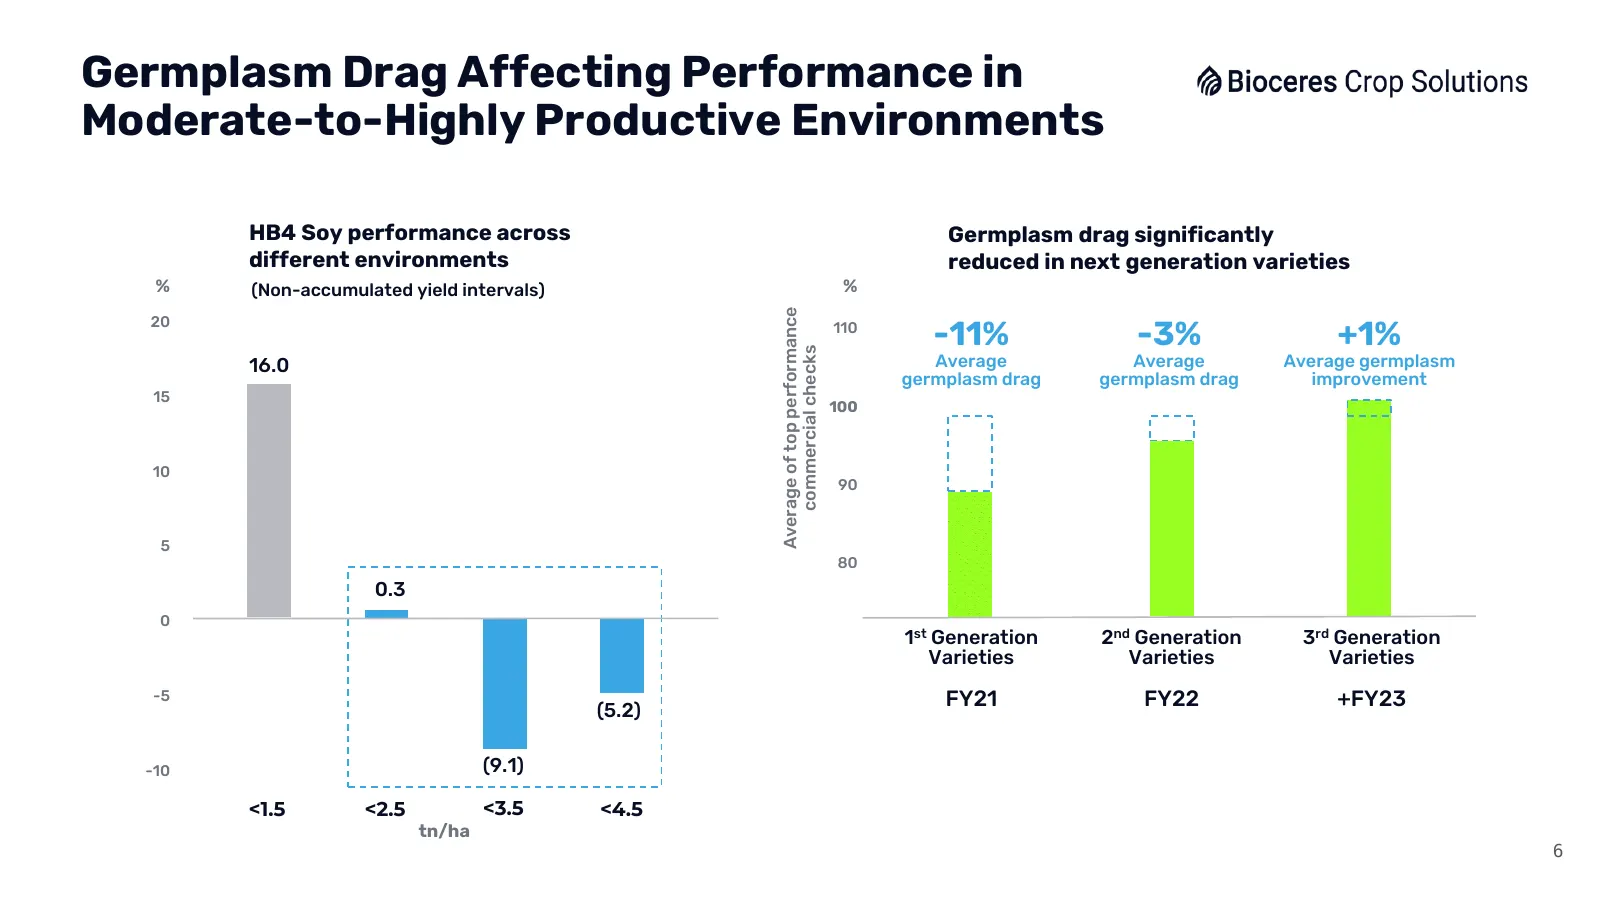
Germplasm Drag Affecting Performance in Moderate-to-Highly Productive Environments HB4 Soy performance across Germplasm drag significantly different environments reduced in next generation varieties % (Non-accumulated yield intervals) % Average of top performance 20 110 -11% -3% +1% commercial check
Slide 7: 2nd Generation Varieties Delivered Improved Performance as Second Crop to Wheat
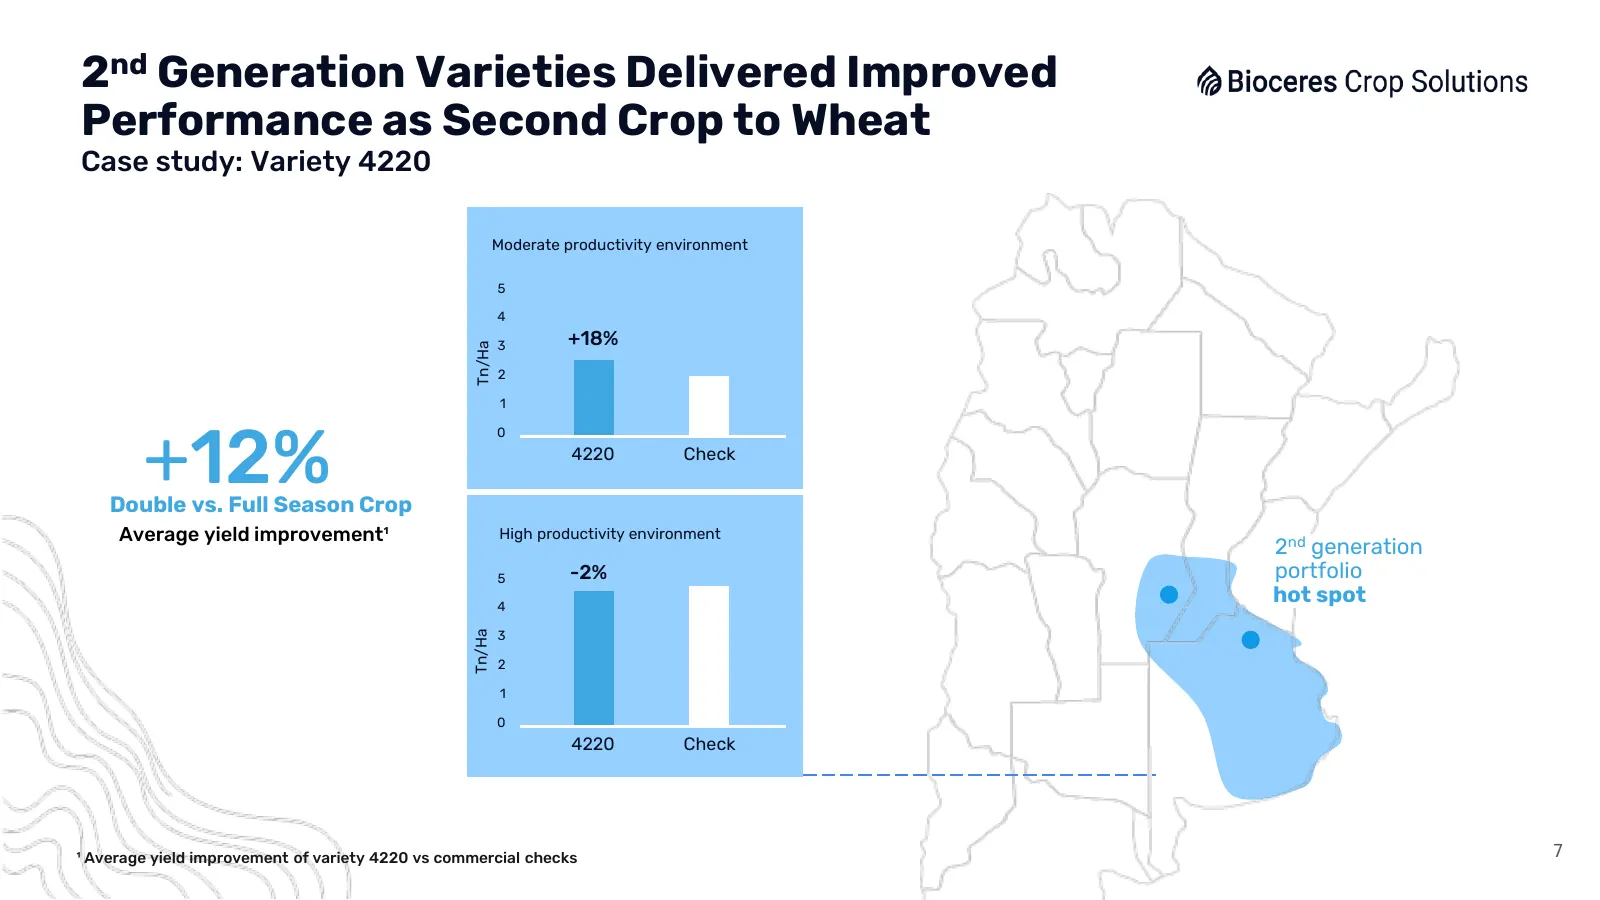
2nd Generation Varieties Delivered Improved Performance as Second Crop to Wheat Case study: Variety 4220 Moderate productivity environment 5 4 3 +18% Tn/Ha 2 1 +12% 0 4220 Check Double vs. Full Season Crop Average yield improvement¹ High productivity environment 2nd generation 5 -2% portfolio 4 hot
Slide 8: Last Season Main Takeaways
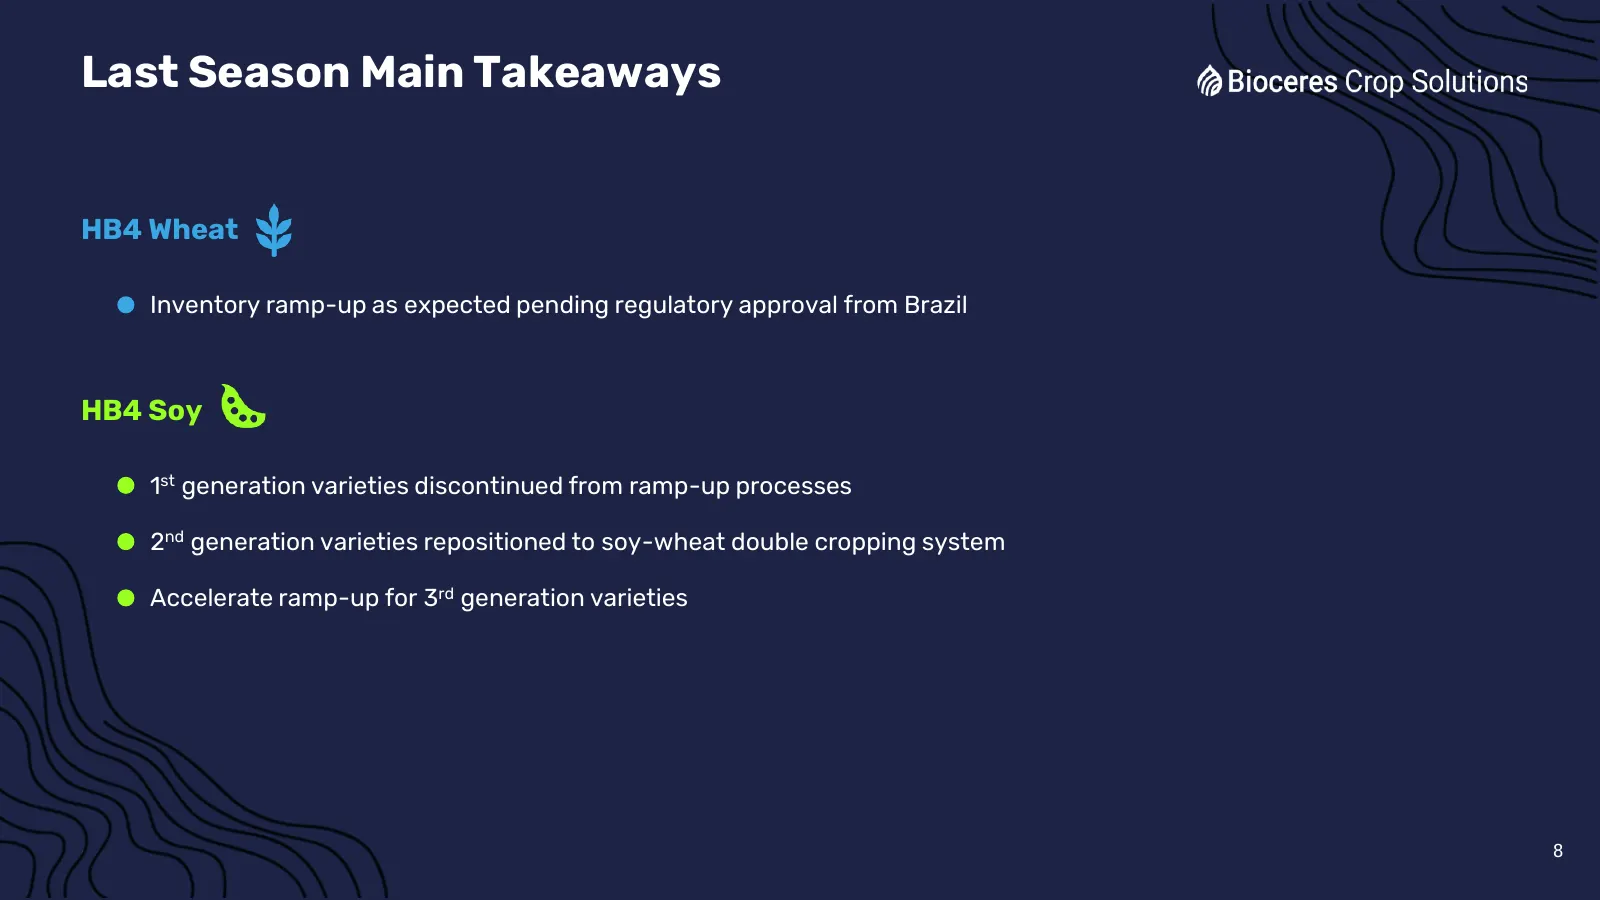
Last Season Main Takeaways HB4 Wheat Inventory ramp-up as expected pending regulatory approval from Brazil HB4 Soy 1st generation varieties discontinued from ramp-up processes 2nd generation varieties repositioned to soy-wheat double cropping system Accelerate ramp-up for 3rd generation varieties 8
Slide 9: Breeding efforts across The Americas
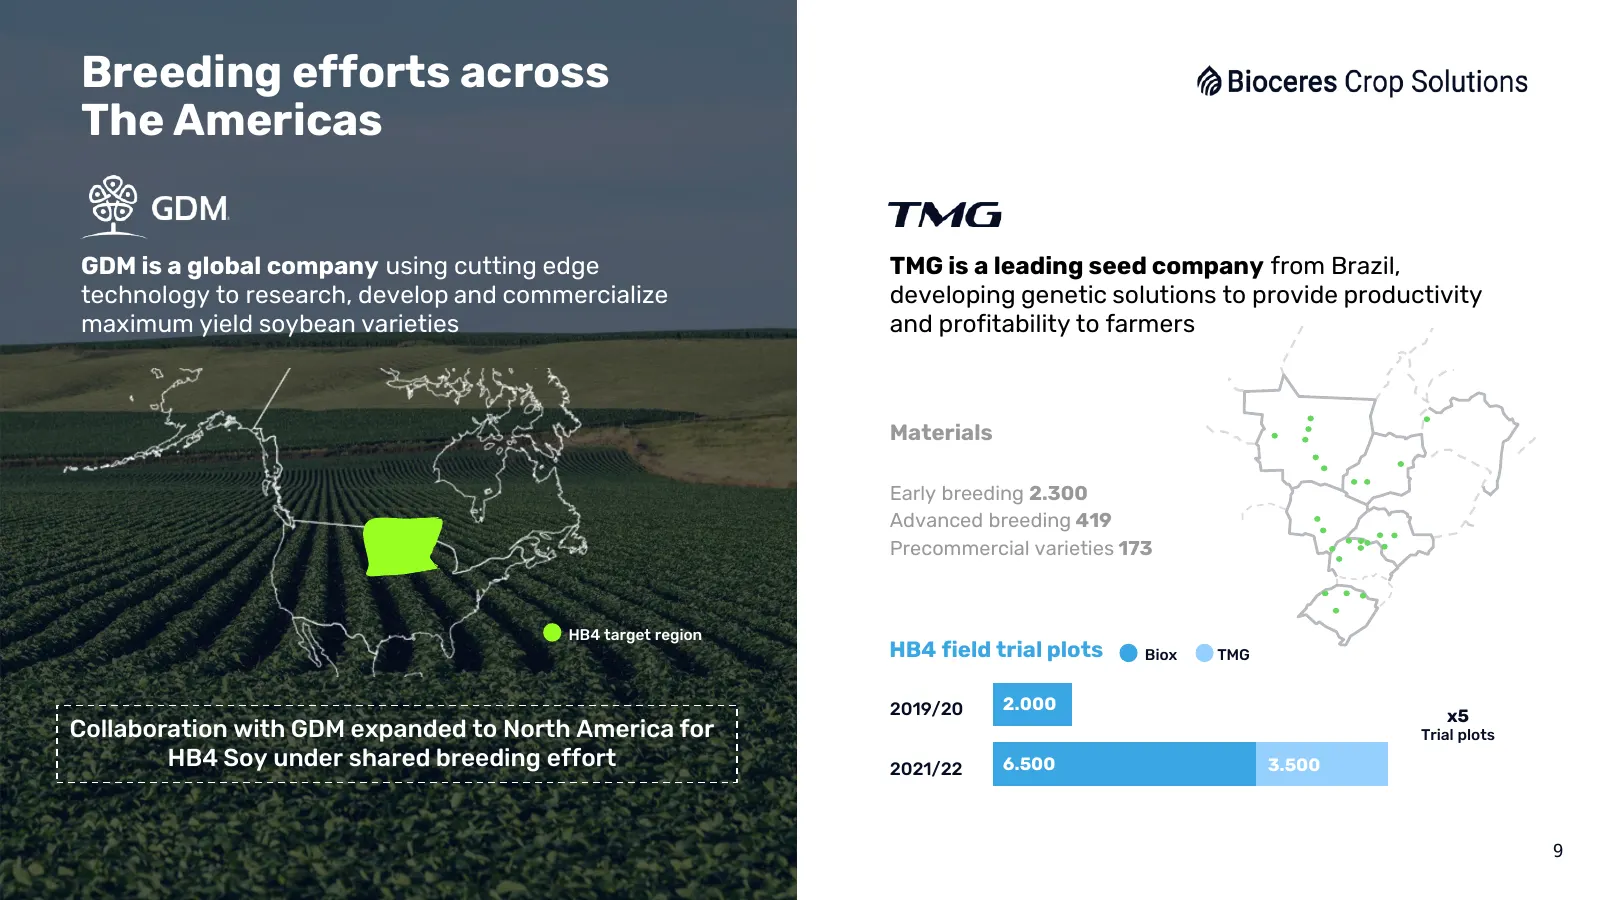
Breeding efforts across The Americas GDM is a global company using cutting edge TMG is a leading seed company from Brazil, technology to research, develop and commercialize developing genetic solutions to provide productivity maximum yield soybean varieties and profitability to farmers Materials Ear
Slide 10: HB4 Regulatory Status
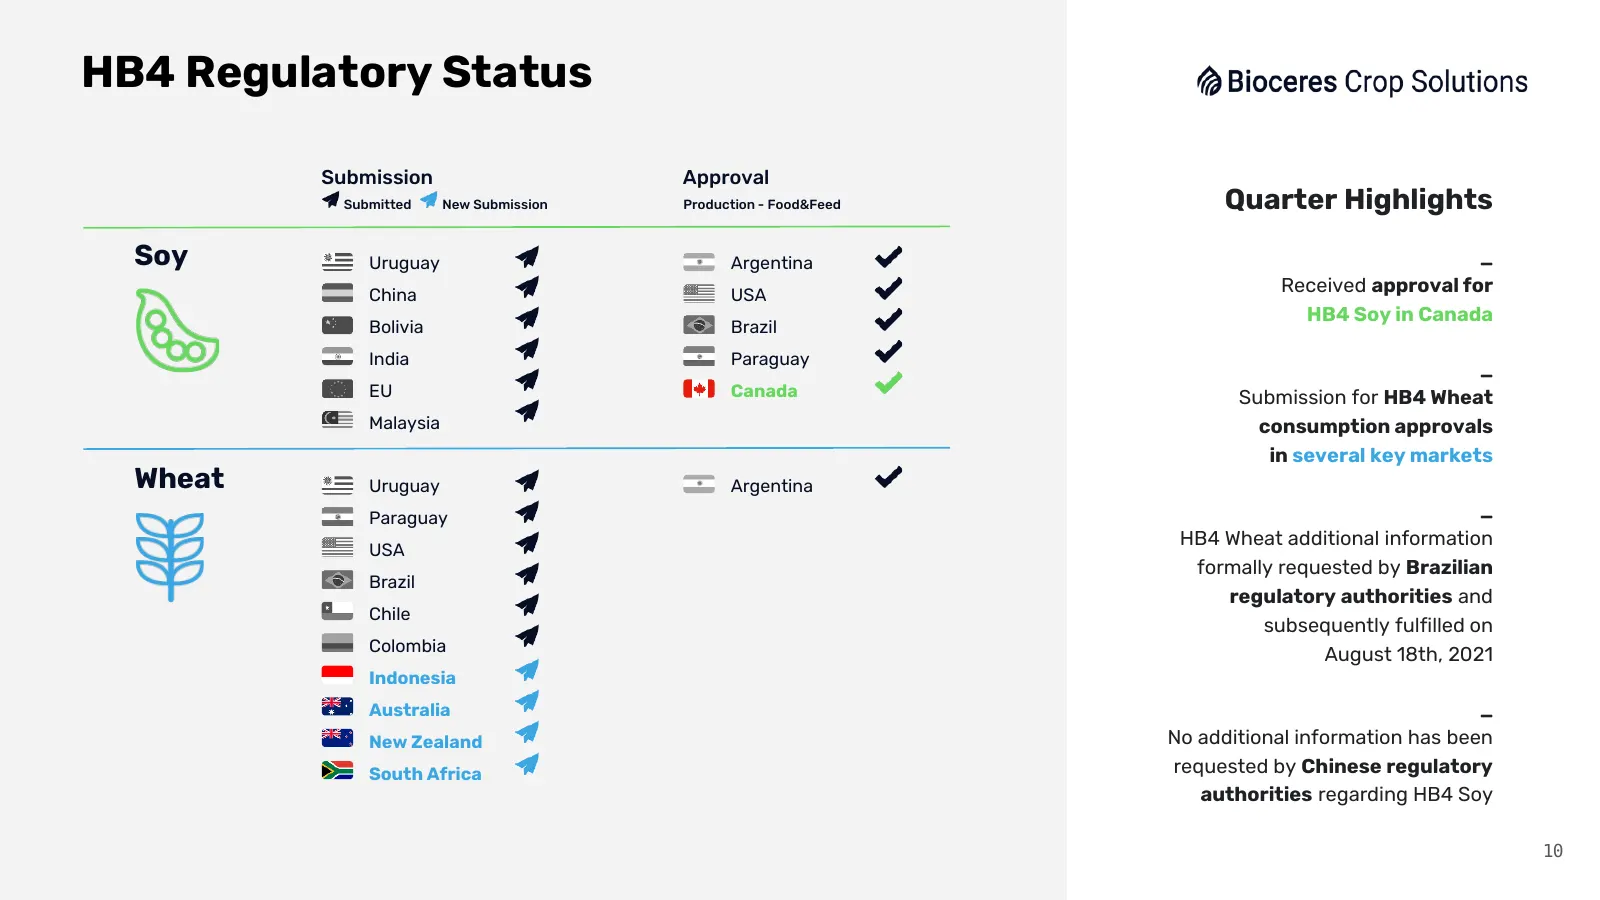
HB4 Regulatory Status Submission Approval Submitted New Submission Production - Food&Feed Quarter Highlights Soy Uruguay Argentina _ China USA Received approval for HB4 Soy in Canada Bolivia Brazil India Paraguay _ EU Canada Submission for HB4 Wheat Malaysia consumption approvals in several key mark
Slide 11: Quarterly Net Revenue Growth
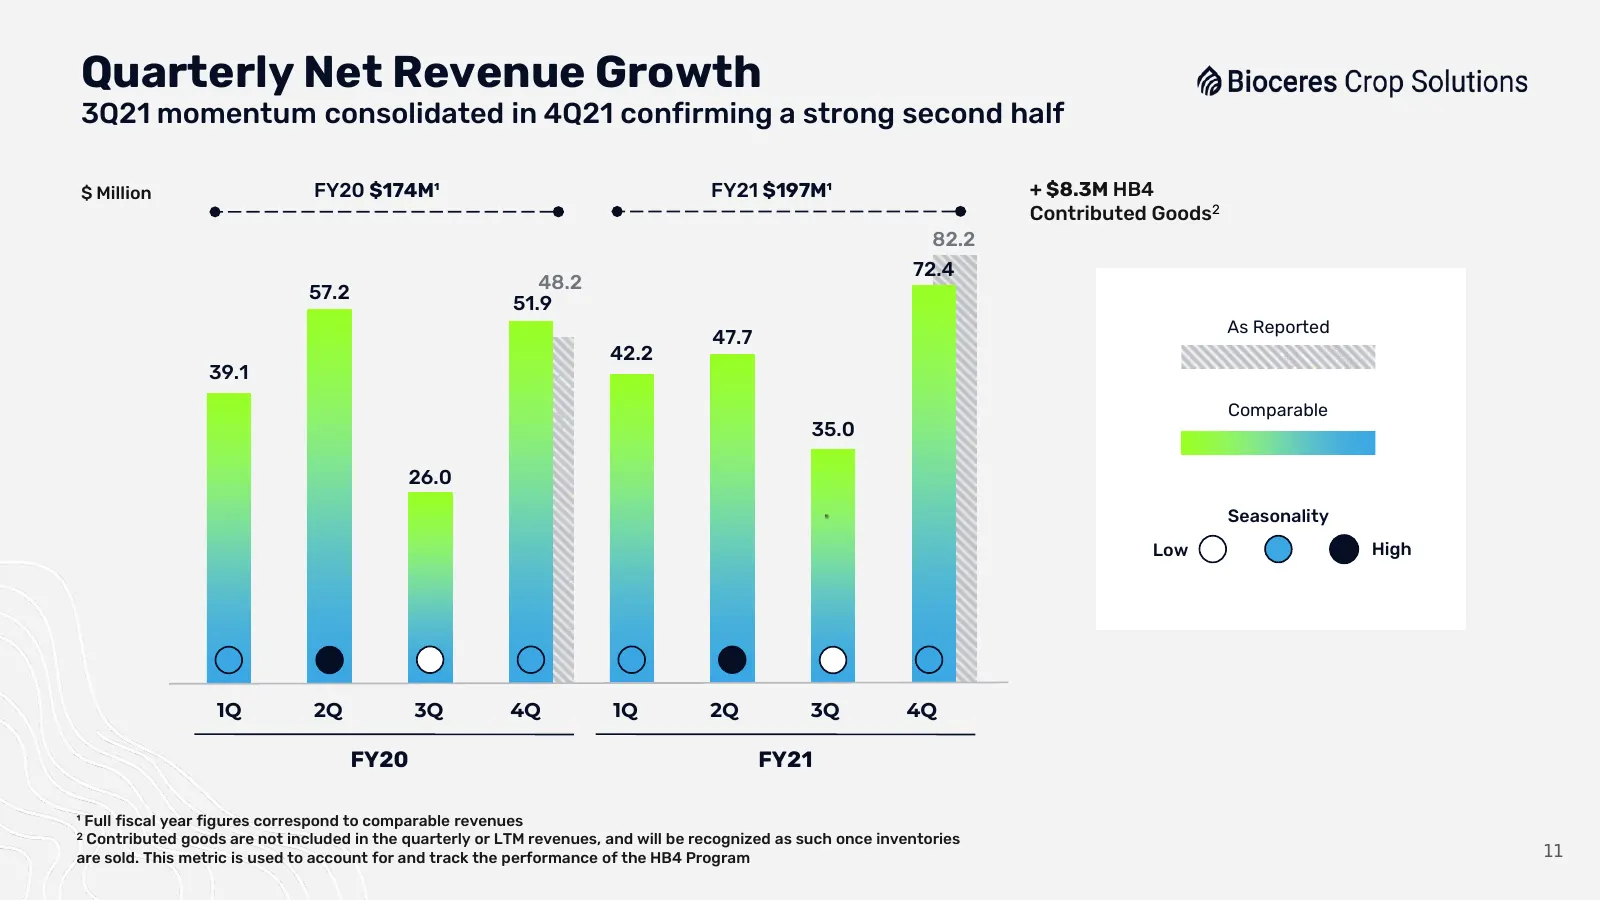
Quarterly Net Revenue Growth 3Q21 momentum consolidated in 4Q21 confirming a strong second half $ Million FY20 $174M¹ FY21 $197M¹ + $8.3M HB4 Contributed Goods2 82.2 72.4 48.2 57.2 51.9 As Reported 47.7 42.2 39.1 Comparable 35.0 26.0 Seasonality Low High 1Q 2Q 3Q 4Q 1Q 2Q 3Q 4Q FY20 FY21 ¹ Full fisc
Slide 12: 4Q Comparable Revenue Bridge & Gross Margins
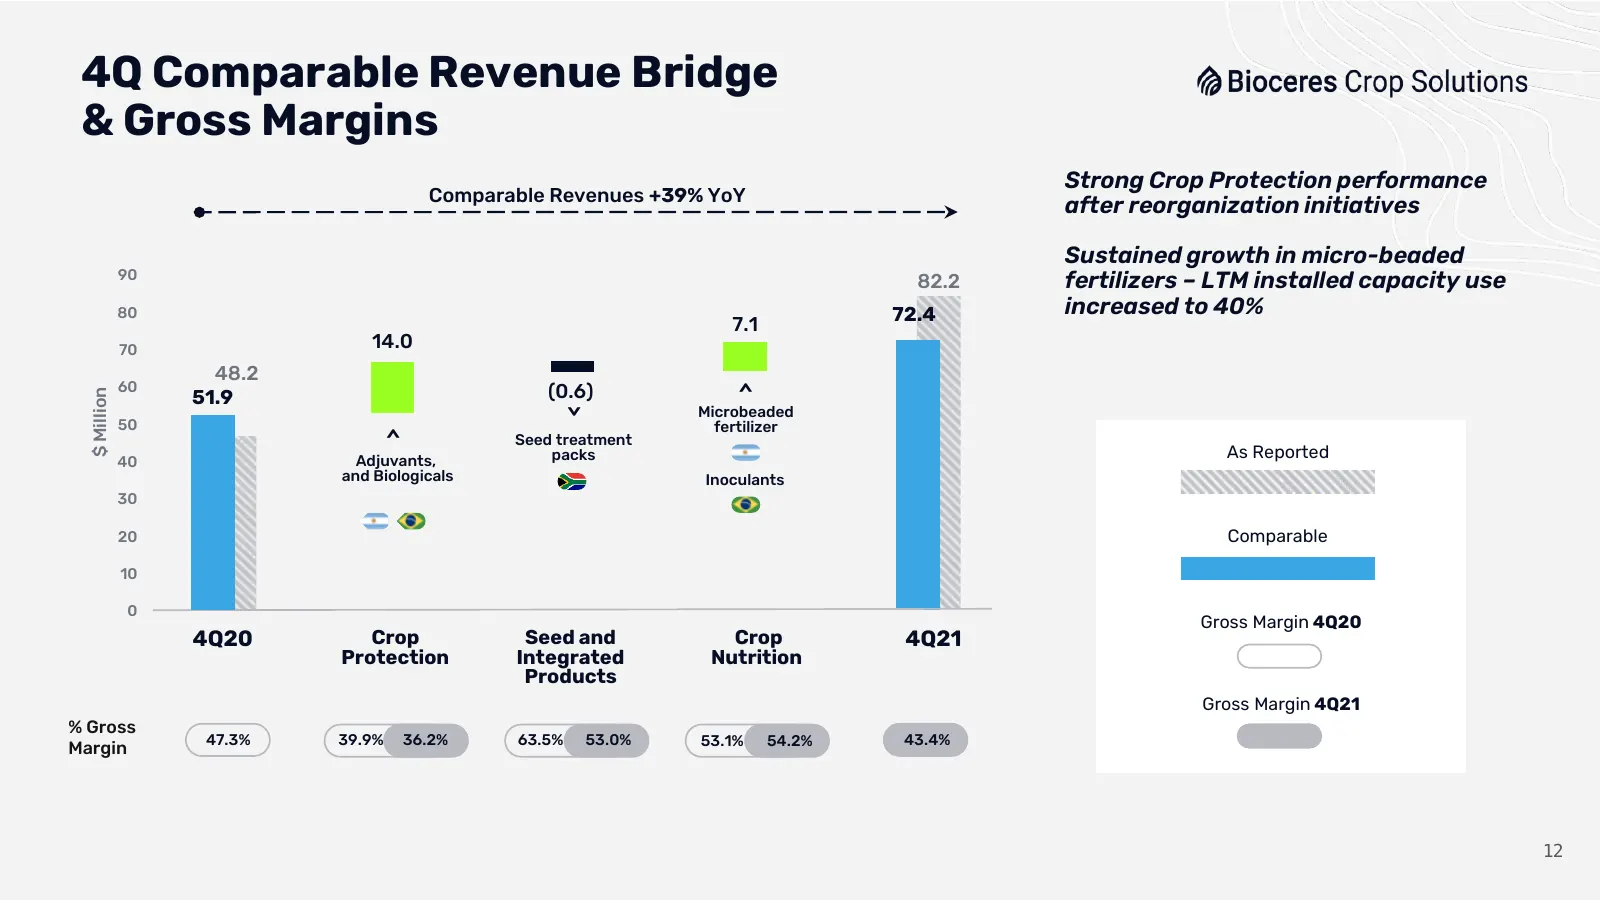
4Q Comparable Revenue Bridge & Gross Margins Strong Crop Protection performance Comparable Revenues +39% YoY after reorganization initiatives Sustained growth in micro-beaded 90 82.2 fertilizers – LTM installed capacity use 80 72.4 increased to 40% 7.1 70 14.0 48.2 60 (0.6) > 51.9 $ Million Microbea
Slide 13: 4Q Comparable Gross Profit Contribution per segment
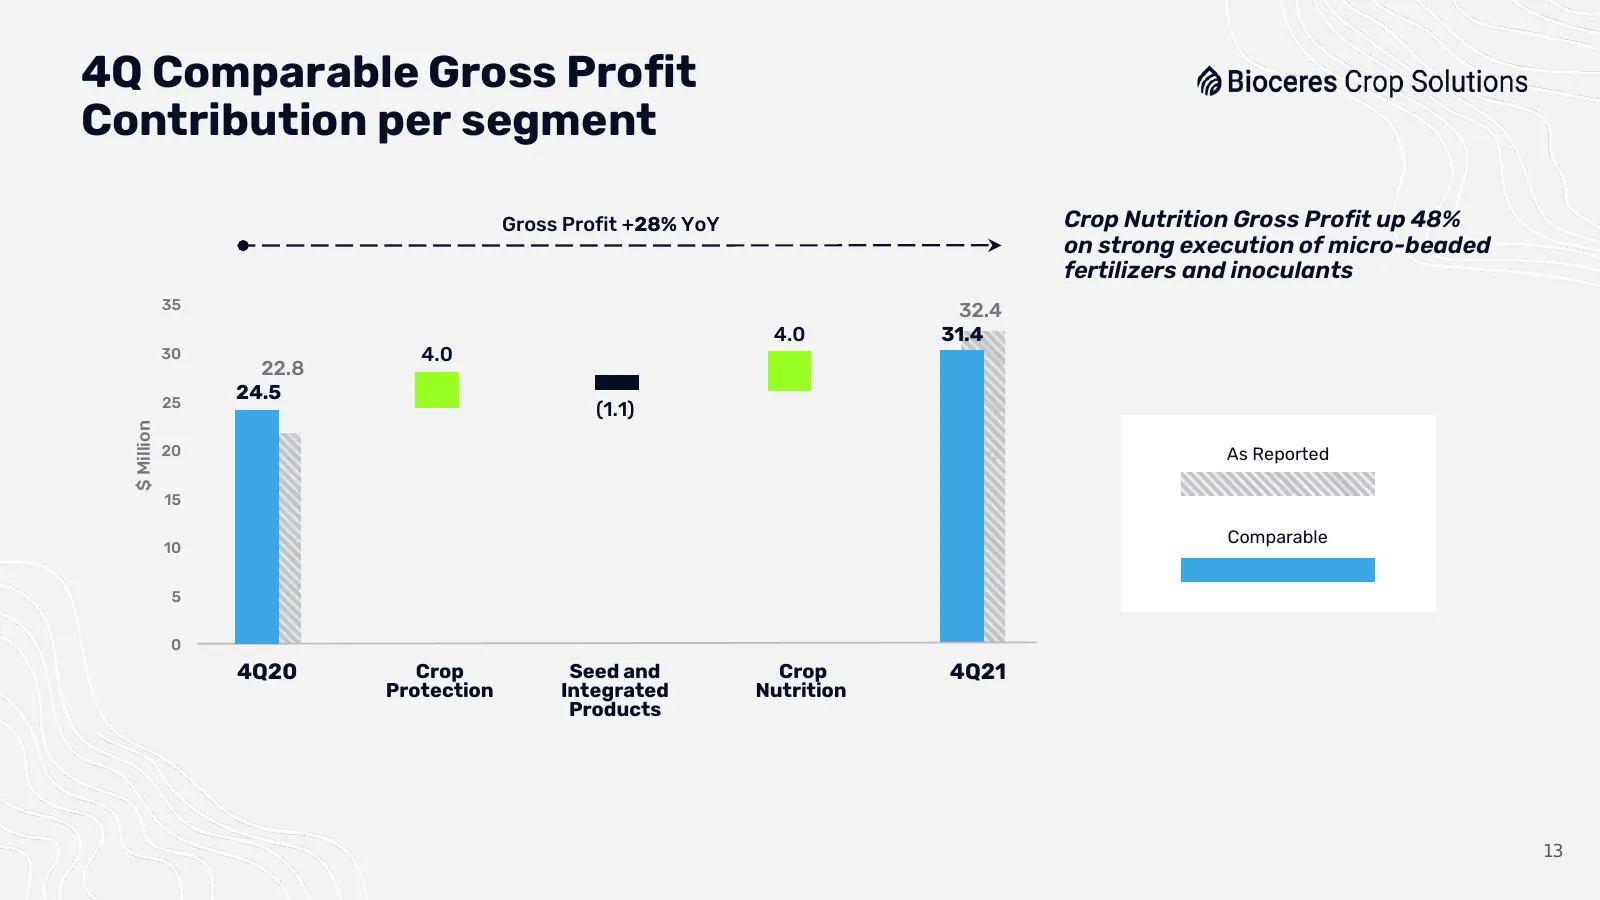
4Q Comparable Gross Profit Contribution per segment Gross Profit +28% YoY Crop Nutrition Gross Profit up 48% on strong execution of micro-beaded fertilizers and inoculants 35 32.4 4.0 31.4 30 4.0 22.8 25 24.5 (1.1) $ Million 20 As Reported 15 Comparable 10 5 0 4Q20 Crop Seed and Crop 4Q21 Protection
Slide 14: 4Q Adjusted EBITDA & Margin
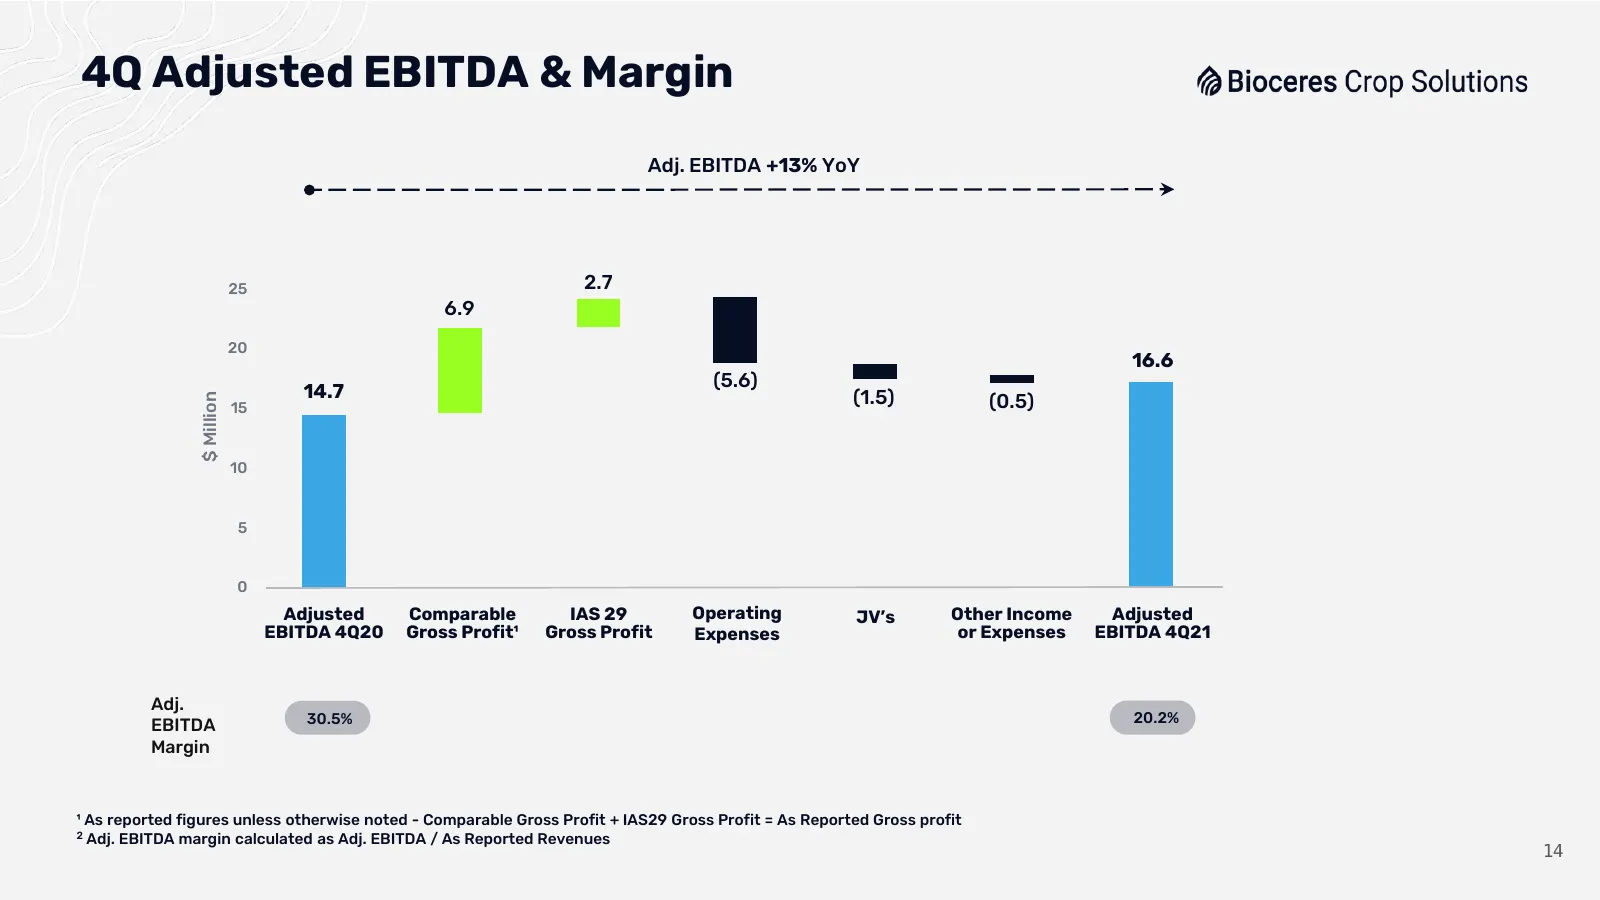
4Q Adjusted EBITDA & Margin Adj. EBITDA +13% YoY 25 2.7 6.9 20 16.6 (5.6) 14.7 (1.5) (0.5) $ Million 15 10 5 0 Adjusted Comparable IAS 29 Operating JV’s Other Income Adjusted EBITDA 4Q20 Gross Profit¹ Gross Profit Expenses or Expenses EBITDA 4Q21 Adj. 30.5% 20.2% EBITDA Margin ¹ As reported figures
Slide 15: FY21 Adjusted EBITDA & Margin
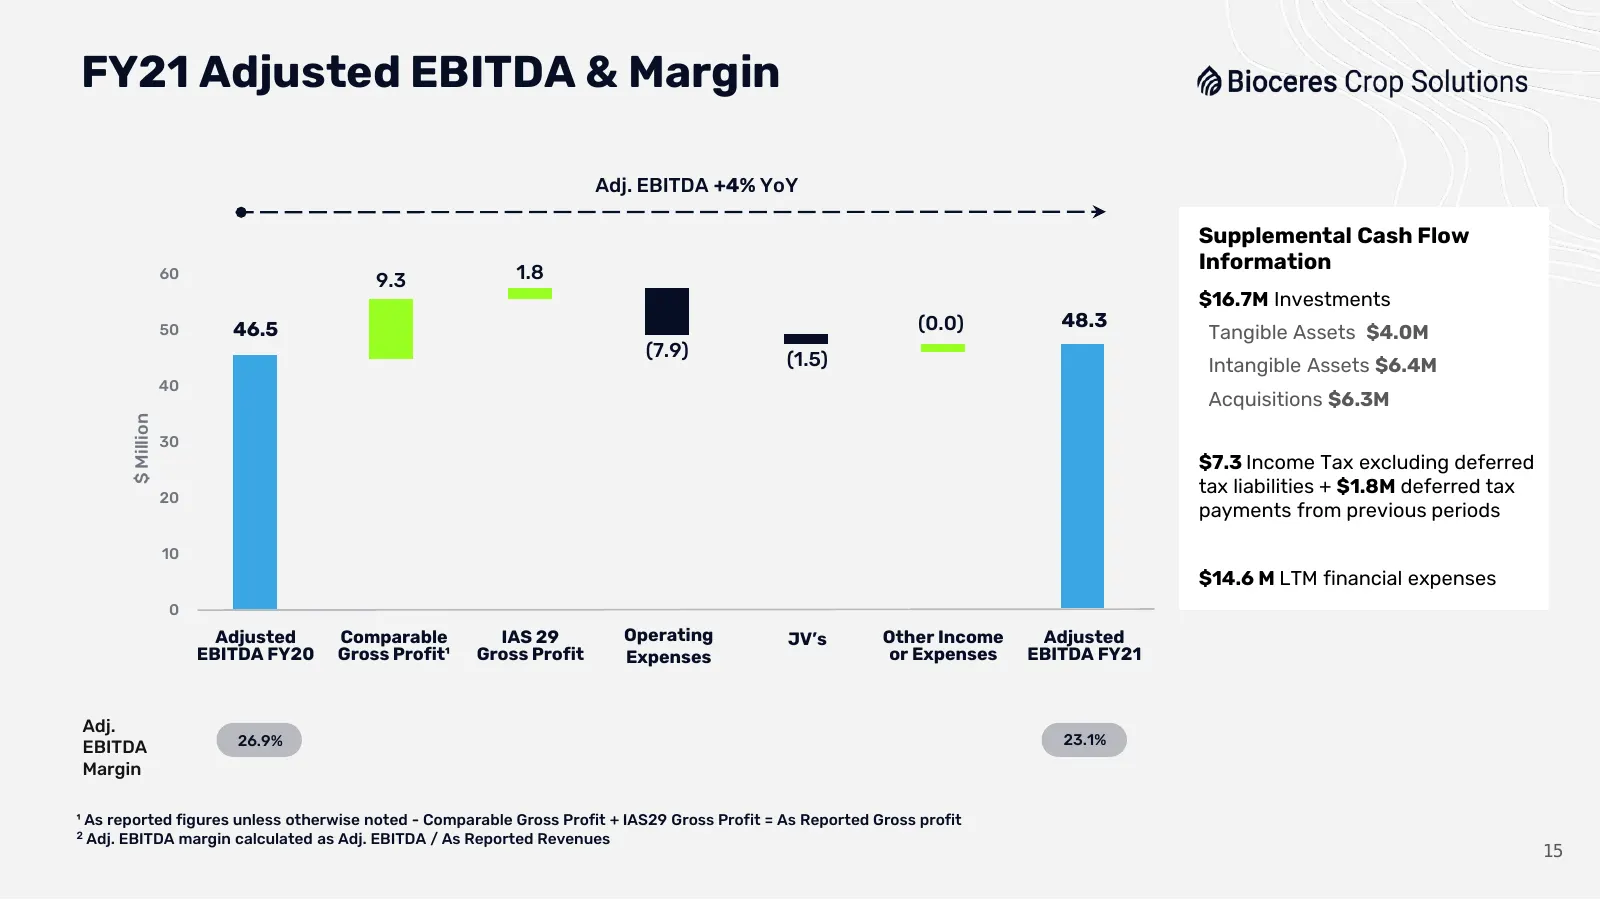
FY21 Adjusted EBITDA & Margin Adj. EBITDA +4% YoY Supplemental Cash Flow 60 1.8 Information 9.3 $16.7M Investments 46.5 (0.0) 48.3 50 Tangible Assets $4.0M (7.9) (1.5) Intangible Assets $6.4M 40 Acquisitions $6.3M $ Million 30 $7.3 Income Tax excluding deferred 20 tax liabilities + $1.8M deferred ta
Slide 16: Balance Sheet and Cash Position
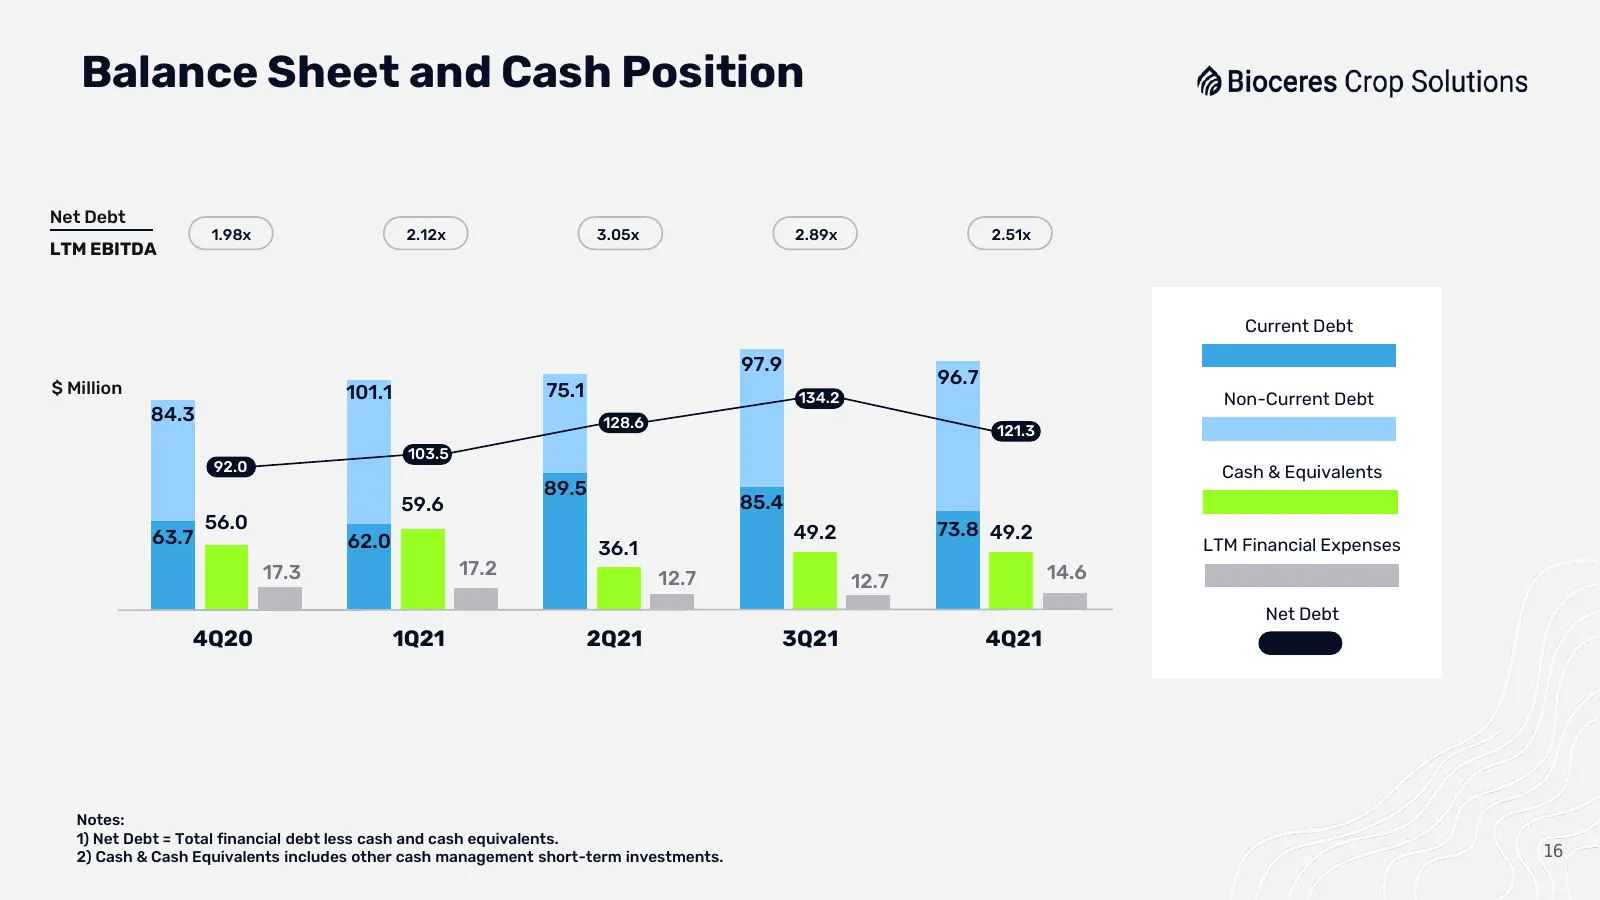
Balance Sheet and Cash Position Net Debt 1.98x 2.12x 3.05x 2.89x 2.51x LTM EBITDA Current Debt 97.9 96.7 $ Million 101.1 75.1 134.2 Non-Current Debt 84.3 128.6 121.3 103.5 92.0 Cash & Equivalents 89.5 59.6 85.4 56.0 73.8 49.2 63.7 62.0 49.2 36.1 LTM Financial Expenses 17.3 17.2 14.6 12.7 12.7 Net De
Slide 17: Full-Year Review
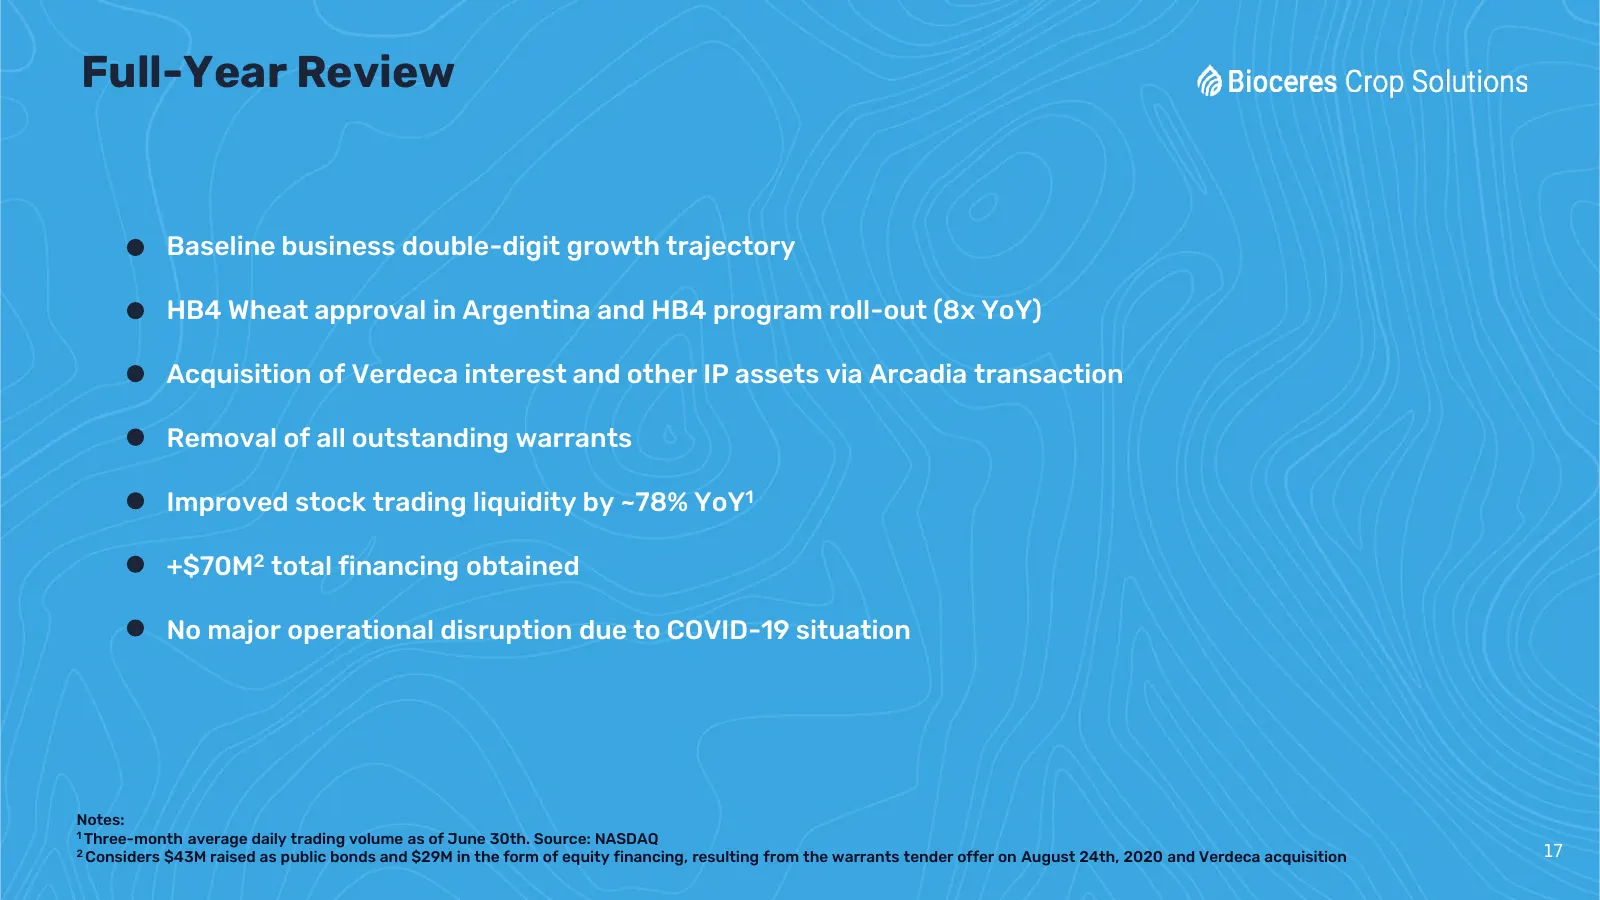
Full-Year Review Baseline business double-digit growth trajectory HB4 Wheat approval in Argentina and HB4 program roll-out (8x YoY) Acquisition of Verdeca interest and other IP assets via Arcadia transaction Removal of all outstanding warrants Improved stock trading liquidity by ~78% YoY1 +$70M2 tot
Slide 18: Coming Next
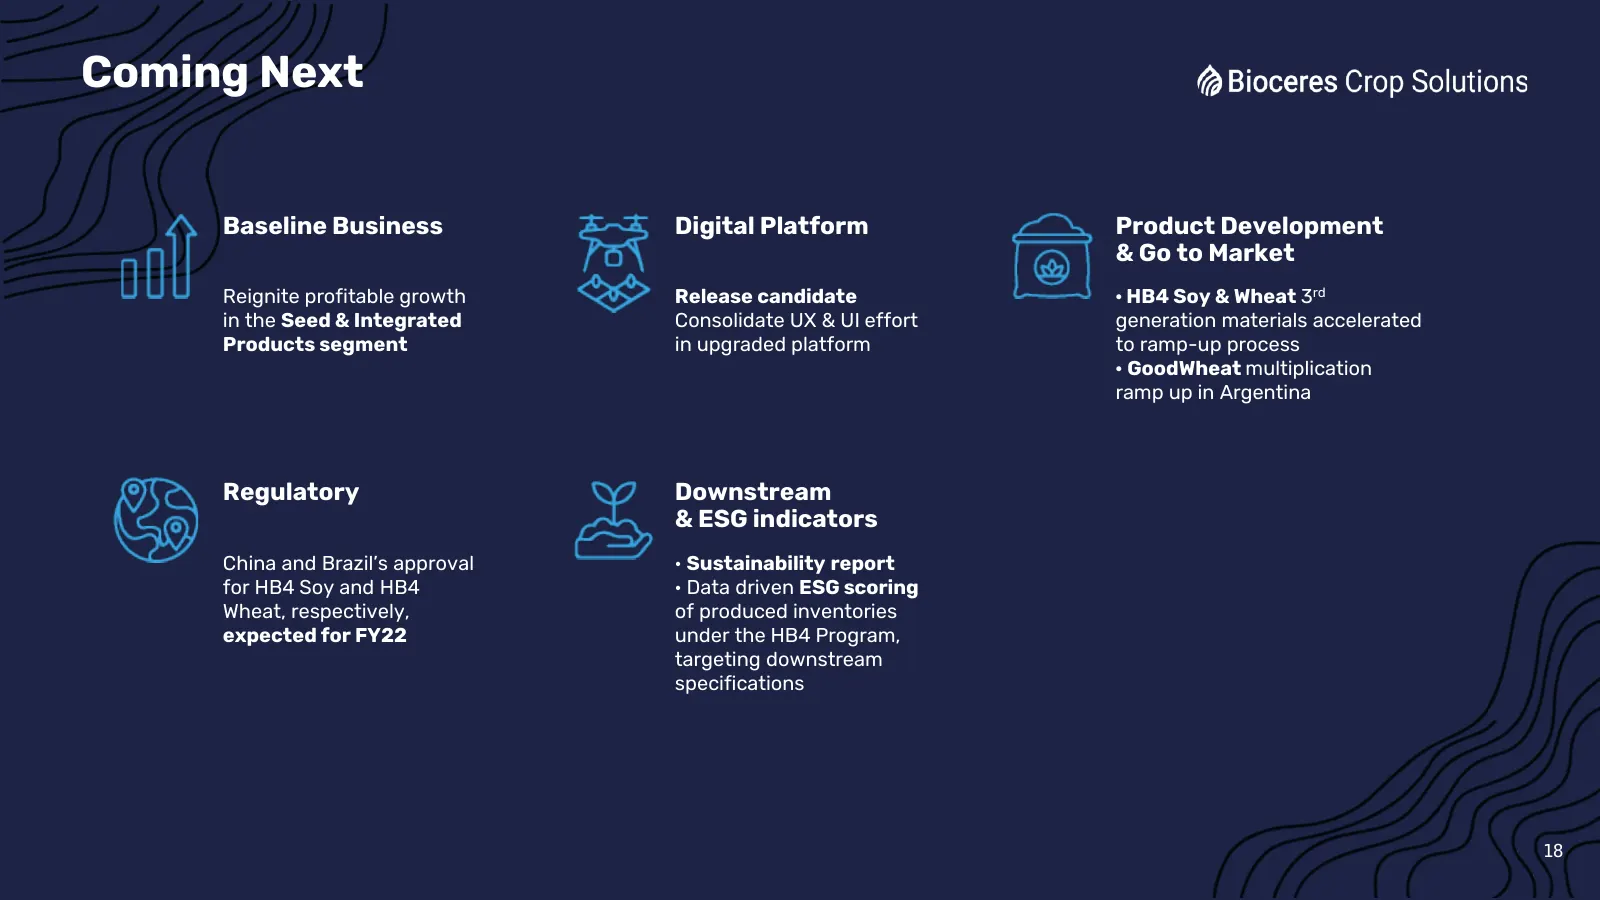
Coming Next Baseline Business Digital Platform Product Development & Go to Market Reignite profitable growth Release candidate · HB4 Soy & Wheat 3rd in the Seed & Integrated Consolidate UX & UI effort generation materials accelerated Products segment in upgraded platform to ramp-up process · GoodWhe
Slide 19: Exhibits
“@ Bioceres Crop Solutions
Slide 20: FY21 HB4 Program Snapshot
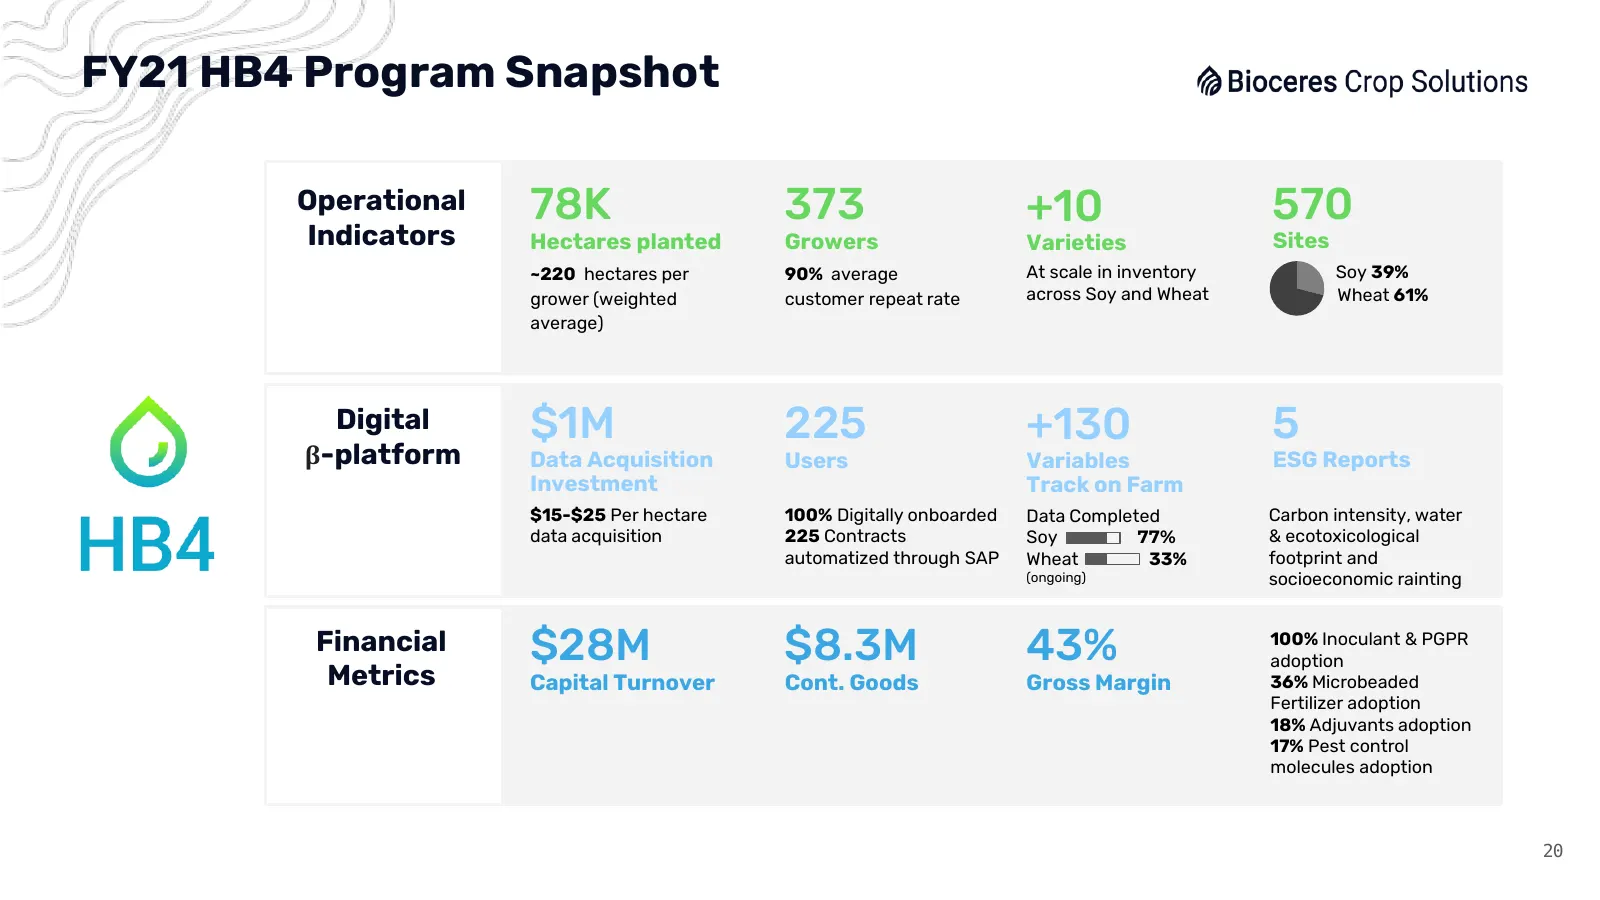
FY21 HB4 Program Snapshot Operational 78K 373 +10 570 Indicators Hectares planted Growers Varieties Sites ~220 hectares per 90% average At scale in inventory Soy 39% grower (weighted customer repeat rate across Soy and Wheat Wheat 61% average) Digital $1M 225 +130 5 β-platform Data Acquisition Users
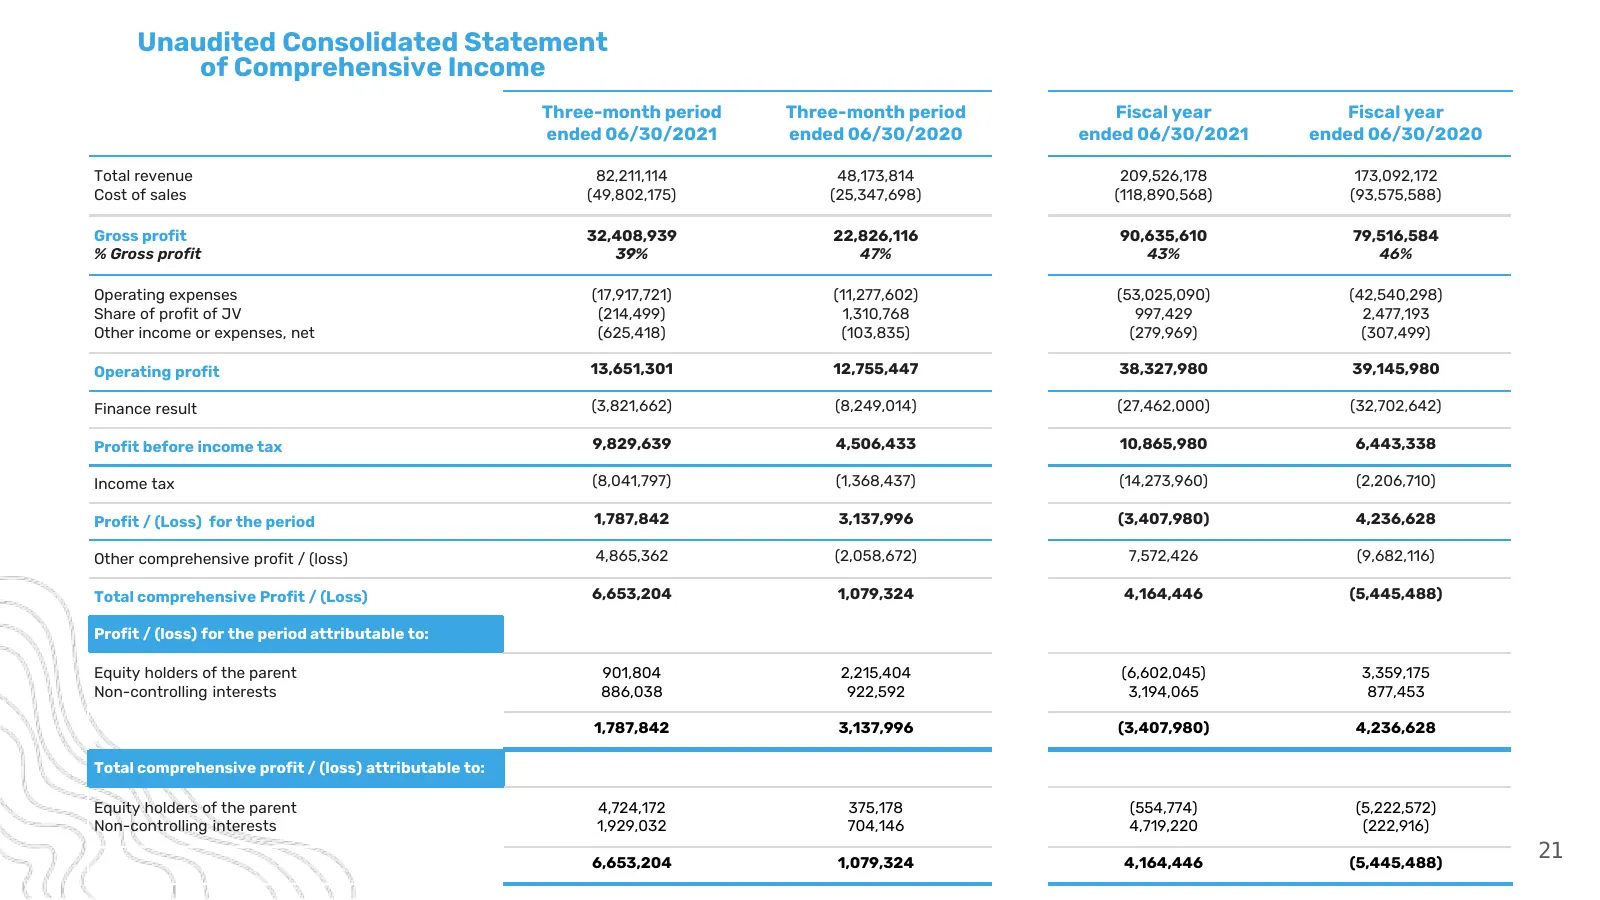
Slide 21: Unaudited Consolidated Statement of Comprehensive Income
Unaudited Consolidated Statement of Comprehensive Income Three-month period Three-month period Fiscal year Fiscal year ended 06/30/2021 ended 06/30/2020 ended 06/30/2021 ended 06/30/2020 Total revenue 82,211,114 48,173,814 209,526,178 173,092,172 Cost of sales (49,802,175) (25,347,698) (118,890,568)
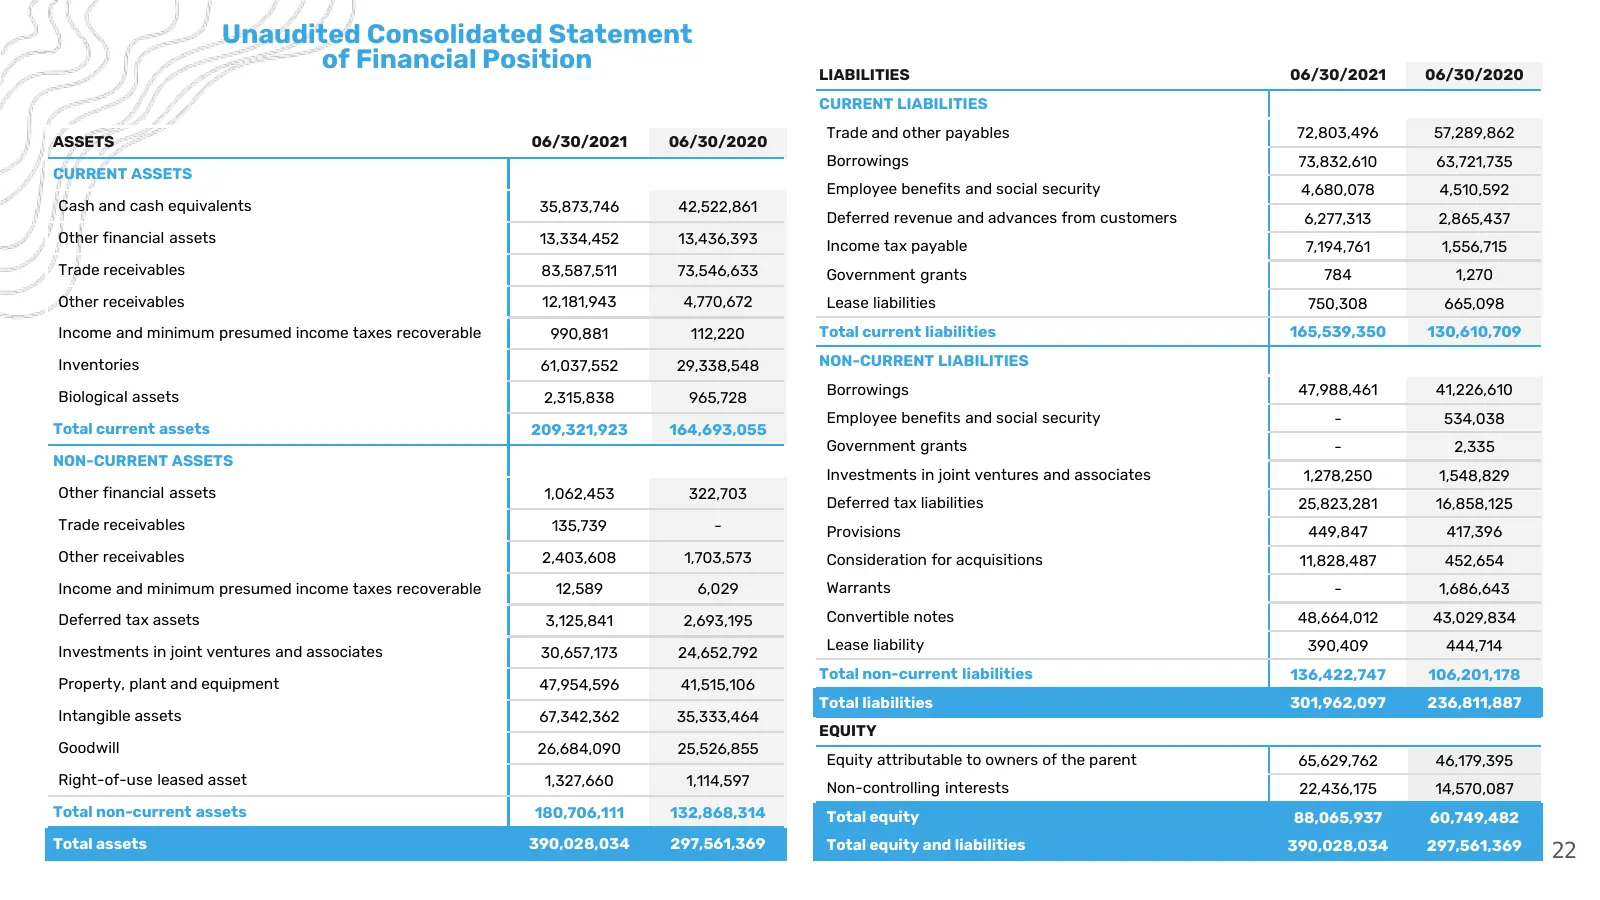
Slide 22: Unaudited Consolidated Statement of Financial Position
Unaudited Consolidated Statement of Financial Position LIABILITIES 06/30/2021 06/30/2020 CURRENT LIABILITIES Trade and other payables 72,803,496 57,289,862 ASSETS 06/30/2021 06/30/2020 Borrowings 73,832,610 63,721,735 CURRENT ASSETS Employee benefits and social security 4,680,078 4,510,592 Cash and

Slide 23: Contact Us
Contact Us Investor Relations Investorrelations@biocerescrops.com (54) 0341 4861100 Investors.biocerescrops.com 23
Source: Internet Archive copy of s26.q4cdn.com
More decks from Bioceres Crop Solutions Corp.
 Q4 2026 Earnings Presentation17 slides · Sep 15, 2026
 Q3 2026 Earnings Presentation16 slides · May 12, 2026
 Q1 2026 Earnings Presentation13 slides · Nov 13, 2025
 Q4 2025 Earnings Presentation16 slides · Sep 9, 2025
 Q3 2025 Earnings Presentation18 slides · May 21, 2025
 Q2 2025 Earnings Presentation20 slides · Feb 12, 2025