Scatec ASA · OSL:SCATC
Scatec ASA — Q2 2022 Earnings Presentation
21 slides from Scatec ASA's earnings presentation, Nov 12, 2022
Slide 1: Stable operations and ramping up for construction
Second quarter 2022 Stable operations and ramping up for construction CEO, Terje Pilskog & CFO, Mikkel Tørud
Slide 2: Disclaimer
Disclaimer The following presentation is being made only to, and is only directed at, persons to whom such presentation may lawfully be communicated (’relevant persons’). Any person who is not a relevant person should not rely, act or make assessment on the basis of this presentation or anything inc
Slide 3: Stable operations and ramping up for construction
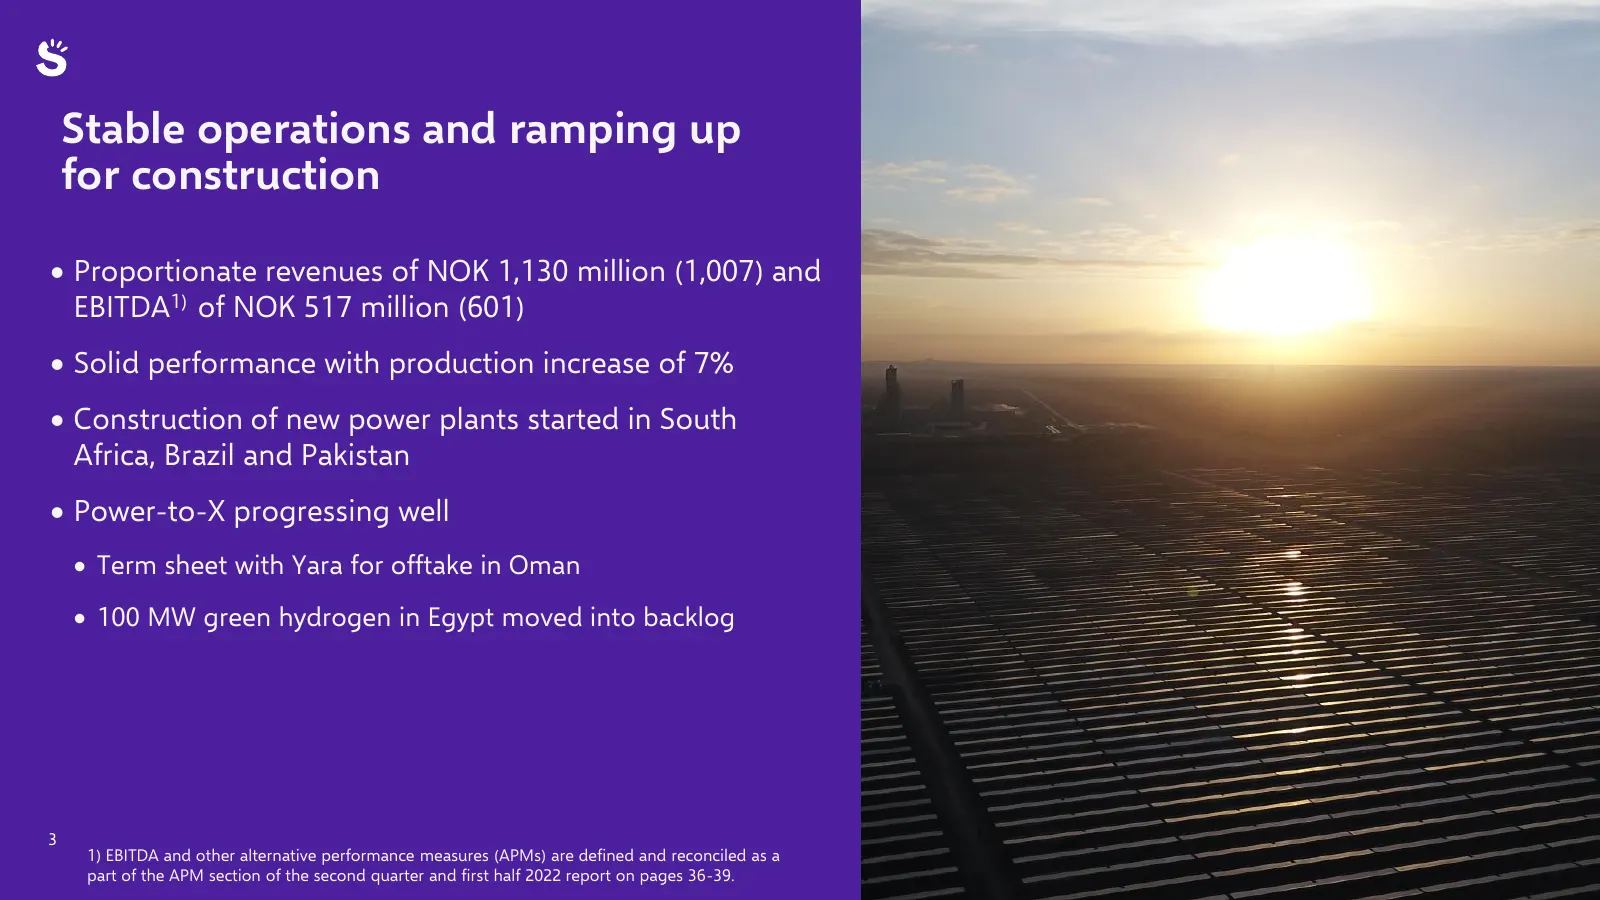
Stable operations and ramping up for construction • Proportionate revenues of NOK 1,130 million (1,007) and EBITDA1) of NOK 517 million (601) • Solid performance with production increase of 7% • Construction of new power plants started in South Africa, Brazil and Pakistan • Power-to-X progressing we
Slide 4: Solid operating performance from a diversified portfolio of plants
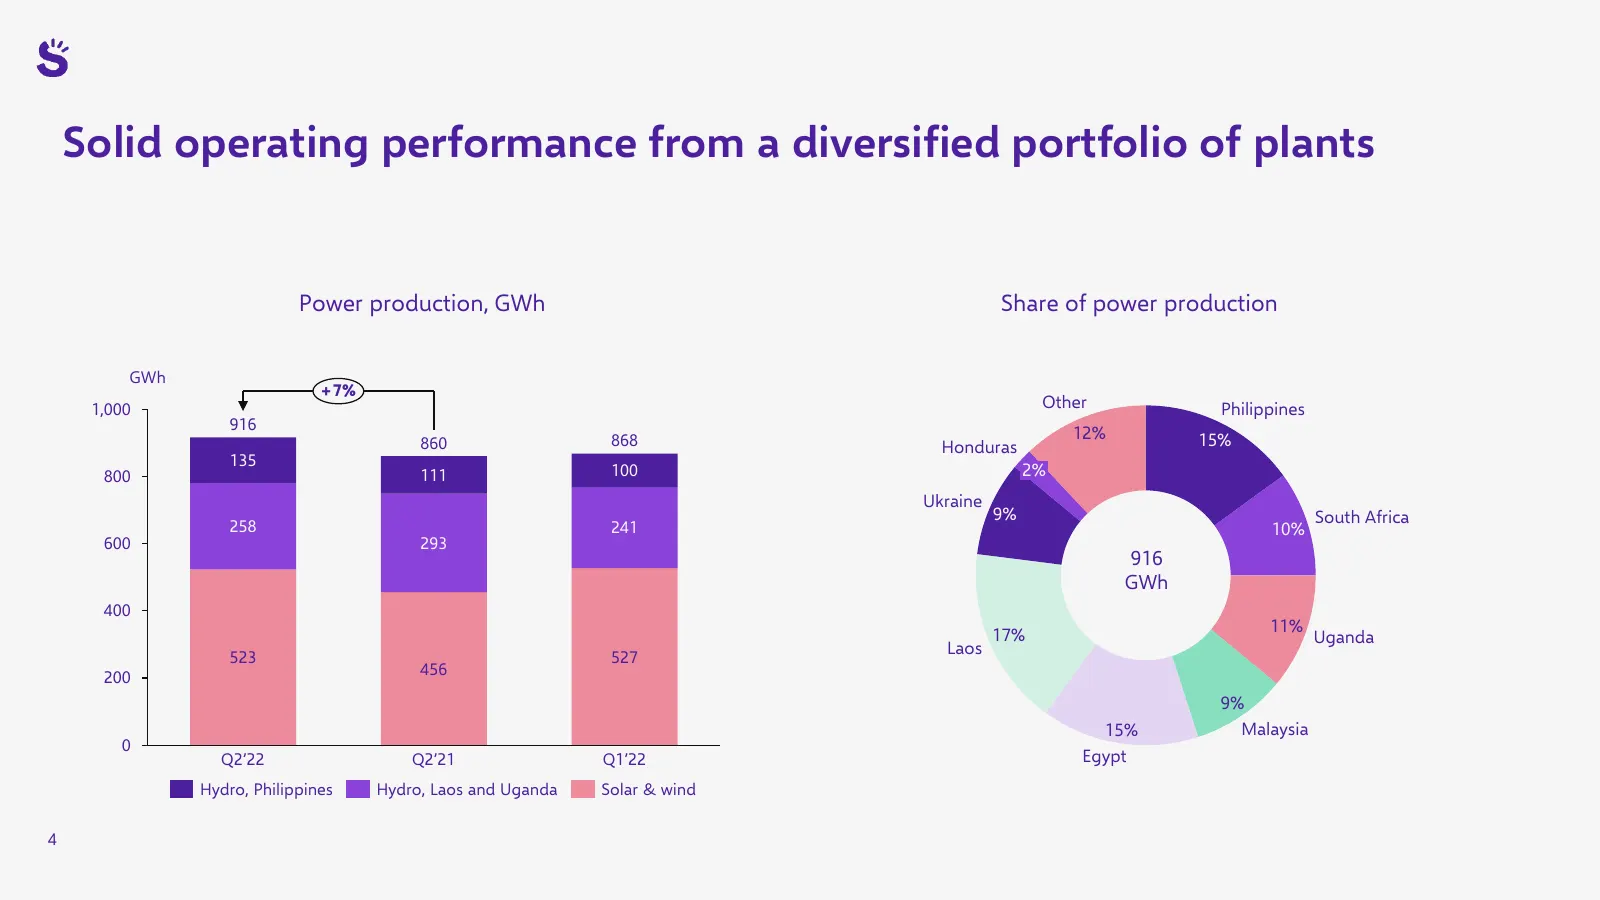
Solid operating performance from a diversified portfolio of plants Power production, GWh Share of power production GWh +7% 1,000 Other Philippines 916 868 12% 15% 860 Honduras 135 800 111 100 2% Ukraine 9% South Africa 258 241 10% 600 293 916 GWh 400 17% 11% Uganda 527 Laos 523 456 200 9% 15% Malays
Slide 5: Ramping up construction based on proven operating systems
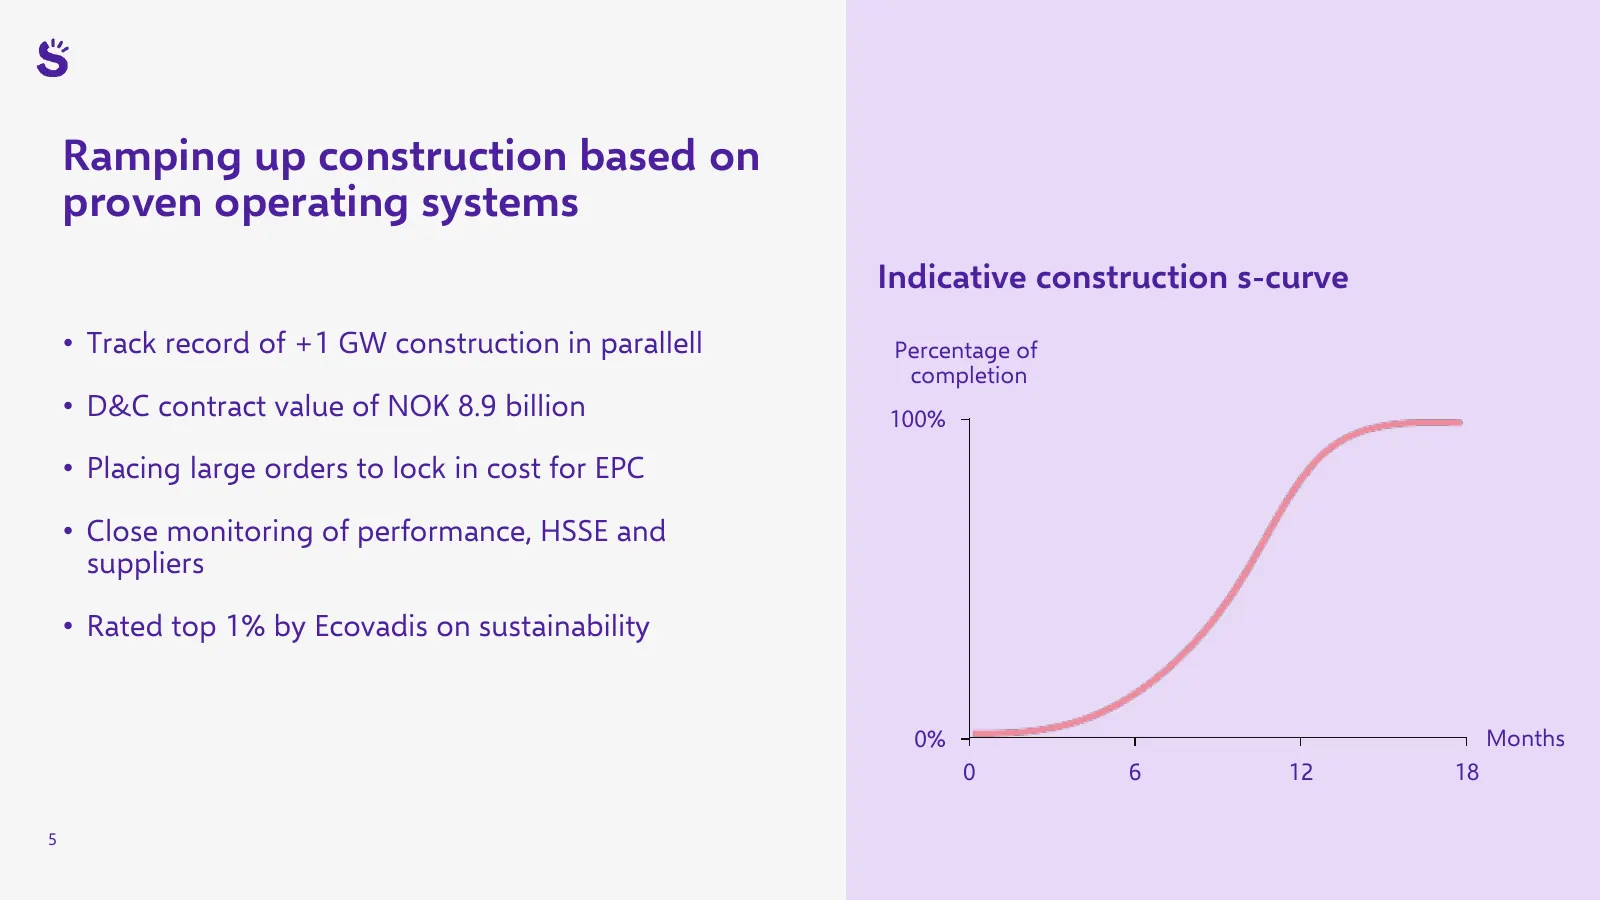
Ramping up construction based on proven operating systems Indicative construction s-curve • Track record of +1 GW construction in parallell Percentage of completion • D&C contract value of NOK 8.9 billion 100% • Placing large orders to lock in cost for EPC • Close monitoring of performance, HSSE and
Slide 6: South Africa: RMIPPPP starting construction
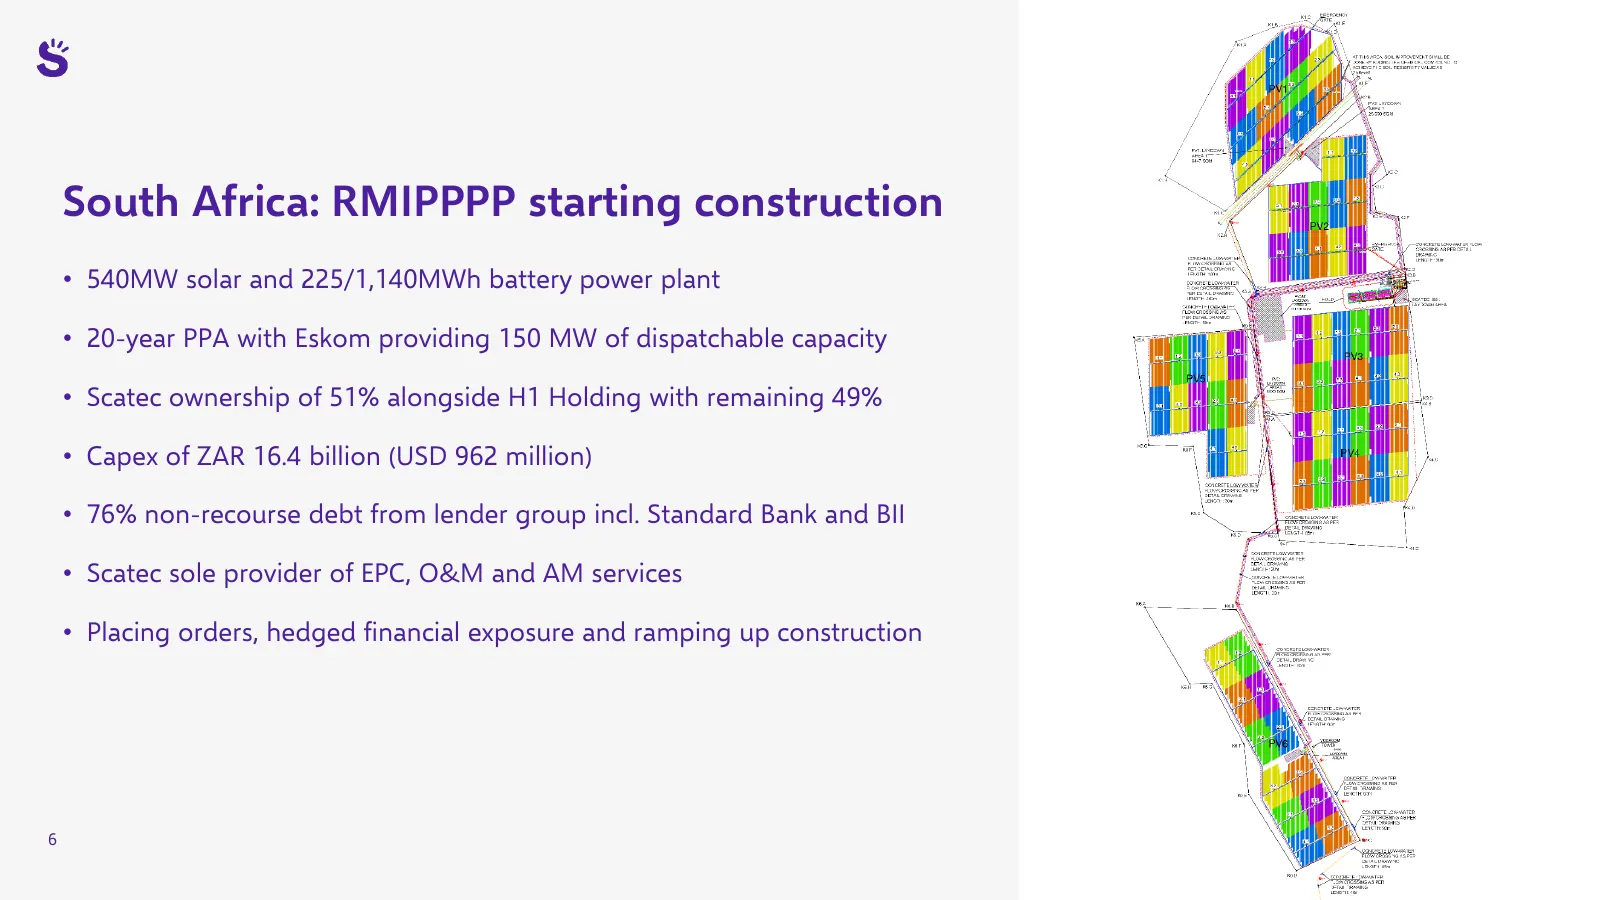
South Africa: RMIPPPP starting construction • 540MW solar and 225/1,140MWh battery power plant • 20-year PPA with Eskom providing 150 MW of dispatchable capacity • Scatec ownership of 51% alongside H1 Holding with remaining 49% • Capex of ZAR 16.4 billion (USD 962 million) • 76% non-recourse debt fr
Slide 7: Brazil: Mendubim starting construction
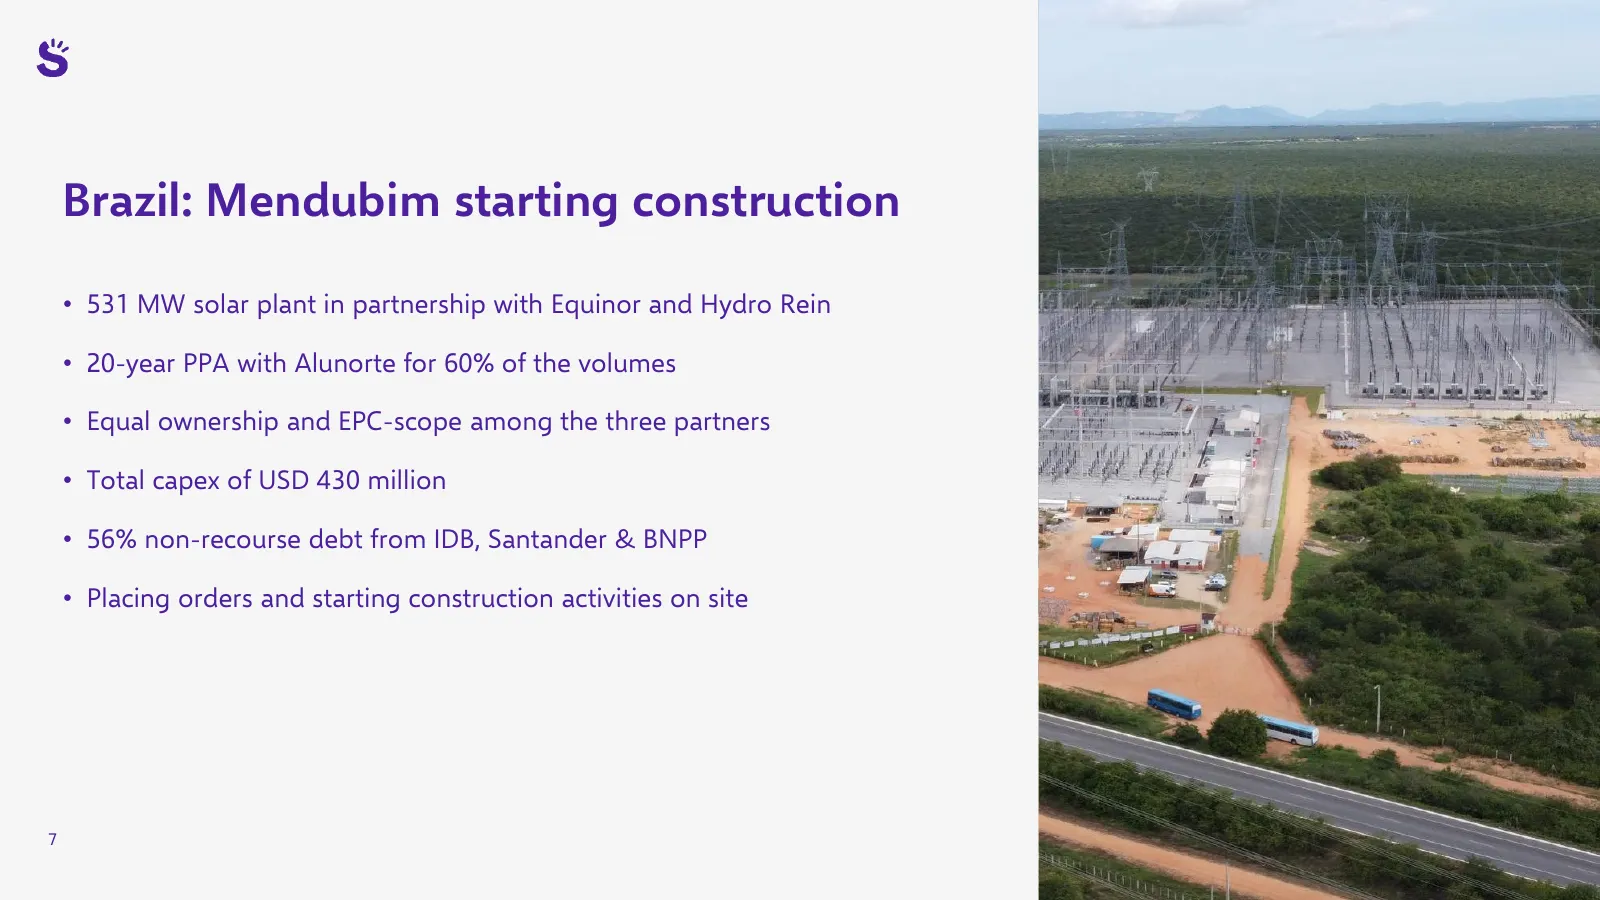
Brazil: Mendubim starting construction • 531 MW solar plant in partnership with Equinor and Hydro Rein • 20-year PPA with Alunorte for 60% of the volumes • Equal ownership and EPC-scope among the three partners • Total capex of USD 430 million • 56% non-recourse debt from IDB, Santander & BNPP • Pla
Slide 8: Ramping up construction in Pakistan, Release progressing well in Cameroon
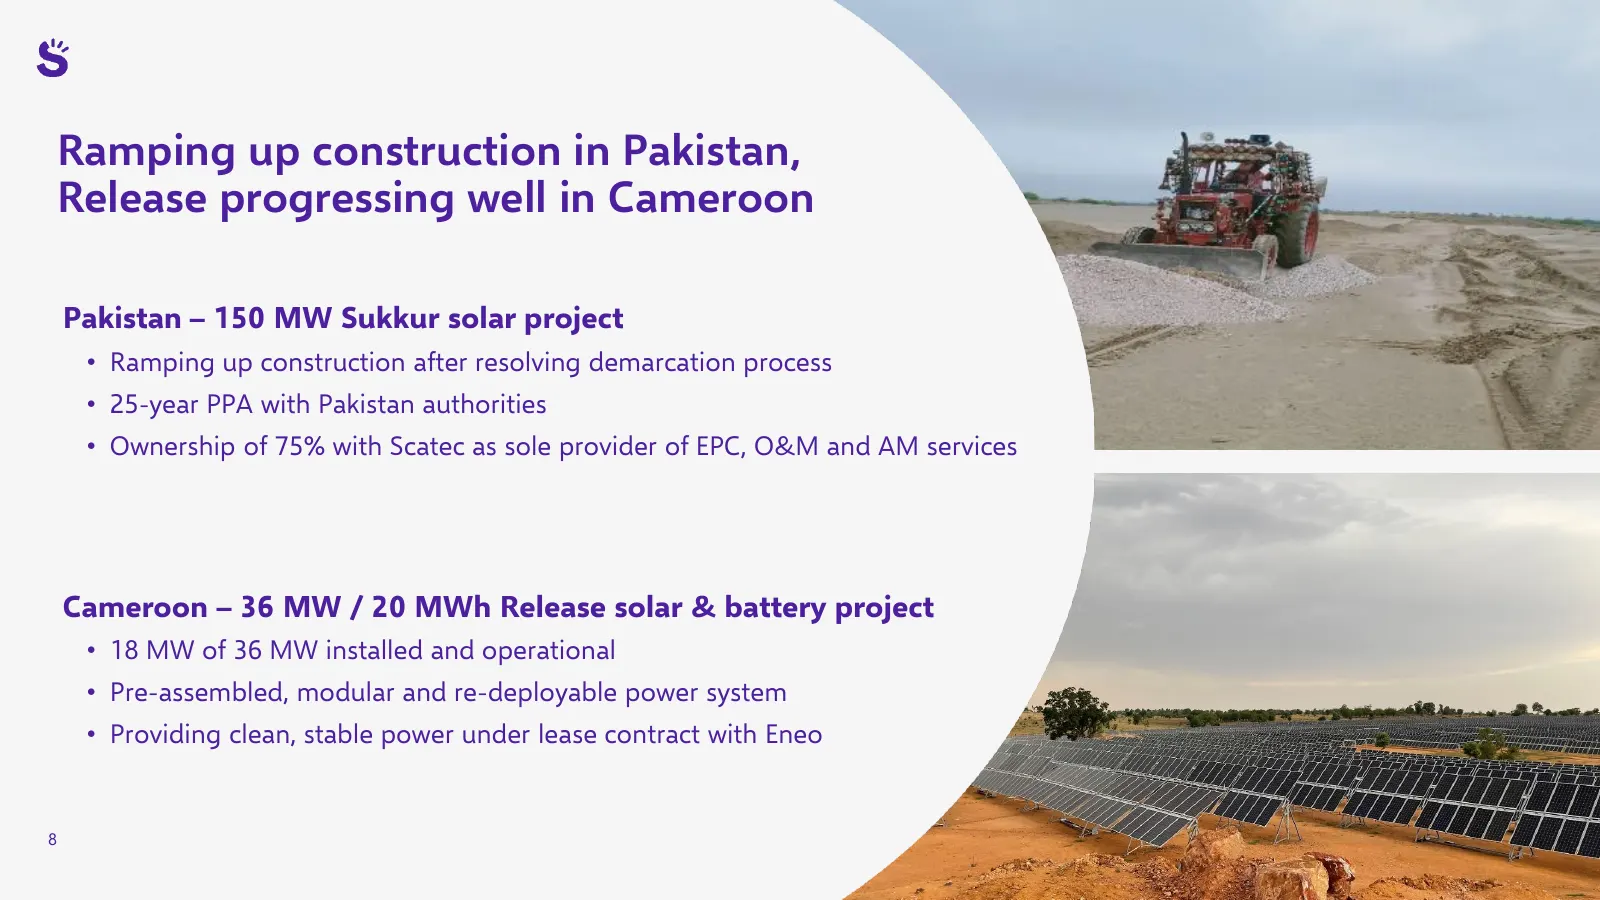
Ramping up construction in Pakistan, Release progressing well in Cameroon Pakistan – 150 MW Sukkur solar project • Ramping up construction after resolving demarcation process • 25-year PPA with Pakistan authorities • Ownership of 75% with Scatec as sole provider of EPC, O&M and AM services Cameroon
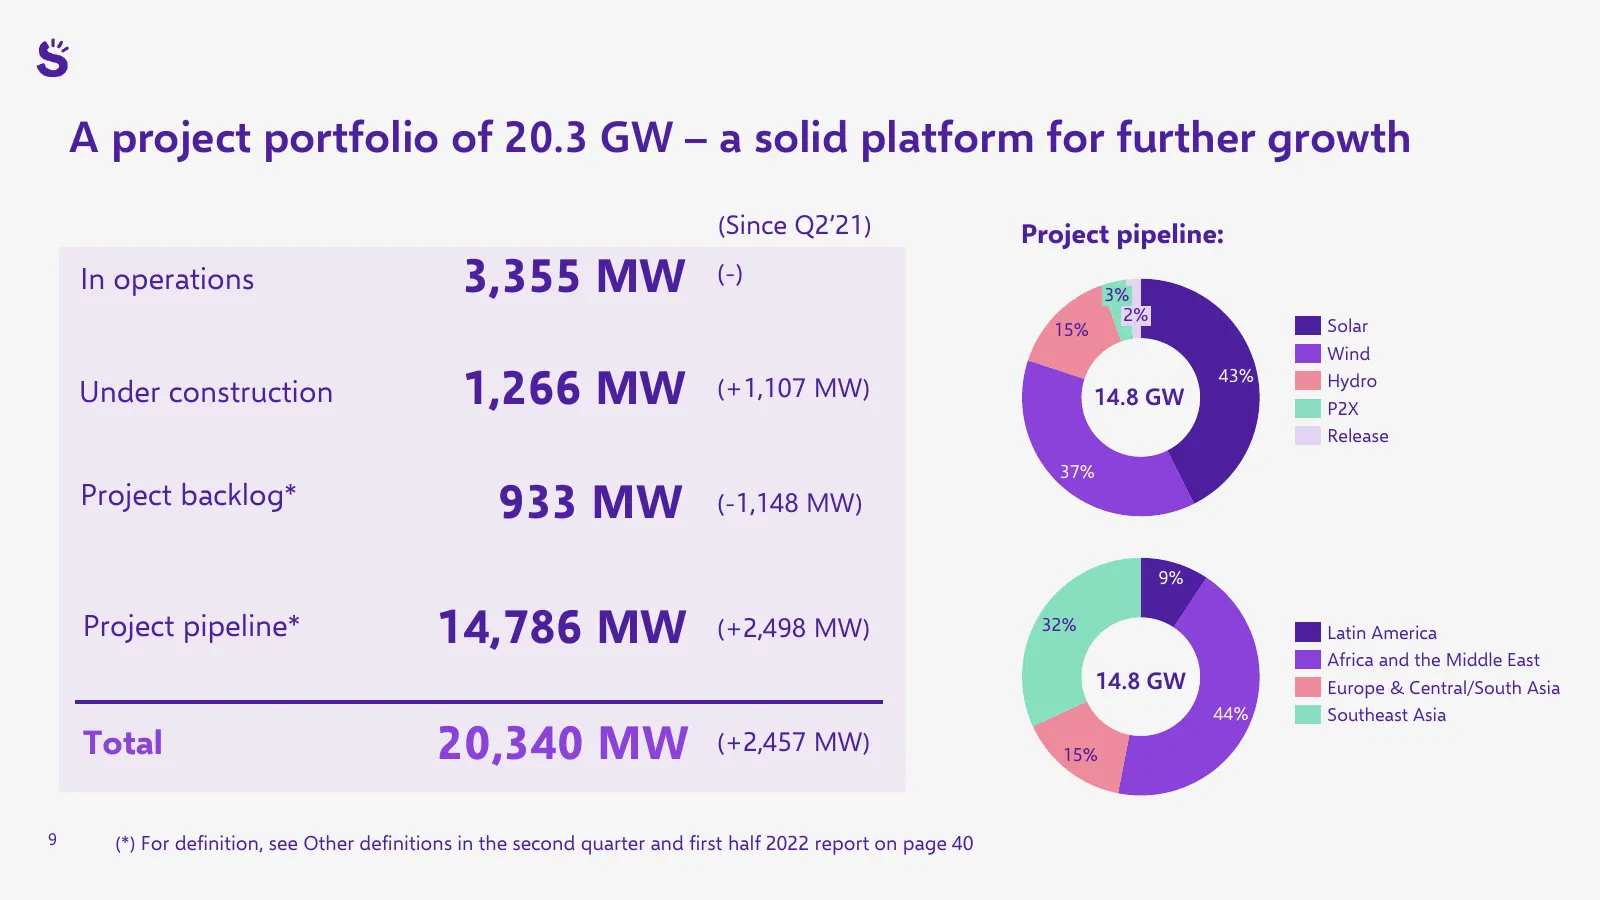
Slide 9: A project portfolio of 20.3 GW – a solid platform for further growth
A project portfolio of 20.3 GW – a solid platform for further growth (Since Q2’21) Project pipeline: In operations 3,355 MW (-) 3% 2% 15% Solar Wind Under construction 1,266 MW (+1,107 MW) 14.8 GW 43% Hydro P2X Release 37% Project backlog* 933 MW (-1,148 MW) 9% Project pipeline* 14,786 MW (+2,498 MW
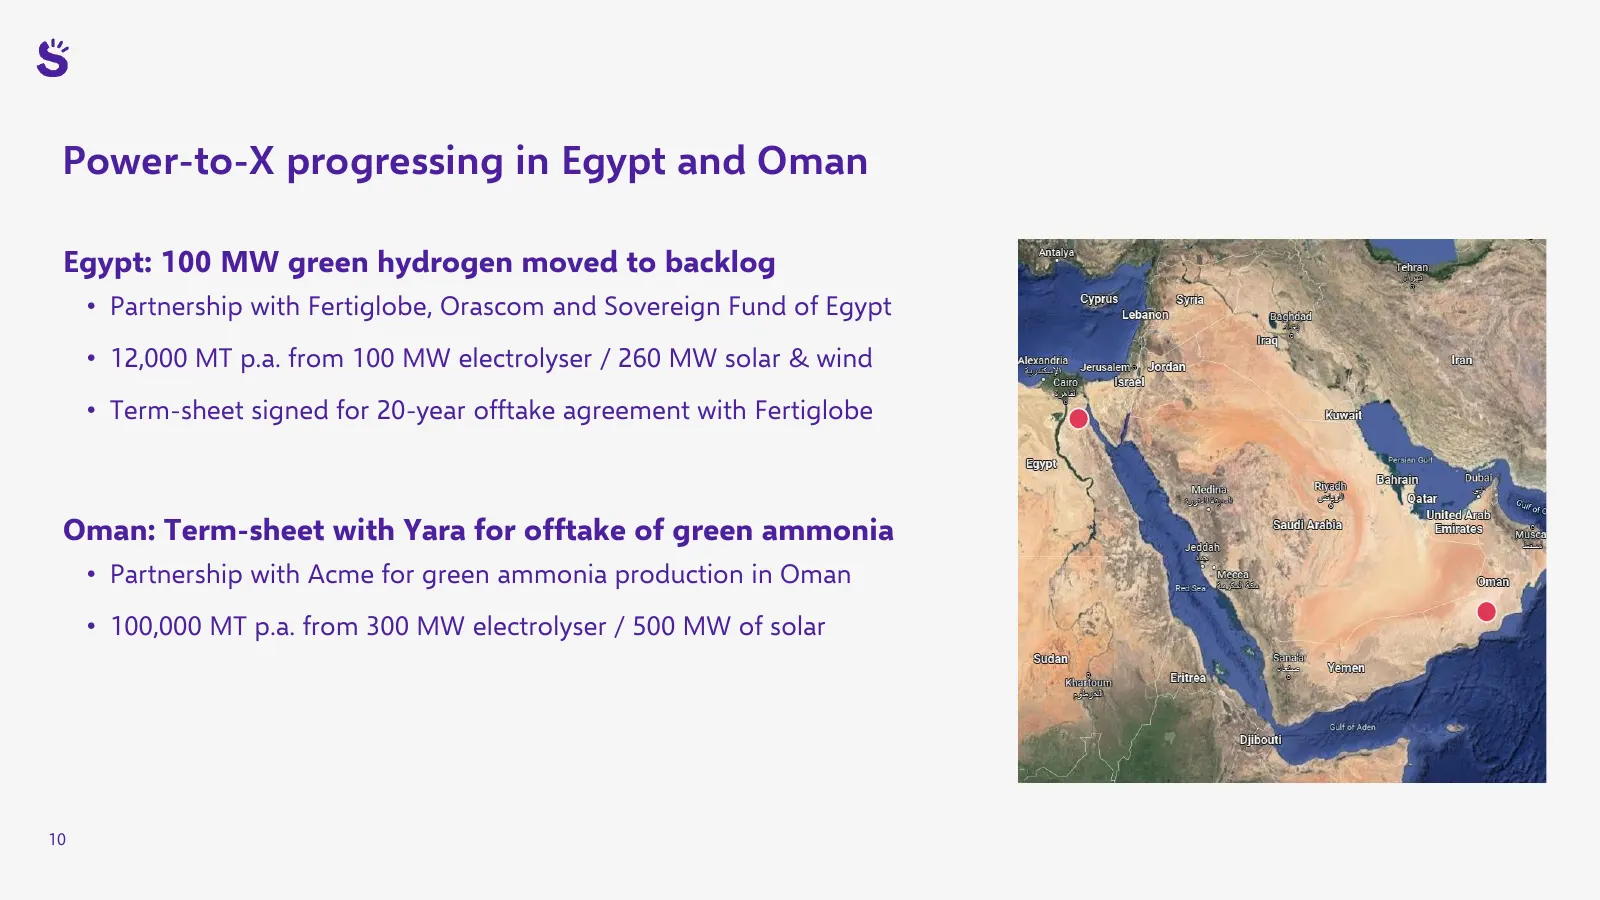
Slide 10: Power-to-X progressing in Egypt and Oman
Power-to-X progressing in Egypt and Oman Egypt: 100 MW green hydrogen moved to backlog • Partnership with Fertiglobe, Orascom and Sovereign Fund of Egypt • 12,000 MT p.a. from 100 MW electrolyser / 260 MW solar & wind • Term-sheet signed for 20-year offtake agreement with Fertiglobe Oman: Term-sheet
Slide 11: Key priorities next three months
Key priorities next three months • Ramp up of construction of new power plants in South Africa, Brazil and Pakistan • Optimise economics of project backlog • Continue to mature project pipeline • Capital Markets Update to be held on 29 September 2022 11

Slide 12: Financial review
Financial review Mikkel Tørud, CFO 12
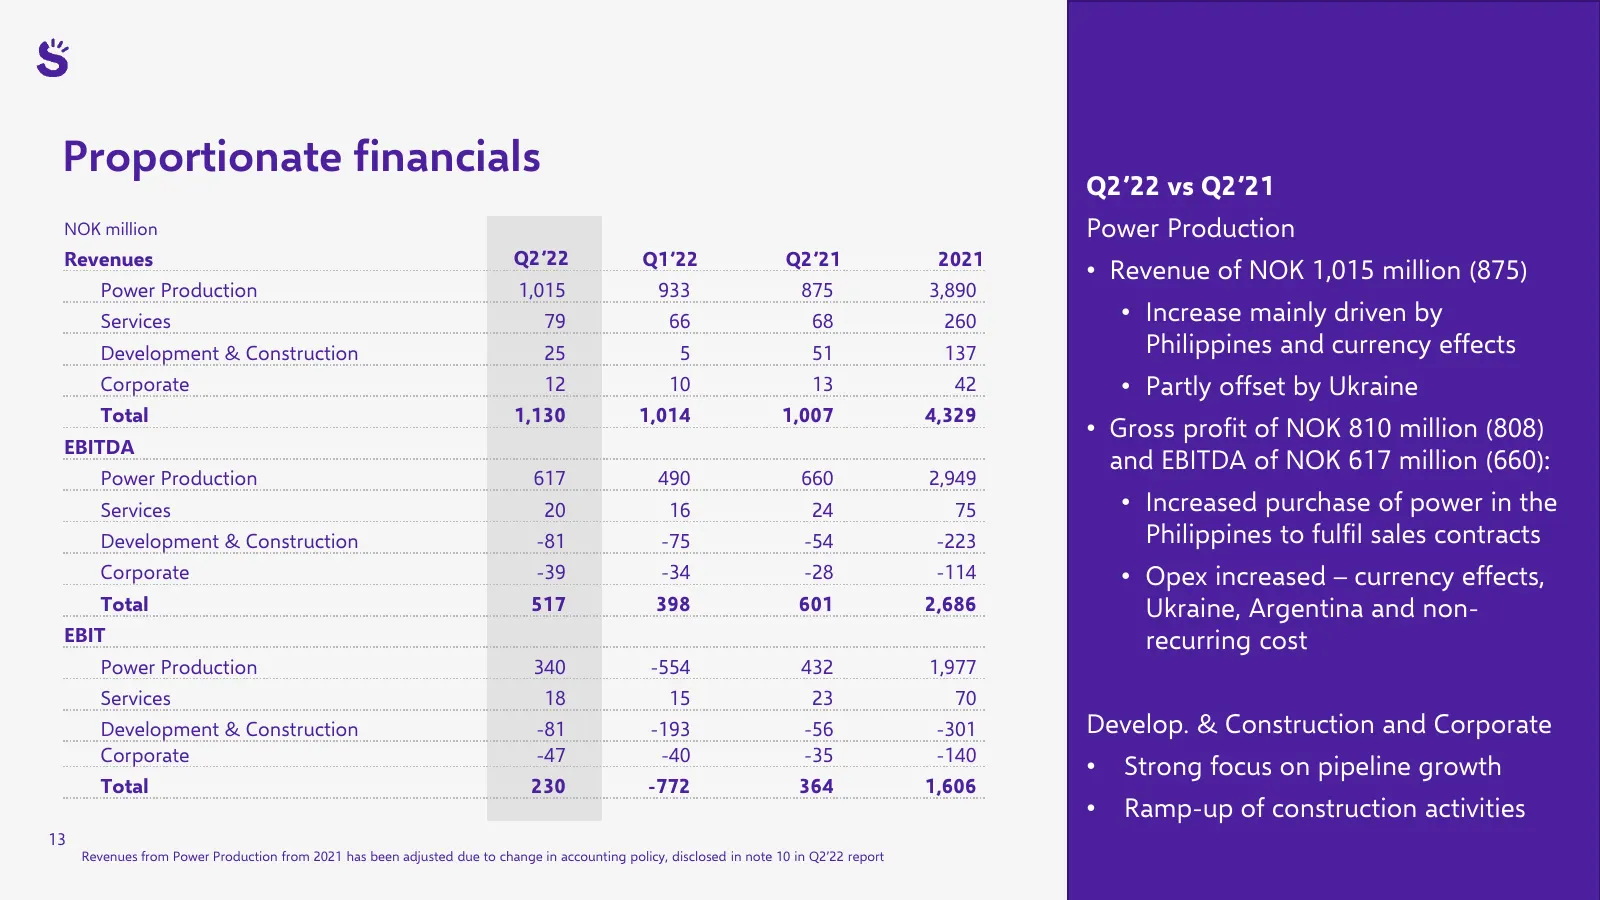
Slide 13: Proportionate financials
Proportionate financials Q2’22 vs Q2’21 NOK million Power Production Revenues Q2’22 Q1’22 Q2’21 2021 • Revenue of NOK 1,015 million (875) Power Production 1,015 933 875 3,890 Services 79 66 68 260 • Increase mainly driven by Development & Construction 25 5 51 137 Philippines and currency effects Cor
Slide 14: A solid financial position
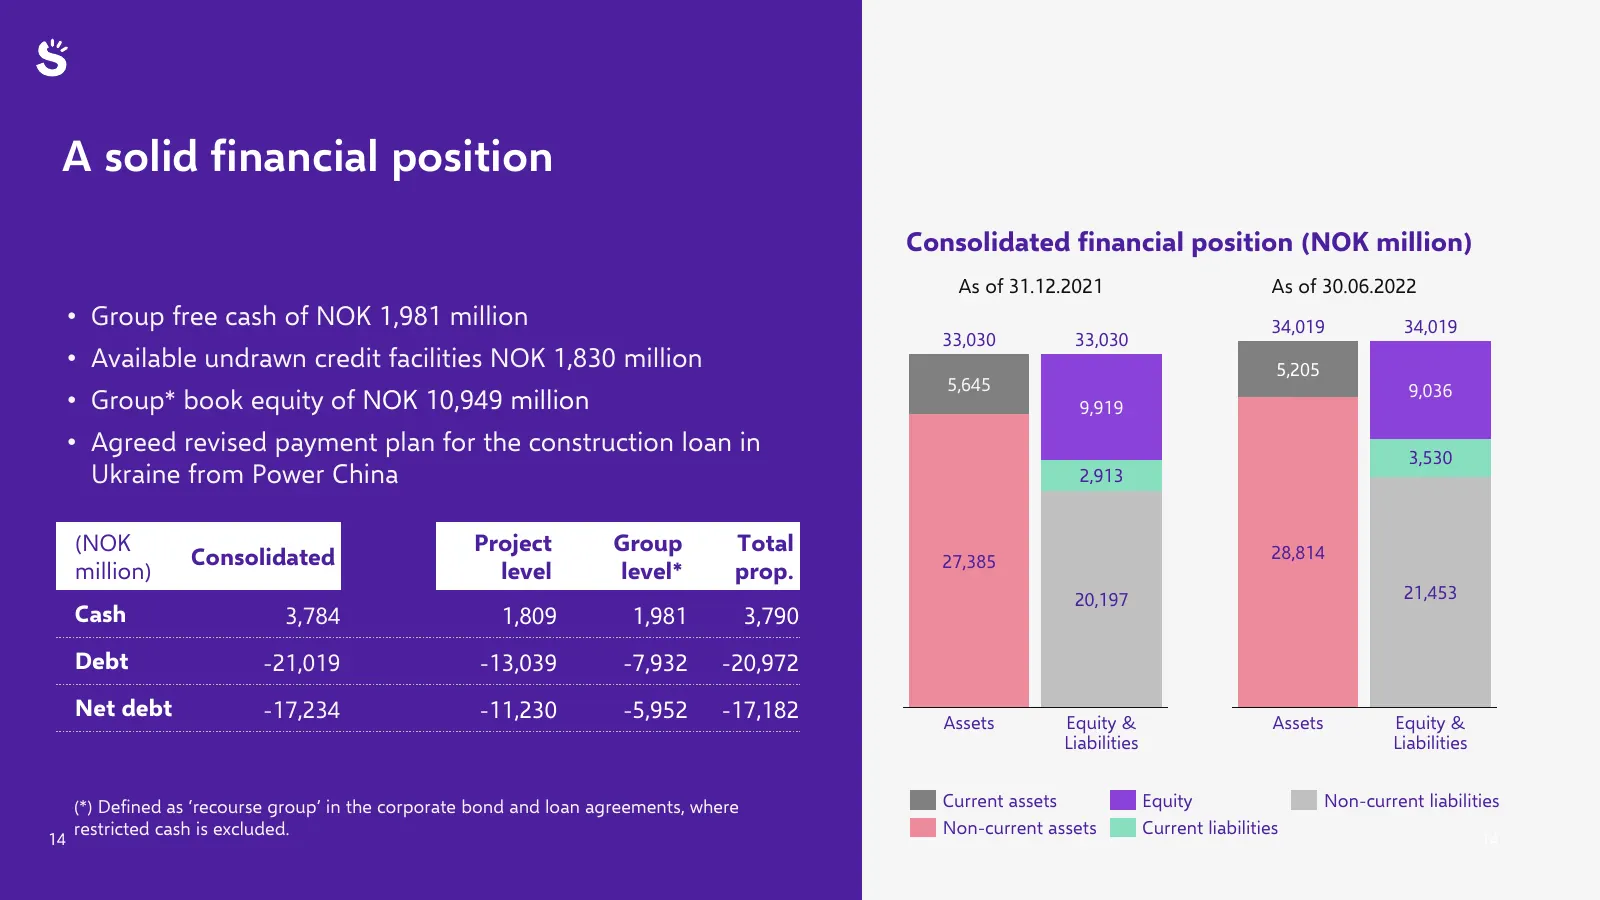
A solid financial position Consolidated financial position (NOK million) As of 31.12.2021 As of 30.06.2022 • Group free cash of NOK 1,981 million 34,019 34,019 33,030 33,030 • Available undrawn credit facilities NOK 1,830 million 5,205 5,645 9,036 • Group* book equity of NOK 10,949 million 9,919 • A
Slide 15: Q2'22 movement of the Group's free cash
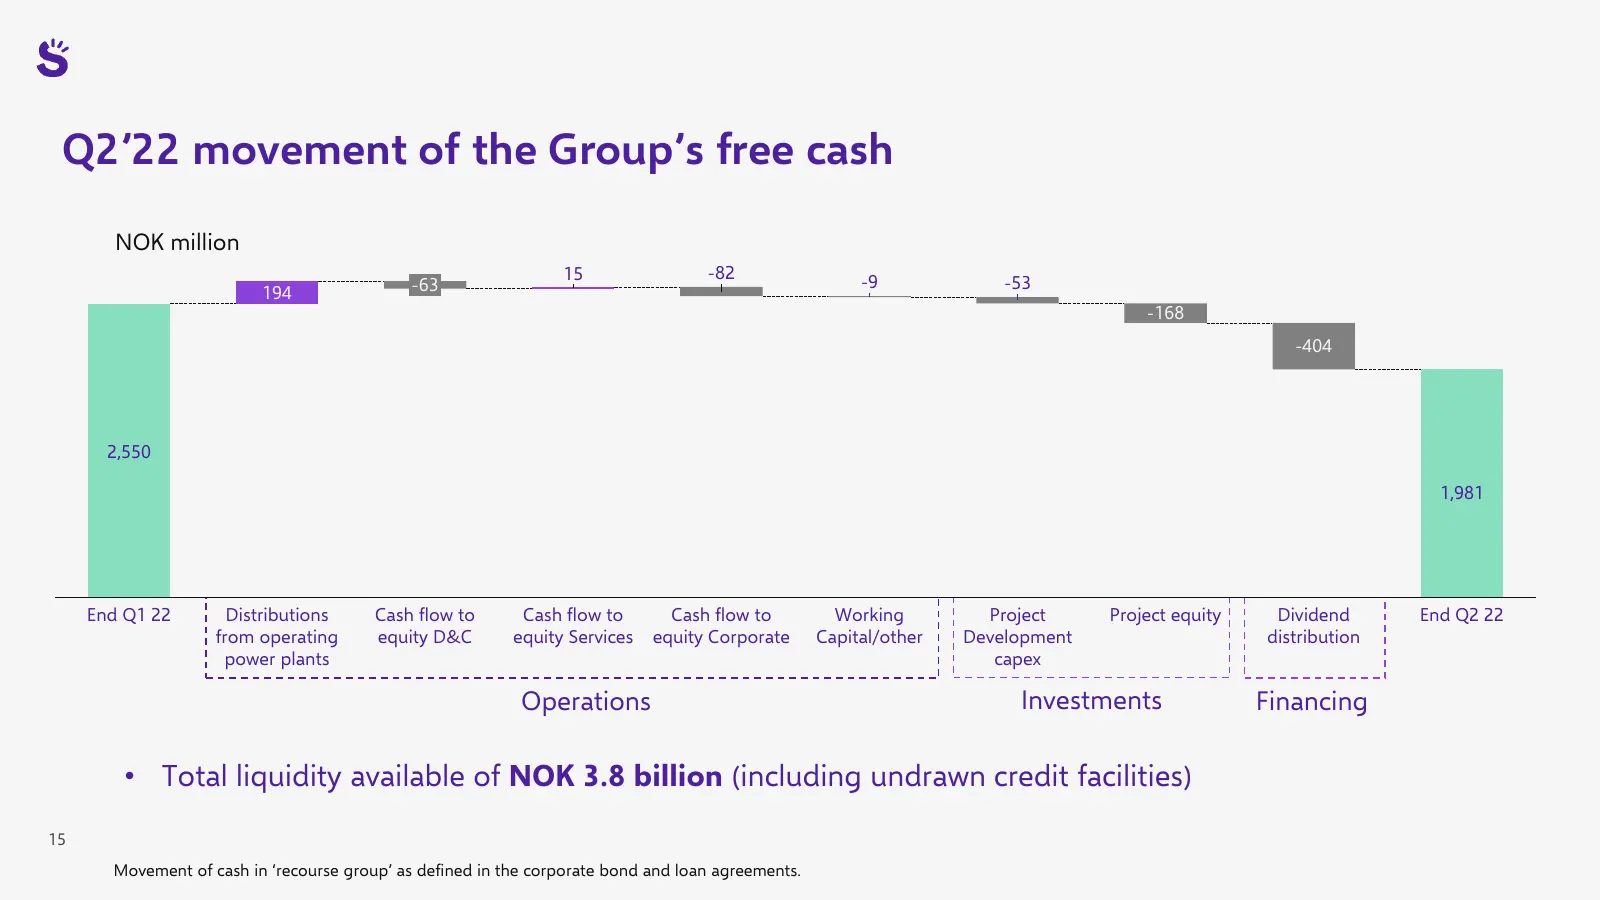
Q2’22 movement of the Group’s free cash NOK million 15 -82 -63 -9 -53 194 -168 -404 2,550 1,981 End Q1 22 Distributions Cash flow to Cash flow to Cash flow to Working Project Project equity Dividend End Q2 22 from operating equity D&C equity Services equity Corporate Capital/other Development distri
Slide 16: Scatec is starting construction projects with NOK 15.3 billion of capex
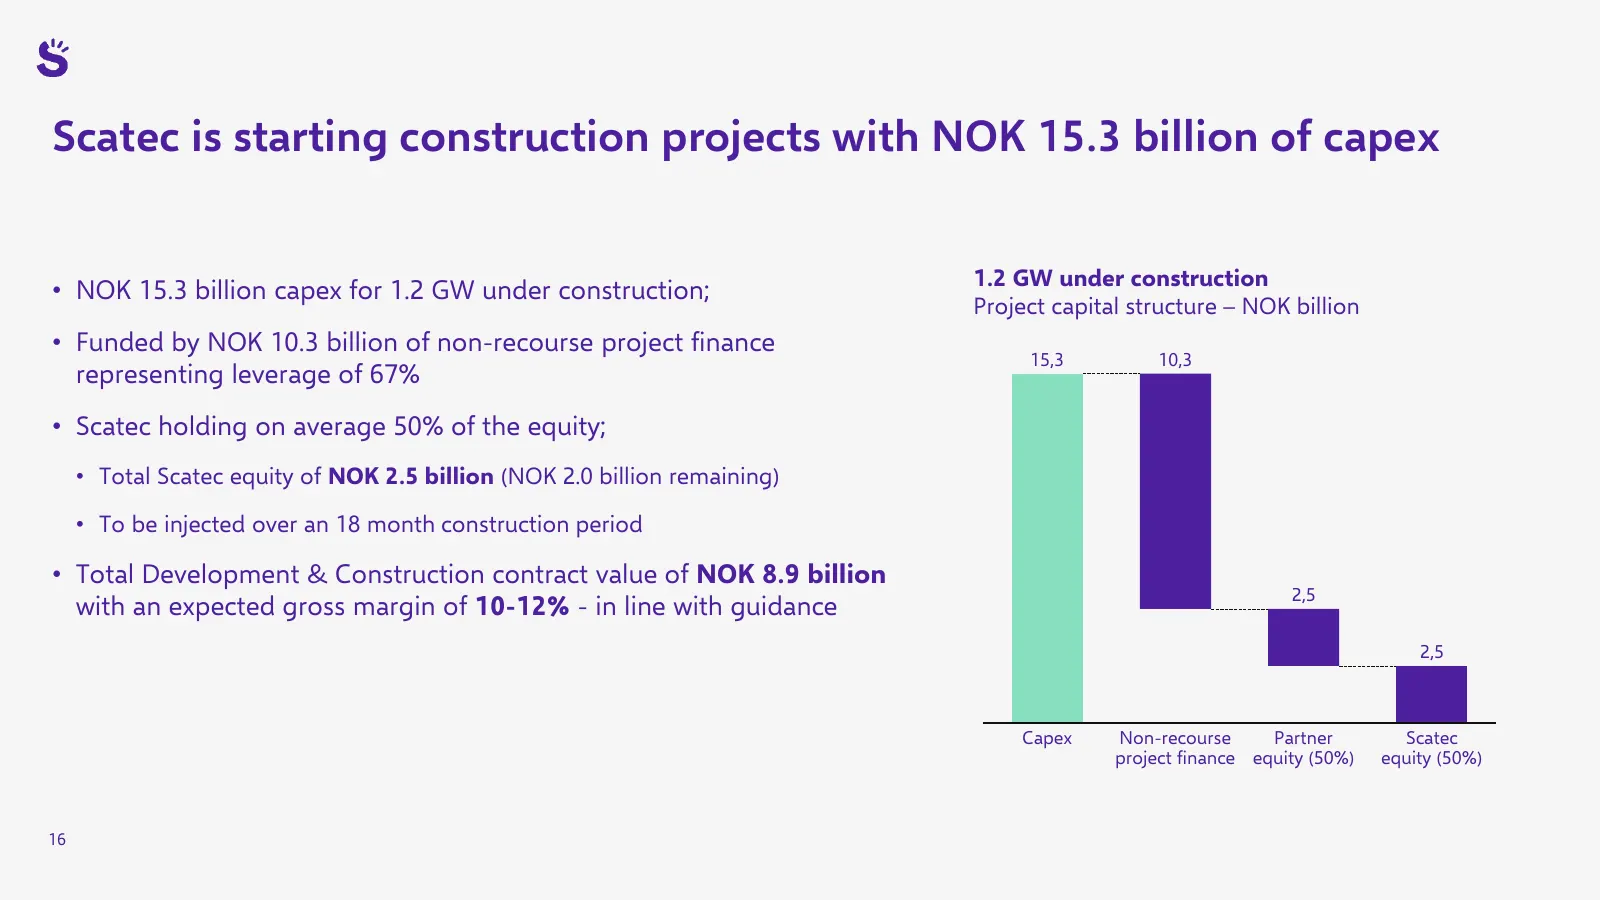
Scatec is starting construction projects with NOK 15.3 billion of capex 1.2 GW under construction • NOK 15.3 billion capex for 1.2 GW under construction; Project capital structure – NOK billion • Funded by NOK 10.3 billion of non-recourse project finance 15,3 10,3 representing leverage of 67% • Scat
Slide 17: Short-term impact by seasonality - long-term asset values increasing
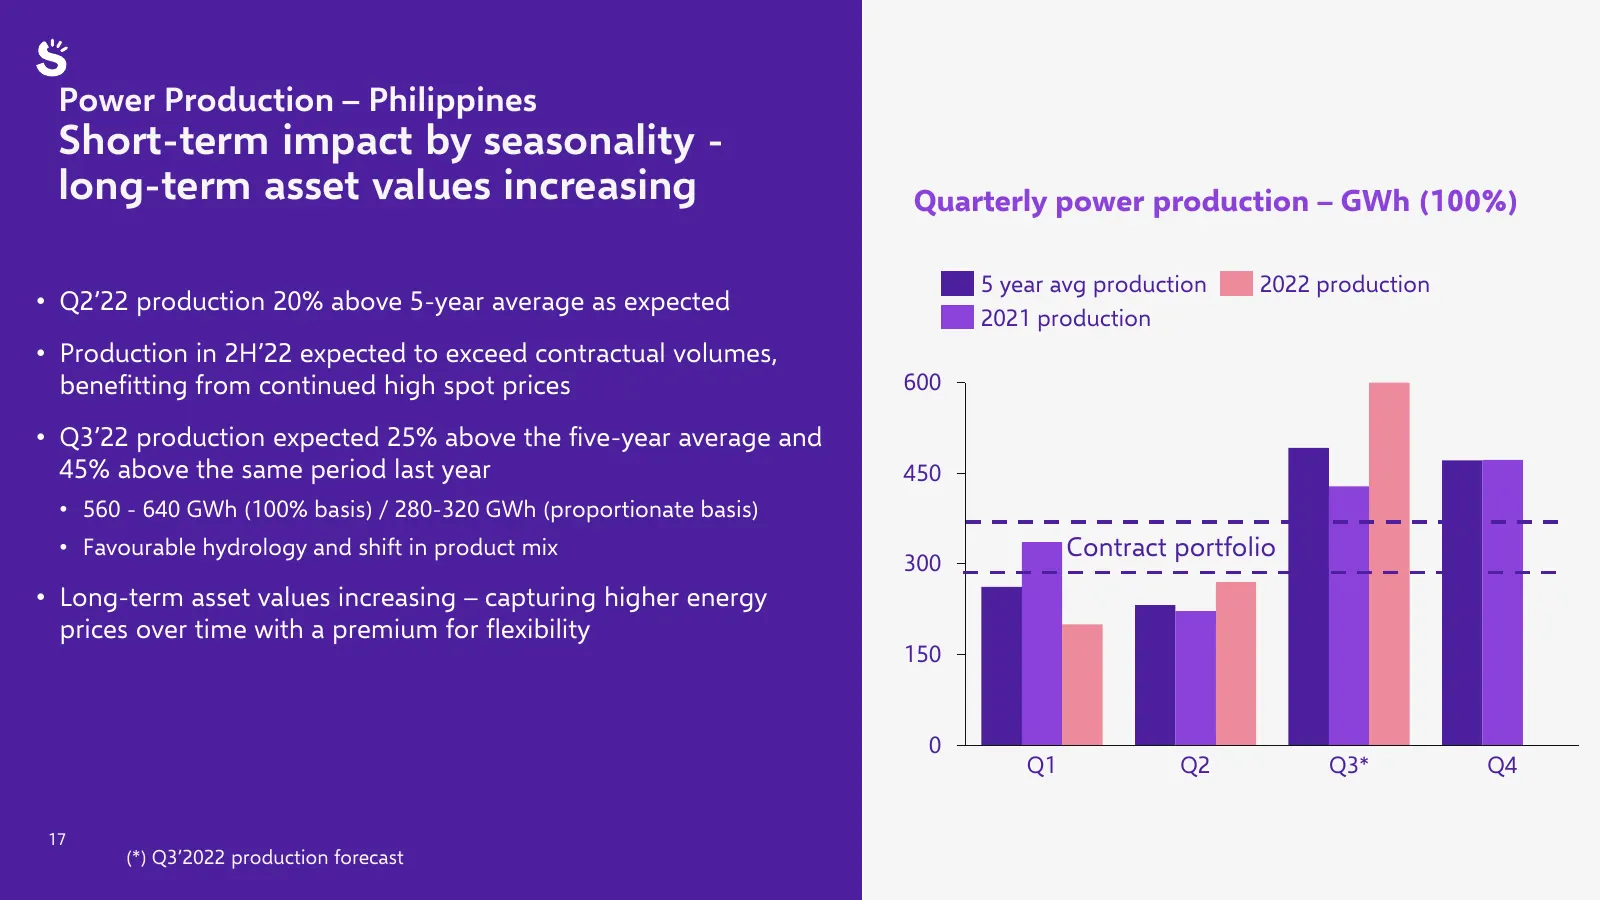
Power Production – Philippines Short-term impact by seasonality - long-term asset values increasing Quarterly power production – GWh (100%) 5 year avg production 2022 production • Q2’22 production 20% above 5-year average as expected 2021 production • Production in 2H’22 expected to exceed contractu
Slide 18: Guidance
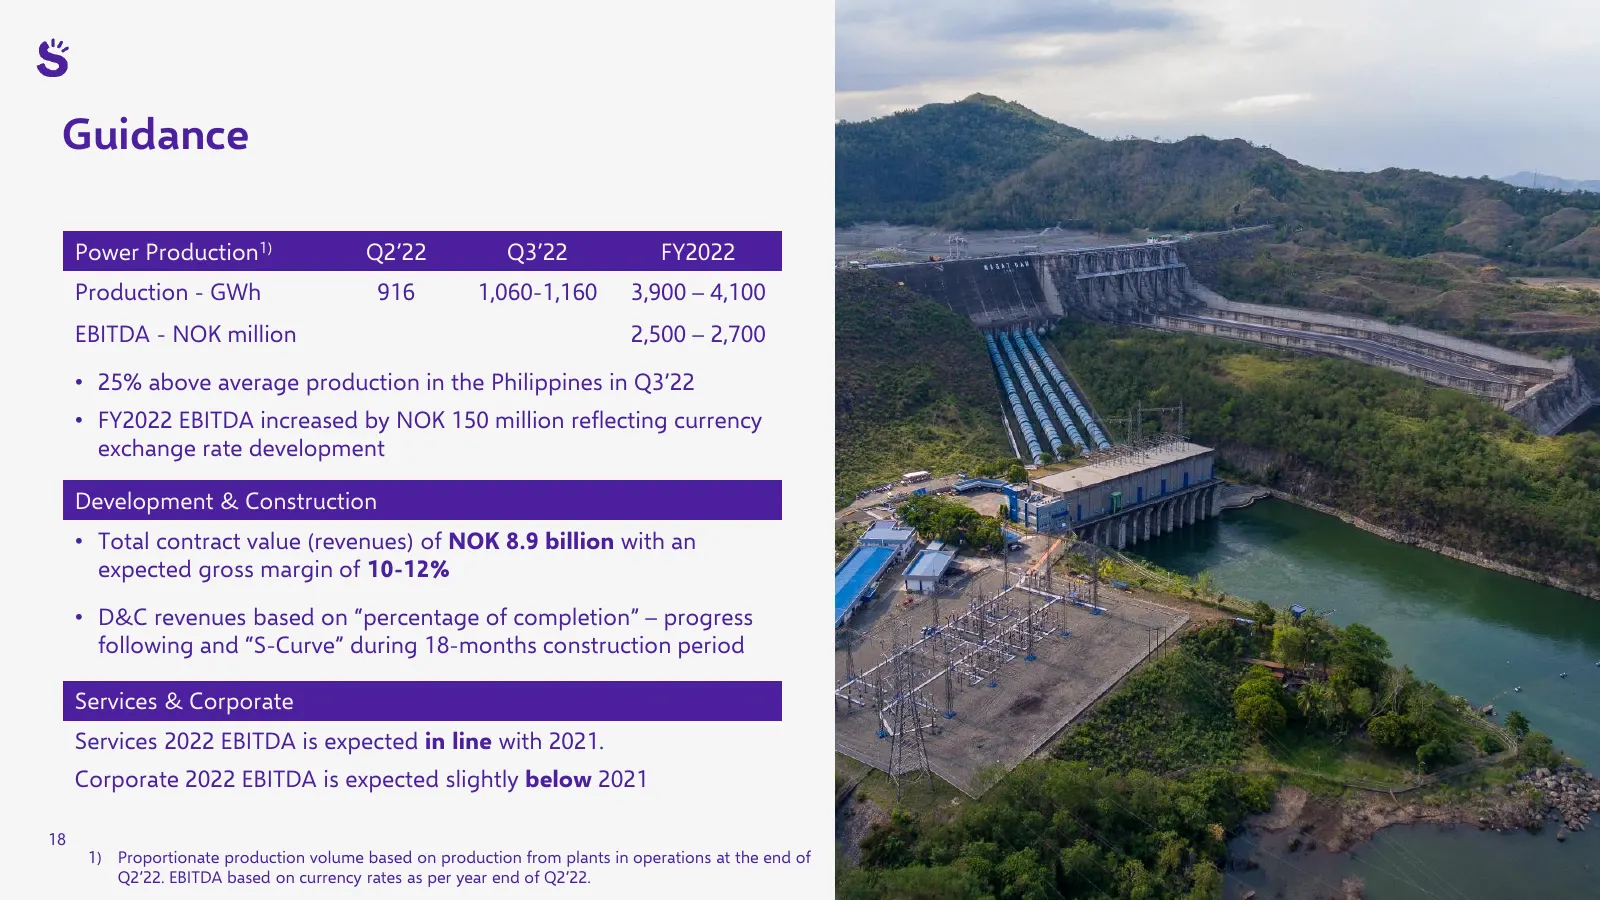
Guidance Power Production1) Q2’22 Q3’22 FY2022 Production - GWh 916 1,060-1,160 3,900 – 4,100 EBITDA - NOK million 2,500 – 2,700 • 25% above average production in the Philippines in Q3’22 • FY2022 EBITDA increased by NOK 150 million reflecting currency exchange rate development Development & Constru
Slide 19: Scatec improving our future
Scate improving our future
Slide 20: Power Production financials – proportionate
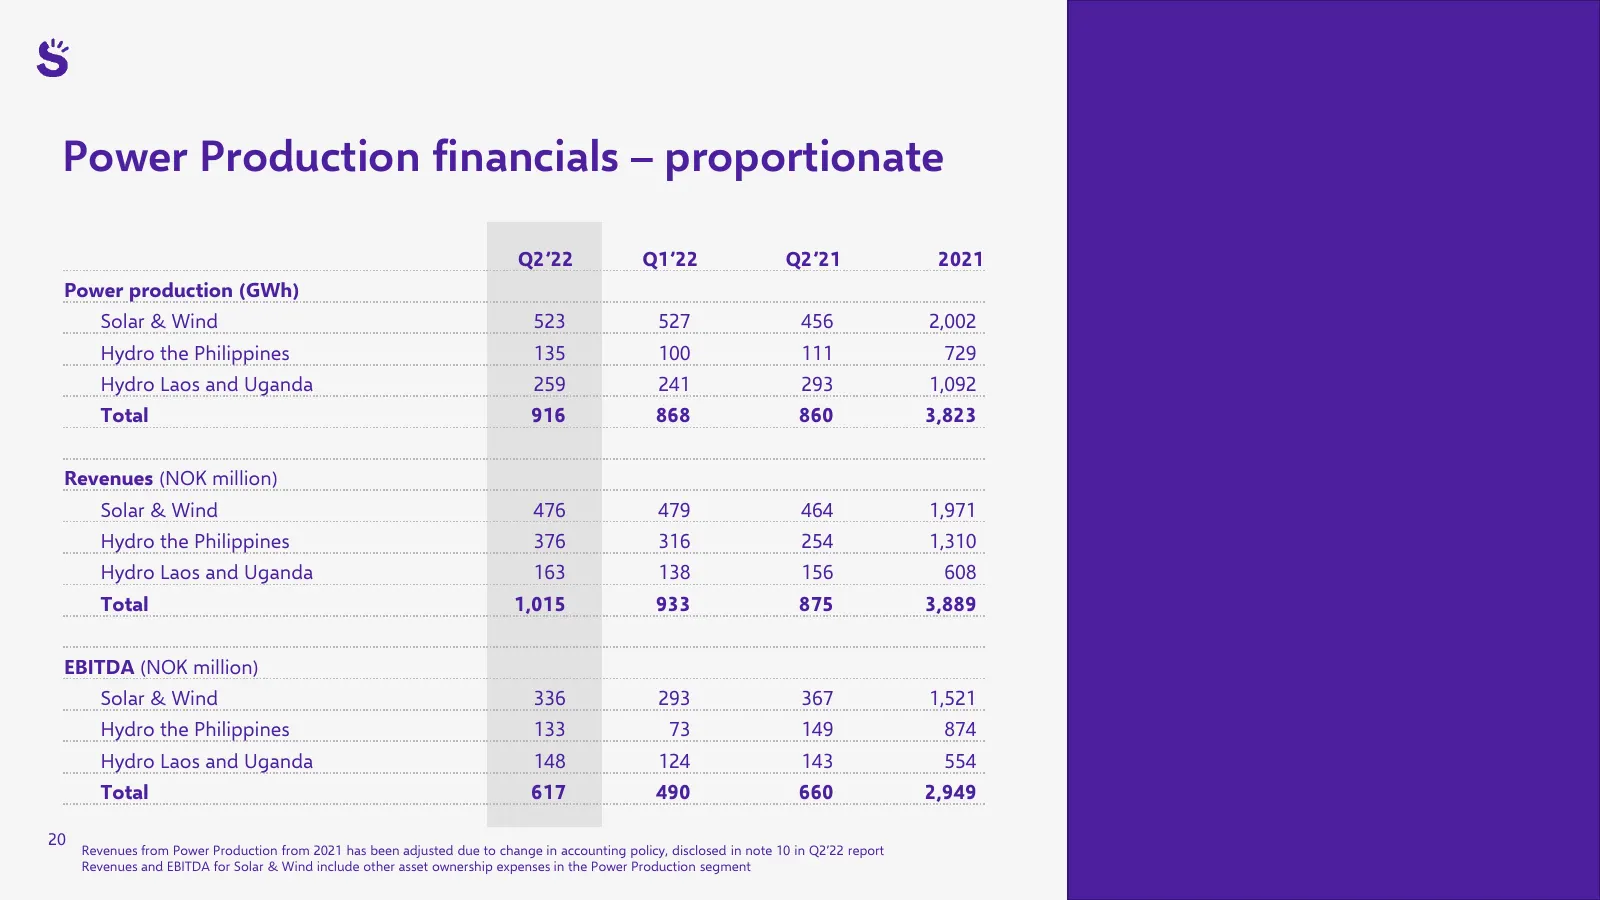
Power Production financials – proportionate Q2’22 Q1’22 Q2’21 2021 Power production (GWh) Solar & Wind 523 527 456 2,002 Hydro the Philippines 135 100 111 729 Hydro Laos and Uganda 259 241 293 1,092 Total 916 868 860 3,823 Revenues (NOK million) Solar & Wind 476 479 464 1,971 Hydro the Philippines 3
Slide 21: Our asset portfolio
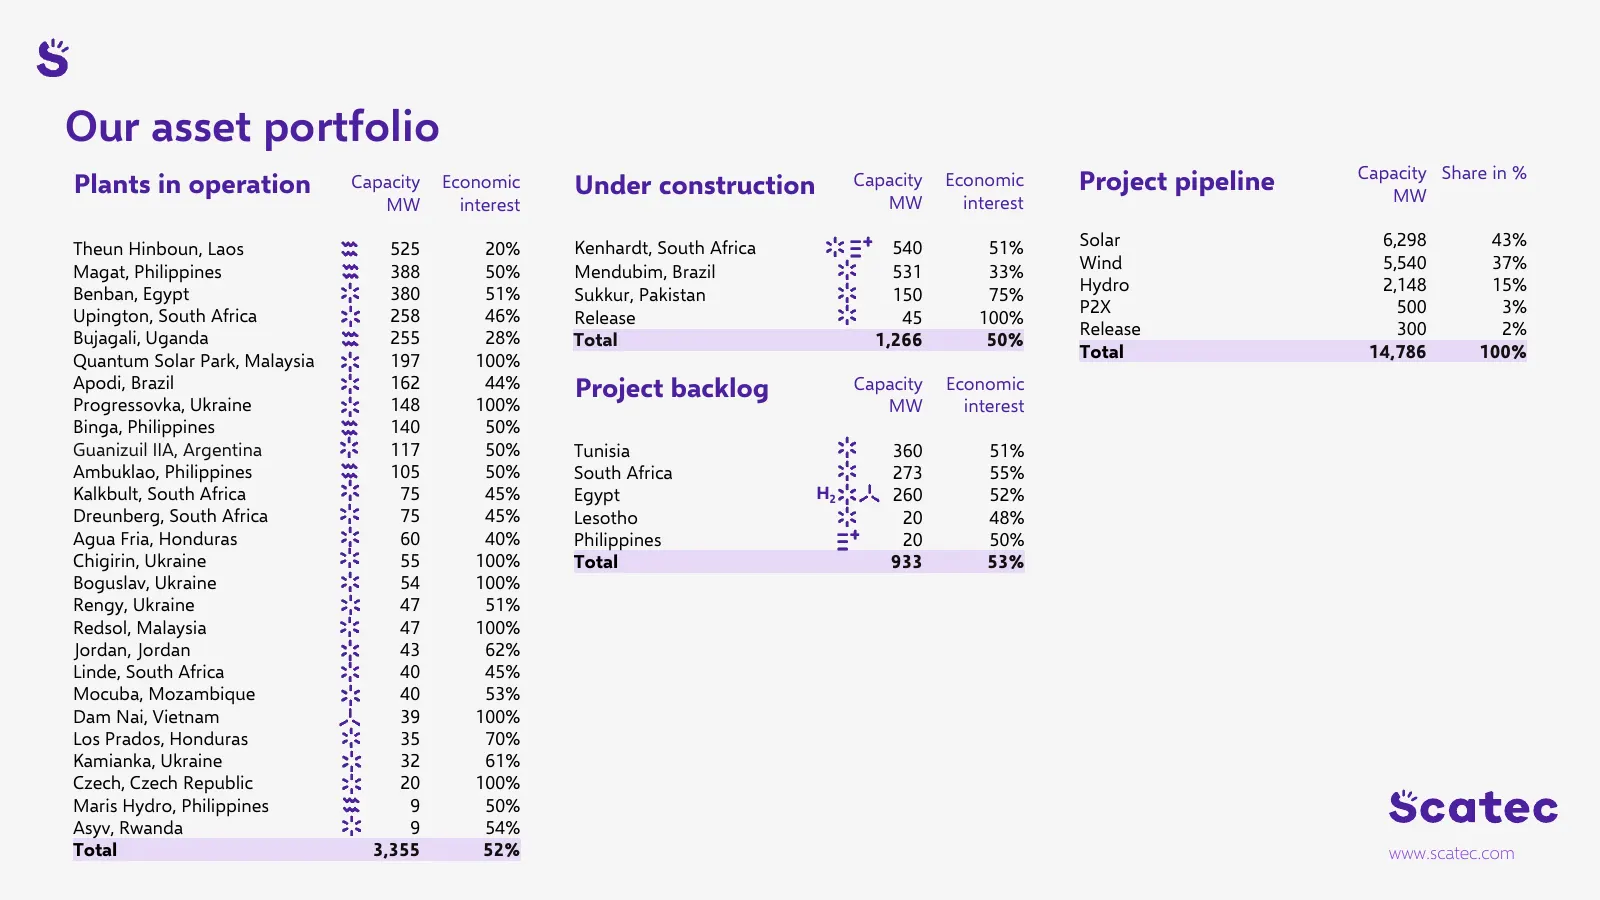
Our asset portfolio Capacity Share in % Plants in operation Capacity Economic Under construction Capacity Economic Project pipeline MW MW interest MW interest Theun Hinboun, Laos 525 20% Kenhardt, South Africa 540 51% Solar 6,298 43% Magat, Philippines 388 50% Mendubim, Brazil 531 33% Wind 5,540 37%
Source: Internet Archive copy of scatec.com
More decks from Scatec ASA
 Q3 2026 Earnings Presentation32 slides · Oct 30, 2026
 Q2 2026 Earnings Presentation23 slides · Aug 21, 2026
 Investor Presentation (August 2026)22 slides · August 2026
 Q1 2026 Earnings Presentation23 slides · May 6, 2026
 Investor Presentation (March 2026)22 slides · March 2026
 Q4 2025 Earnings Presentation24 slides · Jan 30, 2026