Meredith — Deutsche Bank 2009 Media & Telecommunications Conference
32 slides from Meredith's conference presentation, Mar 3, 2009
Slide 1: Deutsche Bank 2009 Media & Telecommunications Conference
Deutsche Bank 2009 Media & Telecommunications Conference March 2-4, 2009 1 1
Slide 2: Safe Harbor
Safe Harbor This presentation and management’s public commentary contain certain forward-looking statements that are subject to risks and uncertainties. uncertainties These statements are based on management management’s s current knowledge and estimates of factors affecting the Company’s operations
Slide 3: Agenda
Agenda Meredith Overview Strategic St t i IInitiatives iti ti Financial Overview 3 3
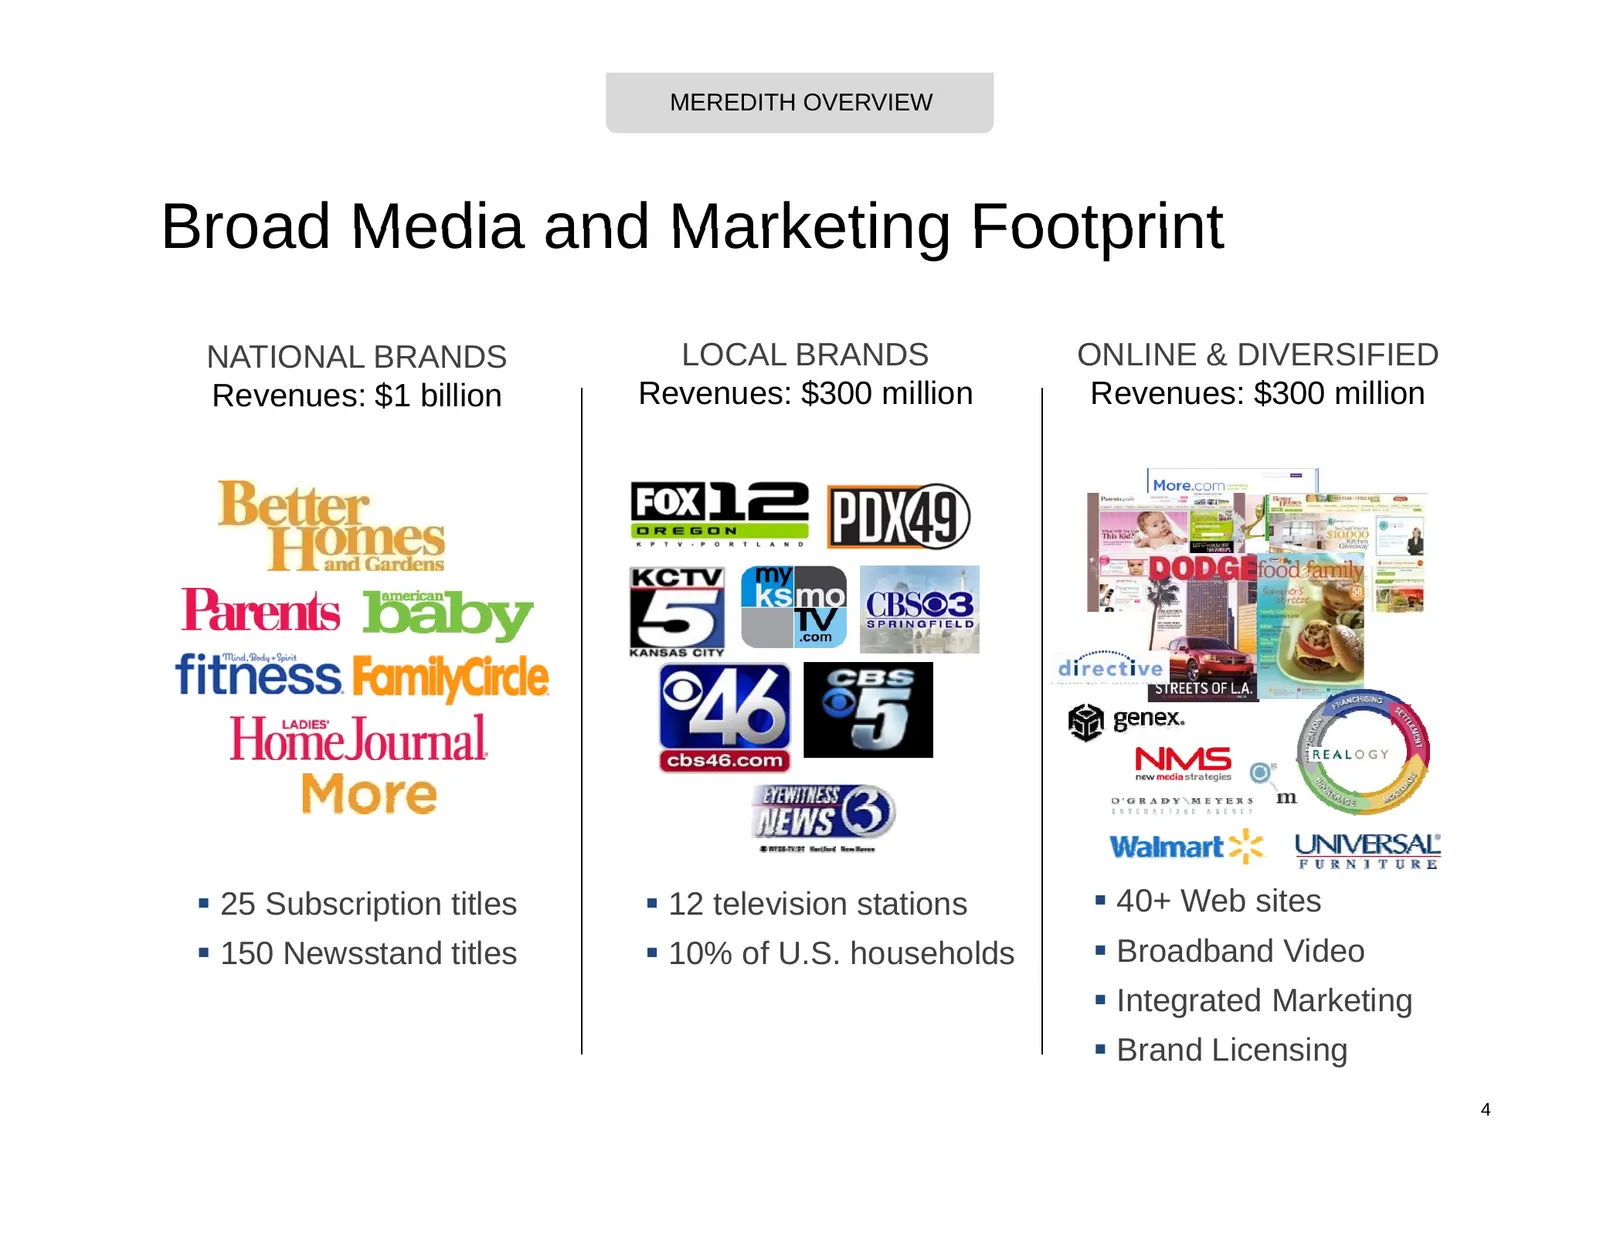
Slide 4: Broad Media and Marketing Footprint
MEREDITH OVERVIEW Broad Media and Marketing Footprint NATIONAL BRANDS LOCAL BRANDS ONLINE & DIVERSIFIED R Revenues: $1 billi billion R Revenues: $300 million illi R Revenues: $300 million illi 25 Subscription titles 12 television stations 40+ Web sites 150 Newsstand titles 10% of U.S. hous
Slide 5: Balanced Revenue Mix
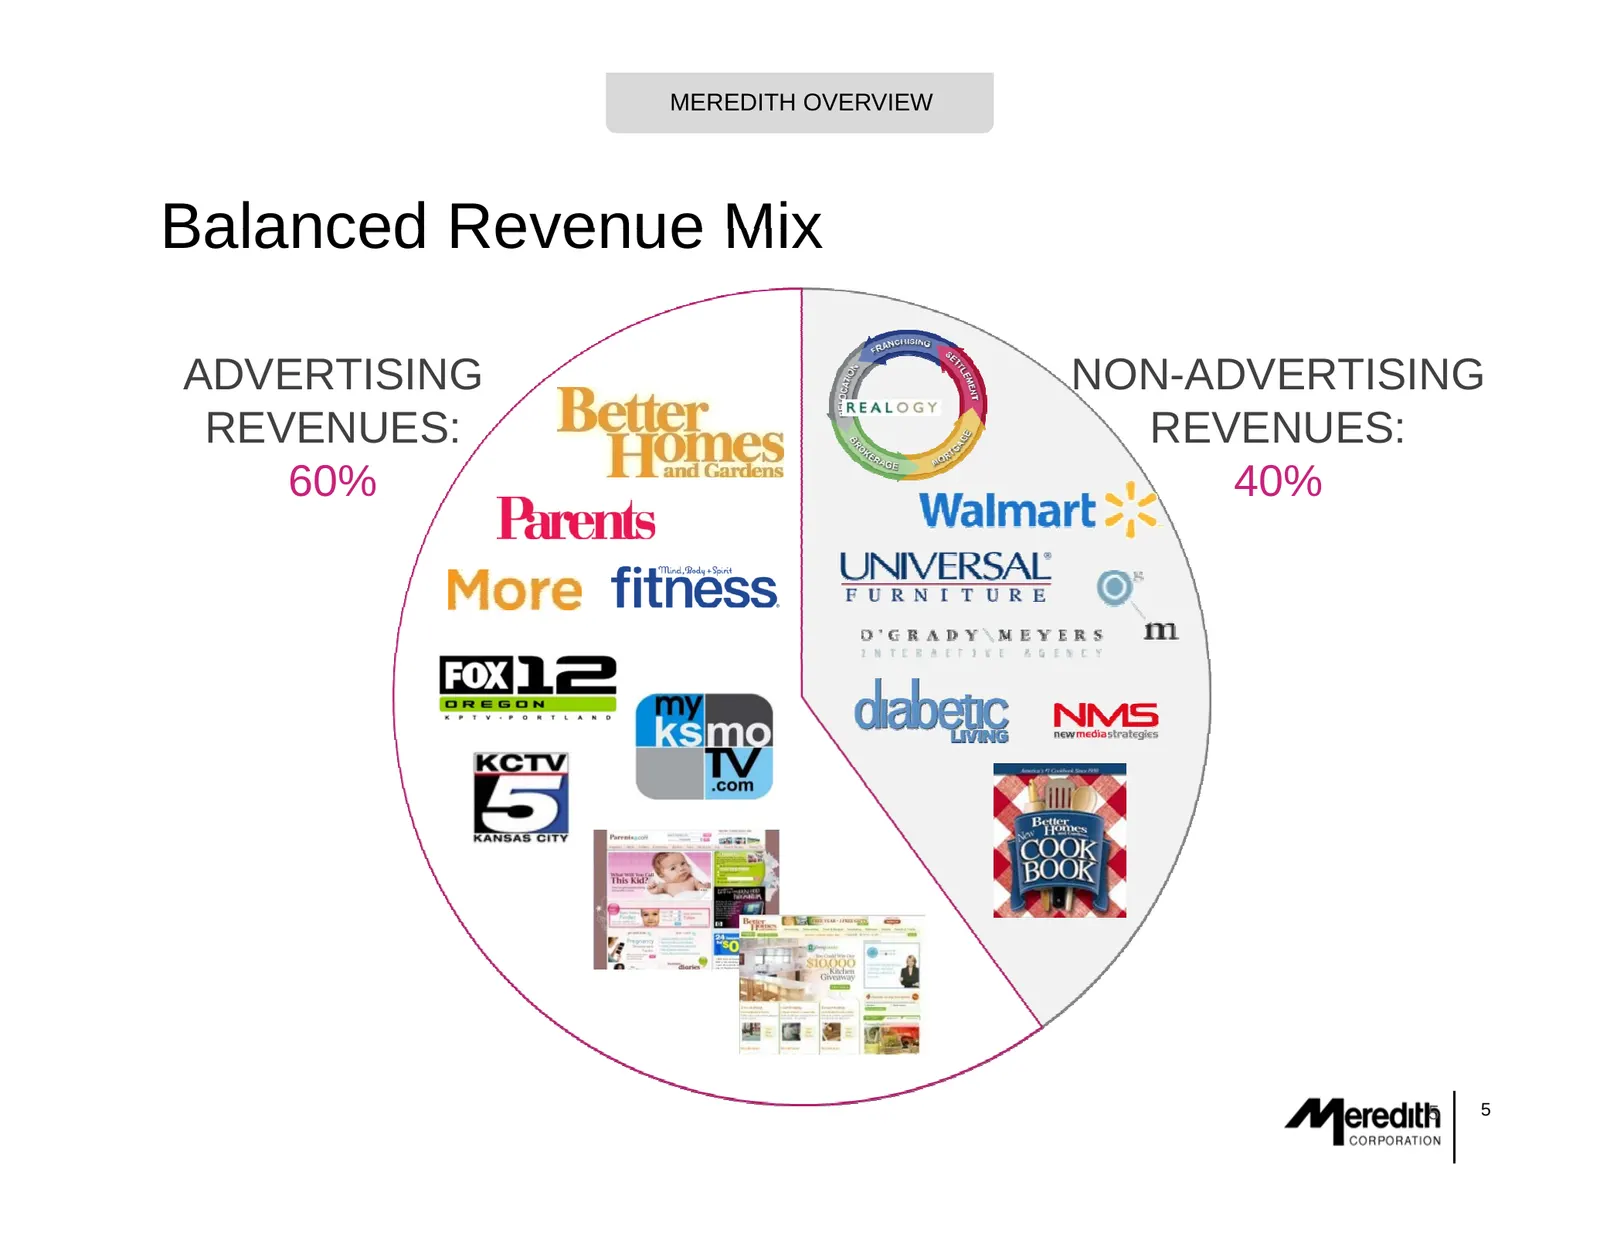
MEREDITH OVERVIEW Balanced Revenue Mix ADVERTISING NON ADVERTISING NON-ADVERTISING REVENUES: REVENUES: 60% 40% 5 5
Slide 6: Powerful National Consumer Connection
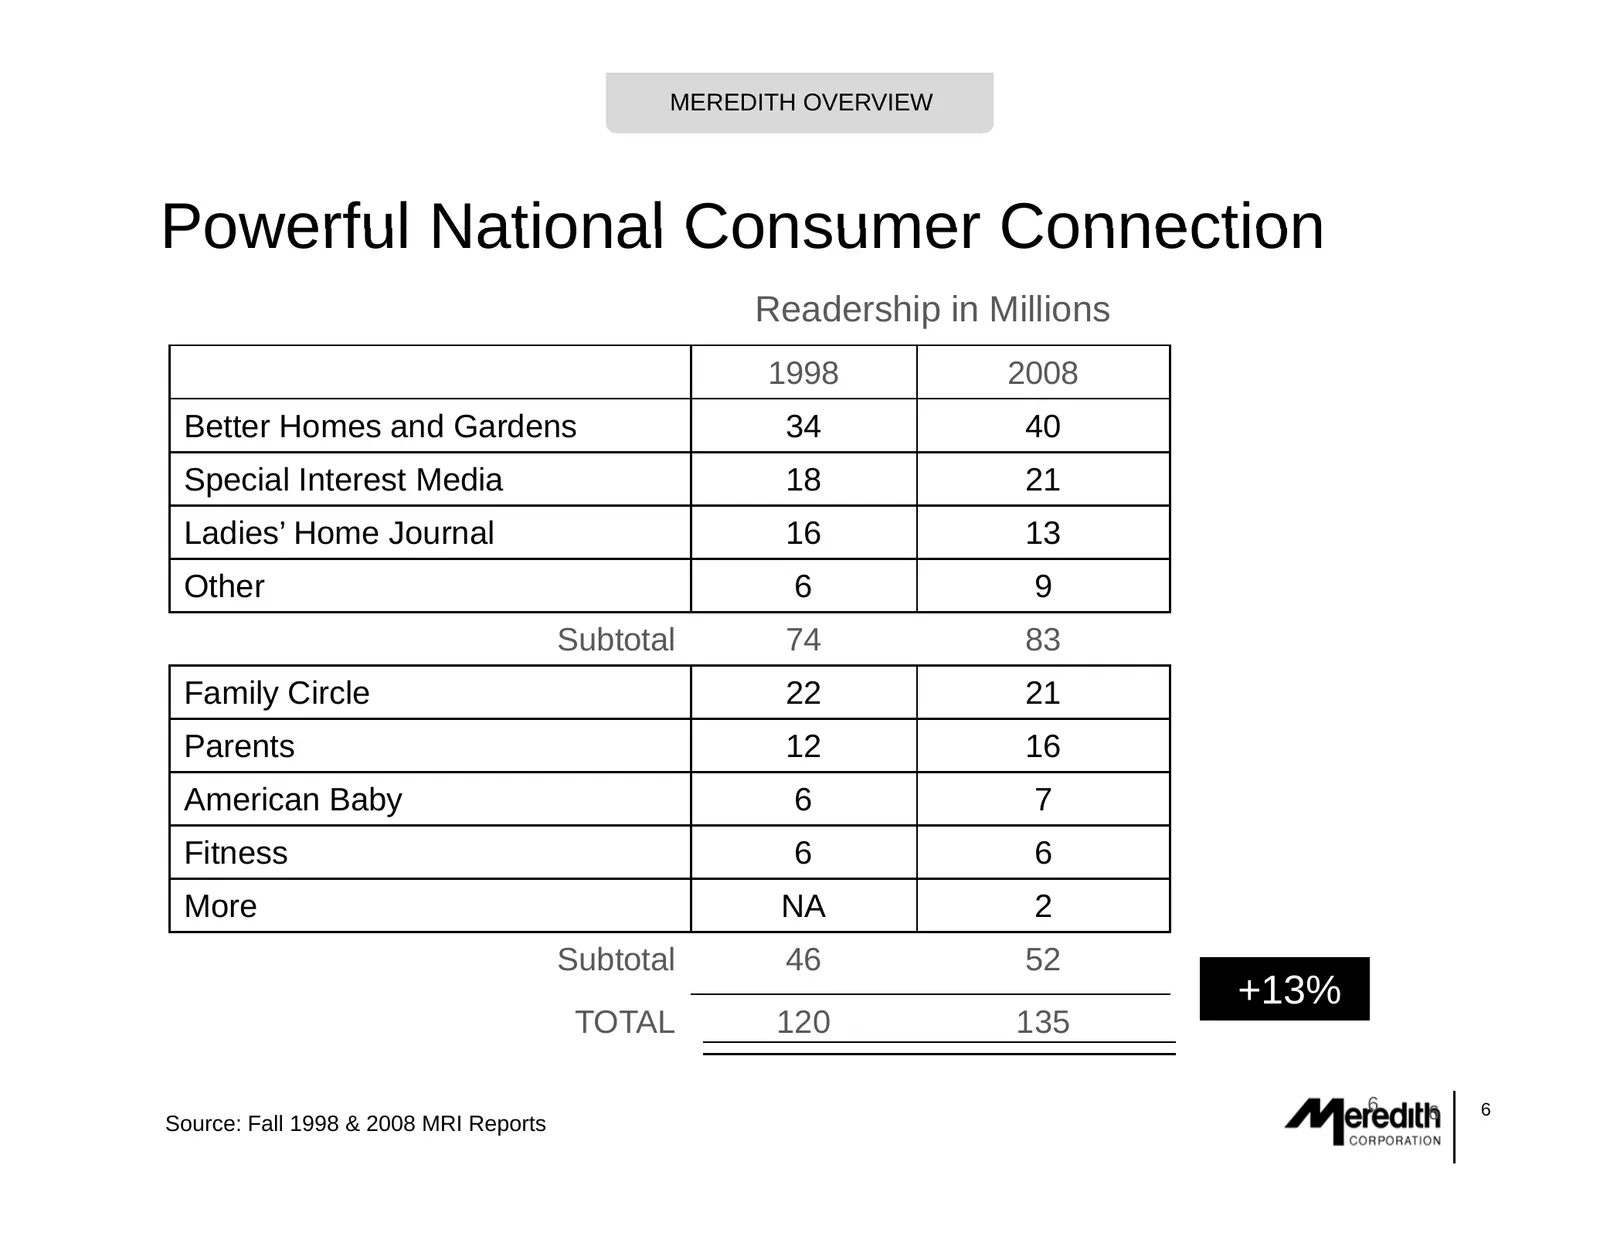
MEREDITH OVERVIEW Powerful National Consumer Connection Readership in Millions 1998 998 2008 008 Better Homes and Gardens 34 40 Special Interest Media 18 21 Ladies’ Home Journal Ladies 16 13 Other 6 9 Subtotal 74 83 Family Circle 22 21 Parents 12 16 American Baby 6 7 Fitness 6 6 More NA 2 Subtotal 4
Slide 7: Growing Local Consumer Connection
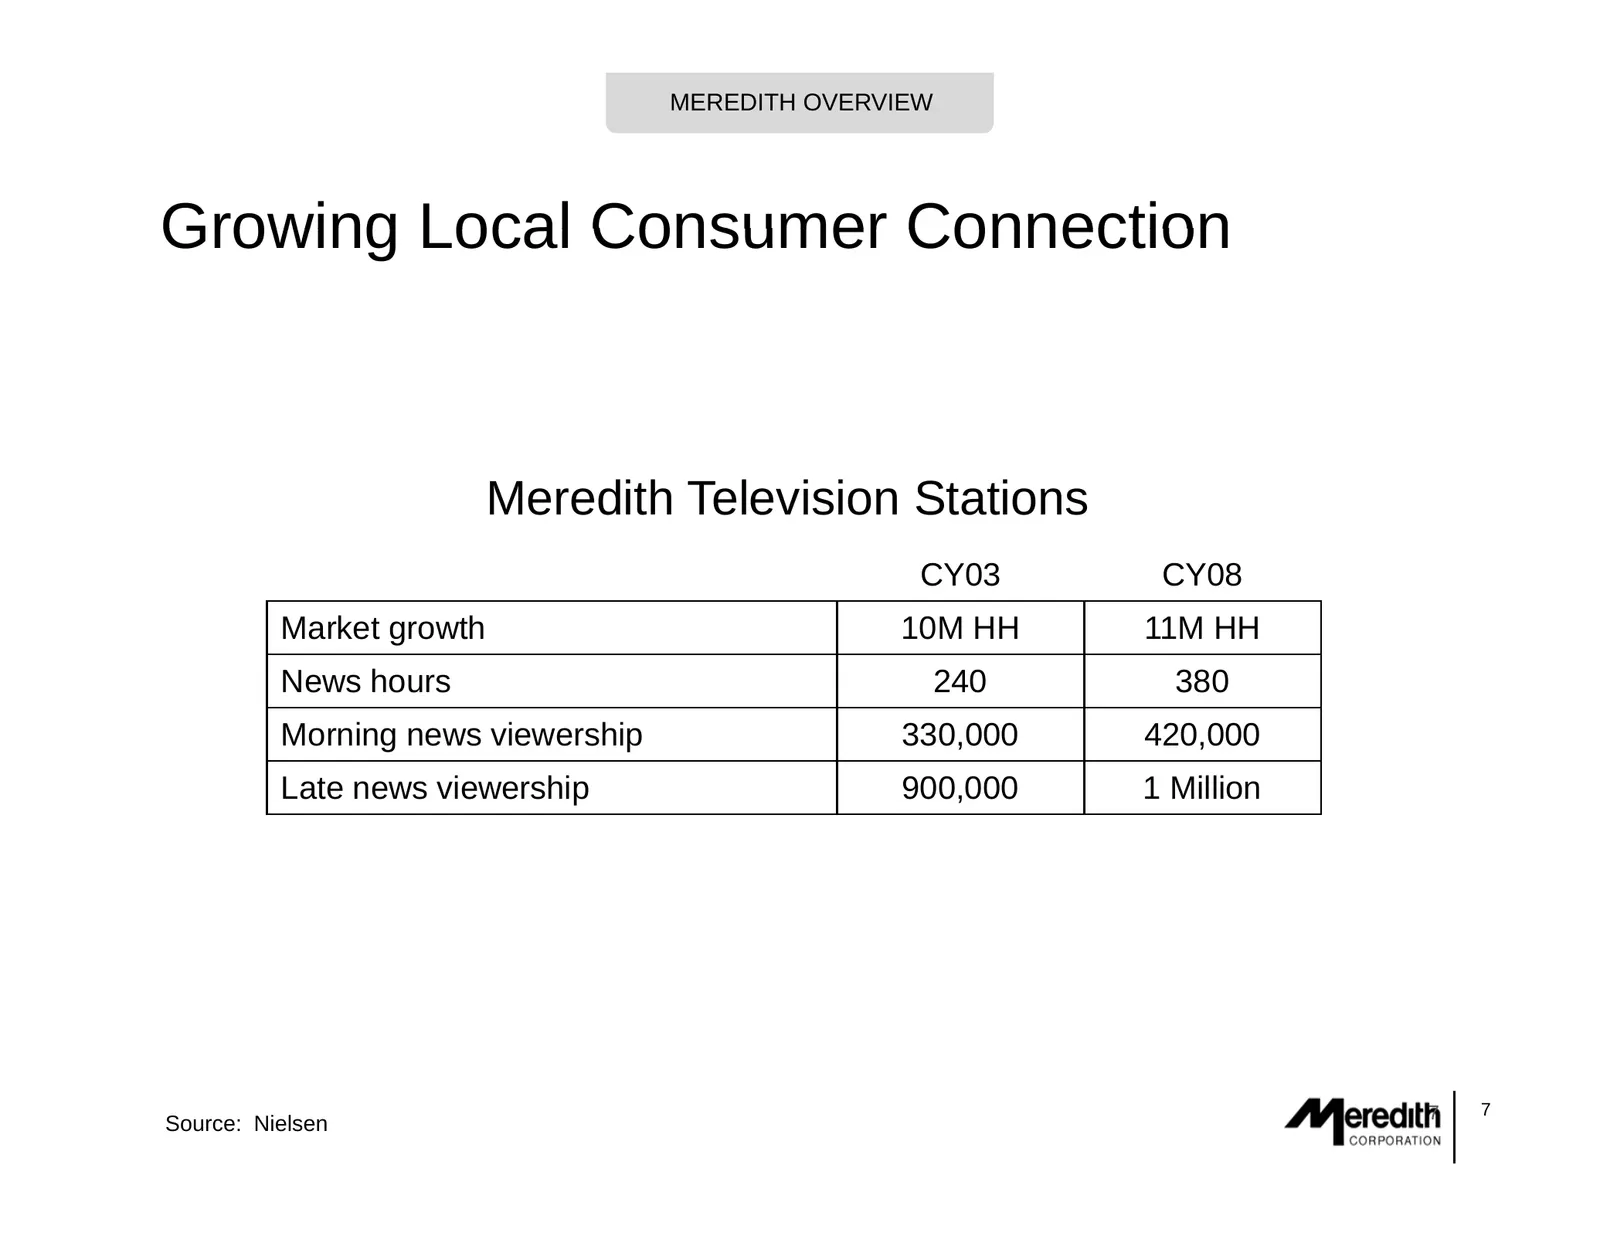
MEREDITH OVERVIEW Growing Local Consumer Connection Meredith Television Stations CY03 CY08 Market growth 10M HH 11M HH News hours 240 380 Morning news viewership 330,000 420,000 Late news viewership 900,000 1 Million 7 7 Source: Nielsen
Slide 8: Growing Online and Video Portfolio
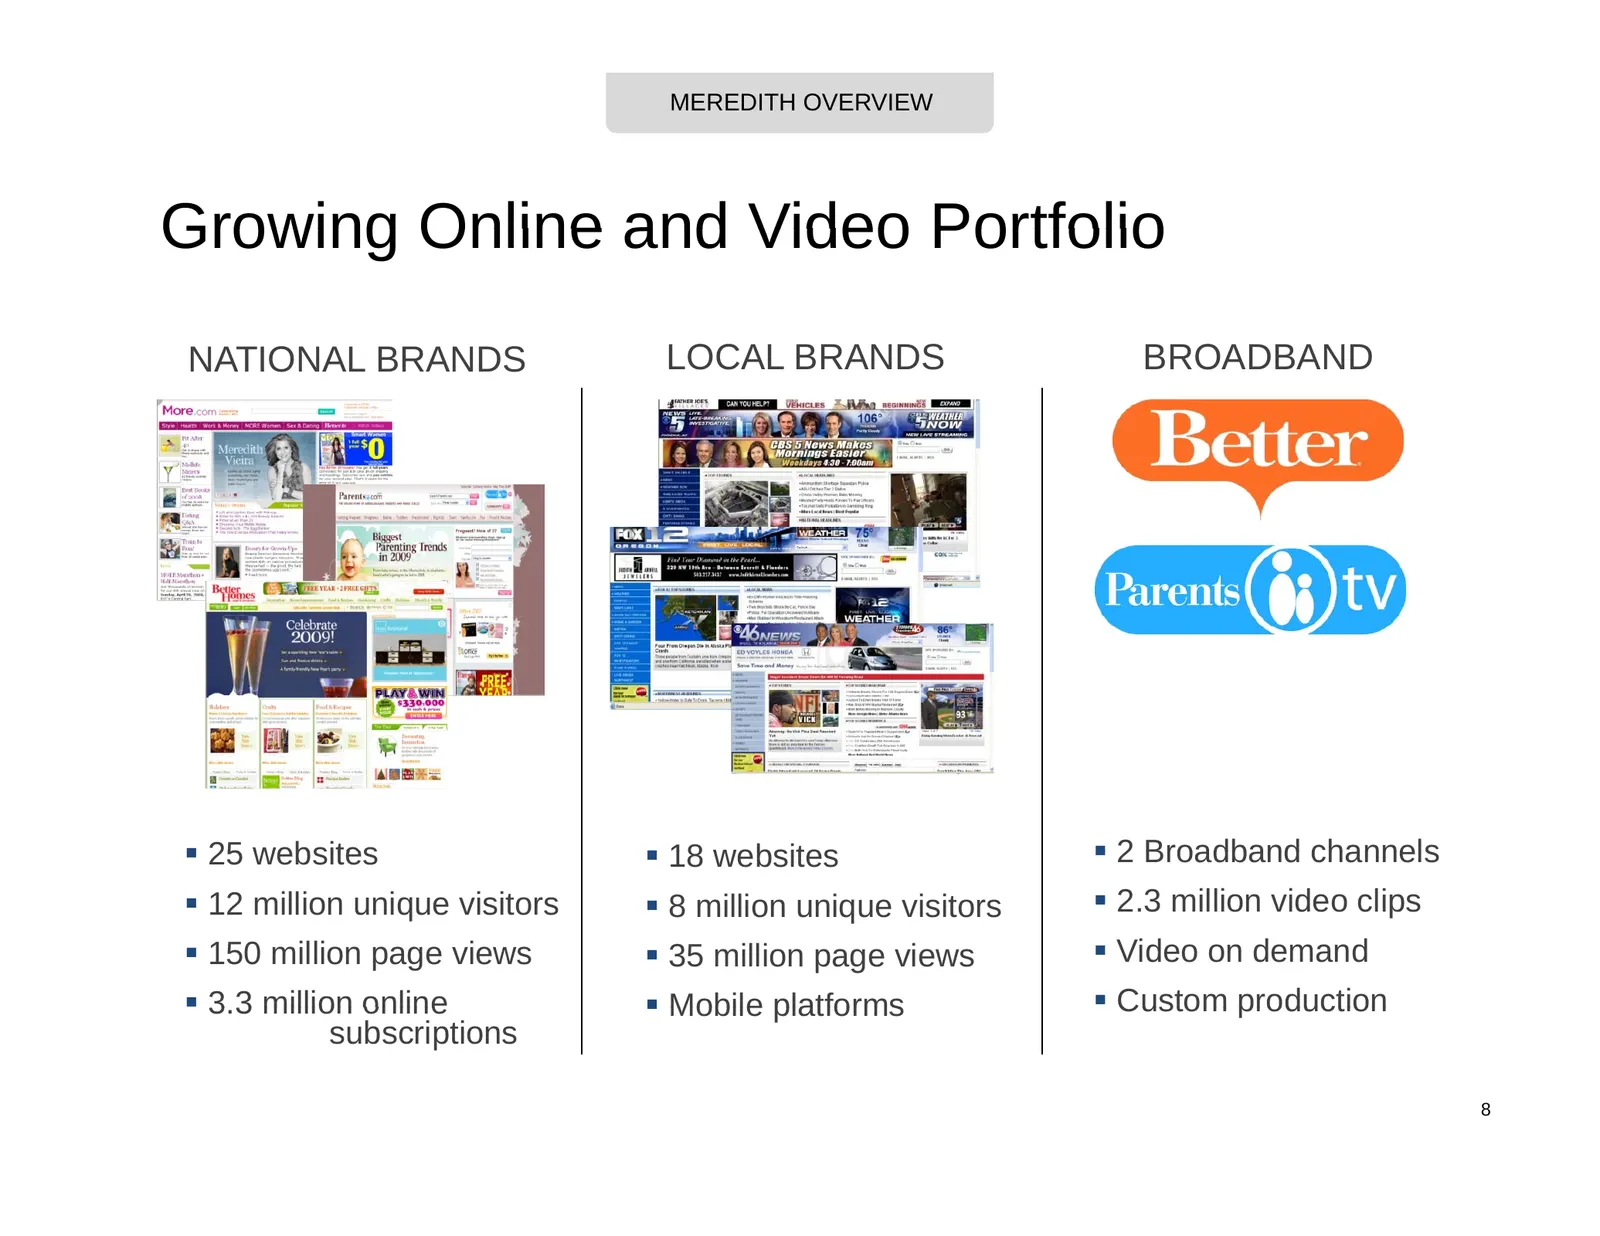
MEREDITH OVERVIEW Growing Online and Video Portfolio NATIONAL BRANDS LOCAL BRANDS BROADBAND 25 websites 18 websites 2 Broadband channels 12 million unique visitors 8 million unique visitors 2.3 million video clips 150 million page views 35 million page views Video on demand 3.3 3
Slide 9: Agenda: Strategic Initiatives
STRATEGIC OVERVIEW Agenda Meredith Overview Strategic St t i IInitiatives iti ti – Gain market share across businesses – Grow G new revenue streams t – Exercise disciplined expense management Financial Overview 9 9
Slide 10: Powerful Brands Across Life Stages
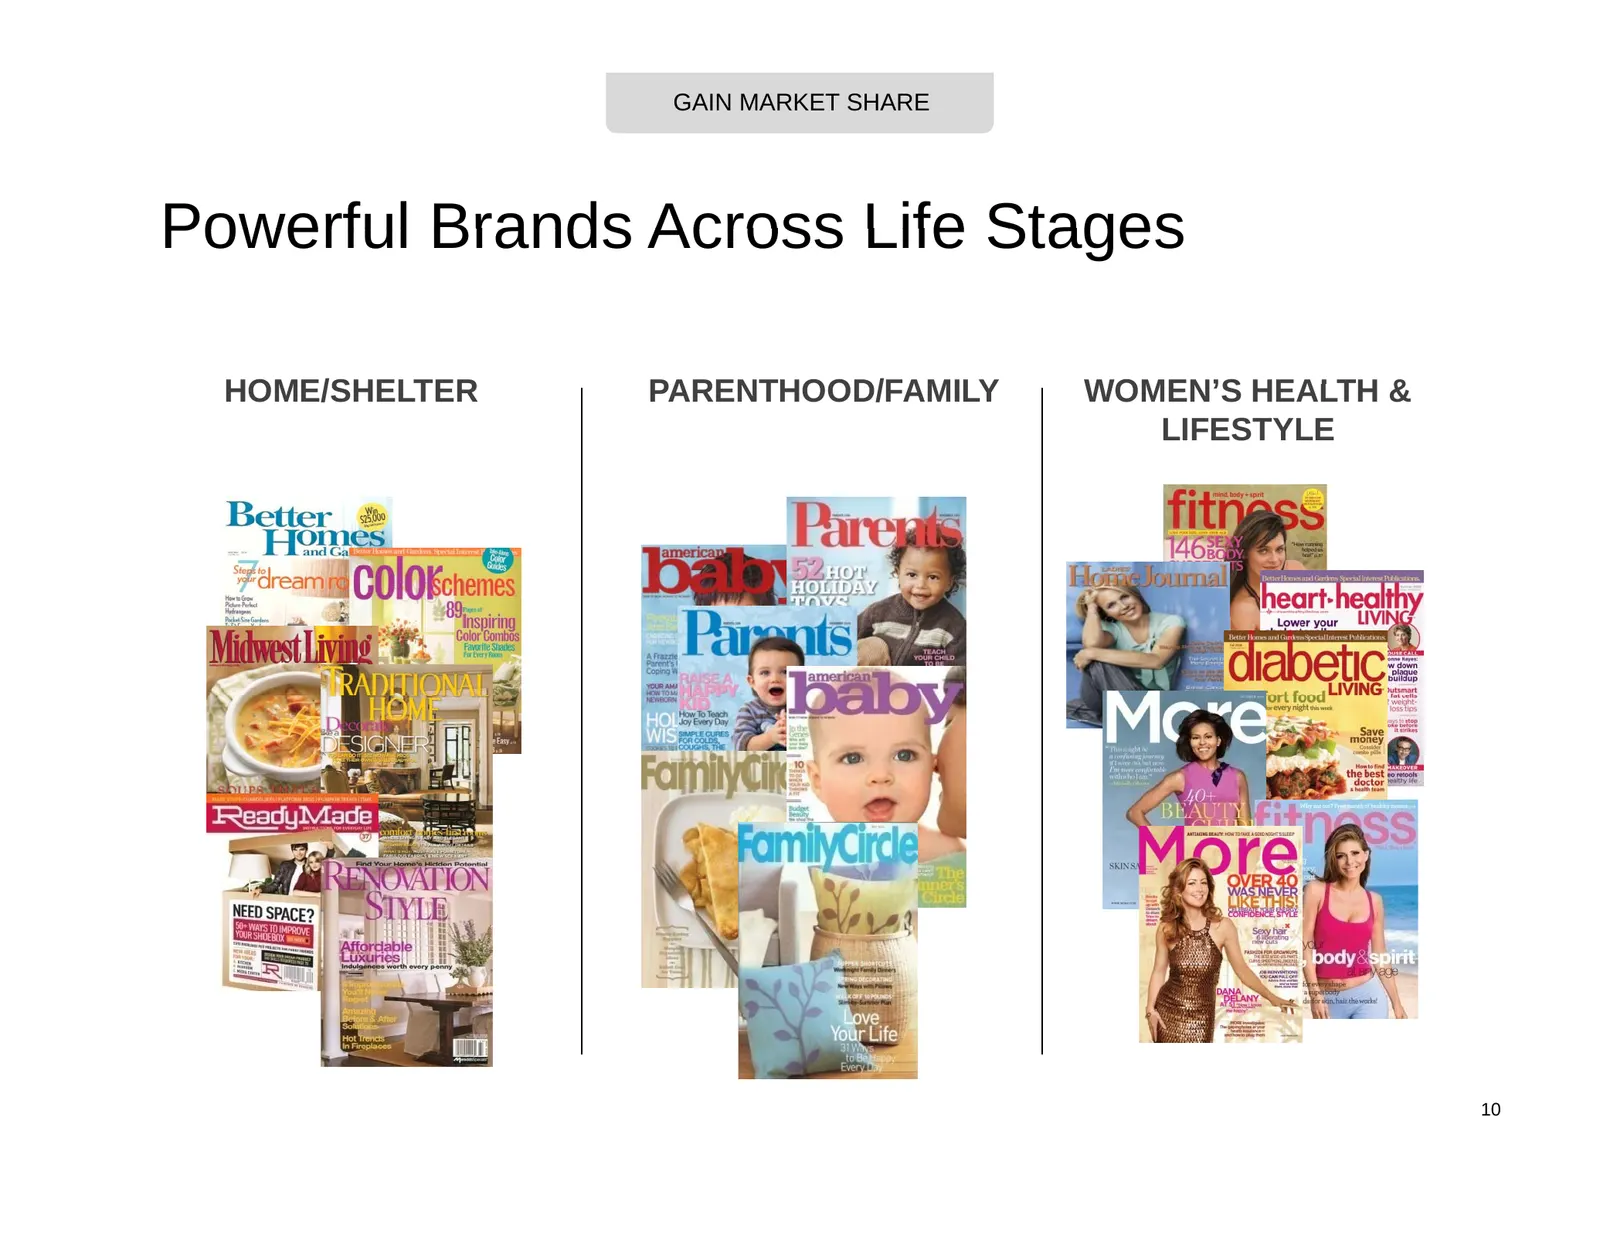
GAIN MARKET SHARE Powerful Brands Across Life Stages HOME/SHELTER PARENTHOOD/FAMILY WOMEN’S HEALTH & LIFESTYLE 10
Slide 11: Ad Category Concentration and Historical Growth
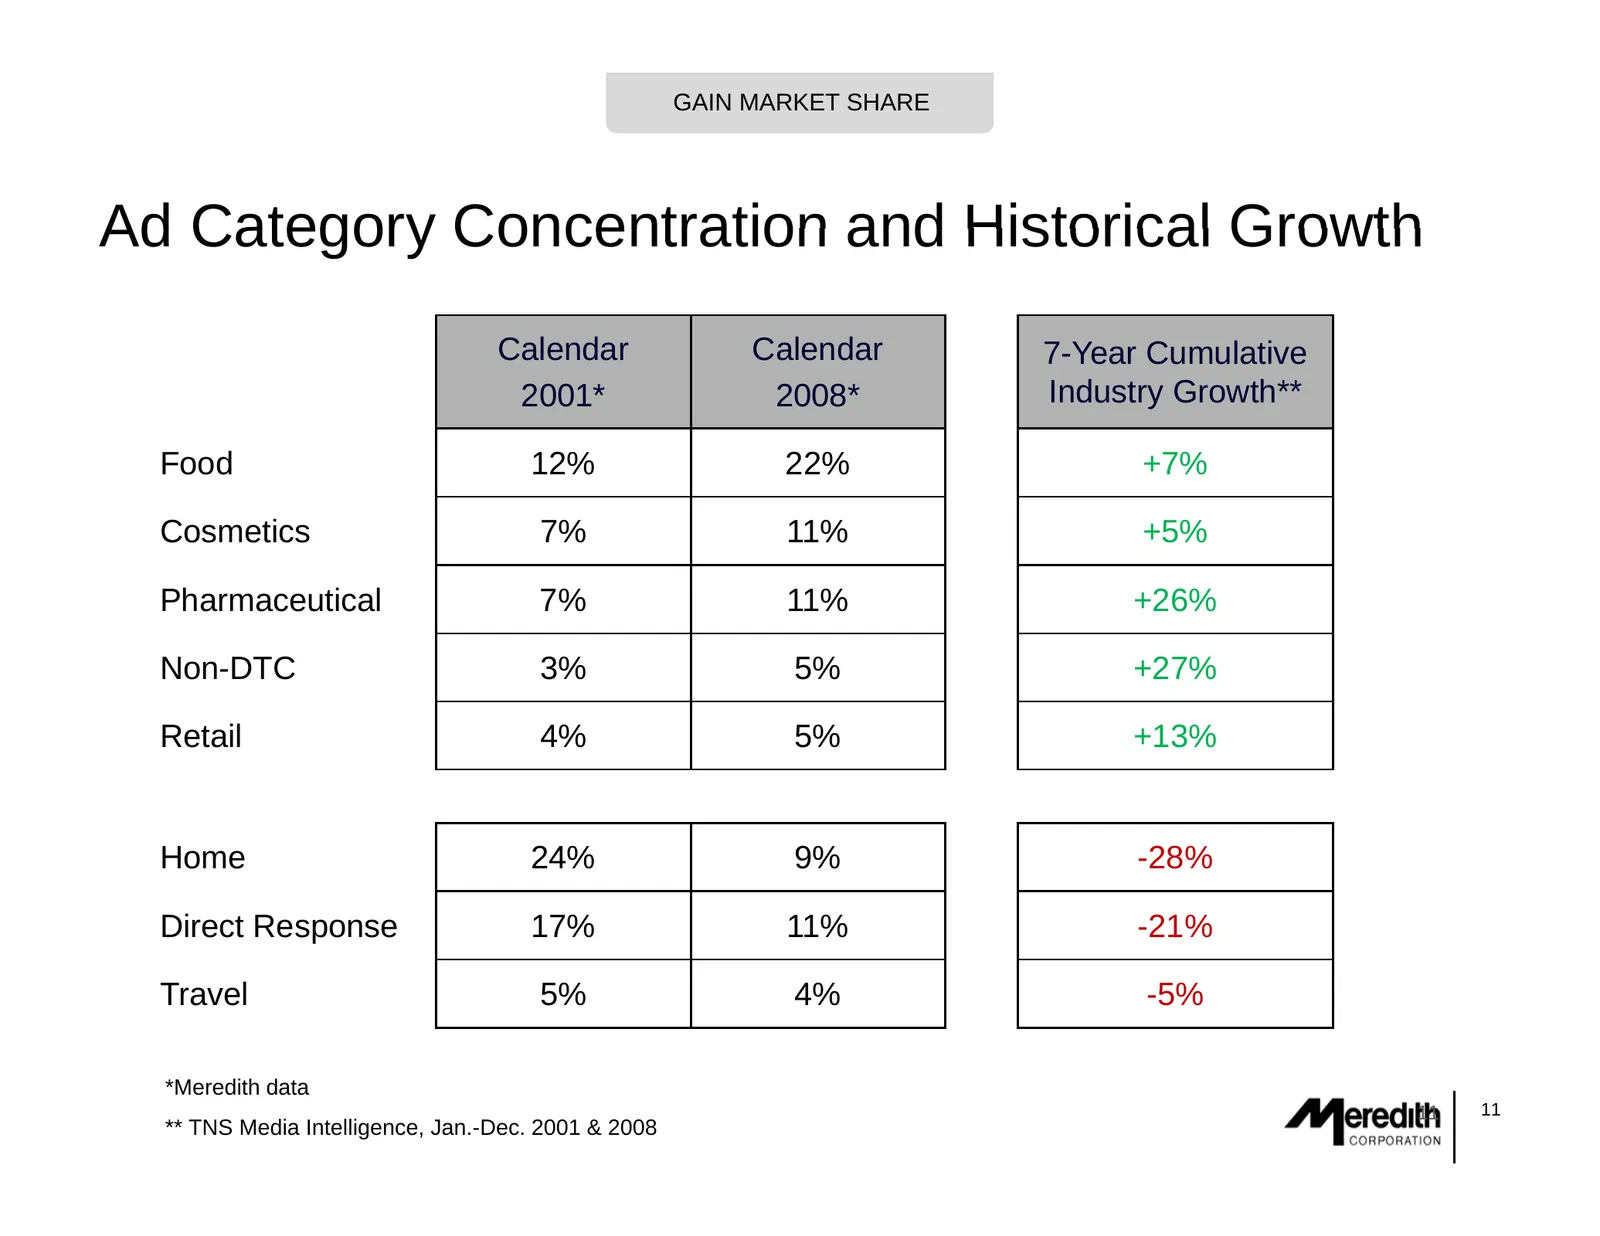
GAIN MARKET SHARE Ad Category Concentration and Historical Growth Calendar Calendar 7-Year Cumulative 2001* 2008* I d t Growth** Industry G th** Food 12% 22% +7% Cosmetics 7% 11% +5% 5% Pharmaceutical 7% 11% +26% Non-DTC 3% 5% +27% Retail 4% 5% +13% H Home 24% 9% -28% 28% Direct Response 17% 11% -21
Slide 12: Corporate Sales Strategies
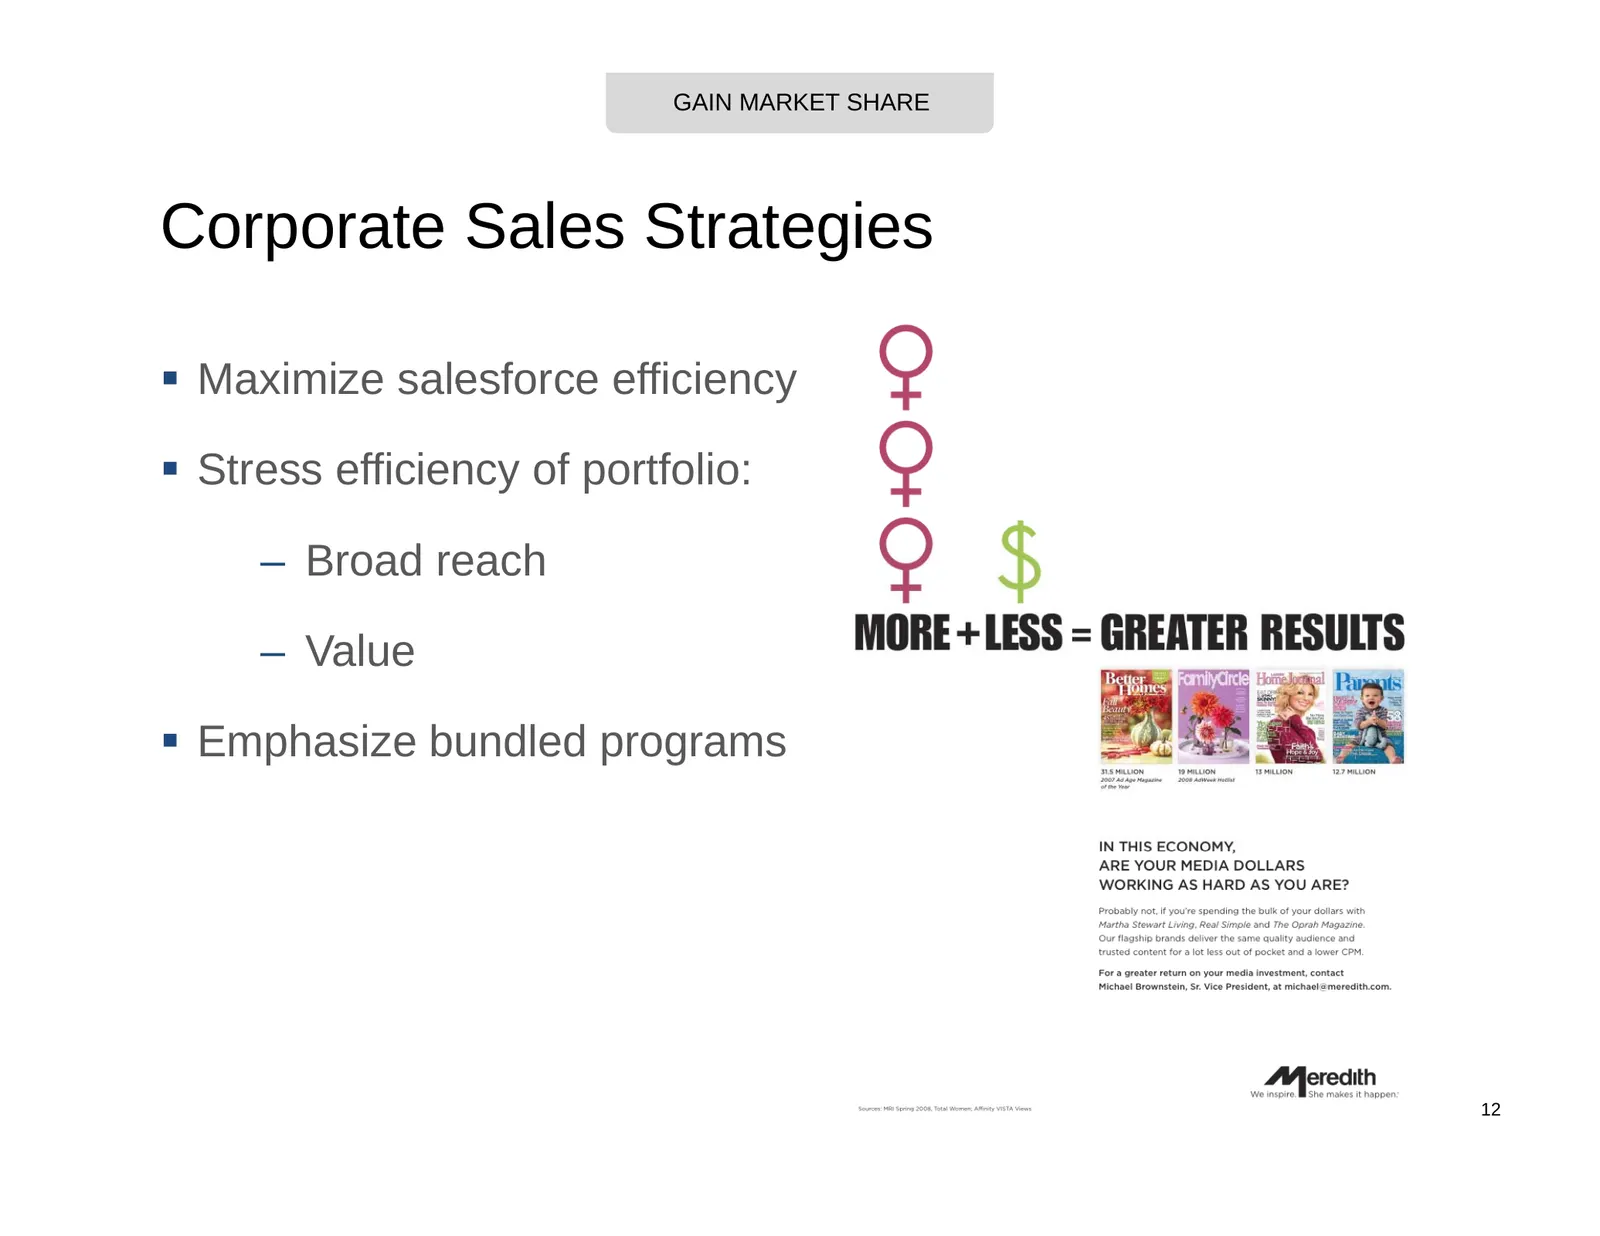
GAIN MARKET SHARE Corporate Sales Strategies Maximize salesforce efficiency Stress efficiency of portfolio: – Broad reach – Value Emphasize bundled programs 12
Slide 13: Strategic Sales Strategies
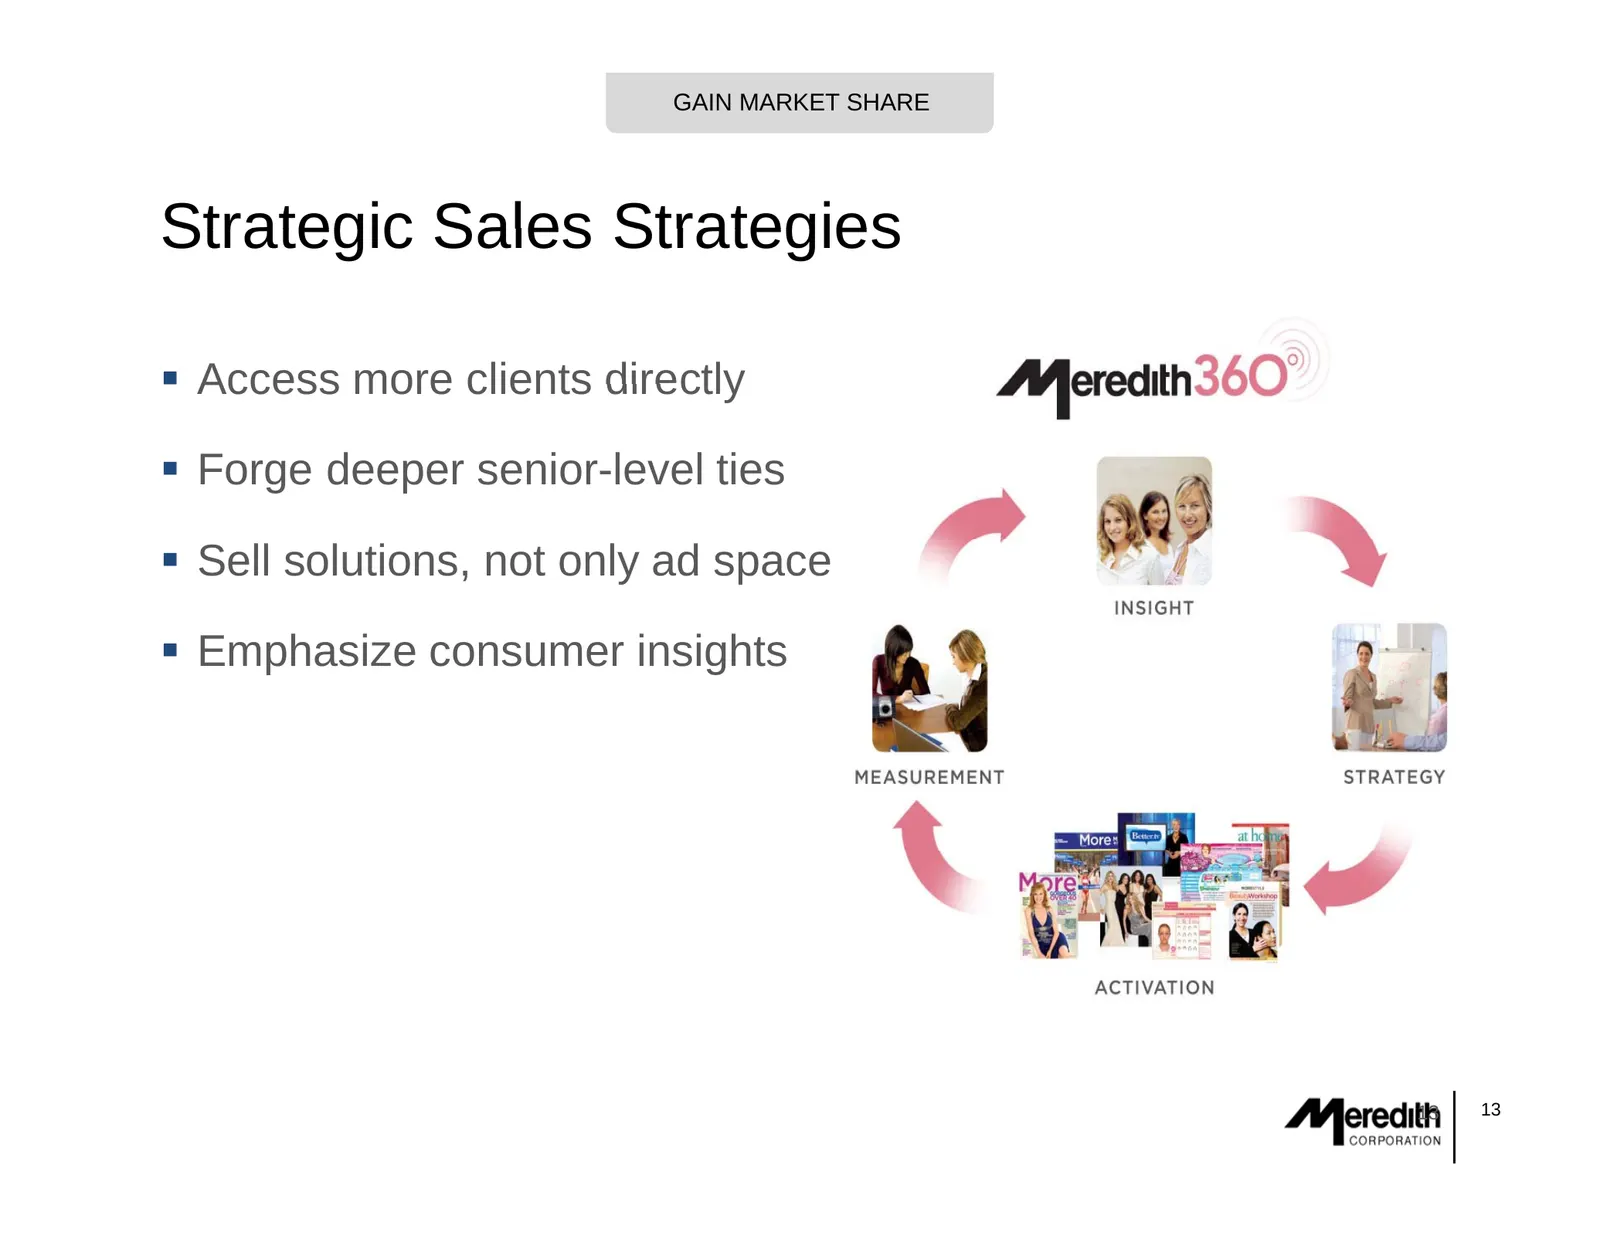
GAIN MARKET SHARE Strategic Sales Strategies Access more clients directly Forge deeper senior-level ties Sell solutions, not only ad space Emphasize consumer insights 13 13
Slide 14: Diverse Local Portfolio in Fast-Growing Markets
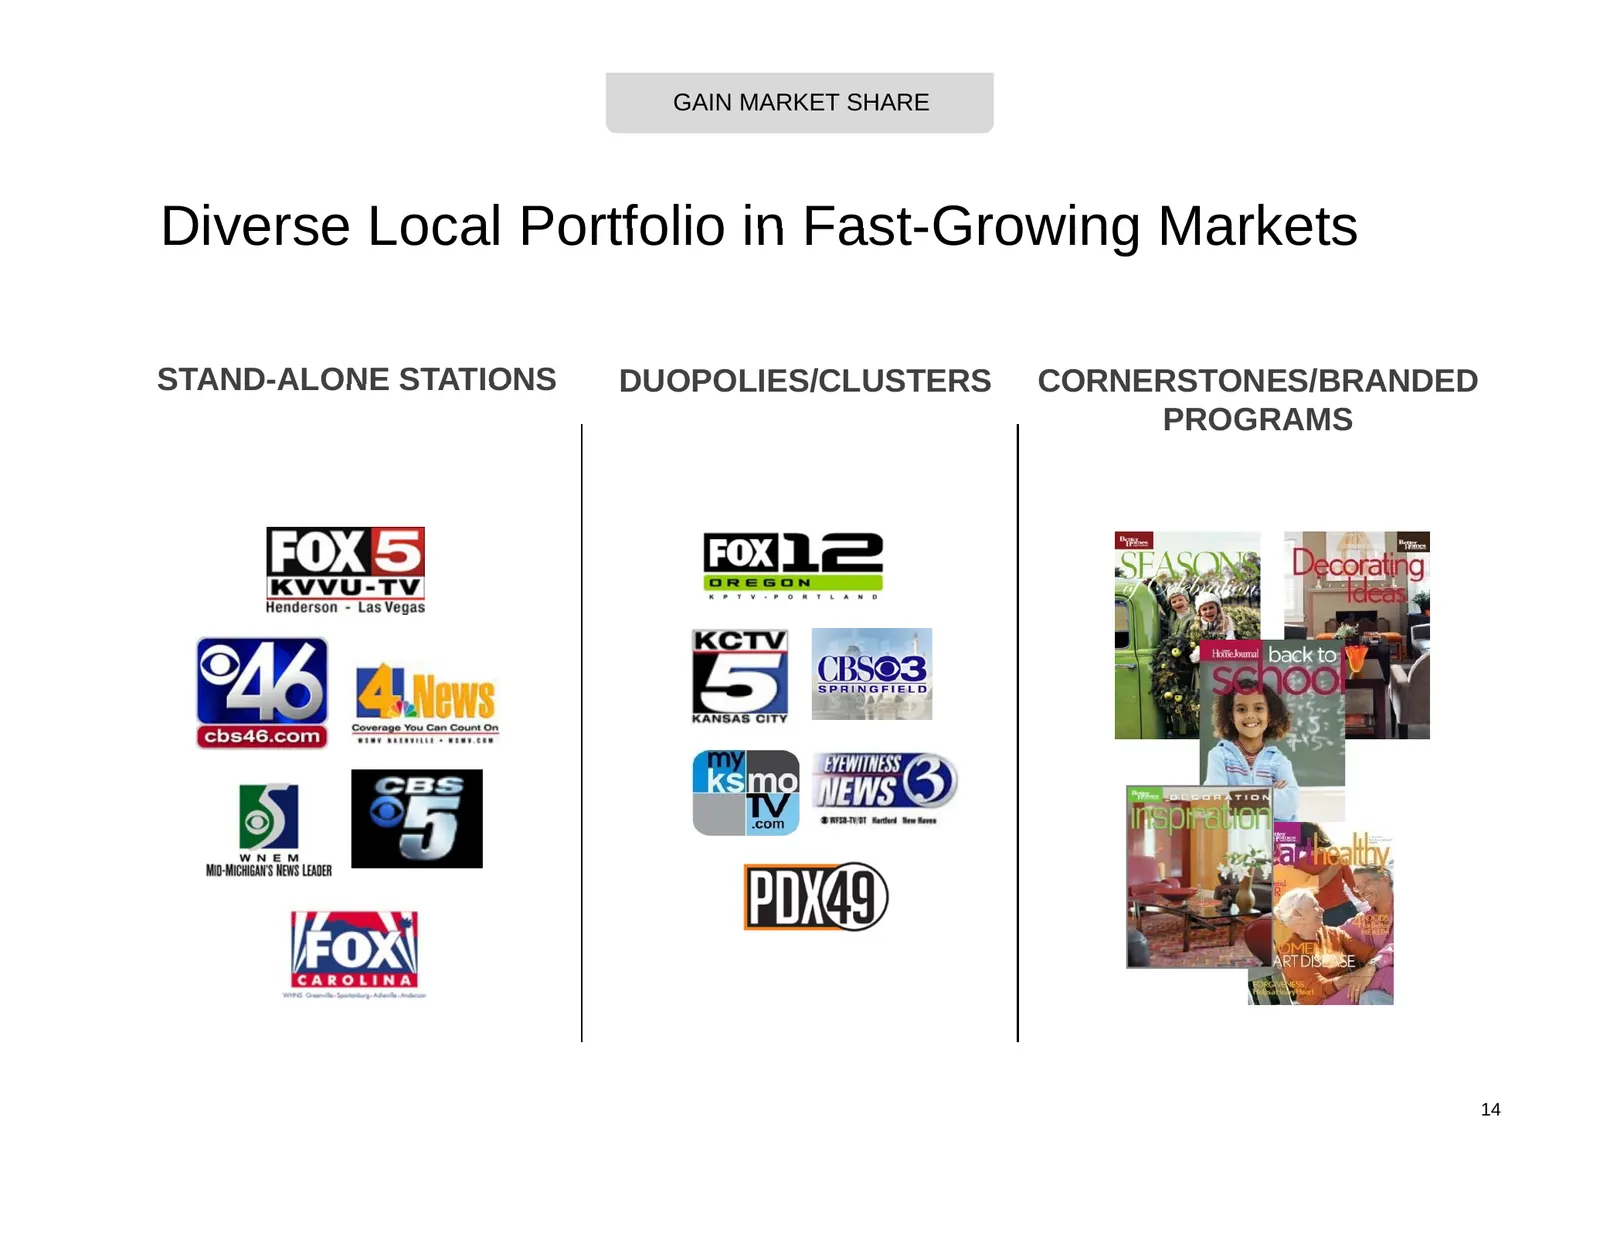
GAIN MARKET SHARE Diverse Local Portfolio in Fast-Growing Markets STAND-ALONE STAND ALONE STATIONS DUOPOLIES/CLUSTERS CORNERSTONES/BRANDED PROGRAMS 14
Slide 15: Strategic Initiatives to Grow Local Revenues
GAIN MARKET SHARE Strategic Initiatives to Grow Local Revenues Expand and improve news Increase and monetize ratings Grow core advertising revenues – Special sales initiatives – Contests and incentives Emphasize proprietary and new programs – Cornerstones – Job Connections – Product Integrat
Slide 16: Strong Growth in Ratings
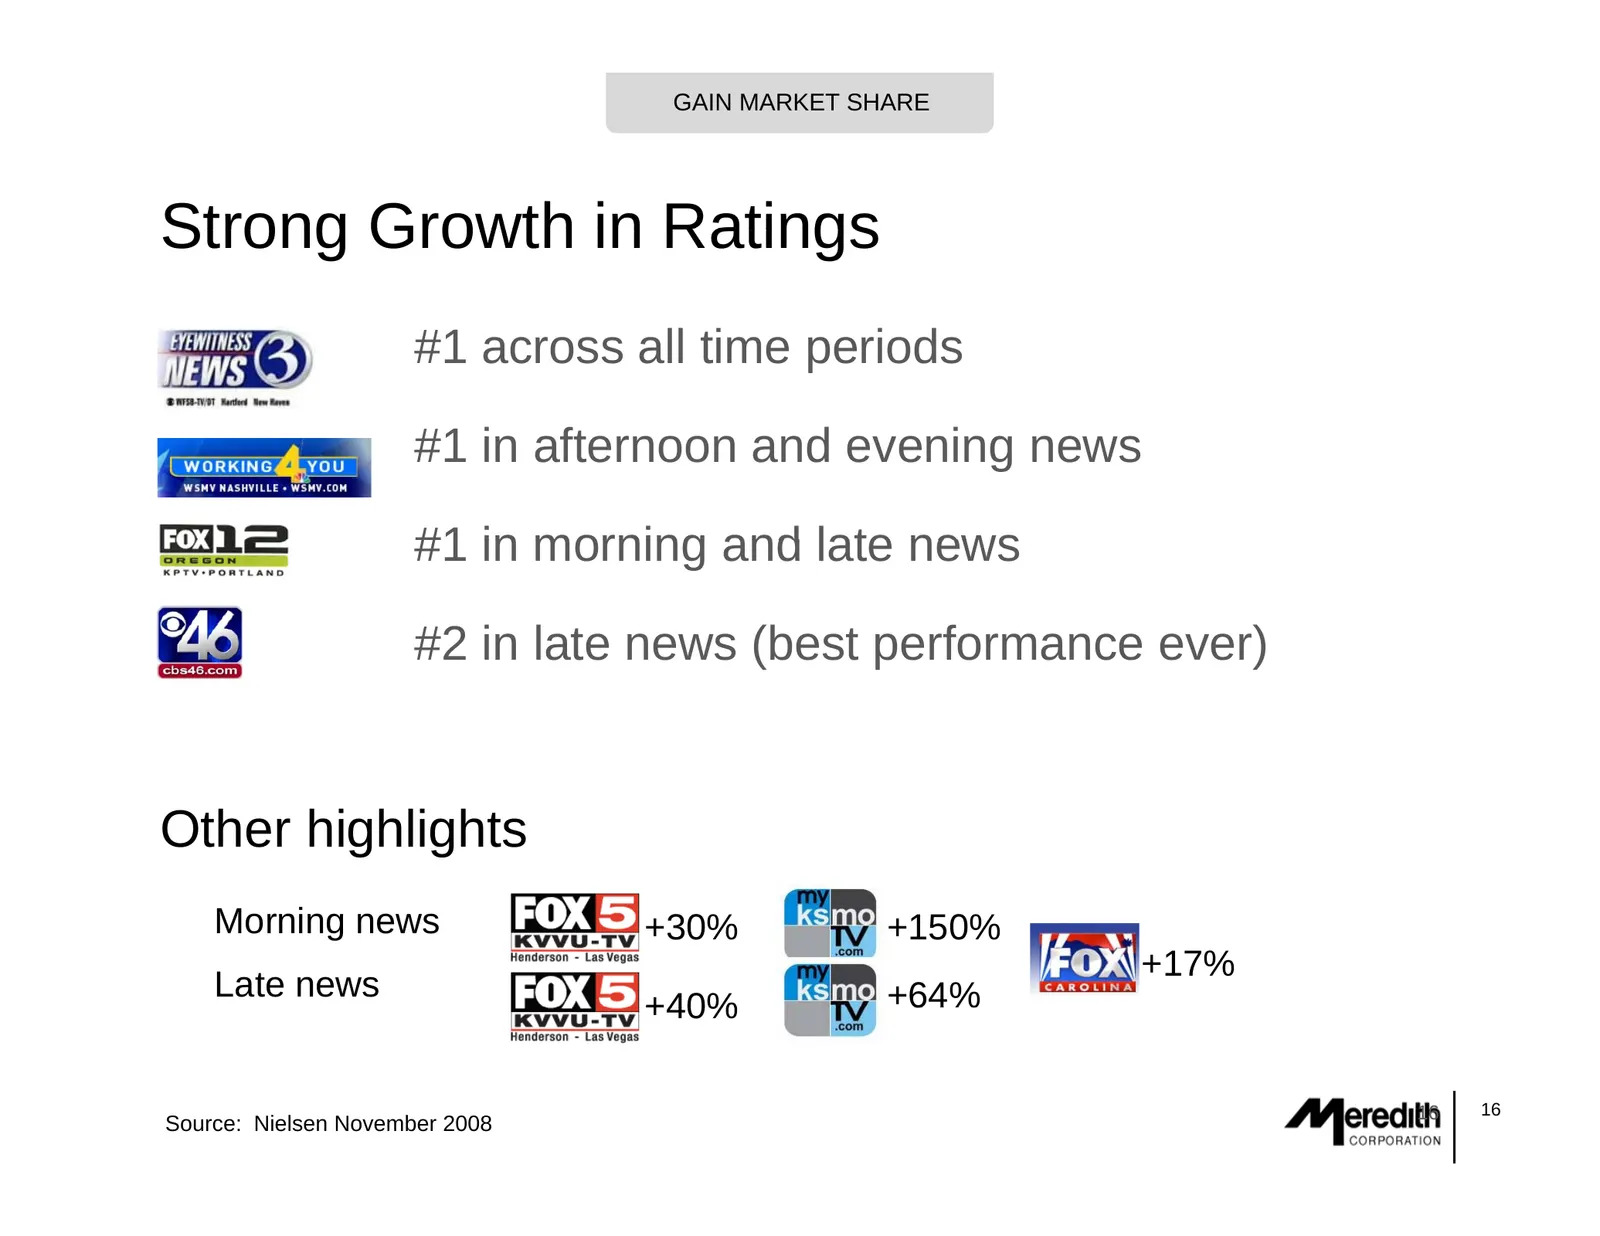
GAIN MARKET SHARE Strong Growth in Ratings #1 across all time periods #1 in afternoon and evening news #1 in morning and late news #2 in late news (best performance ever) Other highlights g g Morning news +30% +150% +17% Late news +64% 64% +40% 16 16 Source: Nielsen November 2008
Slide 17: Agenda: Strategic Initiatives
STRATEGIC OVERVIEW Agenda Meredith Overview Strategic St t i IInitiatives iti ti – Gain market share across businesses – Grow G new revenue streams t – Exercise disciplined expense management Financial Overview 17 17
Slide 18: Growing New Revenue Streams
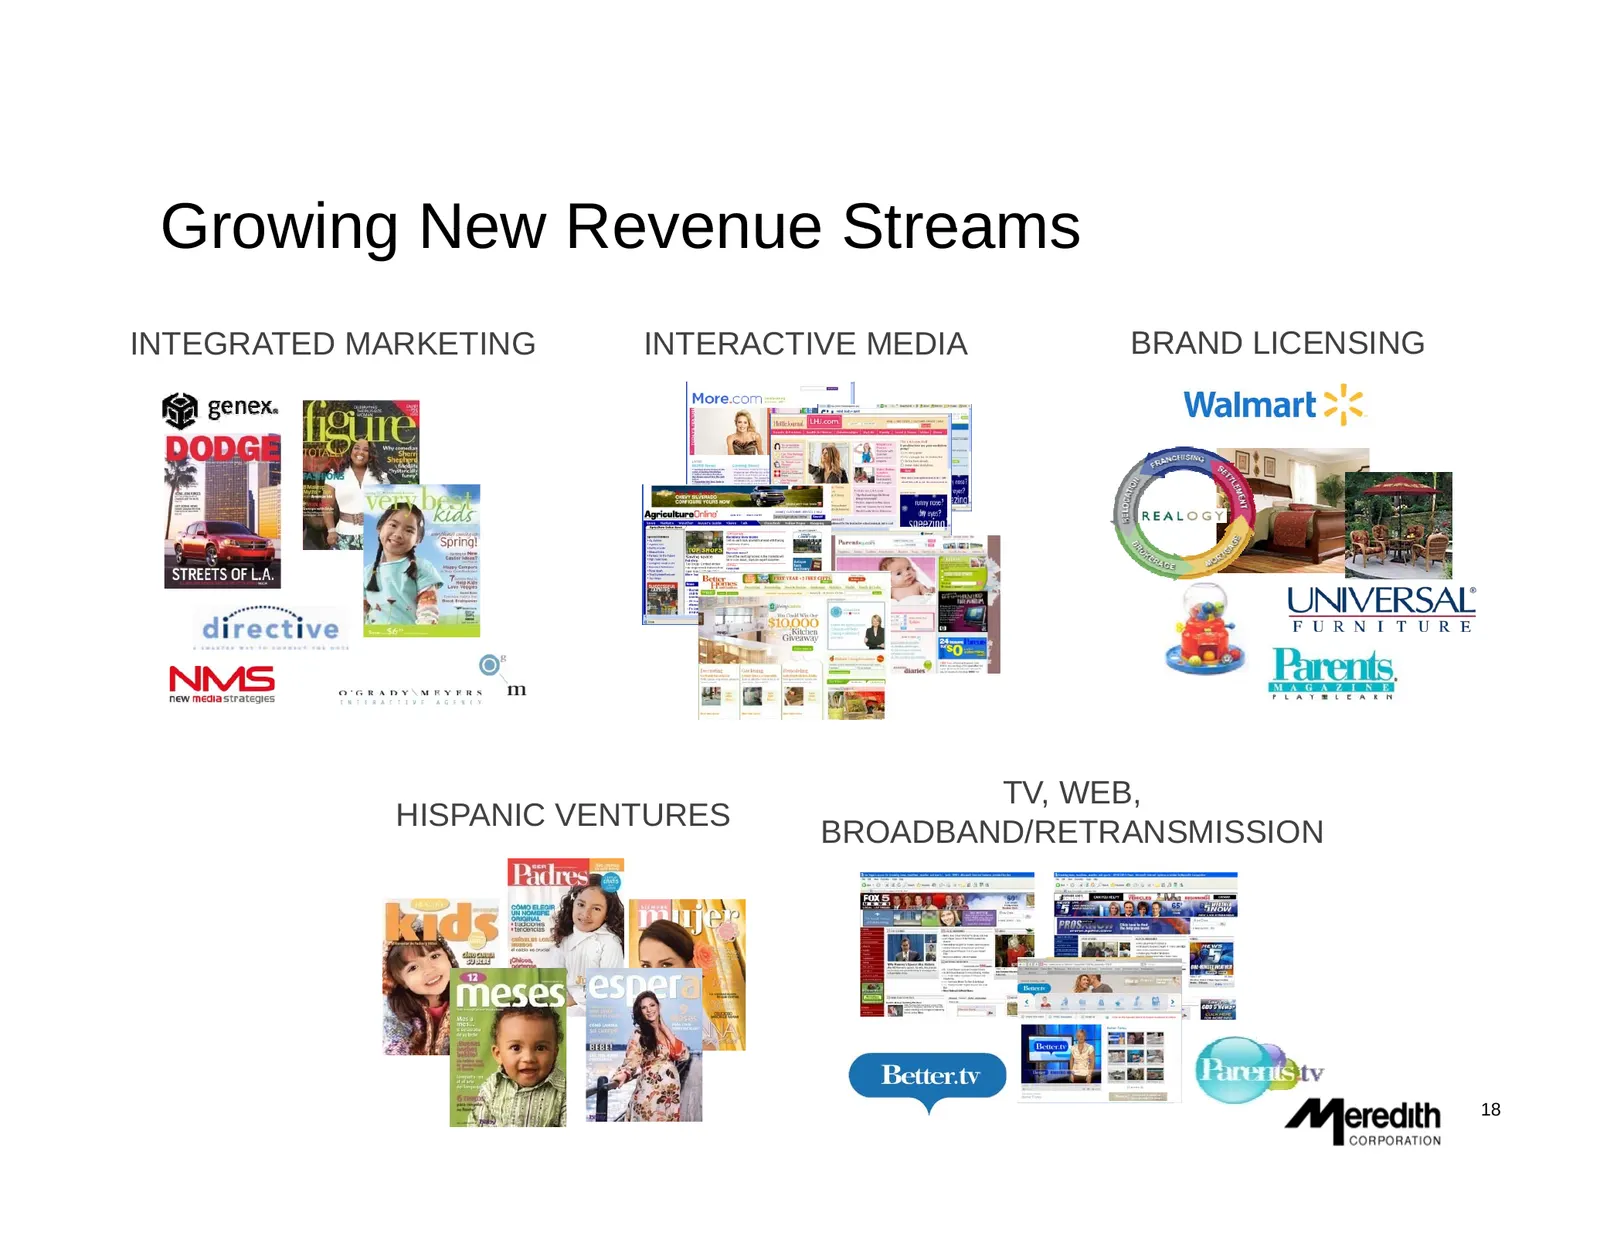
Growing New Revenue Streams INTEGRATED MARKETING INTERACTIVE MEDIA BRAND LICENSING TV, WEB, HISPANIC VENTURES BROADBAND/RETRANSMISSION 18
Slide 19: Meredith Integrated Marketing
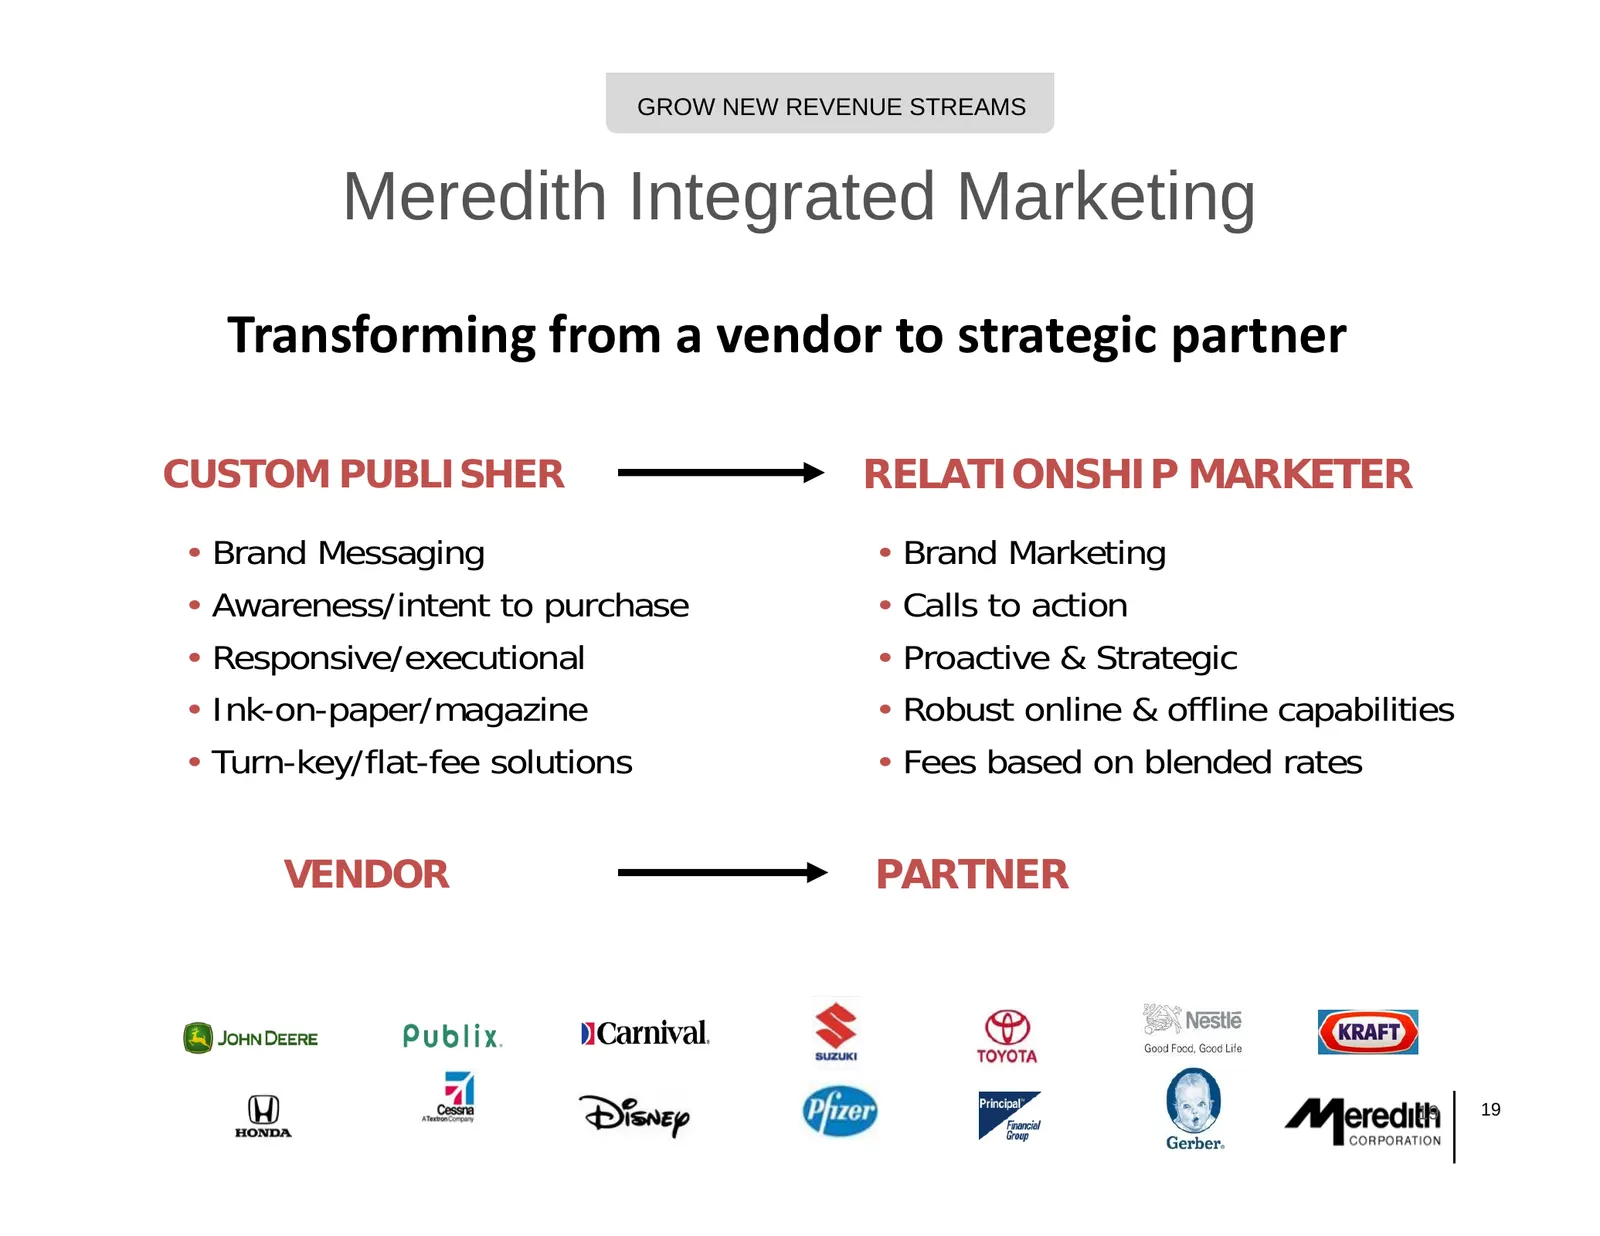
GROW NEW REVENUE STREAMS Meredith Integrated g Marketing g Transforming from a vendor to strategic partner CUSTOM PUBLISHER RELATIONSHIP MARKETER • Brand B dM Messagingi • Brand B dM Marketing k ti • Awareness/intent to purchase • Calls to action • Responsive/executional • Proactive & Strategic • In
Slide 20: Boost Online Presence and Grow Revenues
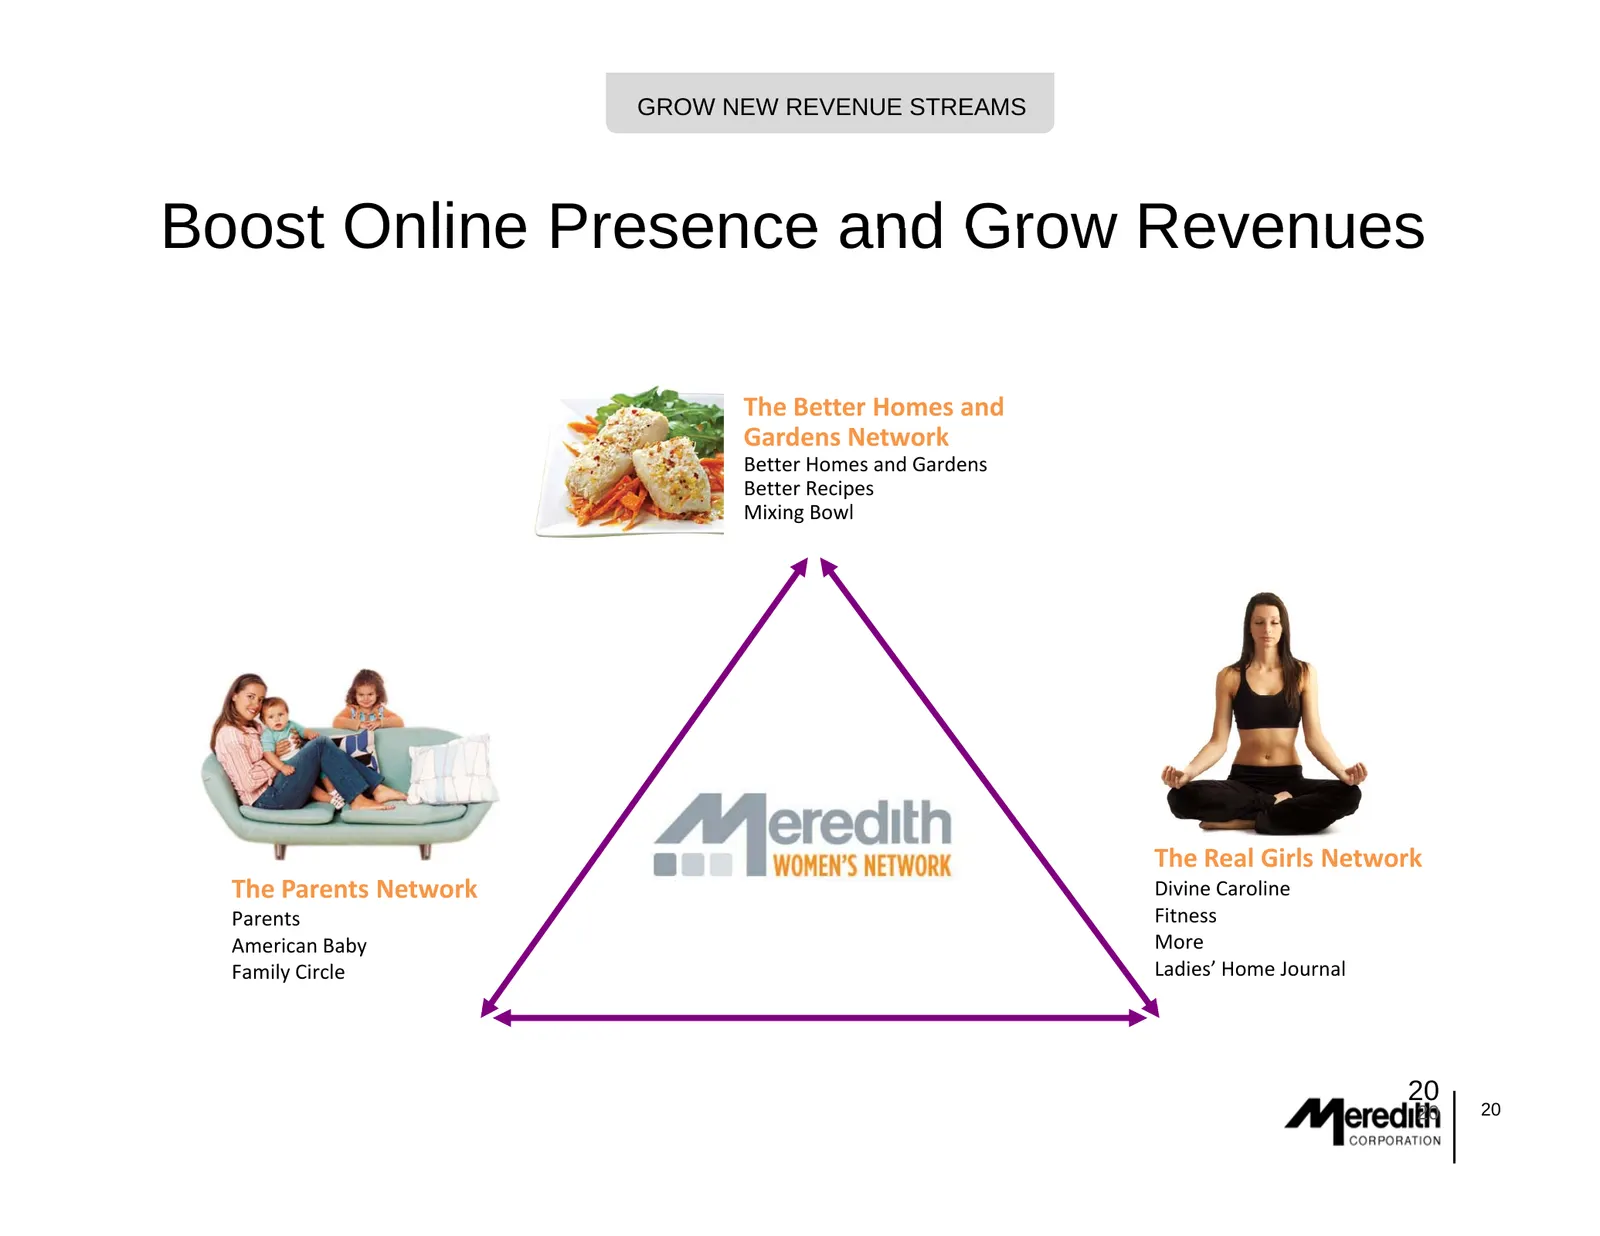
GROW NEW REVENUE STREAMS Boost Online Presence and Grow Revenues The Better Homes and Gardens Network Better Homes and Gardens Better Recipes Mixing Bowl Th Real The R l Girls Gi l Network N t k The Parents Network Divine Caroline Parents Fitness American Baby More Family Circle Ladies’ Home Journal
Slide 21: Grow Brand Licensing
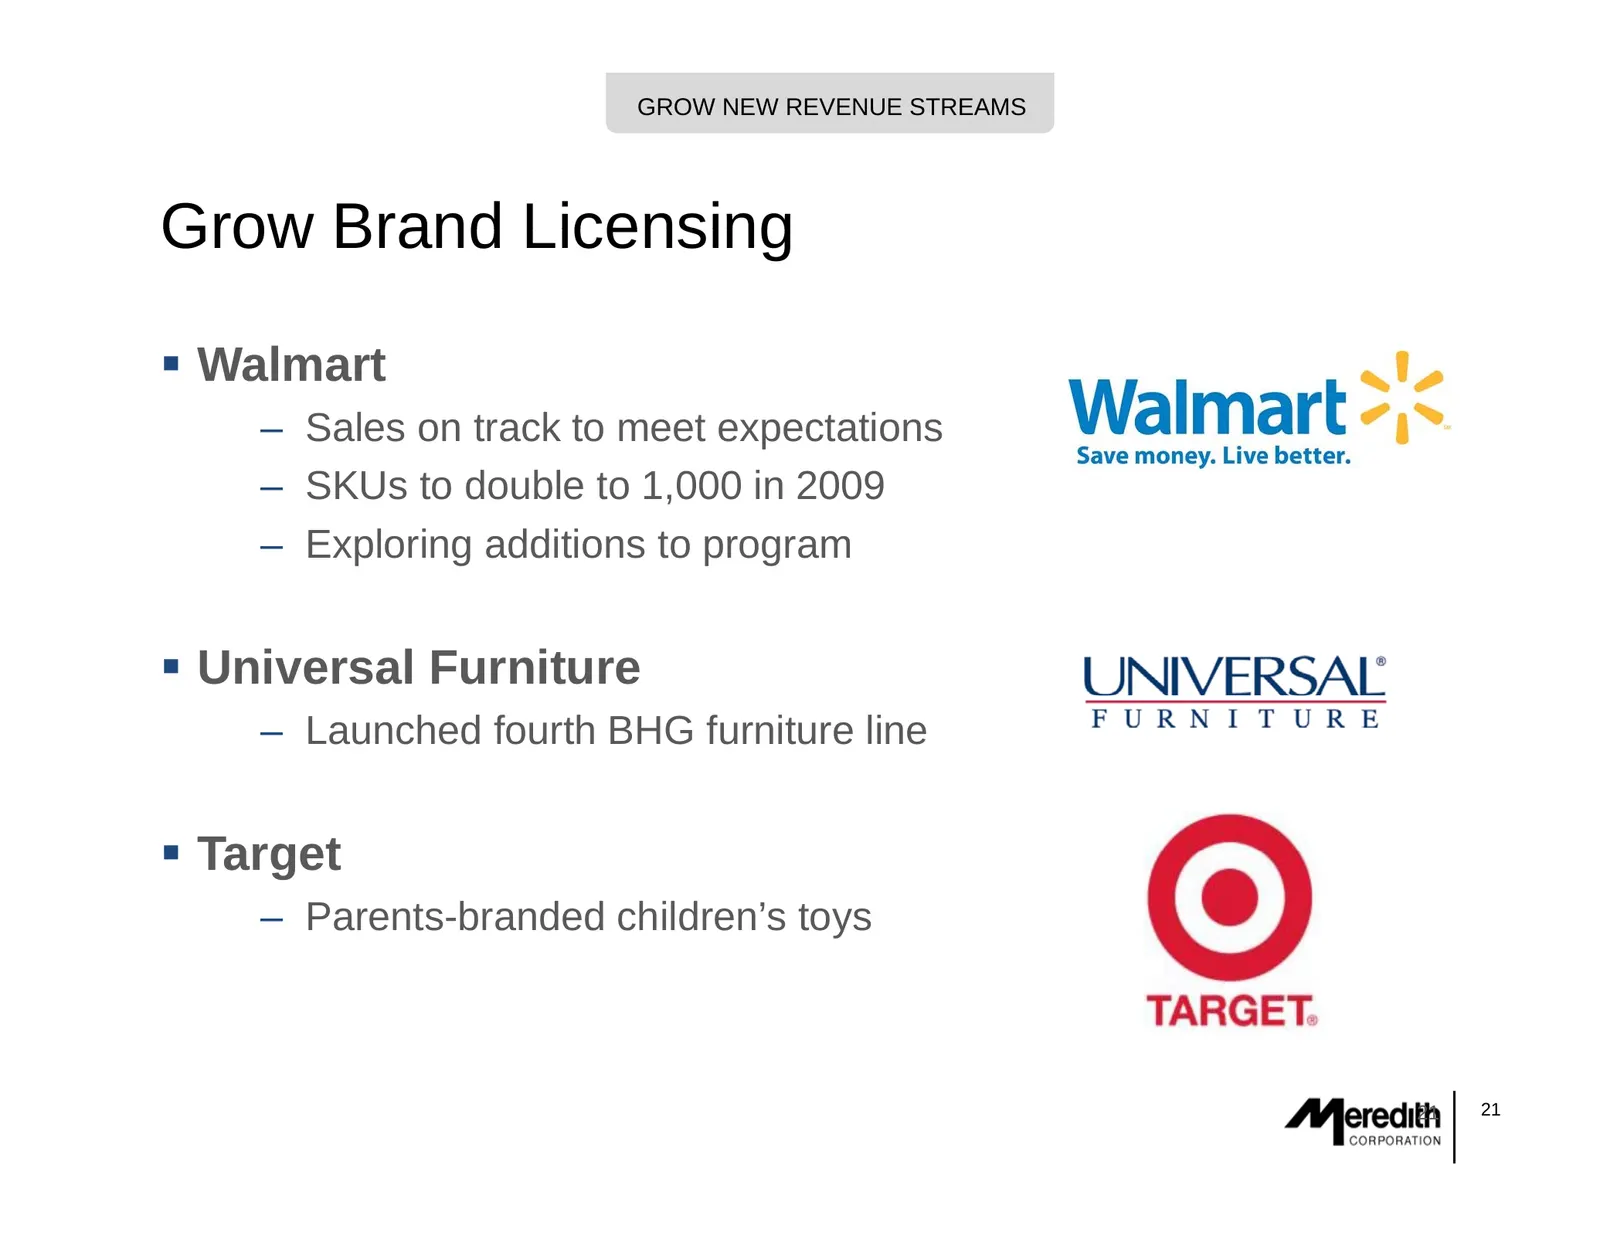
GROW NEW REVENUE STREAMS Grow Brand Licensing Walmart – Sales on track to meet expectations – SKUs to double to 1,000 in 2009 – Exploring additions to program Universal Furniture – Launched fourth BHG furniture line Target – Parents-branded children’s toys 21 21
Slide 22: Increase TV Retransmission Revenues
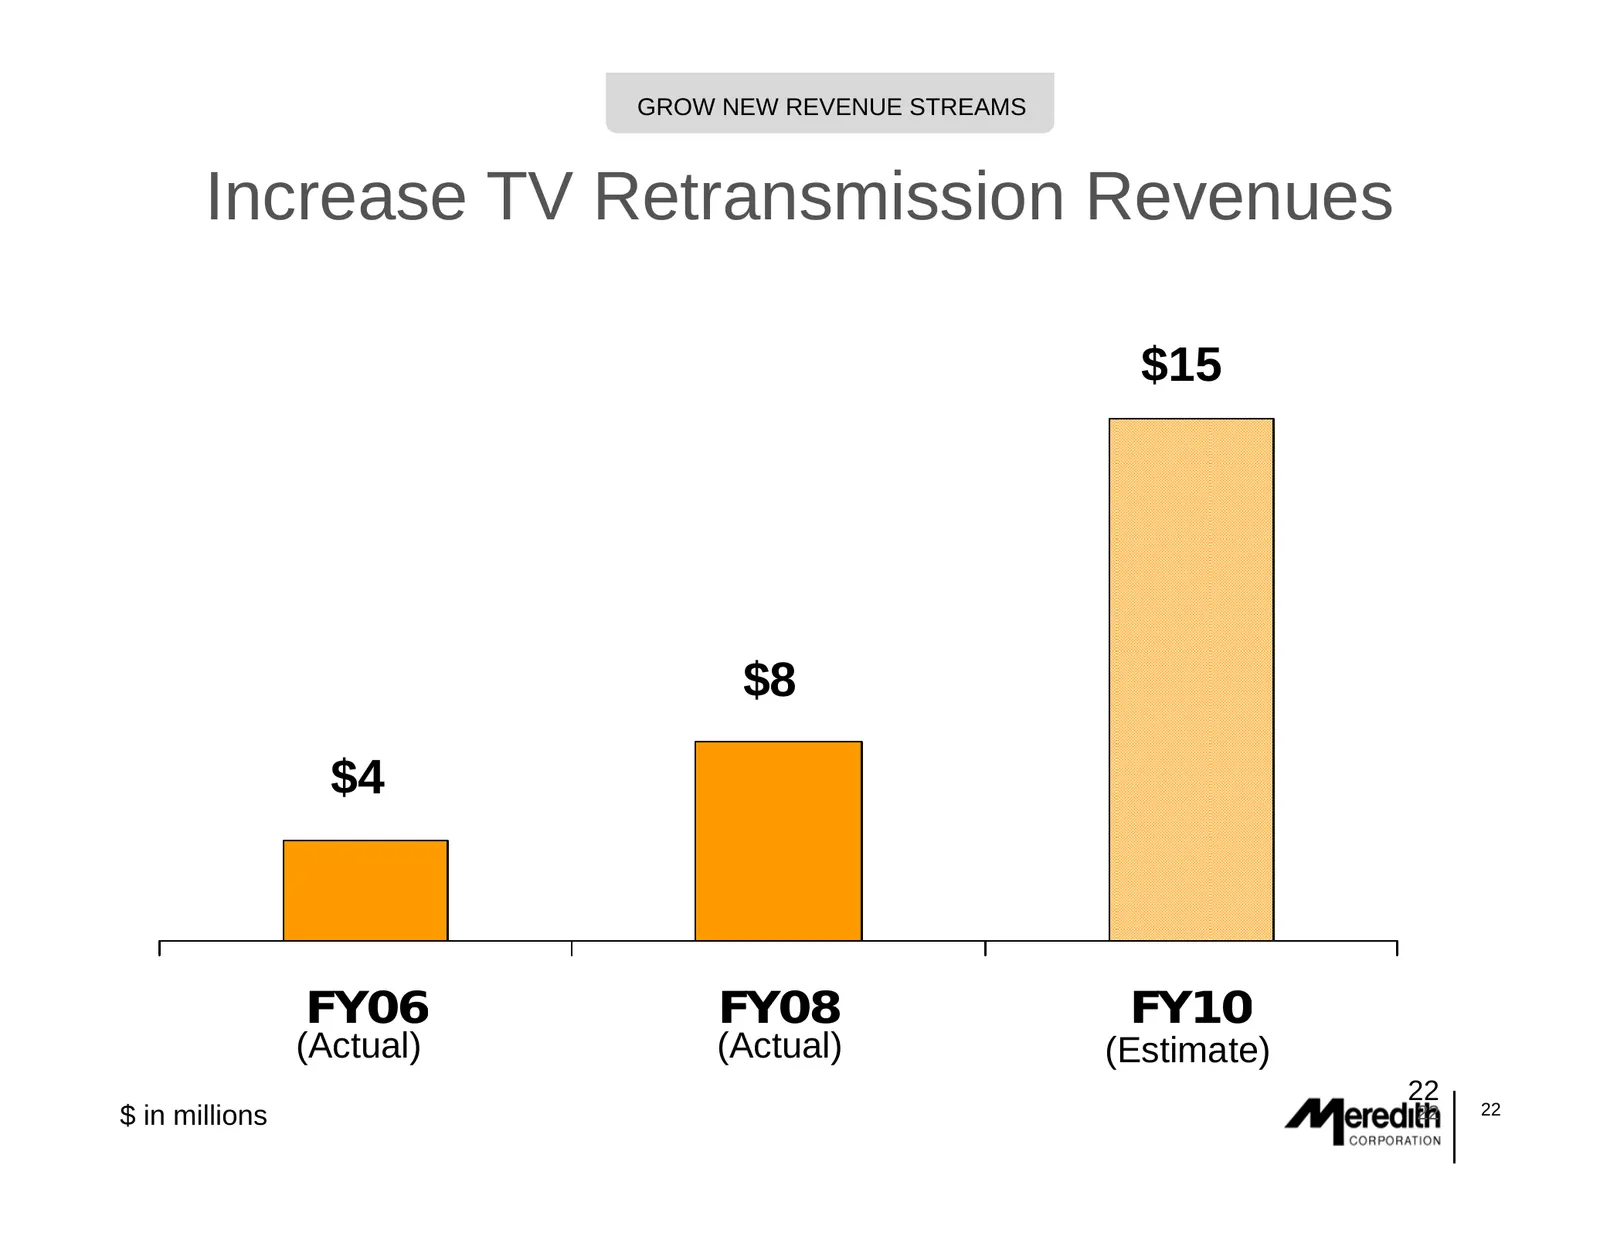
GROW NEW REVENUE STREAMS Increase TV Retransmission Revenues $ $15 $8 $4 FY06 FY08 FY10 (Actual) (Actual) (Estimate) 22 22 $ in millions 22
Slide 23: Agenda: Strategic Initiatives
STRATEGIC OVERVIEW Agenda Meredith Overview Strategic St t i IInitiatives iti ti – Gain market share across businesses – Grow G new revenue streams t – Exercise disciplined expense management Financial Overview 23 23
Slide 24: Disciplined Expense Management: Actions Taken
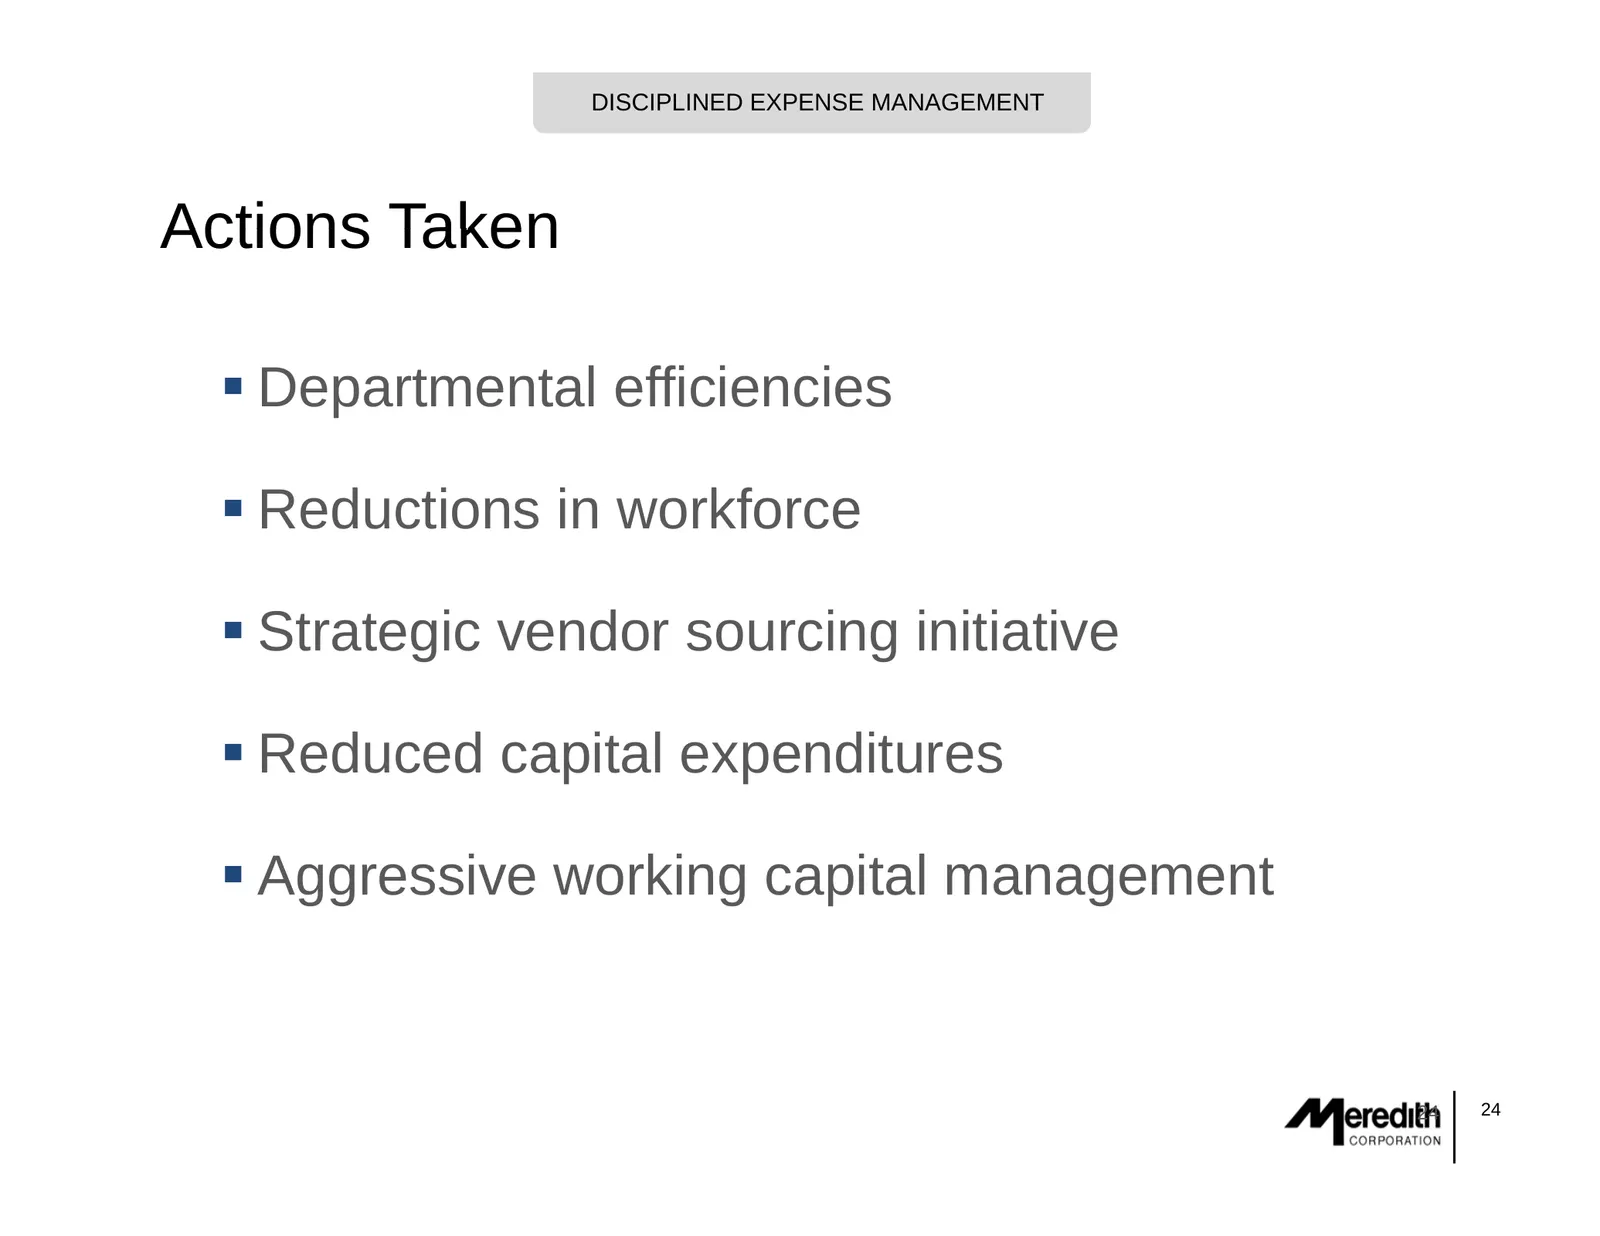
DISCIPLINED EXPENSE MANAGEMENT Actions Taken Departmental efficiencies Reductions in workforce Strategic vendor sourcing initiative Reduced capital expenditures Aggressive working capital management 24 24
Slide 25: Agenda: Financial Overview
Agenda Meredith Overview Strategic St t i IInitiatives iti ti Financial Overview 25 25
Slide 26: Strong Operating Cash Flow
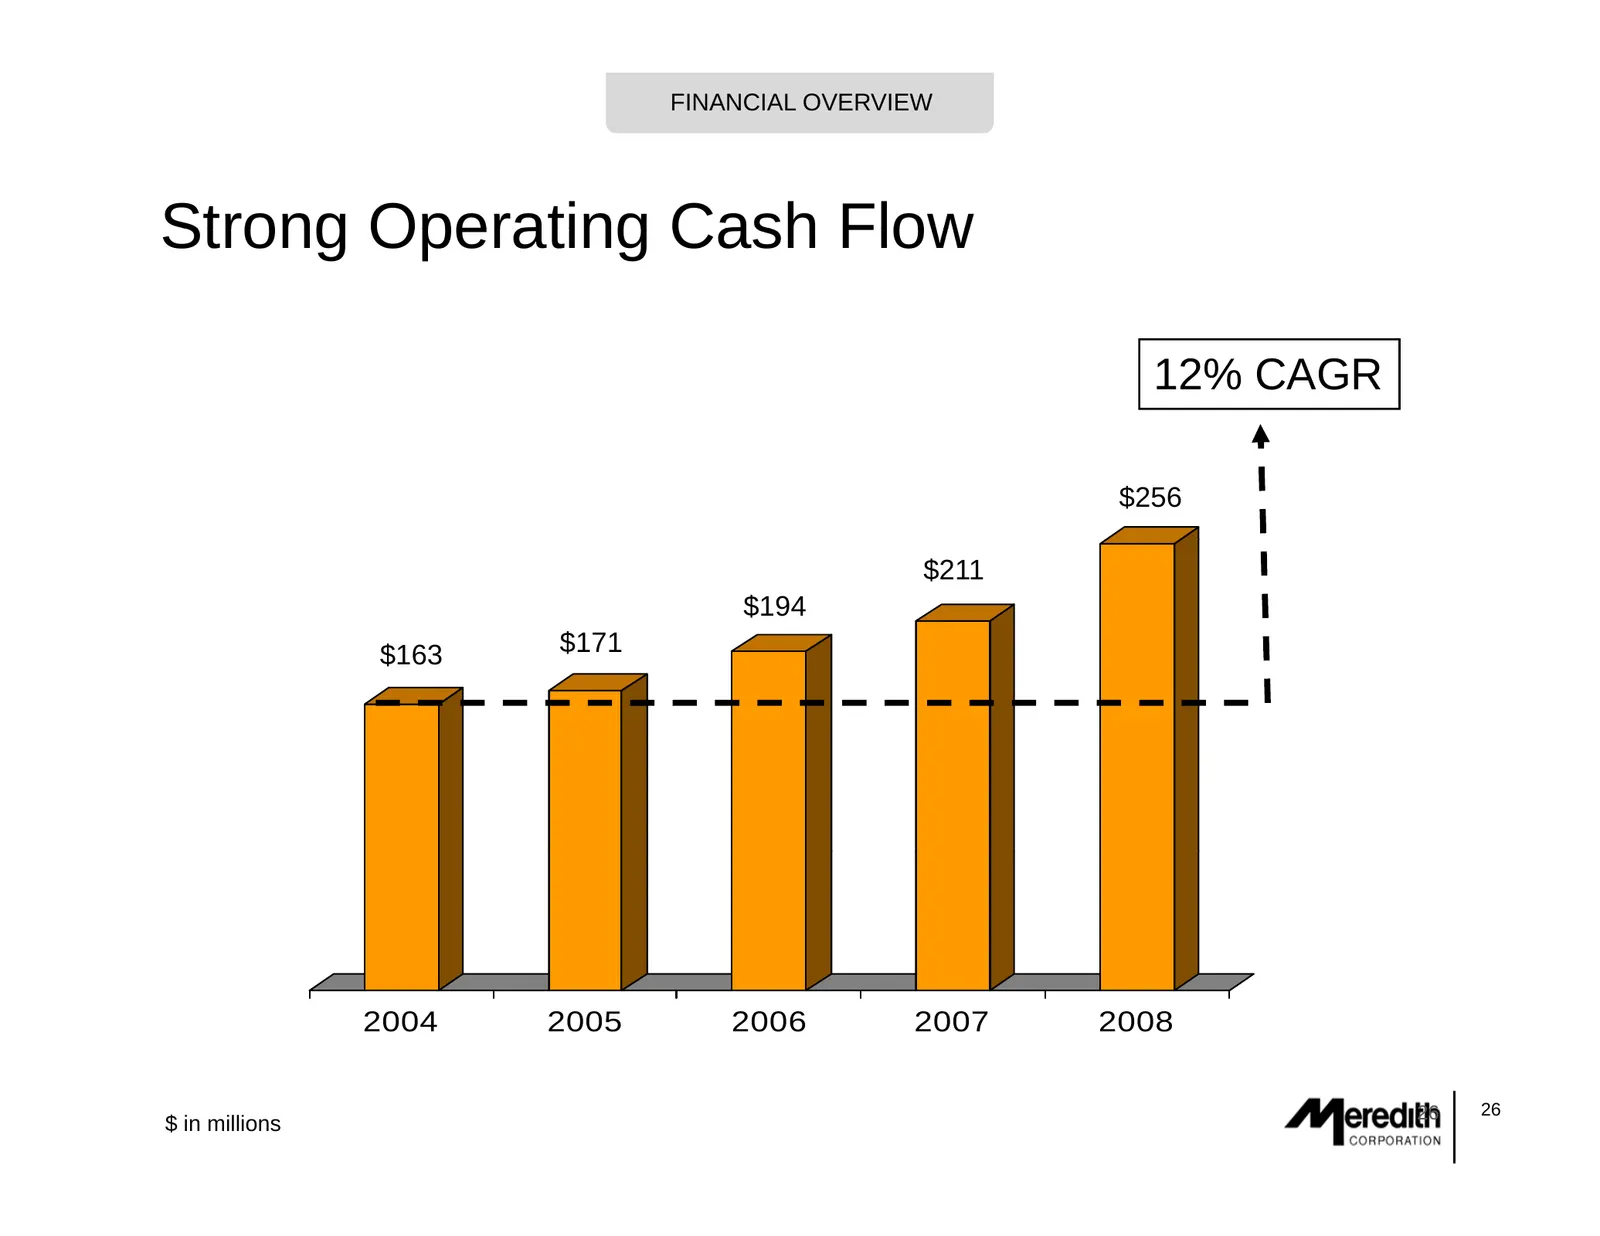
FINANCIAL OVERVIEW Strong Operating Cash Flow 12% CAGR $256 $211 $194 $163 $171 2004 2005 2006 2007 2008 26 26 $ in millions
Slide 27: Cash Flow Fiscal 1999 through 2008
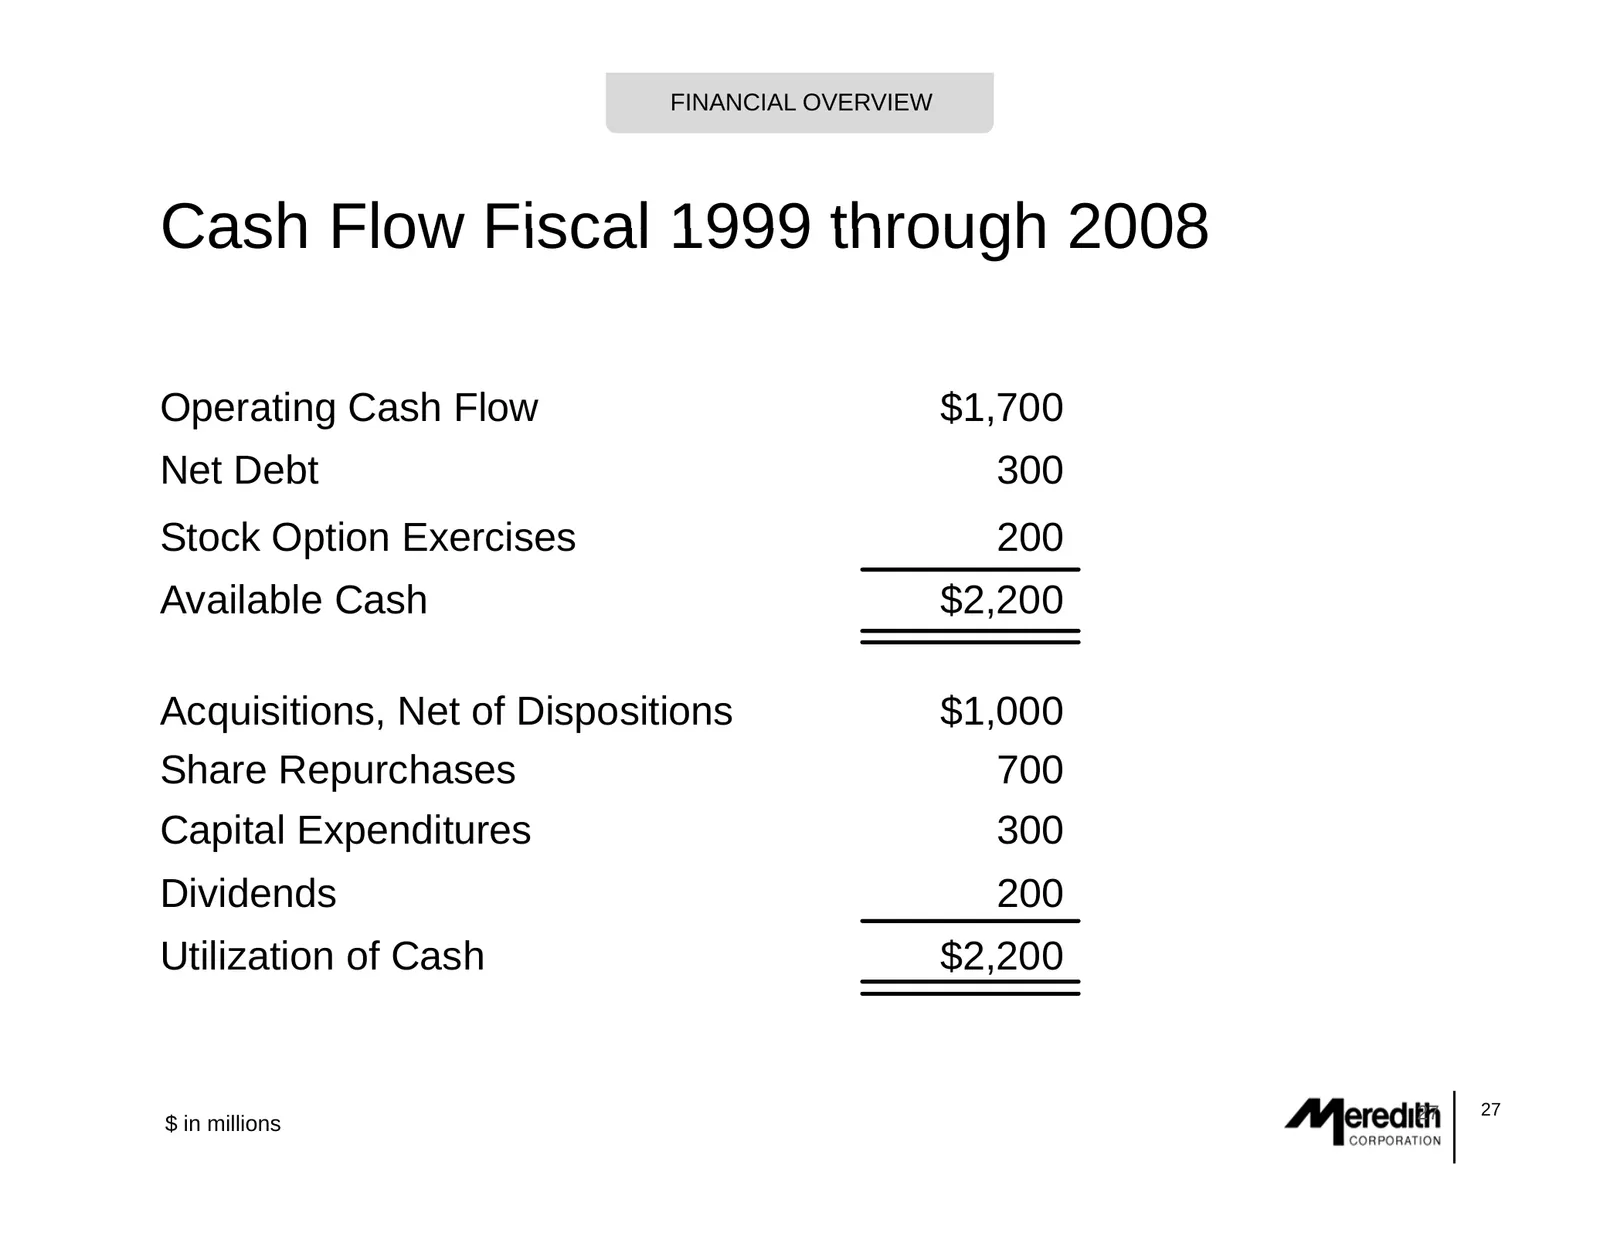
FINANCIAL OVERVIEW Cash Flow Fiscal 1999 through 2008 Operating Cash Flow $1,700 Net Debt 300 Stock Option Exercises 200 Available Cash $2,200 Acquisitions, Net of Dispositions $1,000 $ Share Repurchases 700 Capital p Expenditures p 300 Dividends 200 Utilization of Cash $2,200 27 27 $ in millions
Slide 28: Calendar Year Dividends Per Share
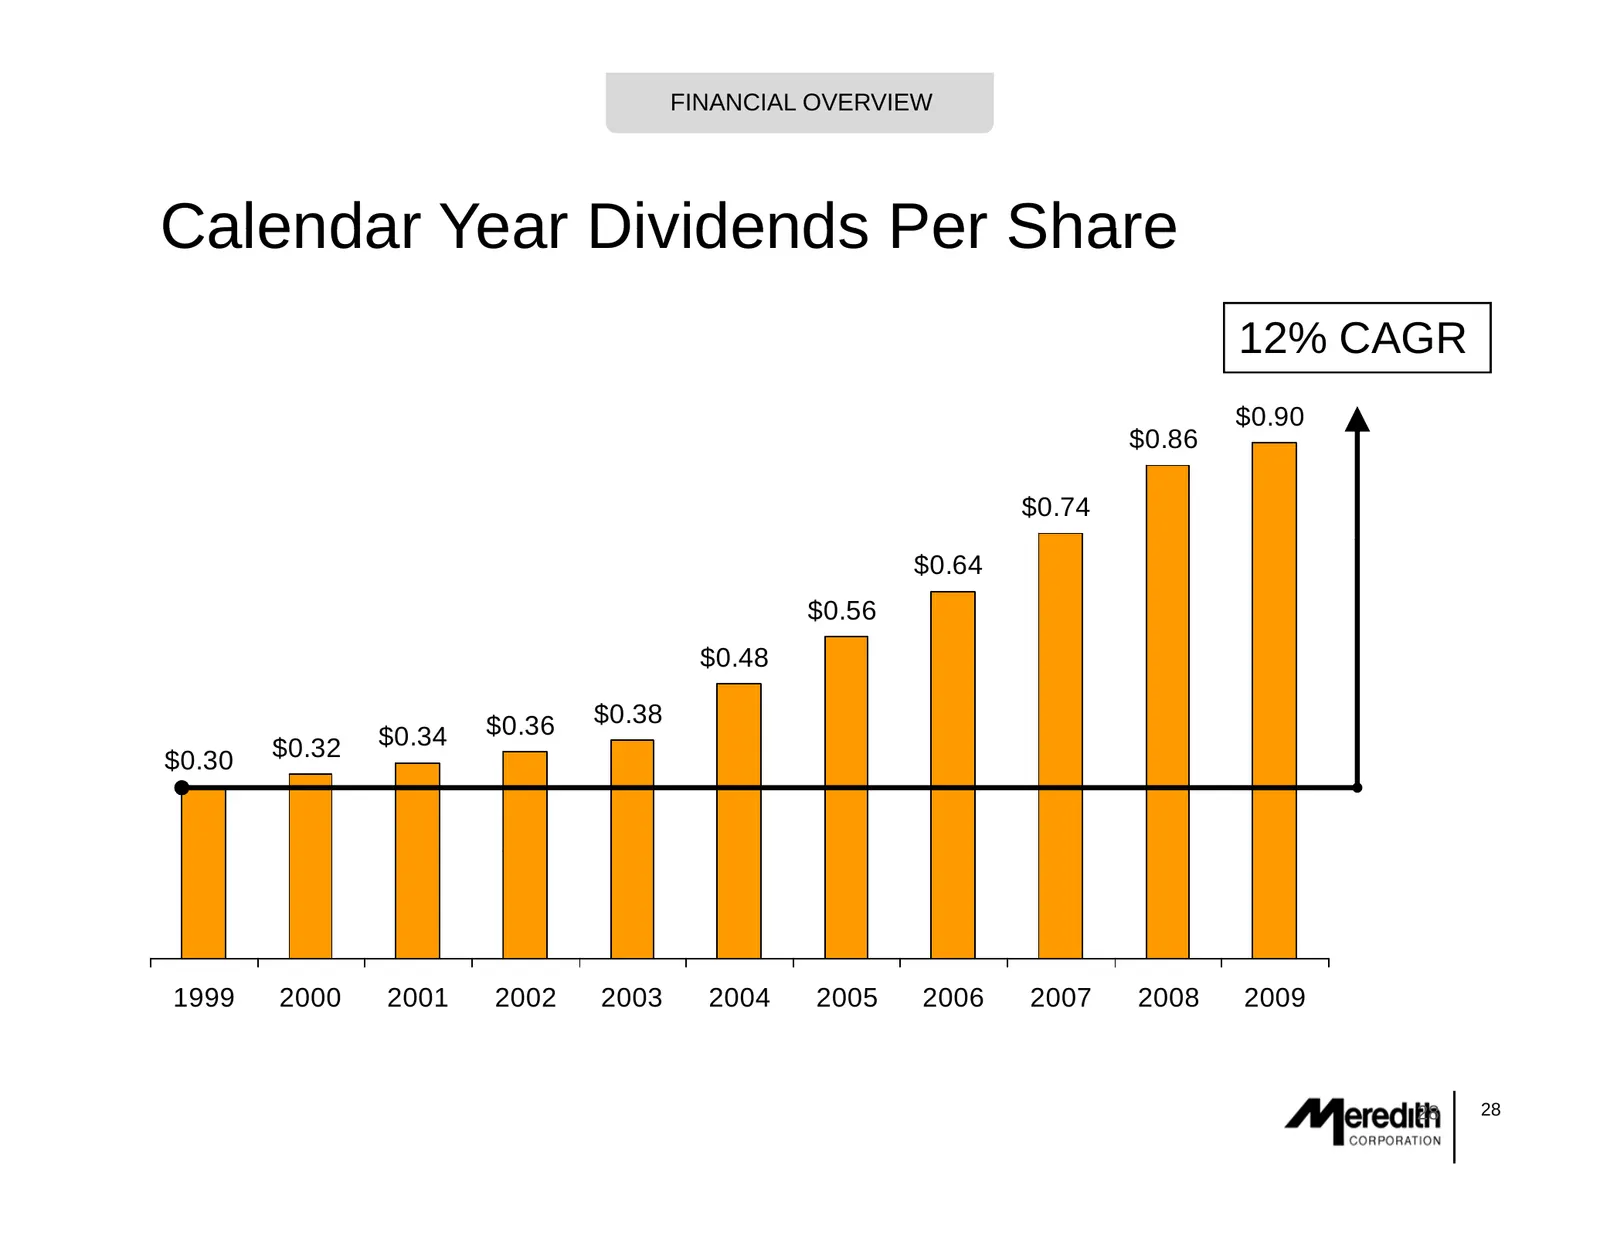
FINANCIAL OVERVIEW Calendar Year Dividends Per Share 12% CAGR $0.90 $0.86 $0.74 $0.64 $0.56 $0.48 $0.36 $0.38 $0.32 $0.34 $0.30 1999 2000 2001 2002 2003 2004 2005 2006 2007 2008 2009 28 28
Slide 29: Conservative Capital Structure
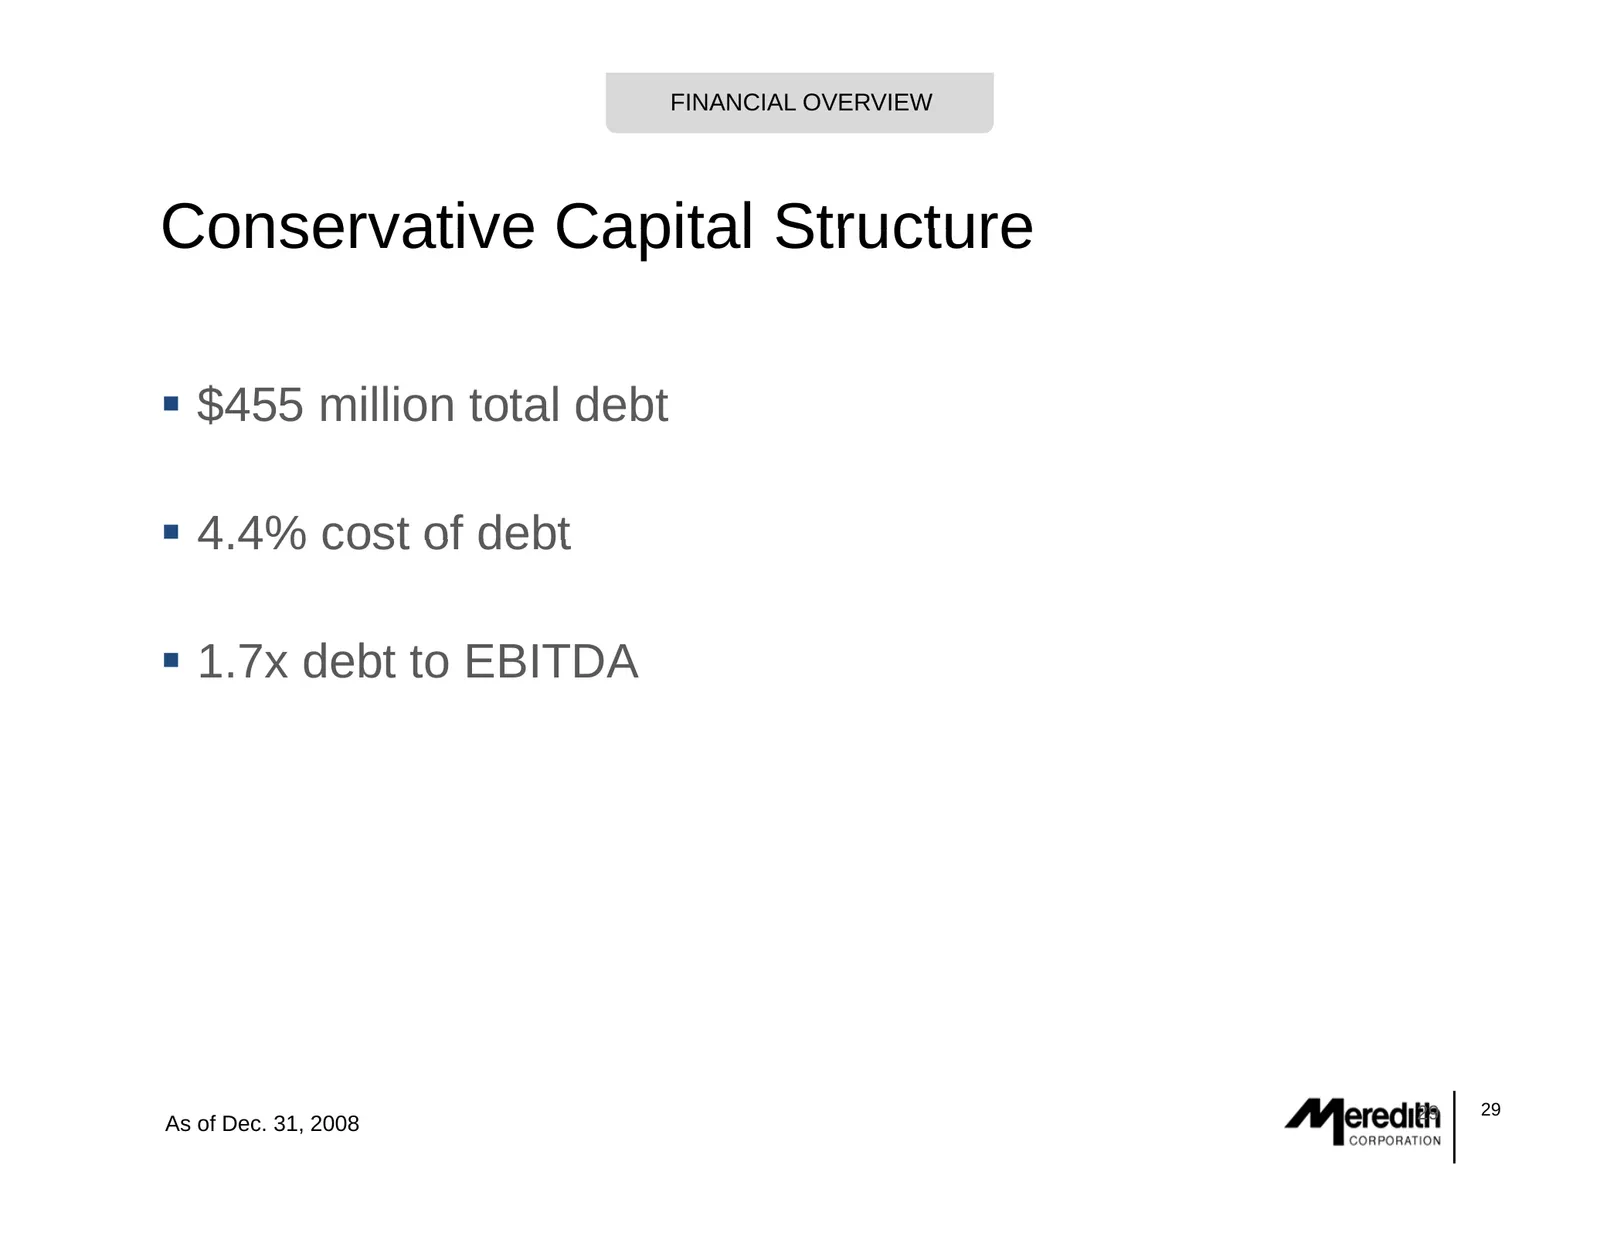
FINANCIAL OVERVIEW Conservative Capital Structure $455 $ million total debt 4.4% 4 4% cost of debt 1.7x debt to EBITDA 29 29 As of Dec. 31, 2008
Slide 30: Current Valuation Metrics
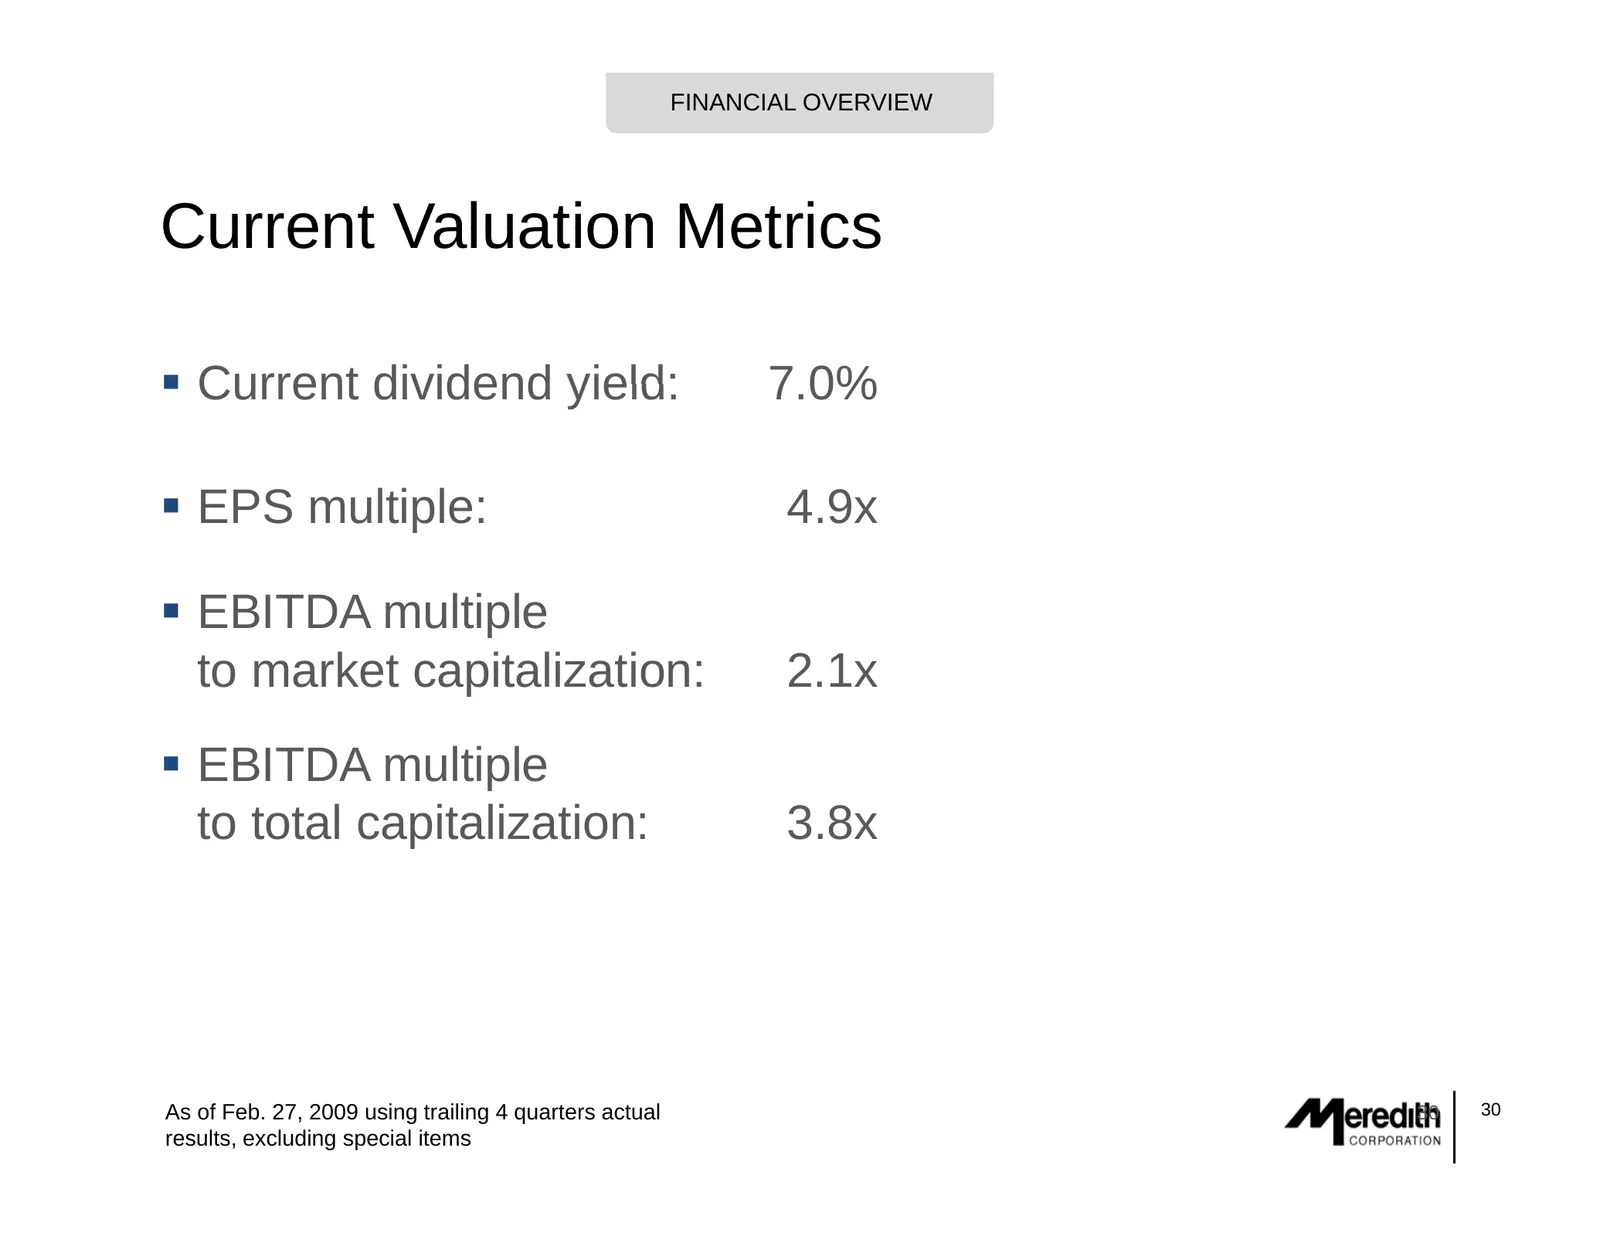
FINANCIAL OVERVIEW Current Valuation Metrics Current dividend yield: 7 0% 7.0% EPS multiple: 4.9x EBITDA multiple to market capitalization: p 2.1x EBITDA multiple to total capitalization: 3.8x As of Feb. 27, 2009 using trailing 4 quarters actual 30 30 results, excluding special items
Slide 31: Summary
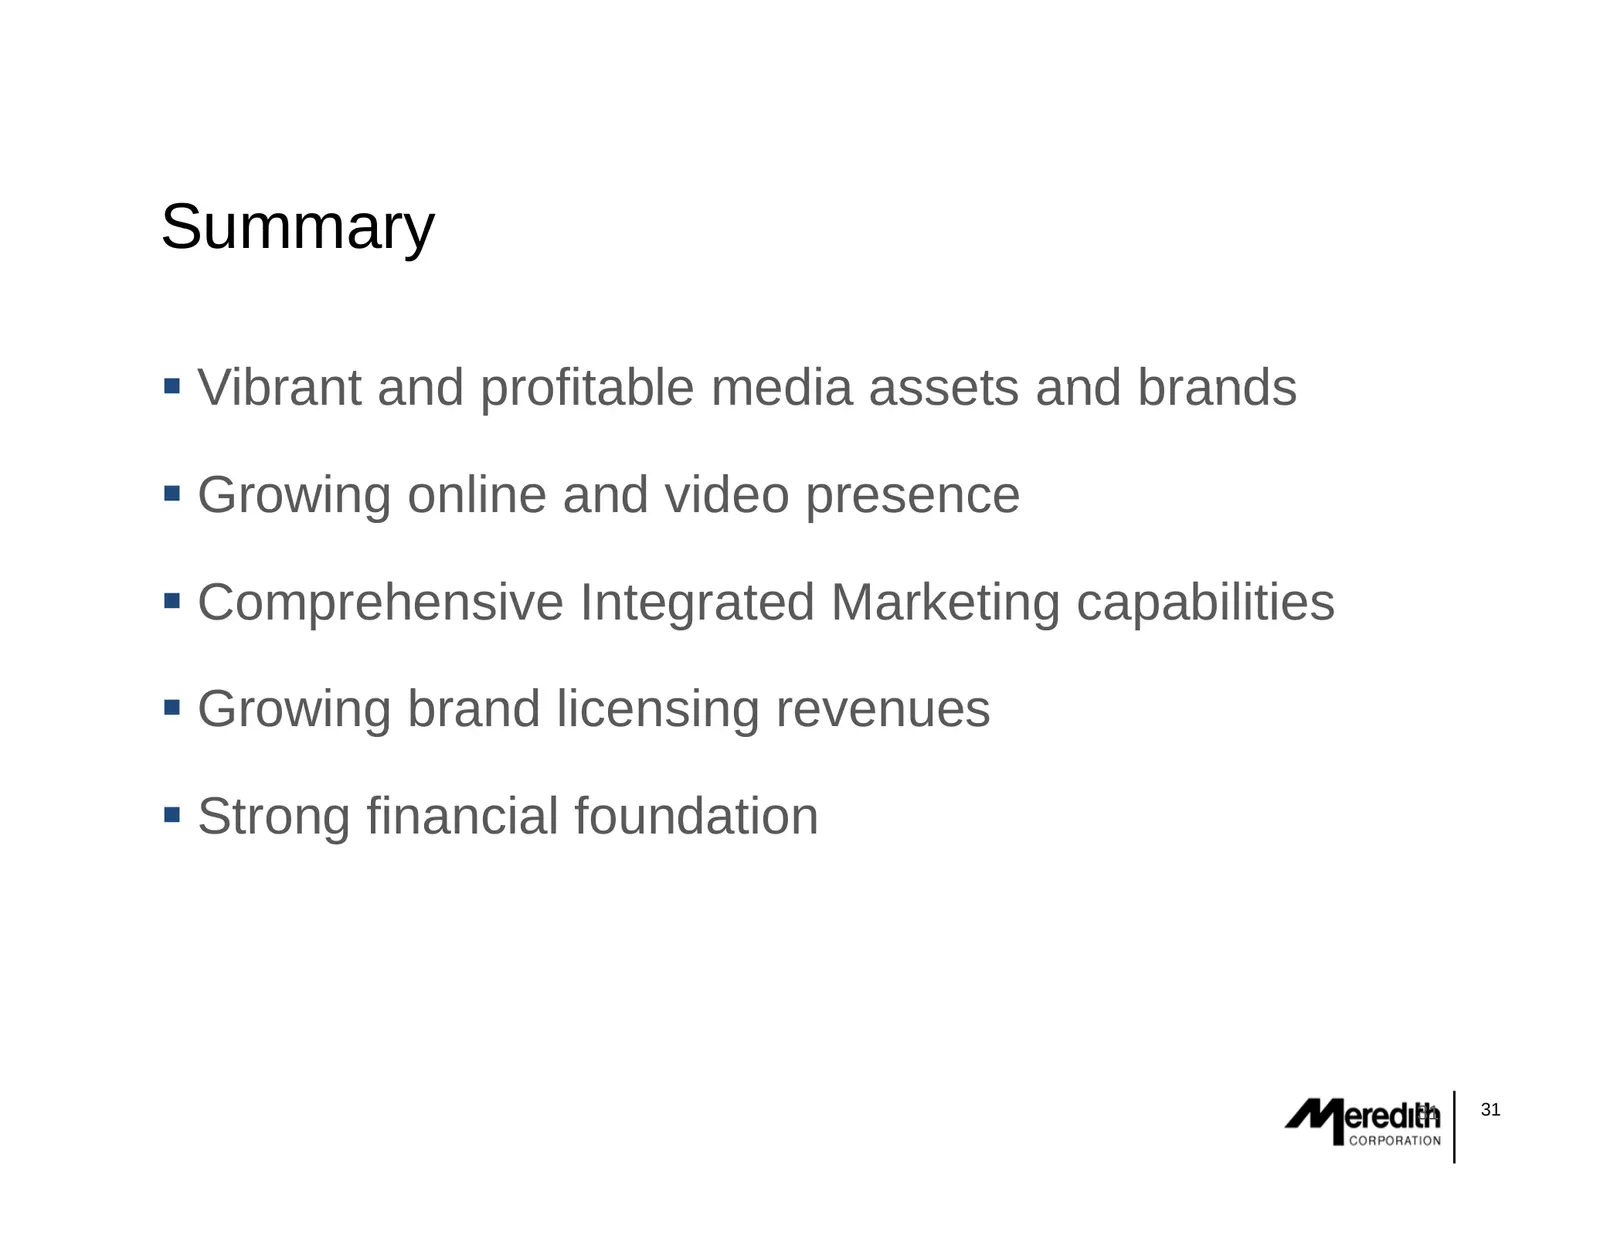
Summary Vibrant and profitable media assets and brands Growing online and video presence Comprehensive Integrated Marketing capabilities Growing G i brand b d lilicensing i revenues Strong financial foundation 31 31
Slide 32: Deutsche Bank 2009 Media & Telecommunications Conference
Deutsche Bank 2009 Media & Telecommunications Conference March 2-4, 2009 32 32 32
Source: SEC EDGAR · 8-K filed Mar 3, 2009
More decks from Meredith Corporation
 Q4 FY2021 Earnings Presentation20 slides · Aug 12, 2021
 Investor Presentation (June 2021)17 slides · Jun 16, 2021
 Merger or Acquisition (May 2021)15 slides · May 3, 2021
 Citi 2021 Global TMT West Virtual Conference11 slides · Jan 6, 2021
 Q4 FY2020 Earnings Presentation19 slides · Aug 13, 2020
 Q3 FY2020 Earnings Presentation15 slides · May 14, 2020