Sembcorp Industries Ltd. · SGX:U96
Sembcorp Industries — Shareholder Meeting (April 2023)
10 slides from Sembcorp Industries's shareholder meeting presentation, Apr 20, 2023
Slide 1: 25th Annual General Meeting
25th Annual General Meeting April 20, 2023
Slide 2: FY2022 Performance Overview
FY2022 Performance Overview Wong Kim Yin Group President & CEO © Sembcorp Industries
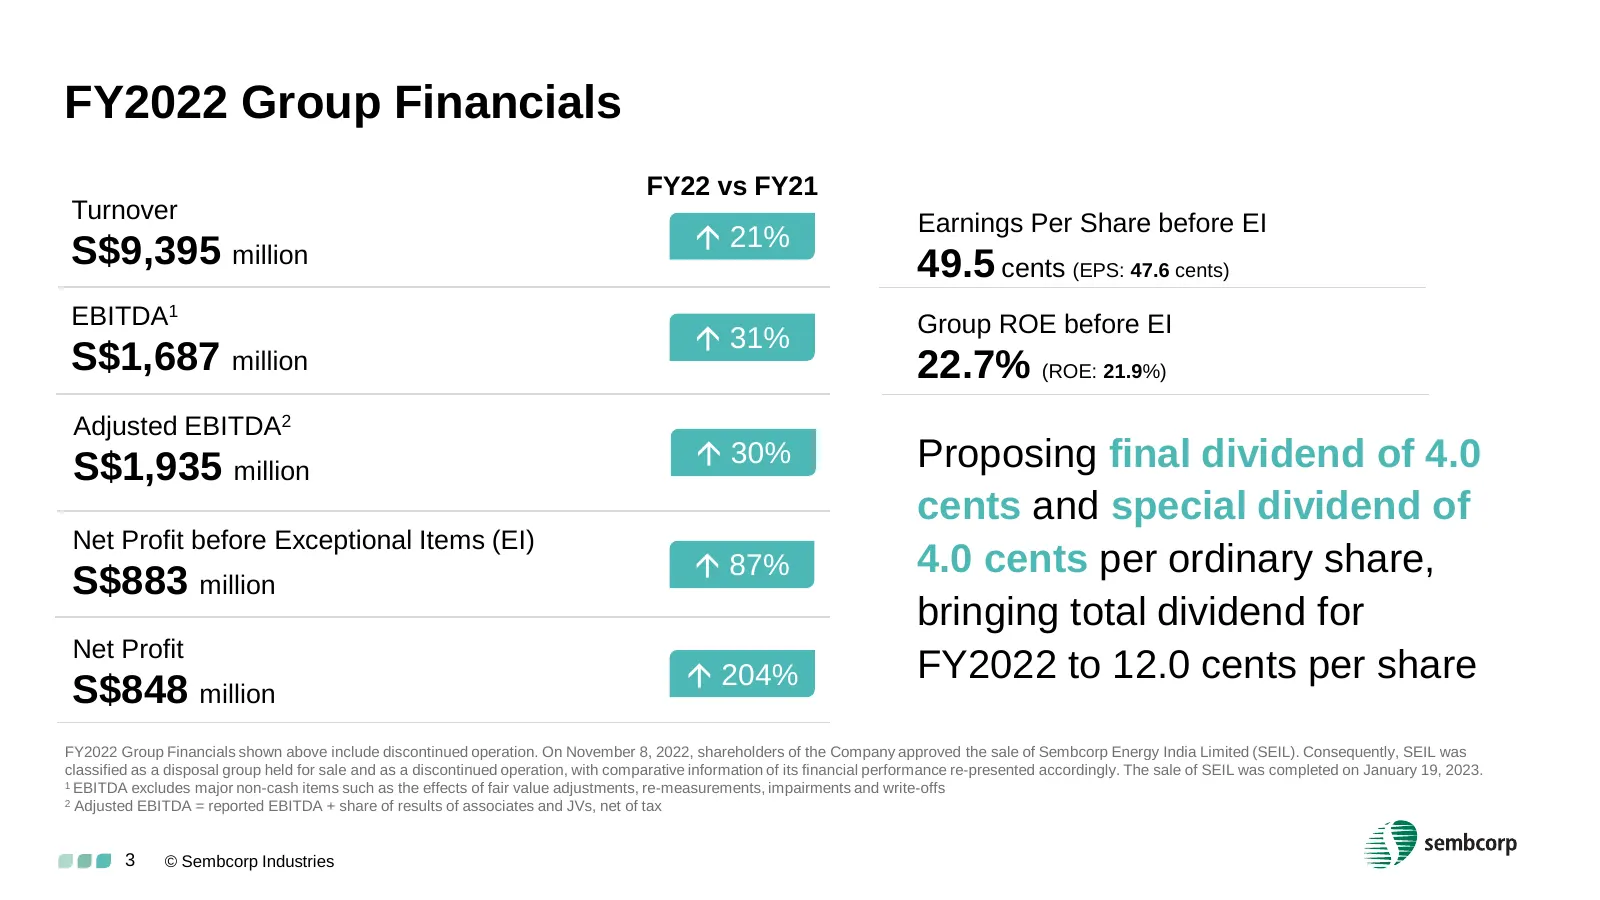
Slide 3: FY2022 Group Financials
FY2022 Group Financials FY22 vs FY21 Turnover Earnings Per Share before EI 21% S$9,395 million 49.5 cents (EPS: 47.6 cents) EBITDA1 Group ROE before EI 31% S$1,687 million 22.7% (ROE: 21.9%) Adjusted EBITDA2 30% Proposing final dividend of 4.0 S$1,935 million cents and special dividend of Net
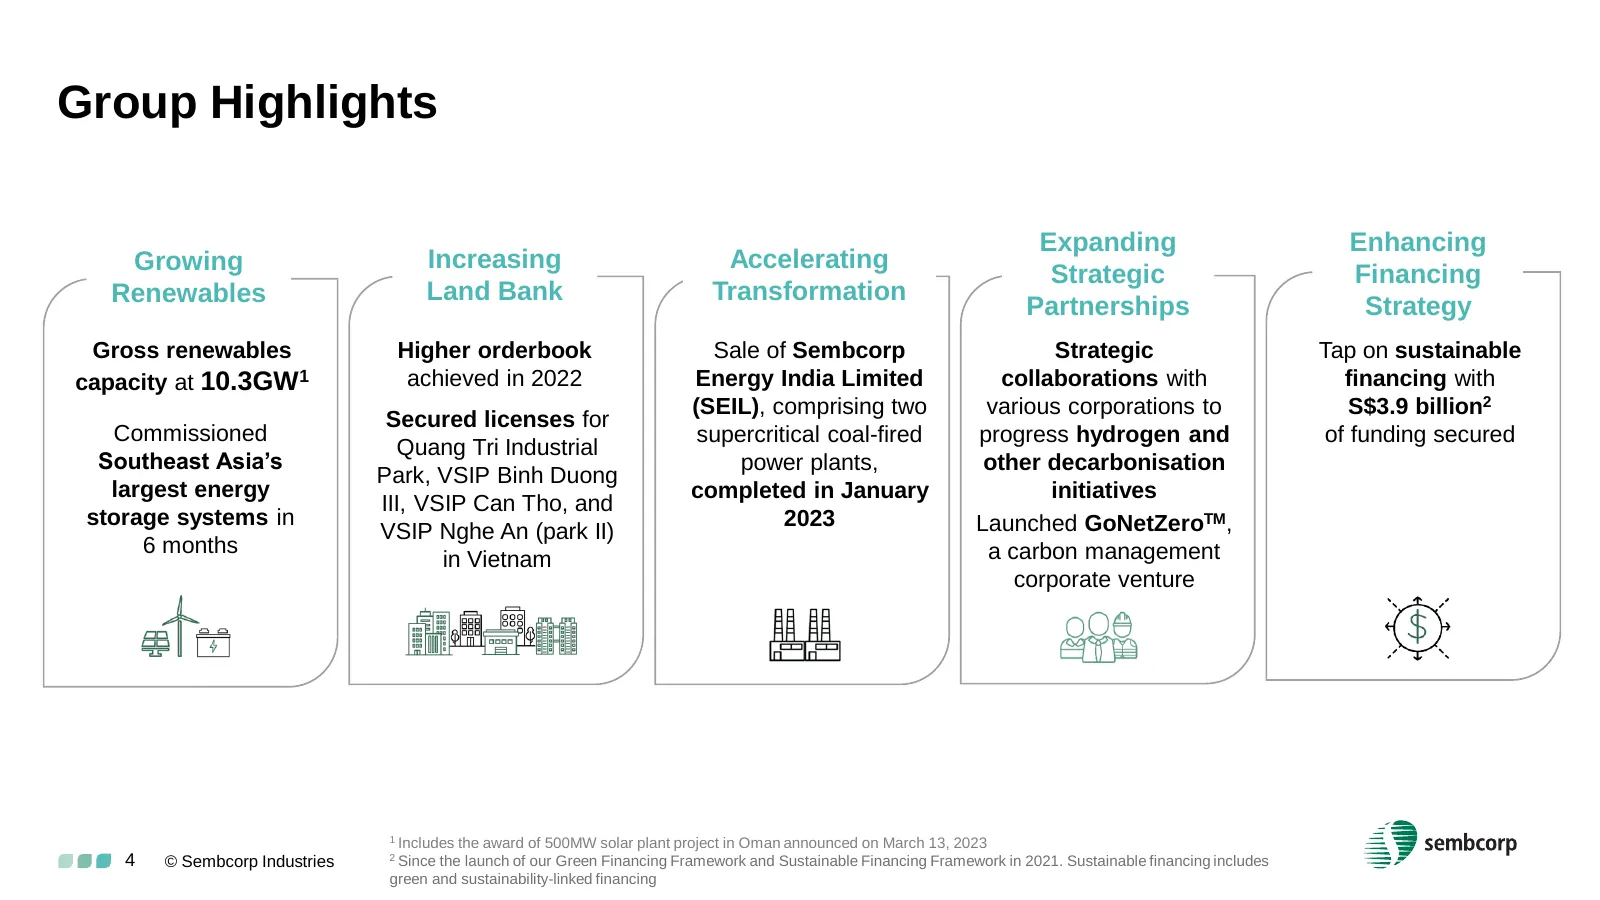
Slide 4: Group Highlights
Group Highlights Expanding Enhancing Growing Increasing Accelerating Strategic Financing Renewables Land Bank Transformation Partnerships Strategy Gross renewables Higher orderbook Sale of Sembcorp Strategic Tap on sustainable capacity at 10.3GW 1 achieved in 2022 Energy India Limited collaborations
Slide 5: Renewables
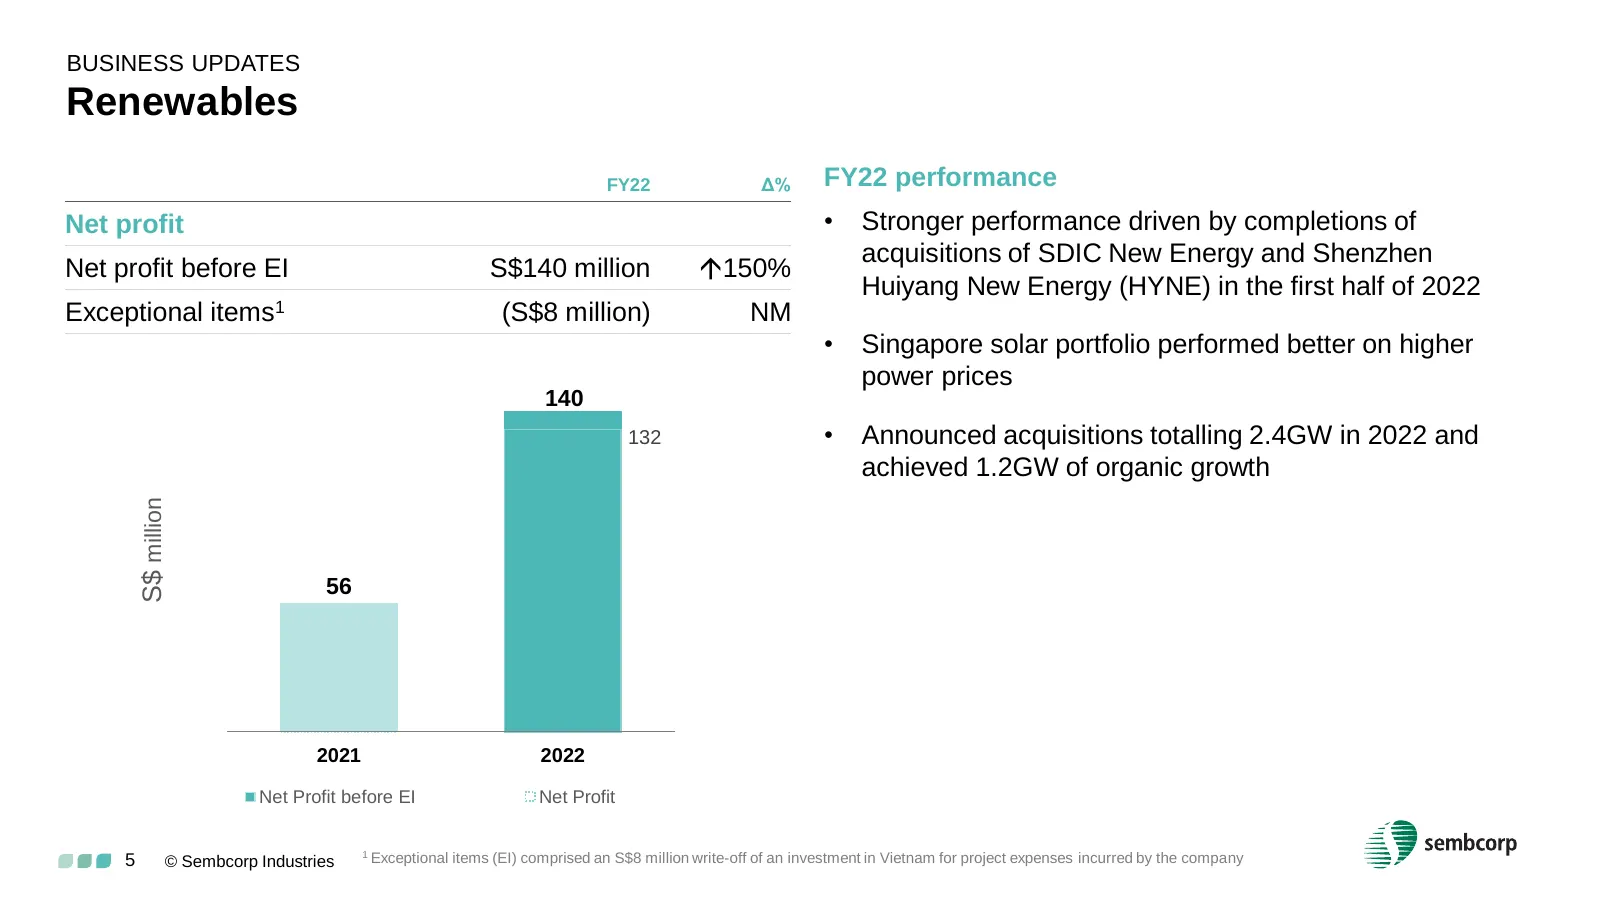
BUSINESS UPDATES Renewables FY22 Δ% FY22 performance Net profit • Stronger performance driven by completions of acquisitions of SDIC New Energy and Shenzhen Net profit before EI S$140 million 150% Huiyang New Energy (HYNE) in the first half of 2022 Exceptional items1 (S$8 million) NM • Singapore so
Slide 6: Renewables
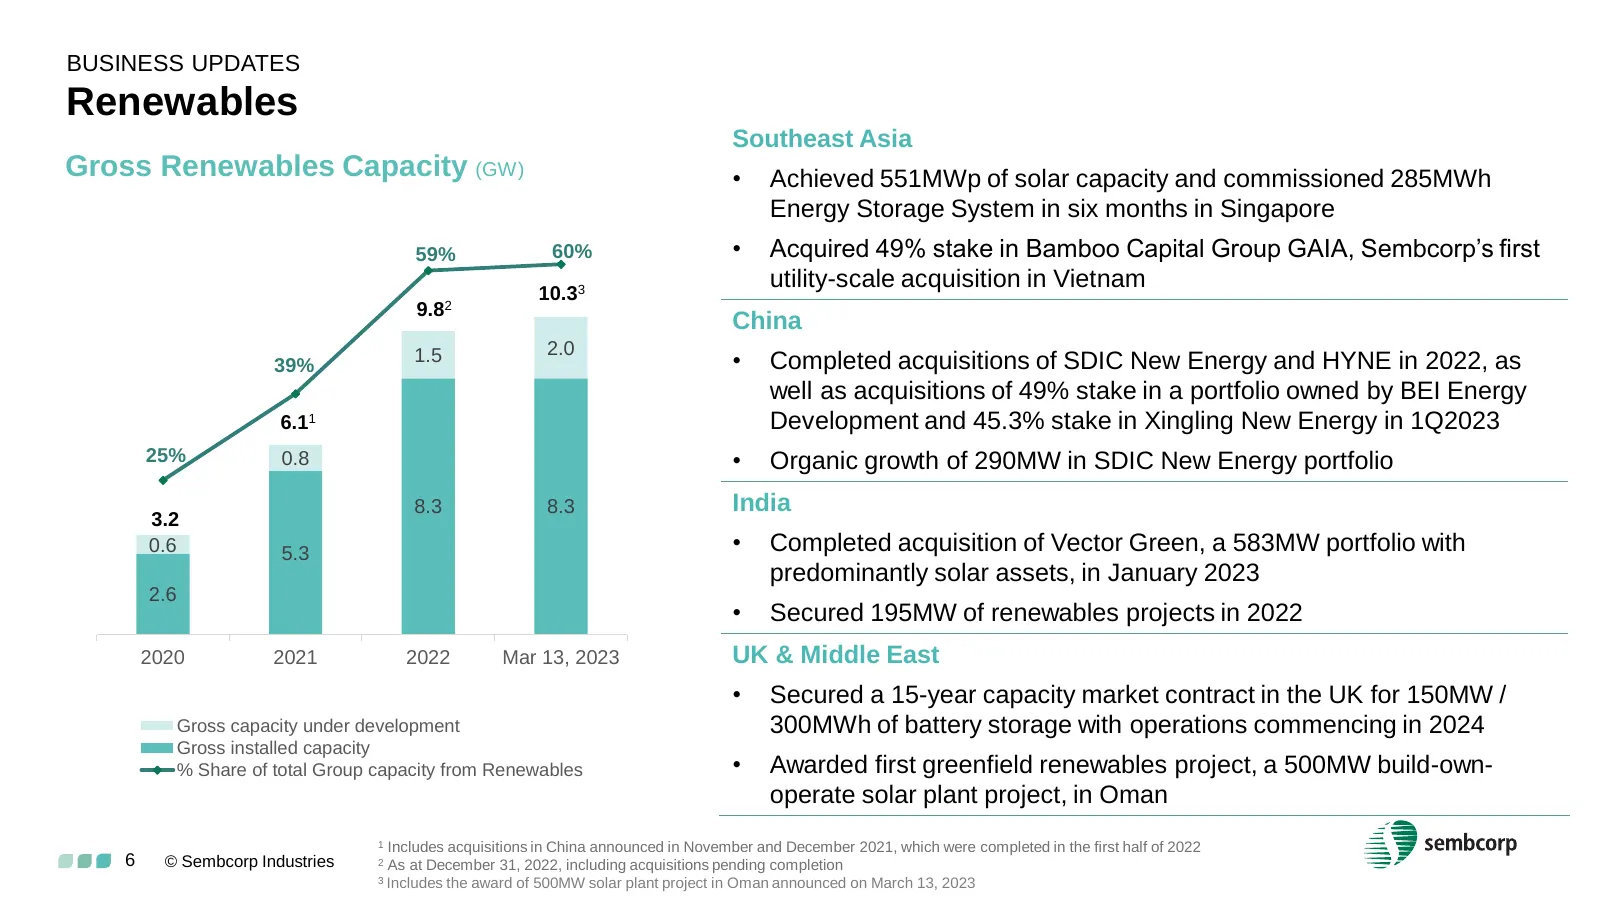
BUSINESS UPDATES Renewables Southeast Asia Gross Renewables Capacity (GW) • Achieved 551MWp of solar capacity and commissioned 285MWh 14 70% Energy Storage System in six months in Singapore 59% 60% • Acquired 49% stake in Bamboo Capital Group GAIA, Sembcorp’s first 12 60% utility-scale acquisition i
Slide 7: Integrated Urban Solutions
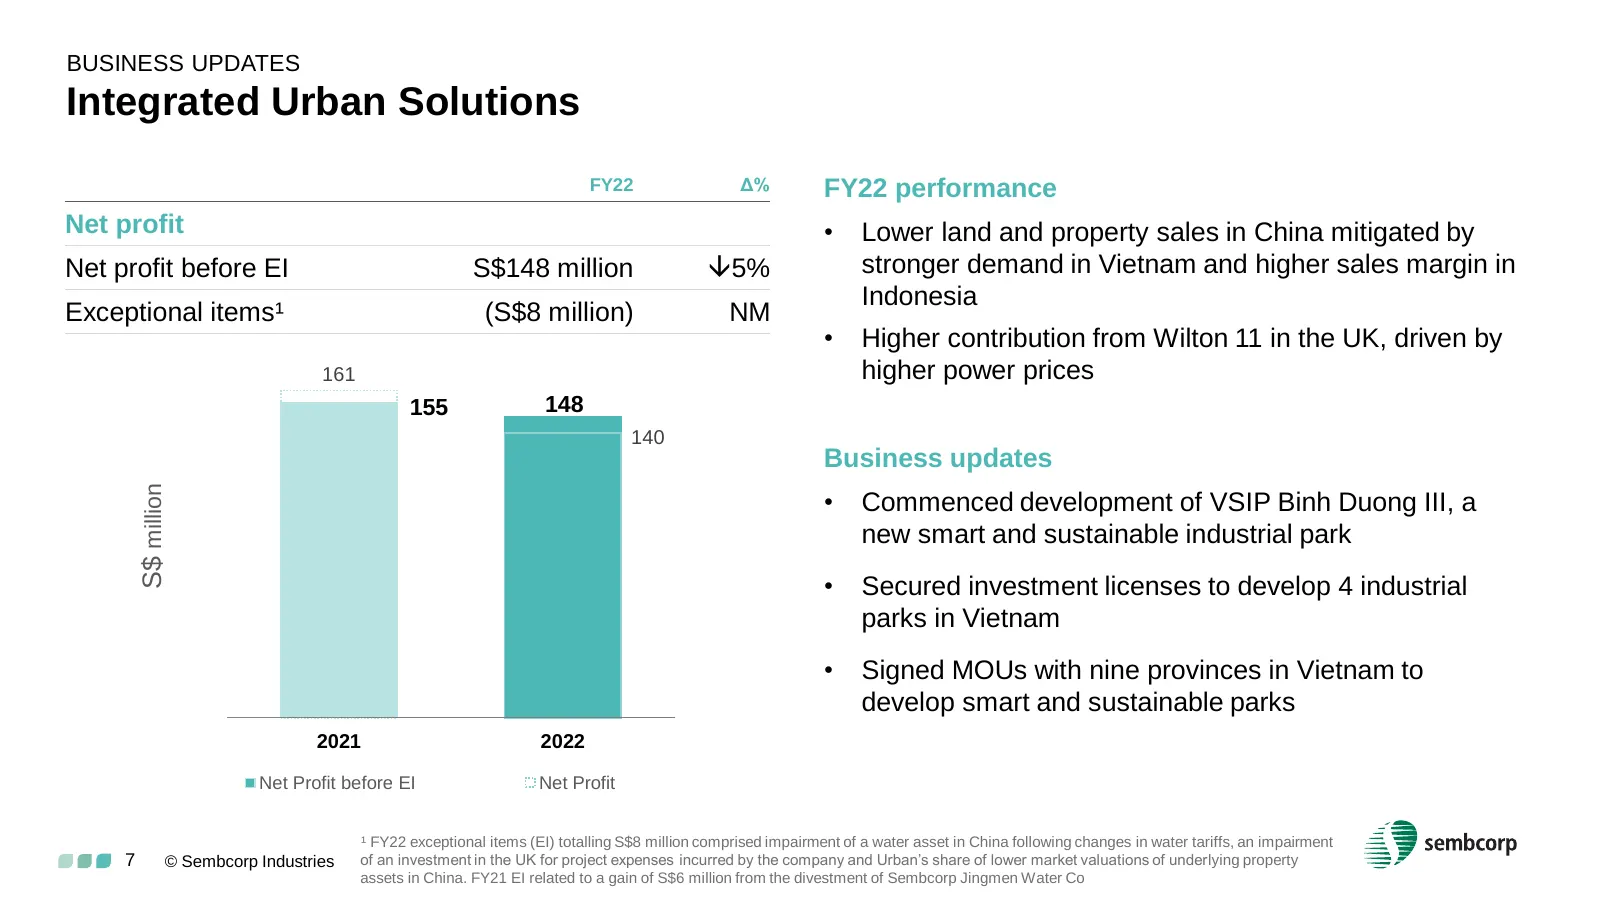
BUSINESS UPDATES Integrated Urban Solutions FY22 Δ% FY22 performance Net profit • Lower land and property sales in China mitigated by Net profit before EI S$148 million 5% stronger demand in Vietnam and higher sales margin in Indonesia Exceptional items¹ (S$8 million) NM • Higher contribution from
Slide 8: Conventional Energy
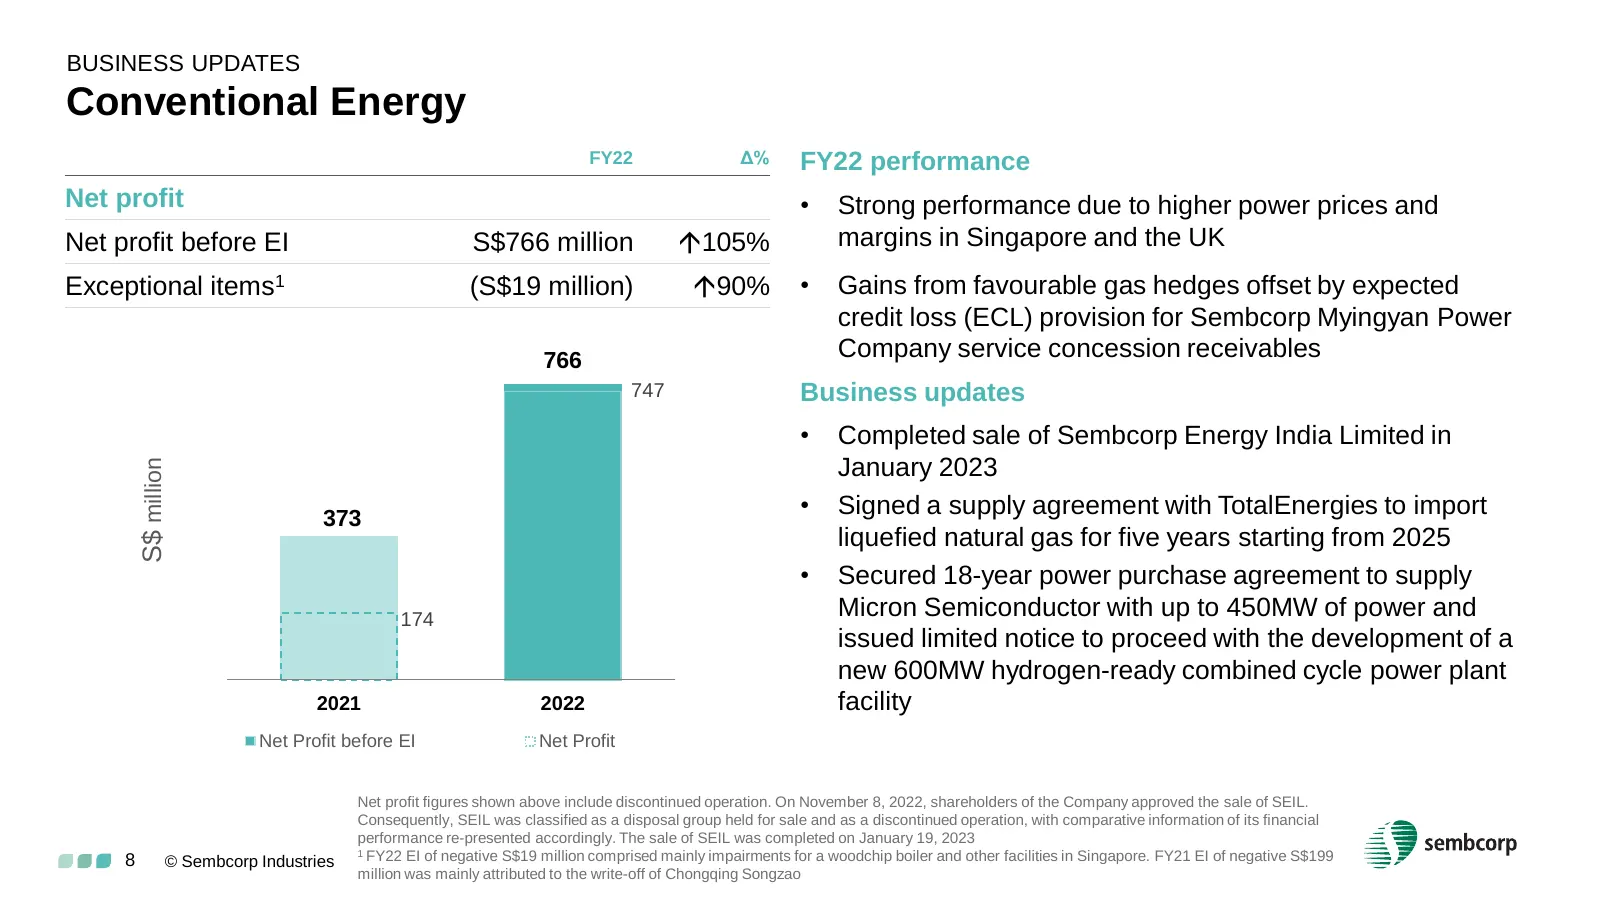
BUSINESS UPDATES Conventional Energy FY22 Δ% FY22 performance Net profit • Strong performance due to higher power prices and Net profit before EI S$766 million 105% margins in Singapore and the UK Exceptional items1 (S$19 million) 90% • Gains from favourable gas hedges offset by expected credit lo
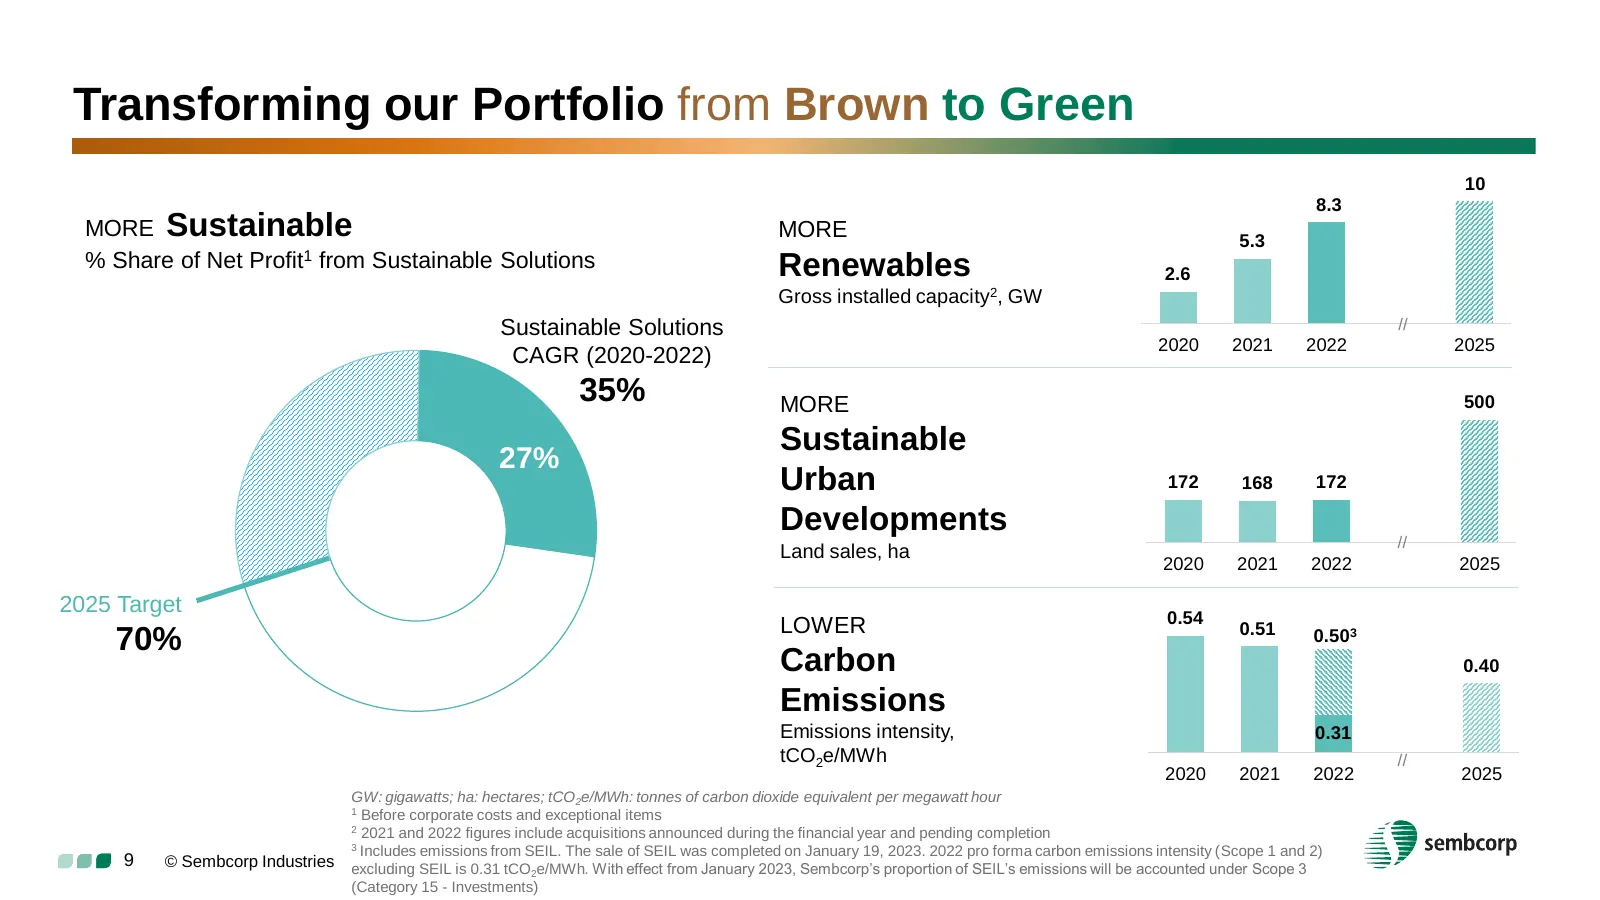
Slide 9: Transforming our Portfolio from Brown to Green
Transforming our Portfolio from Brown to Green 10 8.3 MORE Sustainable MORE 5.3 % Share of Net Profit1 from Sustainable Solutions Renewables 2.6 Gross installed capacity2, GW Sustainable Solutions 2.7 // 2020 2021 2022 2025 CAGR (2020-2022) 35% MORE 500 Sustainable 27% Urban 172 168 172 Developments
Slide 10: Disclaimer
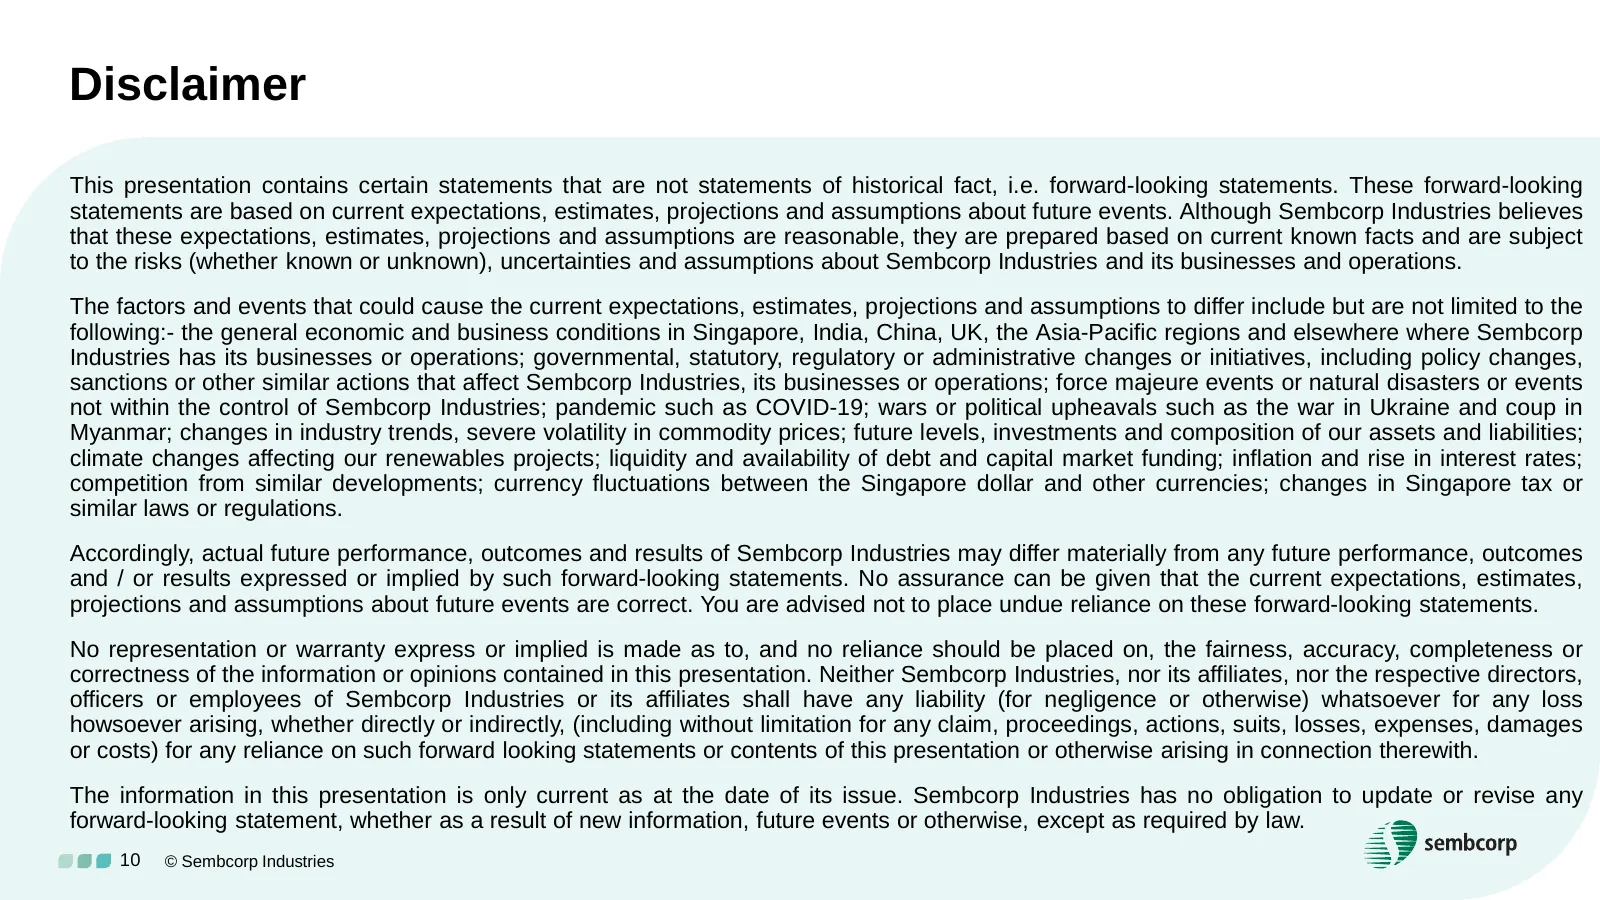
Disclaimer This presentation contains certain statements that are not statements of historical fact, i.e. forward-looking statements. These forward-looking statements are based on current expectations, estimates, projections and assumptions about future events. Although Sembcorp Industries believes
Source: Internet Archive copy of sembcorp.com
More decks from Sembcorp Industries Ltd.
 H1 2026 Earnings Presentation26 slides · Aug 13, 2026
 Investor Presentation (June 2026)52 slides · June 2026
 Shareholder Meeting (April 2026)11 slides · Apr 29, 2026
 FY2025 Earnings Presentation35 slides · Feb 25, 2026
 Merger or Acquisition (January 2026)13 slides · Jan 30, 2026
 Merger or Acquisition (December 2025)24 slides · Dec 11, 2025