Apollo Commercial Real Estate Finance, Inc · NYSE:ARI
Apollo Commercial Real Estate Finance — Q4 2017 Earnings Presentation
21 slides from Apollo Commercial Real Estate Finance's earnings presentation, Feb 14, 2018

Slide 1: Supplemental Financial Information Package – Q4 2017
Information is as of December 31, 2017, except as otherwise noted. It should not be assumed that investments made in the future will be profitable or will equal the performance of investments in this document. Supplemental Financial Information Package – Q4 2017 February 14, 2018 Exhibit 99.2
Slide 2: Forward Looking Statements and Other Disclosures
Forward Looking Statements and Other Disclosures This presentation may contain forward-looking statements that are within the meaning of Section 27A of the Securities Act of 1933, as amended, and Section 21E of the Securities Exchange Act of 1934, as amended, and such statements are intended to be c
Slide 3: Q4 Highlights
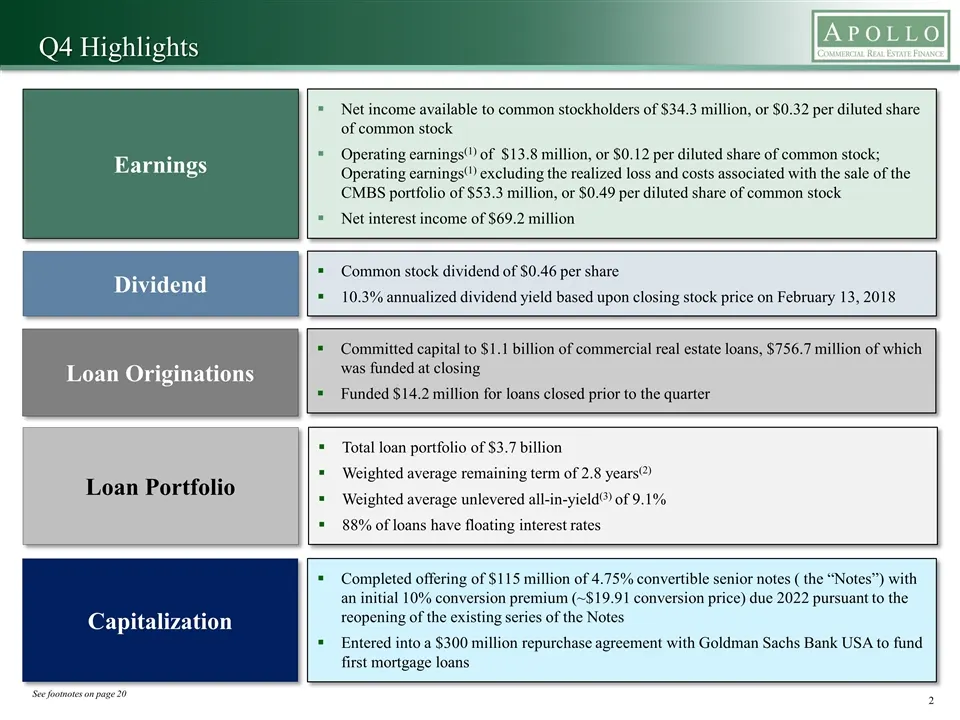
Q4 Highlights Net income available to common stockholders of $34.3 million, or $0.32 per diluted share of common stock Operating earnings(1) of $13.8 million, or $0.12 per diluted share of common stock; Operating earnings(1) excluding the realized loss and costs associated with the sale of the CMBS
Slide 4: Financial Summary
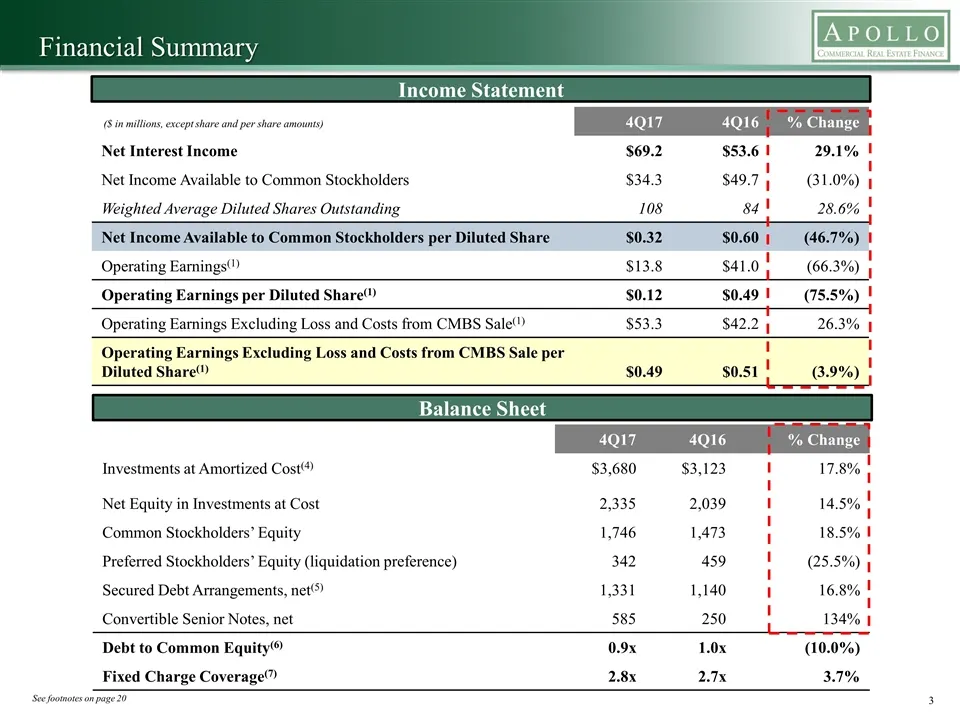
1c 4Q17 4Q16 % Change Investments at Amortized Cost(4) $3,680 $3,123 17.8% Net Equity in Investments at Cost 2,335 2,039 14.5% Common Stockholders’ Equity 1,746 1,473 18.5% Preferred Stockholders’ Equity (liquidation preference) 342 459 (25.5%) Secured Debt Arrangements, net(5) 1,331 1,140 16.8% Con
Slide 5: Q4 Investment Activity
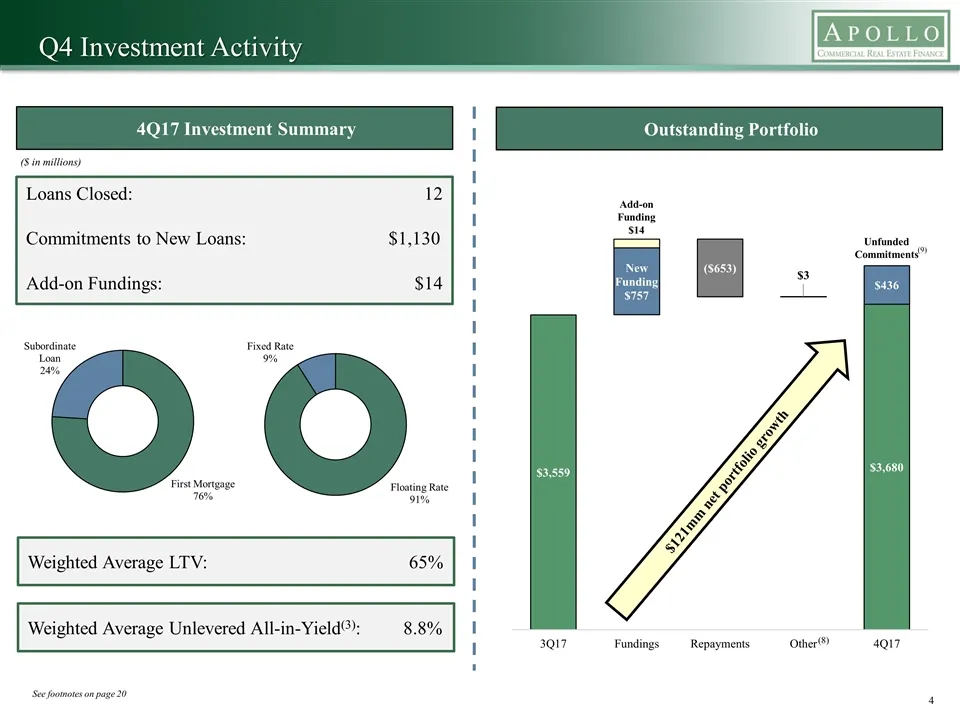
Q4 Investment Activity 4Q17 Investment Summary Outstanding Portfolio ($ in millions) See footnotes on page 20 $121mm net portfolio growth (8) Loans Closed: 12 Commitments to New Loans: $1,130 Add-on Fundings: $14 Weighted Average LTV: 65% Weighted Average Unlevered All-in-Yield(3): 8.8%
Slide 6: 2017 Investment Activity
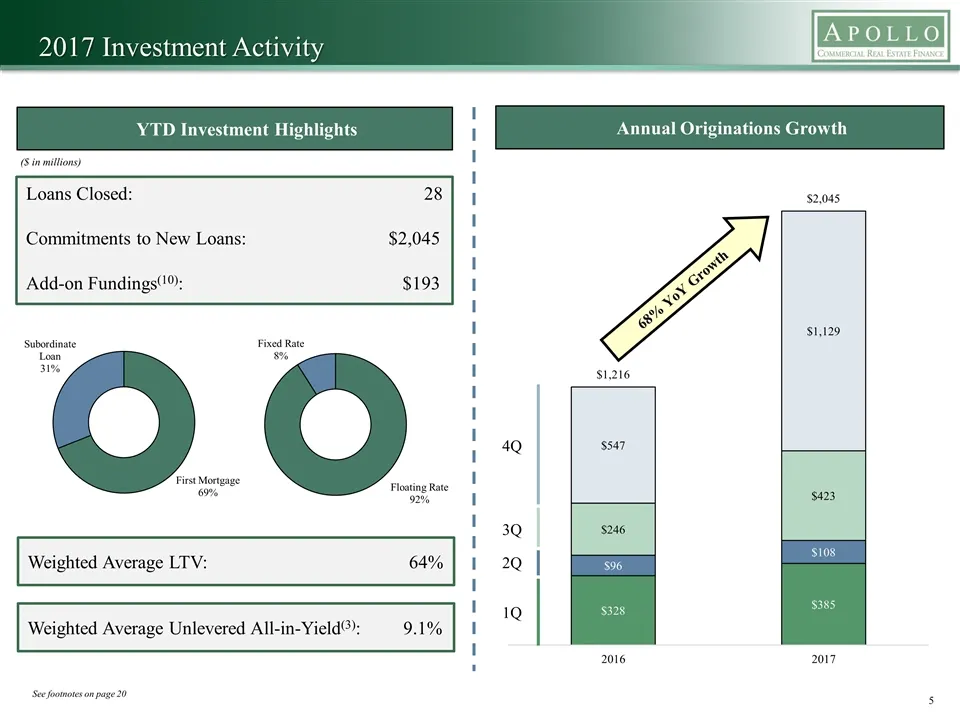
2017 Investment Activity YTD Investment Highlights Annual Originations Growth See footnotes on page 20 ($ in millions) Loans Closed: 28 Commitments to New Loans: $2,045 Add-on Fundings(10): $193 Weighted Average LTV: 64% Weighted Average Unlevered All-in-Yield(3): 9.1% 4Q 3Q 1Q 2Q 68% YoY Growth
Slide 7: Summary of New Investments
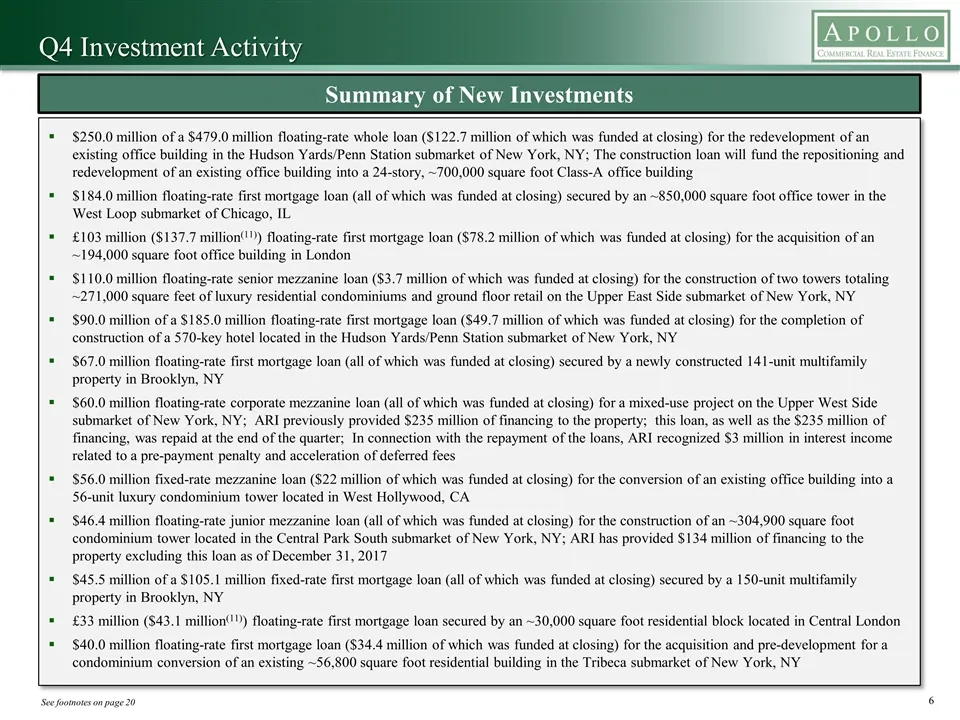
Summary of New Investments Q4 Investment Activity $250.0 million of a $479.0 million floating-rate whole loan ($122.7 million of which was funded at closing) for the redevelopment of an existing office building in the Hudson Yards/Penn Station submarket of New York, NY; The construction loan will fu
Slide 8: Commercial Real Estate Loan Portfolio Overview
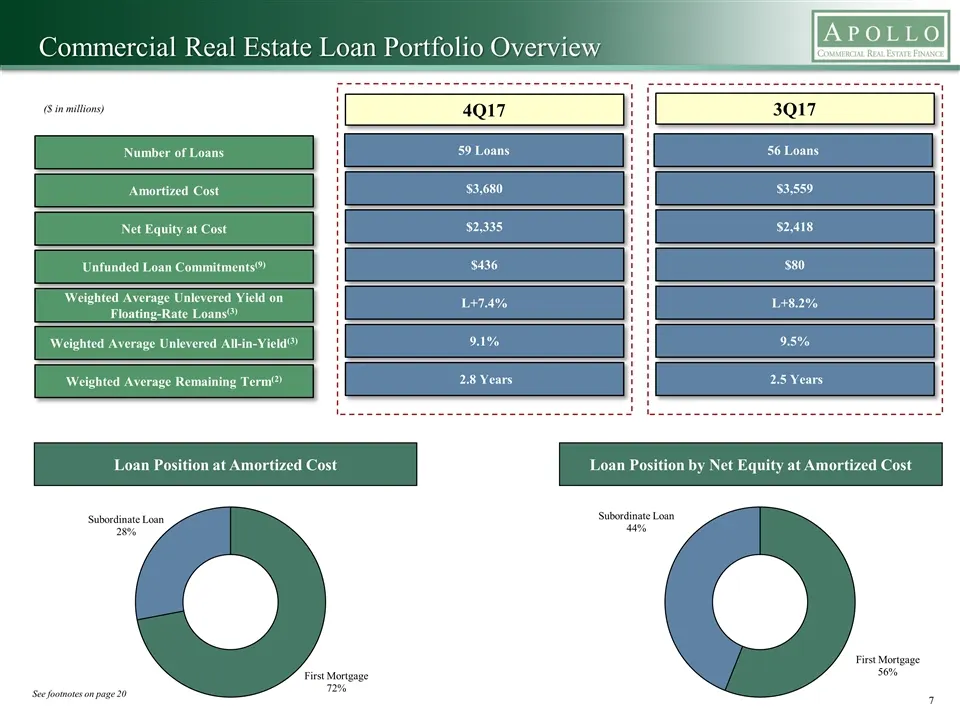
Number of Loans Amortized Cost Net Equity at Cost Unfunded Loan Commitments(9) Weighted Average Unlevered Yield on Floating-Rate Loans(3) Weighted Average Unlevered All-in-Yield(3) Weighted Average Remaining Term(2) 56 Loans $3,559 $2,418 $80 L+8.2% 9.5% 2.5 Years 3Q17 Commercial Real Estate Loan Po
Slide 9: Commercial Real Estate Loan Portfolio Overview
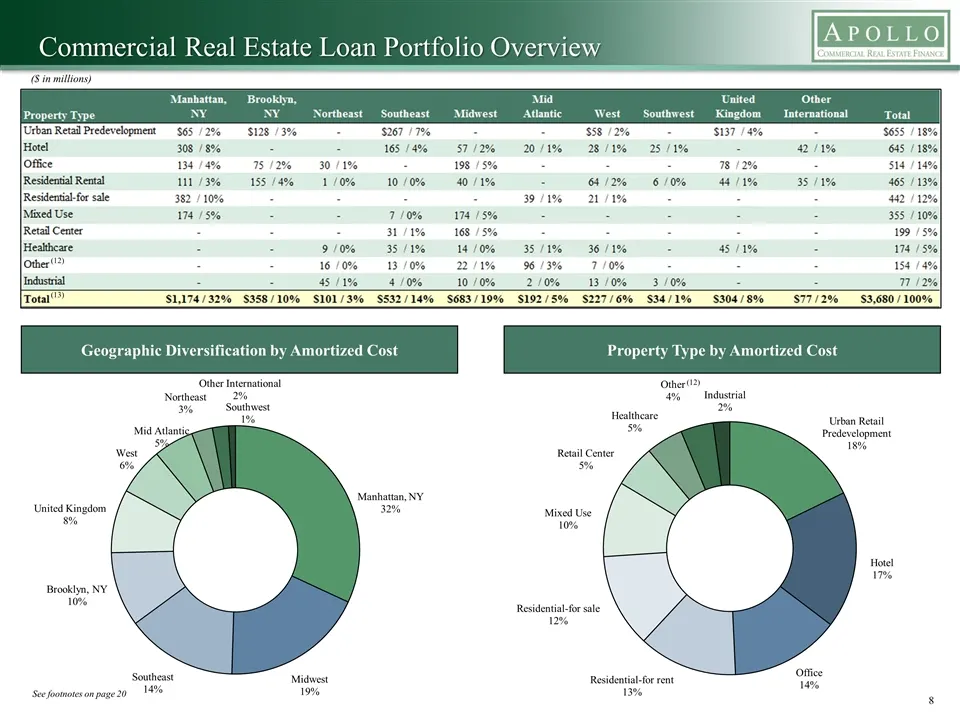
Commercial Real Estate Loan Portfolio Overview Geographic Diversification by Amortized Cost Property Type by Amortized Cost (12) See footnotes on page 20 (12) (13) (13) (12) ($ in millions)
Slide 10: Risk Ratings
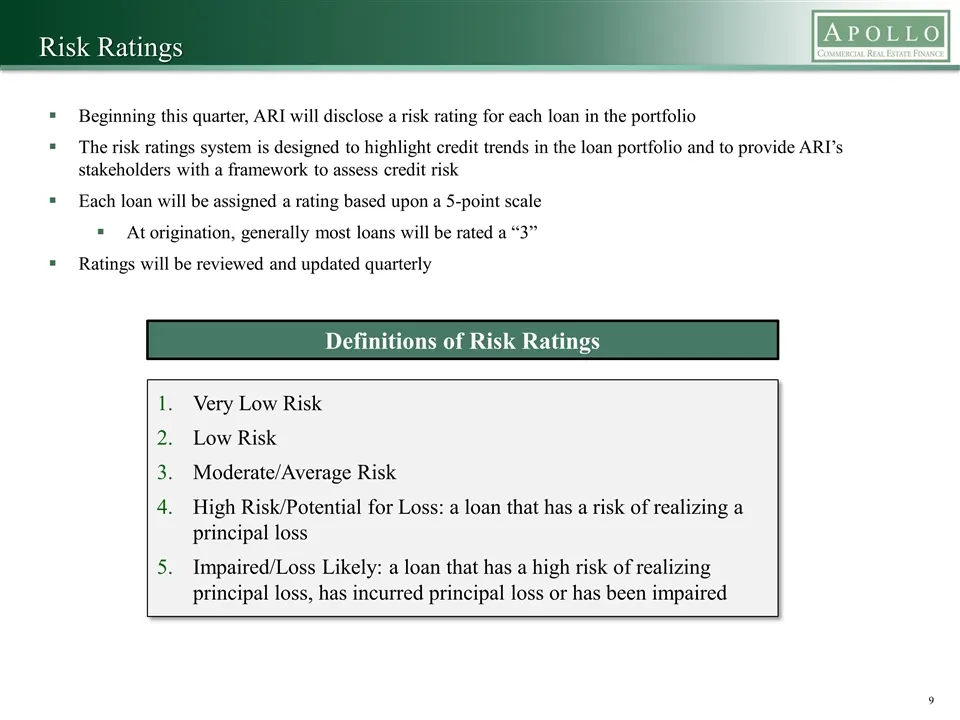
Risk Ratings Beginning this quarter, ARI will disclose a risk rating for each loan in the portfolio The risk ratings system is designed to highlight credit trends in the loan portfolio and to provide ARI’s stakeholders with a framework to assess credit risk Each loan will be assigned a rating based
Slide 11: Senior Loan Portfolio Overview
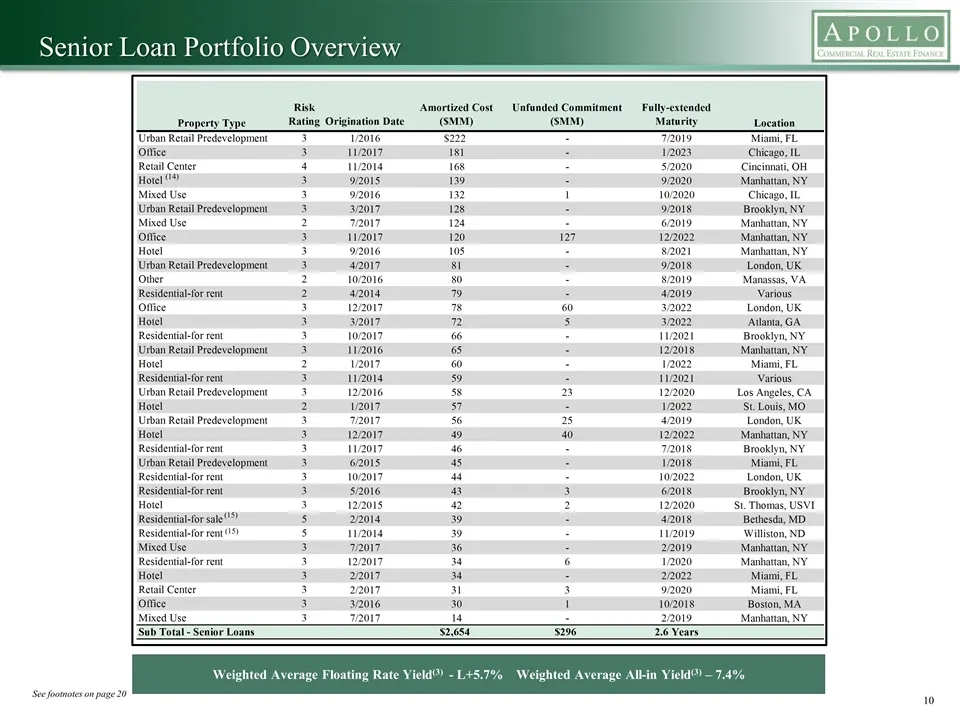
Senior Loan Portfolio Overview See footnotes on page 20 Weighted Average Floating Rate Yield(3) - L+5.7%Weighted Average All-in Yield(3) – 7.4% (14) (15) (15)
Slide 12: Subordinate Loan Portfolio Overview
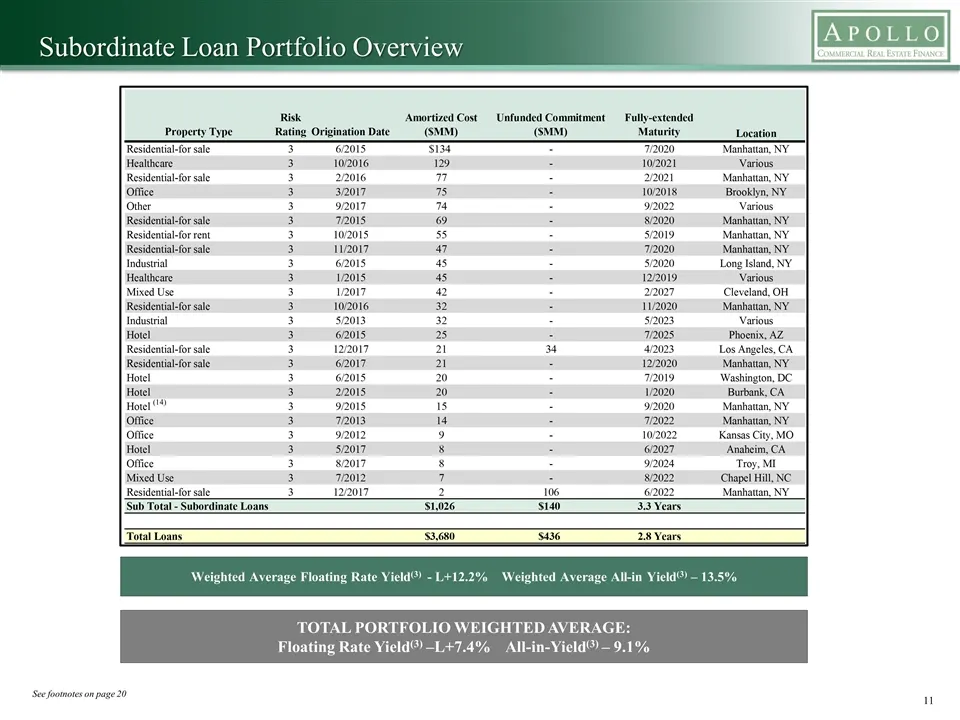
Subordinate Loan Portfolio Overview See footnotes on page 20 Weighted Average Floating Rate Yield(3) - L+12.2% Weighted Average All-in Yield(3) – 13.5% TOTAL PORTFOLIO WEIGHTED AVERAGE: Floating Rate Yield(3) –L+7.4% All-in-Yield(3) – 9.1% (14)
Slide 13: Loan Portfolio Maturity Profile and Book Value Summary
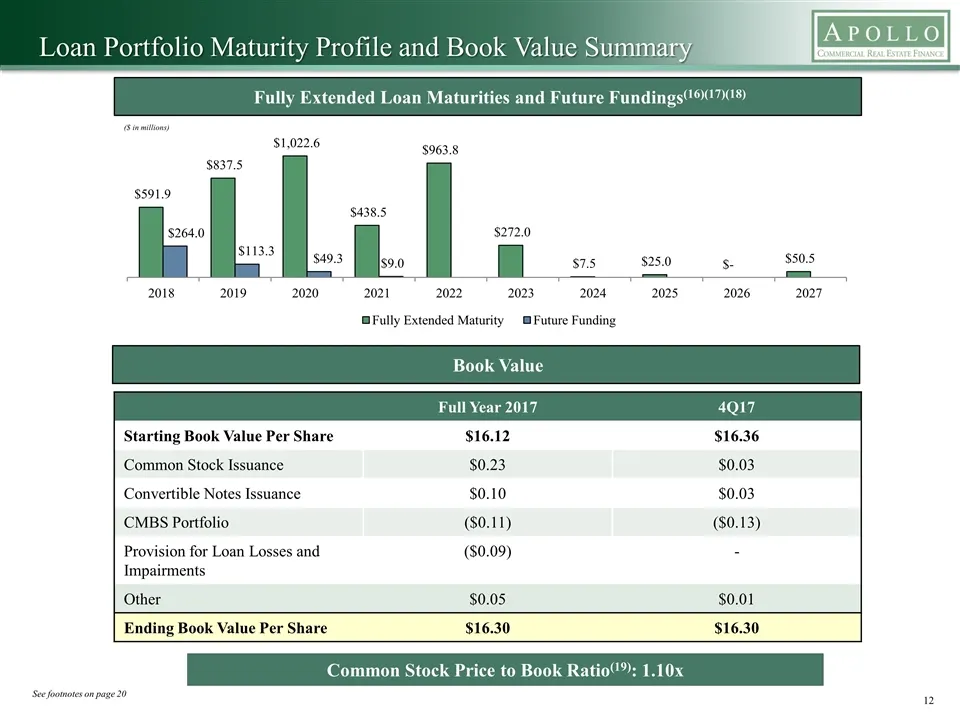
($ in millions) Fully Extended Loan Maturities and Future Fundings(16)(17)(18) Loan Portfolio Maturity Profile and Book Value Summary See footnotes on page 20 Full Year 2017 4Q17 Starting Book Value Per Share $16.12 $16.36 Common Stock Issuance $0.23 $0.03 Convertible Notes Issuance $0.10 $0.03 CMBS
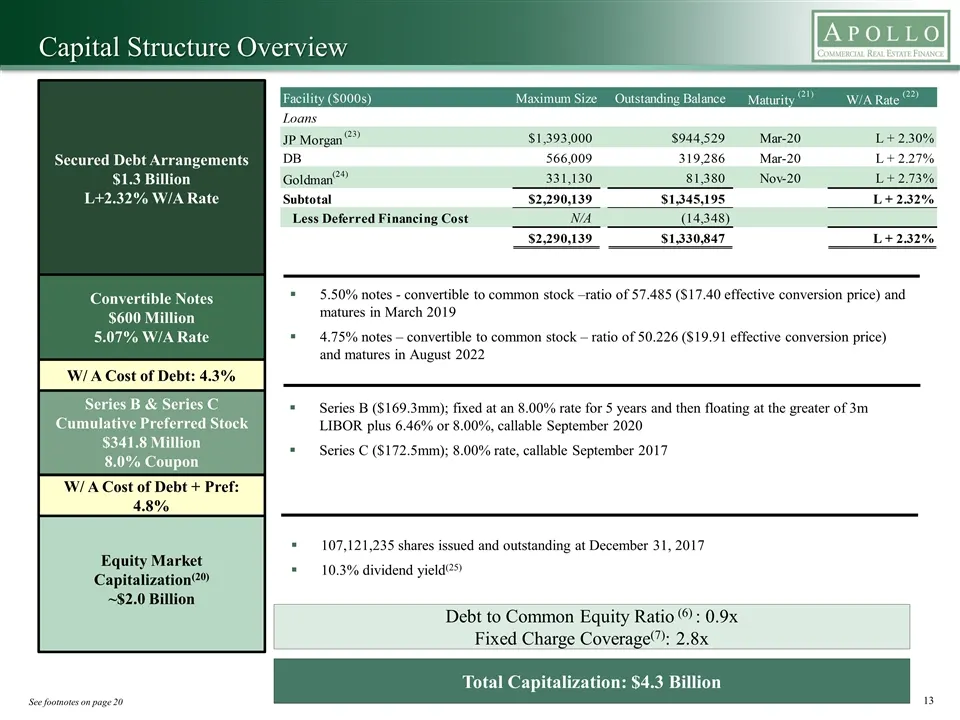
Slide 14: Capital Structure Overview
Secured Debt Arrangements $1.3 Billion L+2.32% W/A Rate Convertible Notes $600 Million 5.07% W/A Rate Series B & Series C Cumulative Preferred Stock $341.8 Million 8.0% Coupon Equity Market Capitalization(20) ~$2.0 Billion 5.50% notes - convertible to common stock –ratio of 57.485 ($17.40 effective
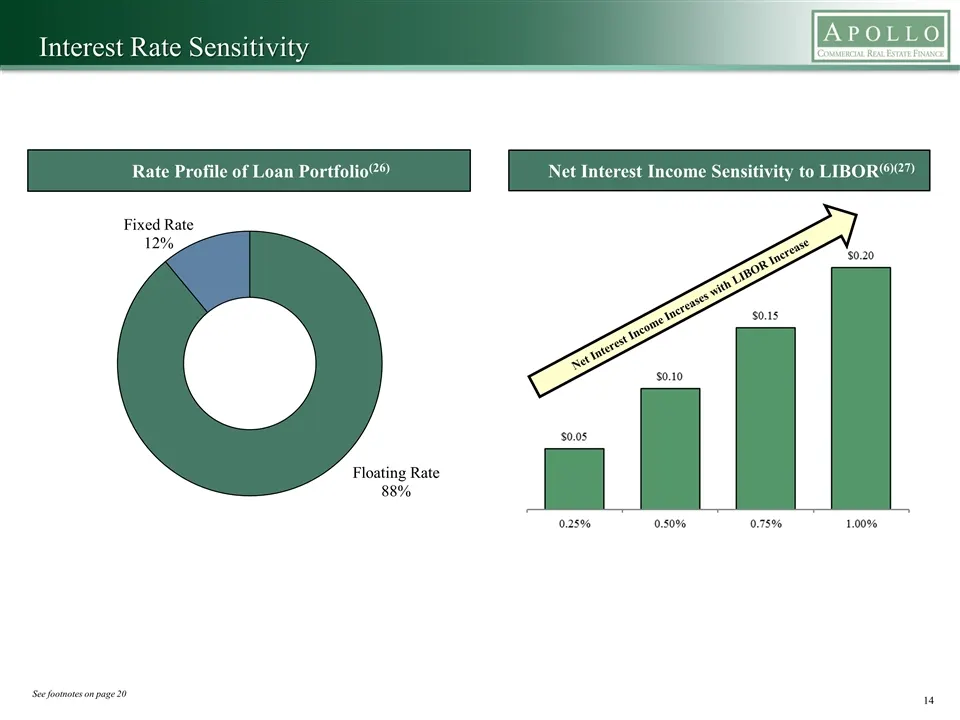
Slide 15: Interest Rate Sensitivity
Interest Rate Sensitivity Rate Profile of Loan Portfolio(26) Net Interest Income Sensitivity to LIBOR(6)(27) See footnotes on page 20 Net Interest Income Increases with LIBOR Increase
Slide 16: Financials
Financials
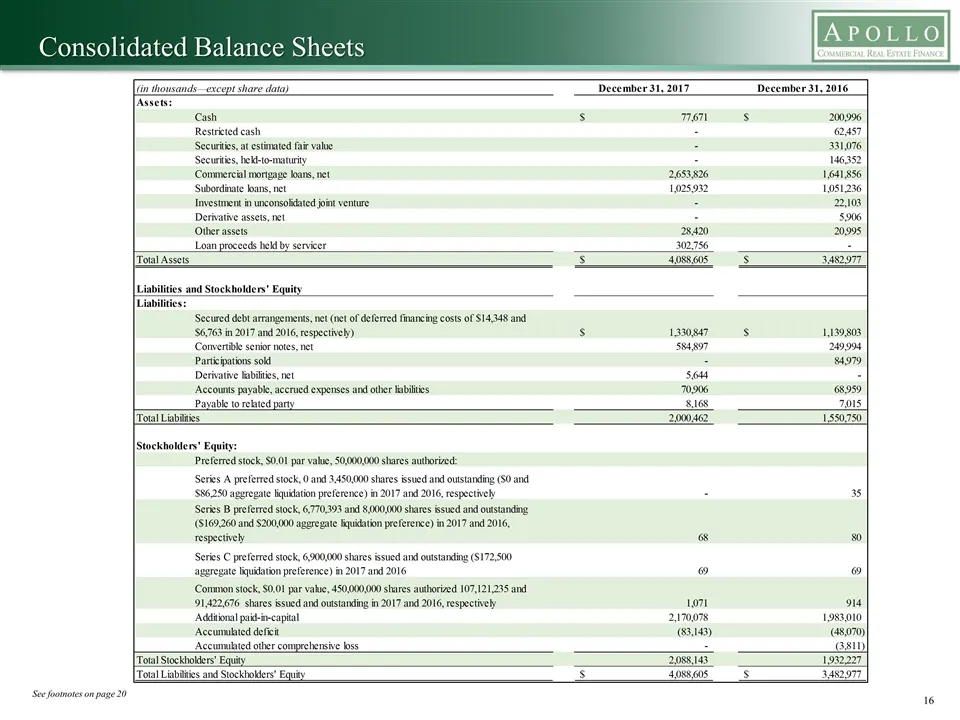
Slide 17: Consolidated Balance Sheets
Consolidated Balance Sheets See footnotes on page 20
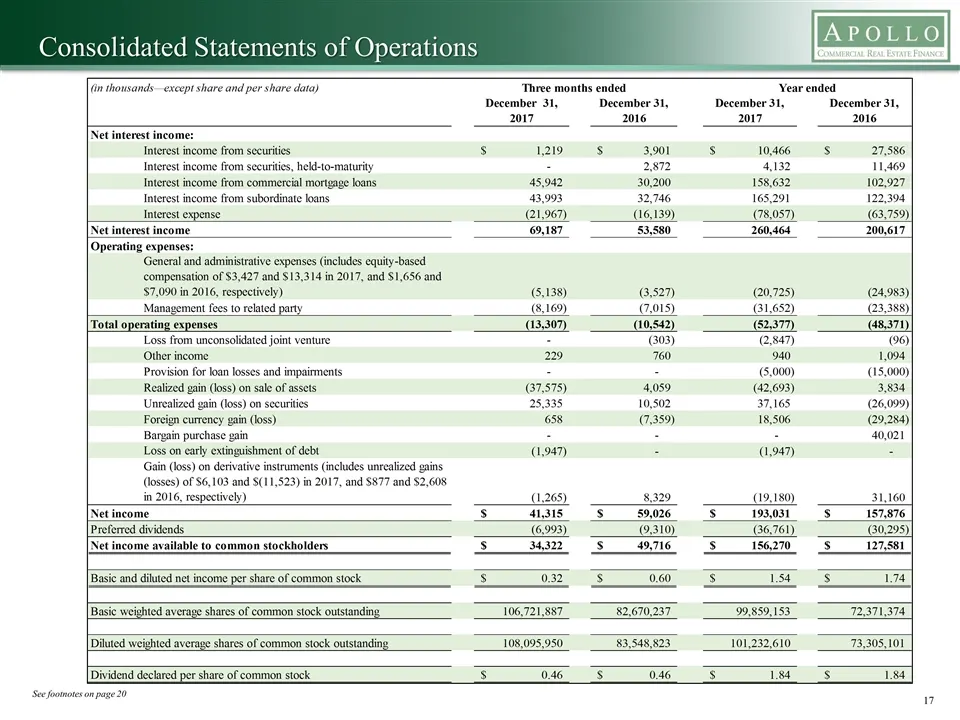
Slide 18: Consolidated Statements of Operations
Consolidated Statements of Operations See footnotes on page 20
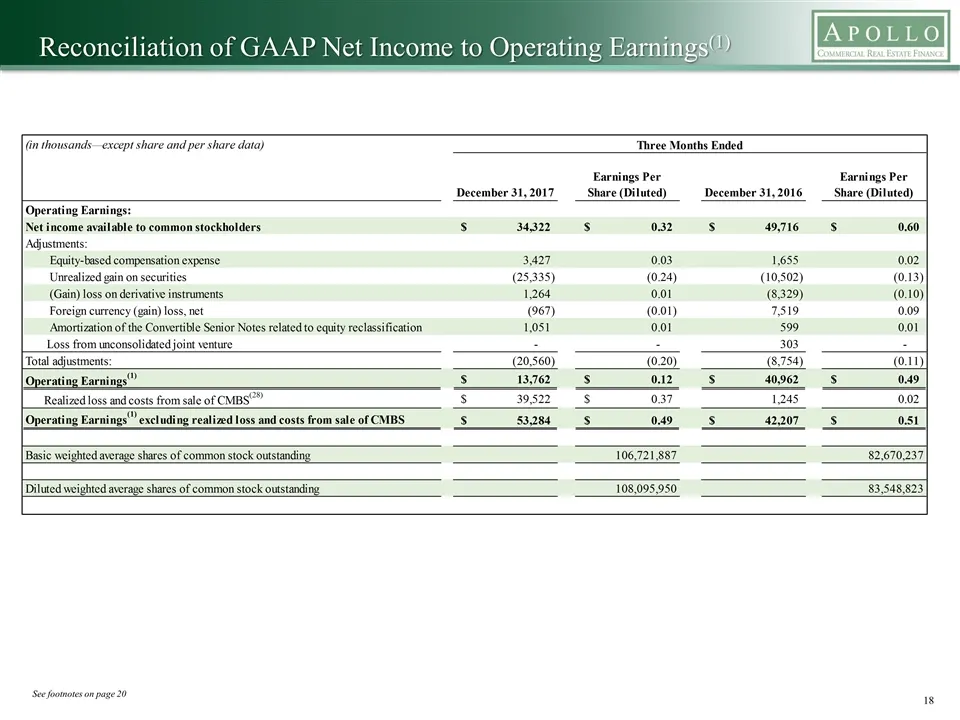
Slide 19: Reconciliation of GAAP Net Income to Operating Earnings
Reconciliation of GAAP Net Income to Operating Earnings(1) See footnotes on page 20
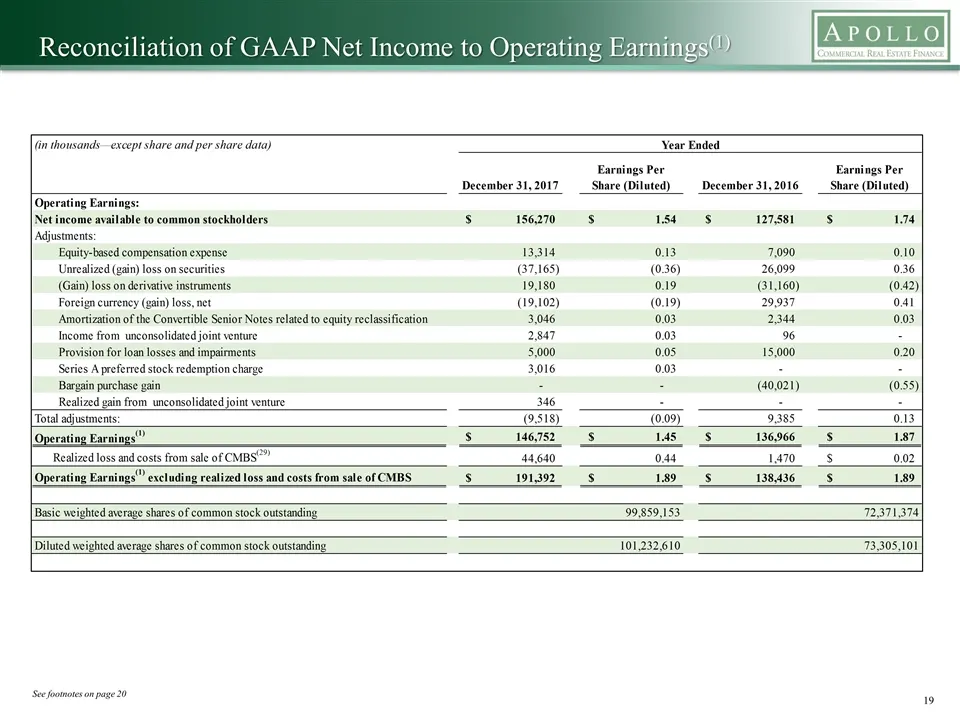
Slide 20: Reconciliation of GAAP Net Income to Operating Earnings
Reconciliation of GAAP Net Income to Operating Earnings(1) See footnotes on page 20
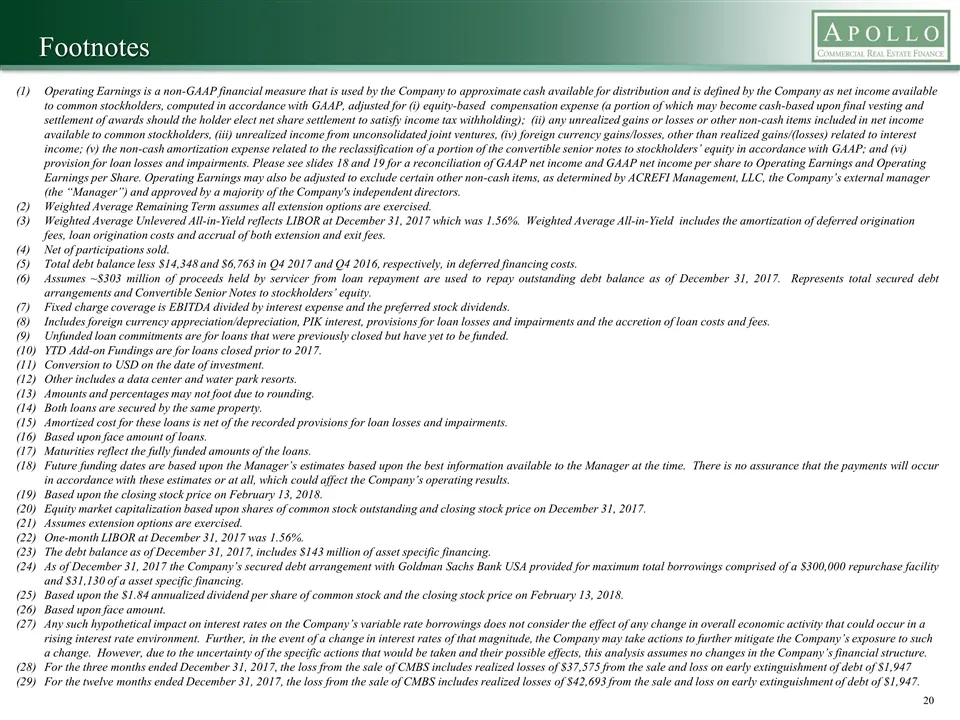
Slide 21: Footnotes
Footnotes Operating Earnings is a non-GAAP financial measure that is used by the Company to approximate cash available for distribution and is defined by the Company as net income available to common stockholders, computed in accordance with GAAP, adjusted for (i) equity-based compensation expense (
Source: SEC EDGAR · 8-K filed Feb 14, 2018
More decks from Apollo Commercial Real Estate Finance, Inc
 Q2 2026 Earnings Presentation11 slides · Aug 11, 2026
 Q1 2026 Earnings Presentation19 slides · Apr 29, 2026
 Investor Presentation (March 2026)21 slides · March 2026
 Q4 2025 Earnings Presentation22 slides · Feb 11, 2026
 Merger or Acquisition (January 2026)8 slides · Jan 28, 2026
 Investor Presentation (December 2025)22 slides · December 2025