USA Truck — Stephens Inc. Fall Investment Conference 2008
28 slides from USA Truck's conference presentation, Nov 19, 2008
Slide 1: USA Truck
USA Truck

Slide 2: Forward-Looking Statement
Forward-Looking Statement This information and statements made at the Stephens Inc. Fall Investment Conference may contain forward-looking statements within the meaning of Section 27A of the Securities Act of 1933, as amended and Section 21E of the Securities Exchange Act of 1934, as amended. These
Slide 3: USA Truck
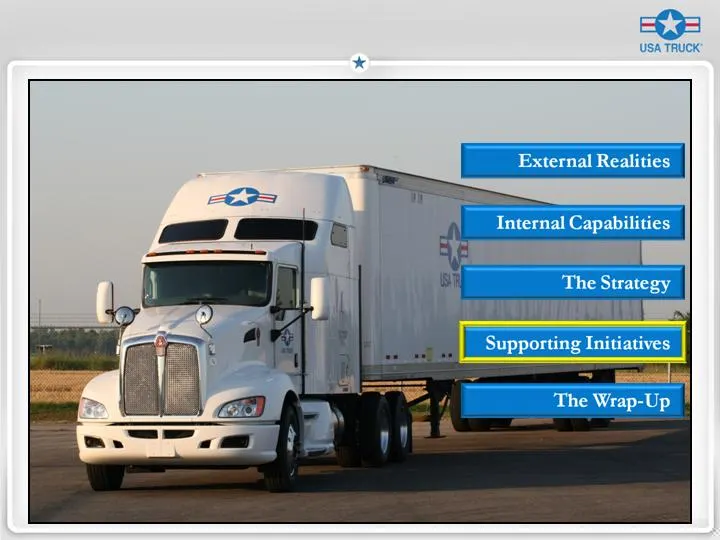
USA TRUCK The Strategy Supporting Initiatives 72 ES ee The Wrap-Up se
Slide 4: Our Stock is Under-Valued
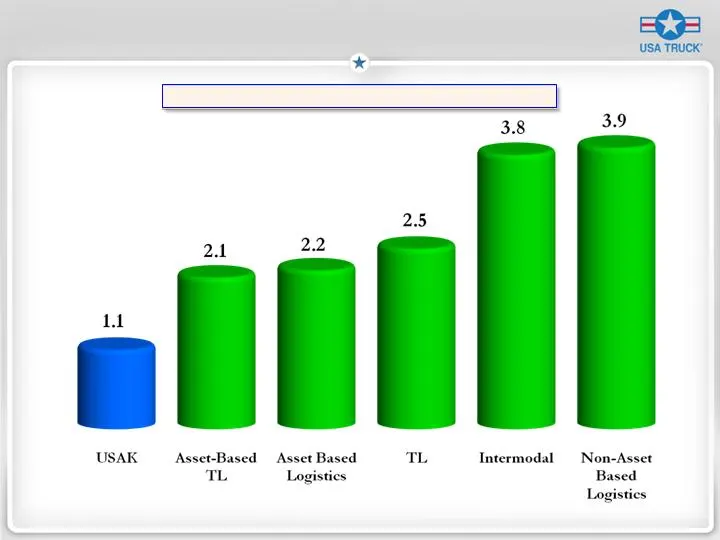
Our Stock is Under-Valued As of November 10, 2008 Price to Book Multiples
Slide 5: Market Rejected Growth Strategy
Market Rejected Growth Strategy USAK is the 2 nd fastest growing name in TL Group * over past 10 years (14.3% revenue CAGR), but……. 7 th out of 9: EBITDA Growth CAGR 8 th out of 9: Average ROCE and ROIC 2 nd Largest Spread: Revenue CAGR and EBITDA CAGR (850 BPS) 2 nd Largest Spread: Revenue CAGR and
Slide 6: ROC Drives Stock!
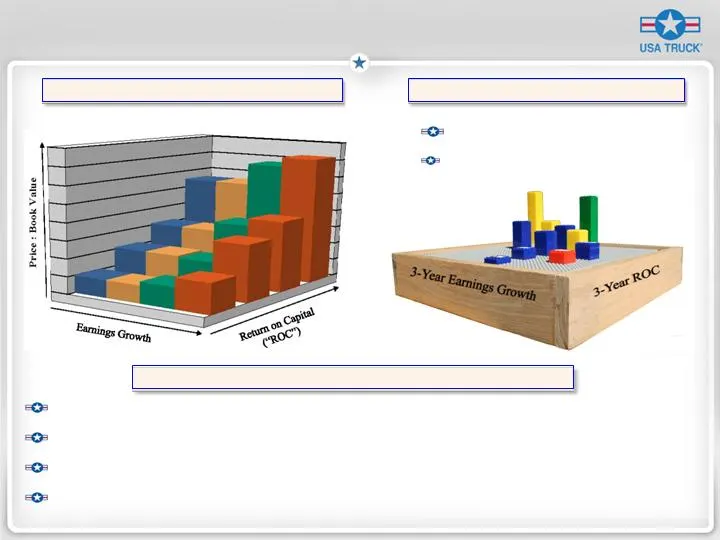
ROC Drives Stock! Copeland’s Value Mountain Revenue Growth vs. Stock Price: Low Correlation + 27% Operating Ratio vs. Stock Price: Lowest Correlation - 2% EBIT Growth vs. Stock Price: High Correlation + 74% ROCE vs. Stock Price: Highest Correlation + 79% Stock Performance Drivers Lane’s Value Mounta
Slide 7: Divergent Business Models
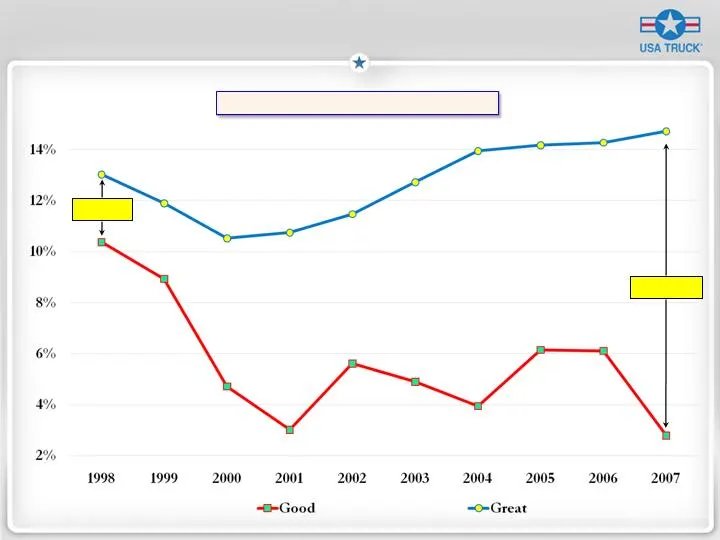
Divergent Business Models 1,190 BPS 270 BPS Operating Margin Comparison 2007 Average LOH = 829 2007 Average LOH = 550
Slide 8: External Realities
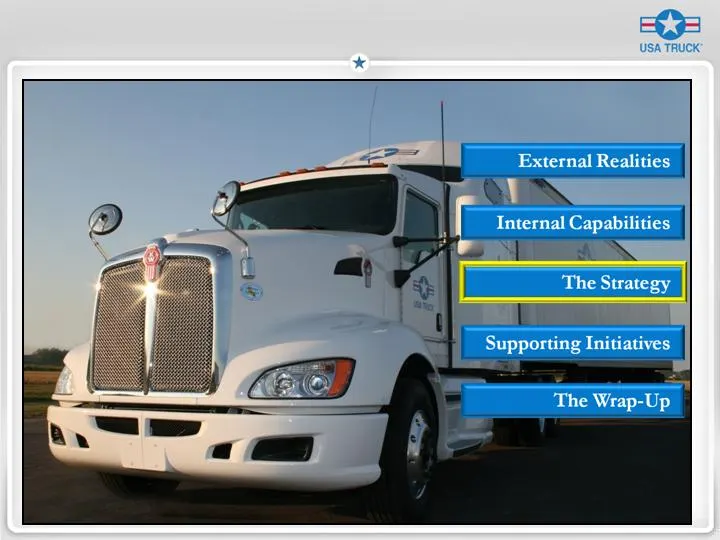
External Realities Internal Capabi The Strategy Supporting Initiatives The Wrap-Up
Slide 9: People
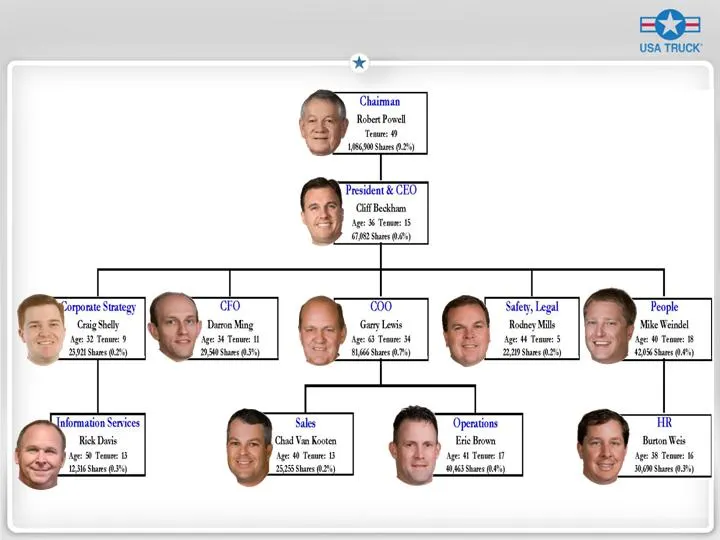
People Mike Weide Sg 0 Teme 8 Suc 8) Rik Davis Age 38 Tee B tas 3) Esc Bown ge A Tene 17 Pier He Buon Weis Age 3 Teo Bs 0%)
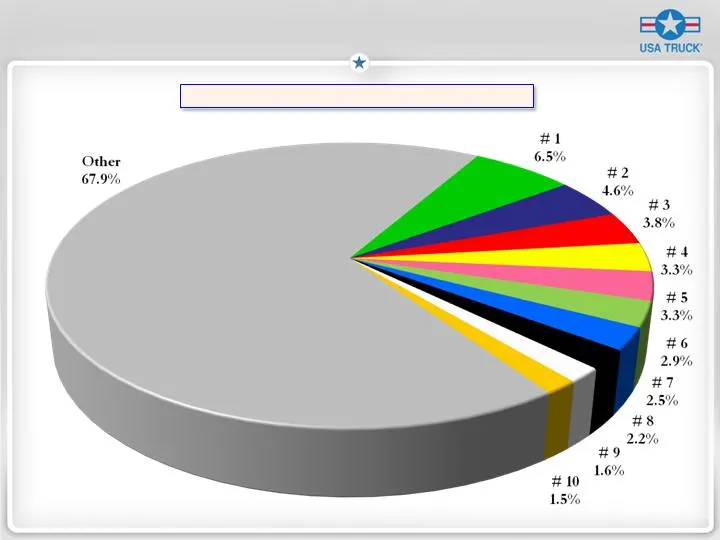
Slide 10: Strong Core
Strong Core Deep, Diverse Customer Base
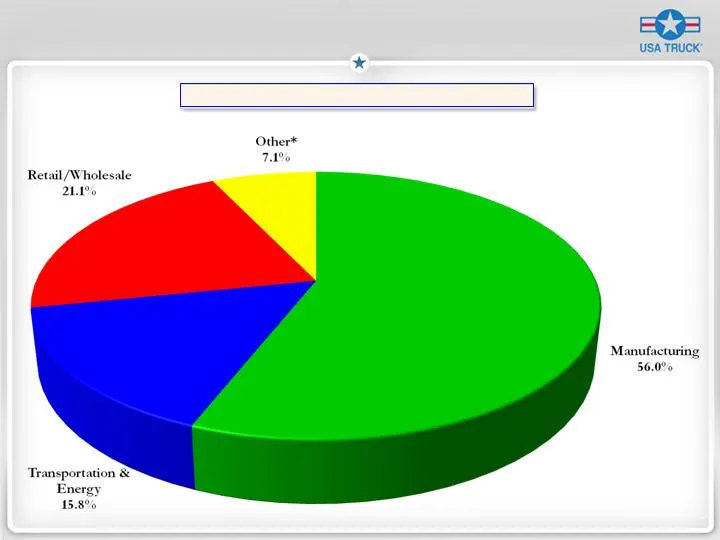
Slide 11: Strong Core
Strong Core Industries Serviced
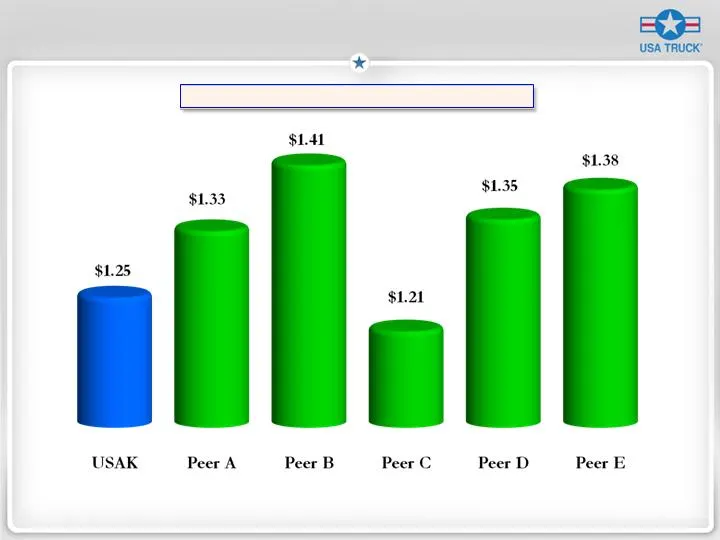
Slide 12: Best-In-Class Cost Structure
Best-In-Class Cost Structure Operating Cost per Mile * * Asset-based operations only for quarter ended September 30, 2008 Source: SEC Documents and USA Truck, Inc.
Slide 13
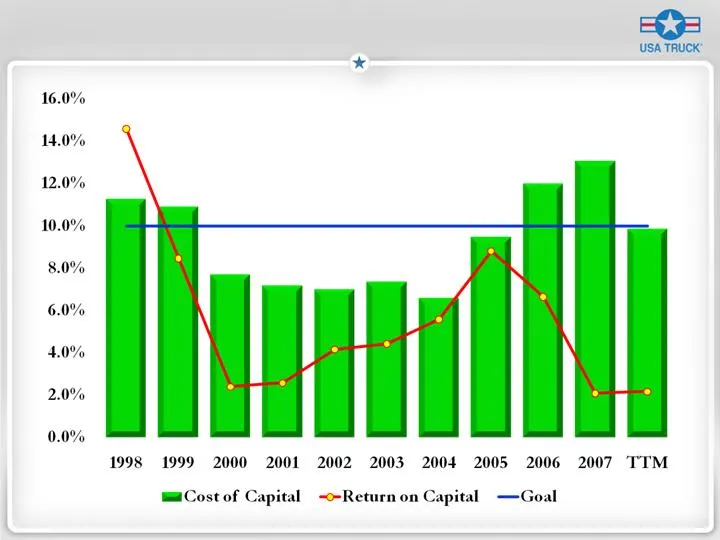
Slide 14: Return on Capital vs Cost of Capital
16.0% 14.0% 12.0% 10.0% 8.0% 6.0% 4.0% 2.0% 0.0% 1998 1999 2000 2001 2002 2003 2004 2005 2006 2007 TTM ma Cost of Capital Return on Capital —Goal
Slide 15: A Fresh Operating Strategy
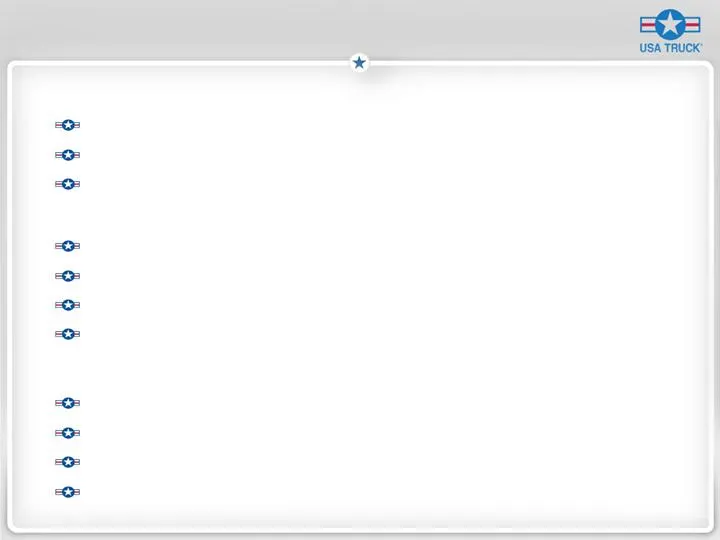
A Fresh Operating Strategy Preserve the Core : Customer base Cost discipline Service culture Trucking Segment : Restrict capacity growth Build profitable freight flows Reduce length of haul Increase use of asset-light owner operators (120/5%) Strategic Capacity Solutions (SCS) Segment : Aggressive g
Slide 16: The VEVA Plan
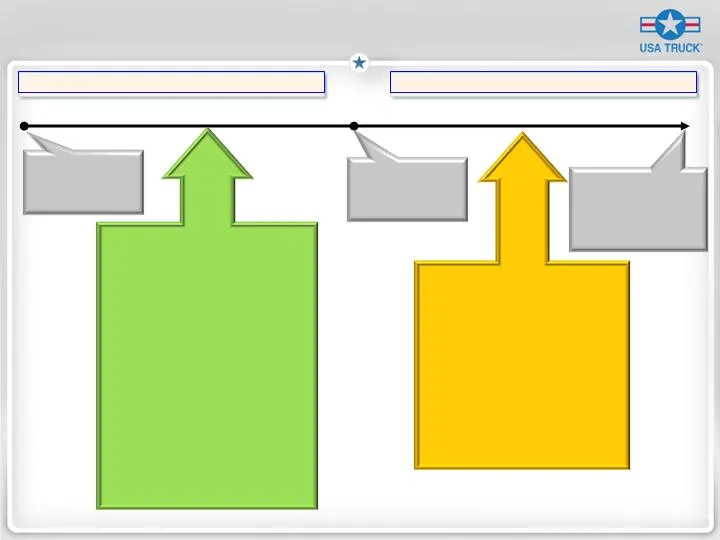
The VEVA * Plan August 2007 December 2013 December 2010 PHASE II – Earnings Growth * We call our strategic plan Vision for Economic Value-Added, or VEVA 1.0 x Book Value 2 % ROC 98% O.R. 3.0 x Book Value 10% ROC 89% O.R. 4.0 x Book Value ≥ 10% ROC ≥ 10% EBIT CAGR < 89% O.R. The Results We’ll Need Co
Slide 17
Slide 18: Project Velocity
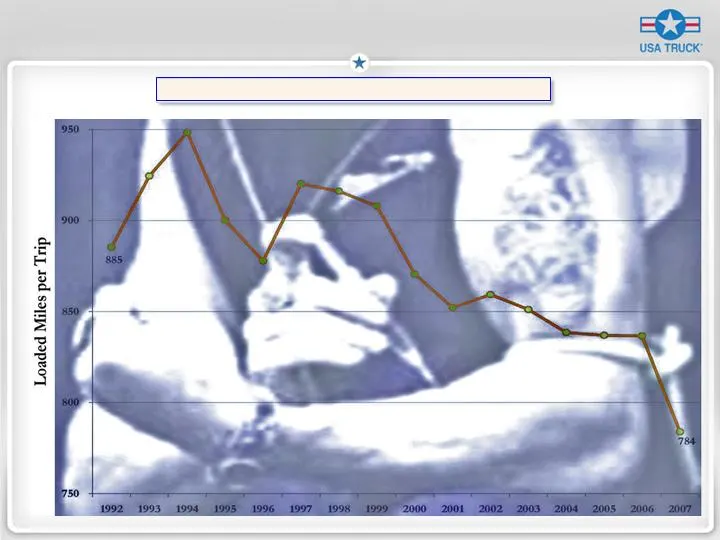
Project Velocity Our Mileage Addiction
Slide 19: Velocity Effect
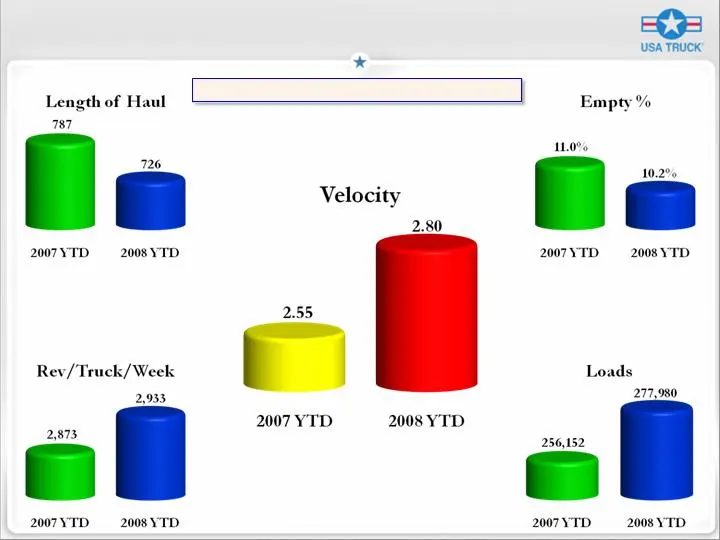
Velocity Effect Nine Months Ended September 30
Slide 20: Project Velocity
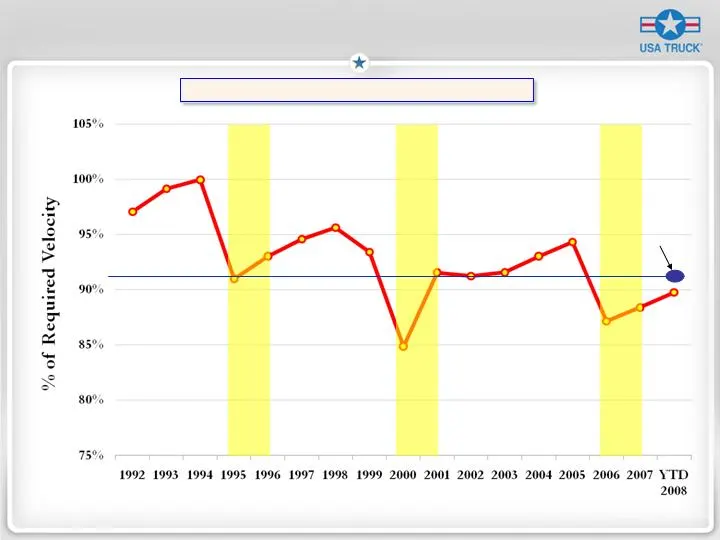
Project Velocity Performance History March 22 to September 30
Slide 21: Yield Management
Yield Management Base Revenue per Paid Mile (2000 = 100) 4.7% CAGR 1.1% CAGR
Slide 22: The War on Accidents
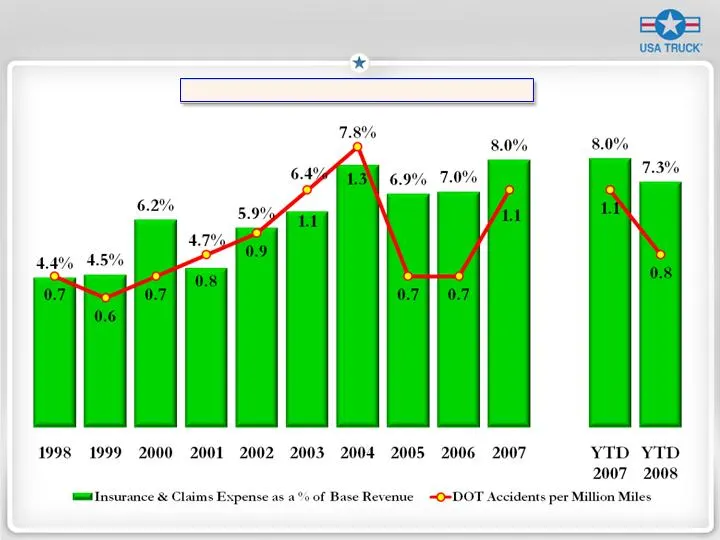
The War on Accidents Insurance & Claims
Slide 23: Strategic Capacity Solutions
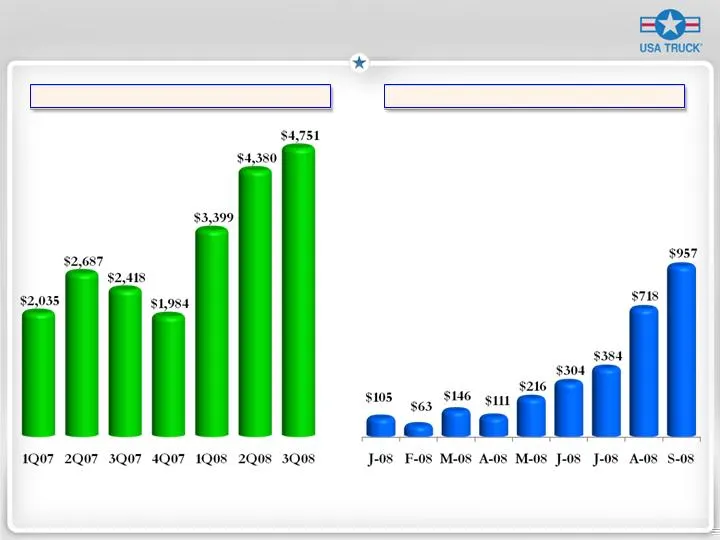
Strategic Capacity Solutions Freight Brokerage Growth * Intermodal Growth * *Base Revenue (excludes fuel surcharge) in Thousands
Slide 24: Project Tech
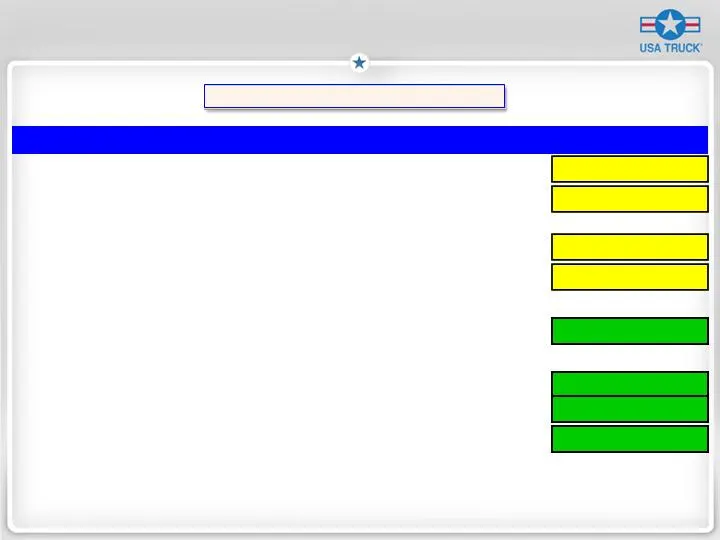
Software Application Hardware Platform Developer Year Installed Age Project Tech Accounts Payable Mainframe 3 rd Party Accounting Mainframe 3 rd Party Risk Management Mainframe Custom Operations Mainframe Custom Accounts Receivable Mainframe Custom Maintenance Mainframe Custom Website Mainframe Cust
Slide 25: Project People
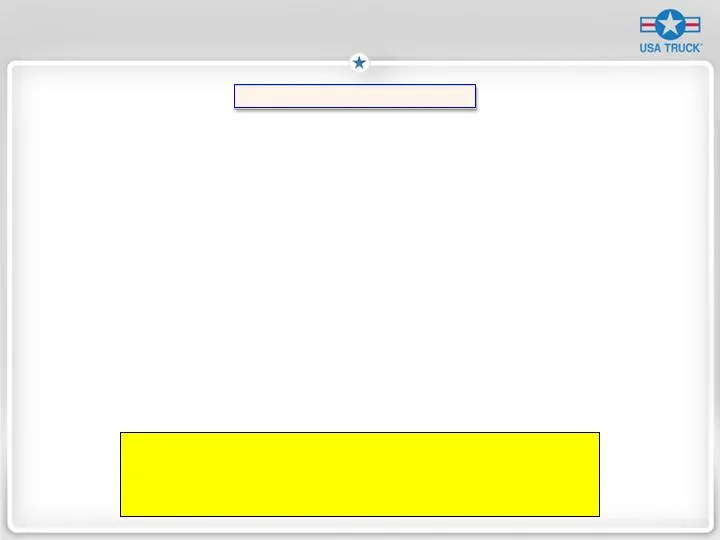
Project People USAK – 1/1/2008 3.2 : 1 Peer Average – 2007 3.8 : 1 Best-in-Class – 2007 6.0 : 1 USAK – 9/30/08 3.5 : 1 Driver to Non-Driver Ratio Education Level Fort Smith MSA National Average Less than High School 27% 20% Bachelor’s degree or higher 13% 24%
Slide 26
Slide 27: Why Invest In USA Truck?
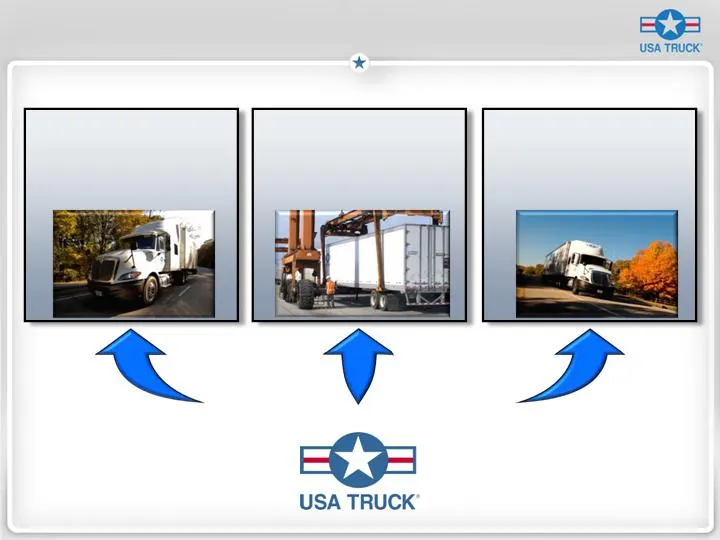
Why Invest In USA Truck? We have a solid core of service, cost discipline and a diverse customer portfolio. Our stock is trading at a deep discount to our industry peers. We have a vision and a plan to create shareholder value.
Slide 28: USA Truck
USA Truck
Source: SEC EDGAR · 8-K filed Nov 19, 2008
More decks from USA Truck Inc
 Investor Presentation (June 2014)26 slides · Jun 9, 2014
 Q4 2013 Earnings Presentation16 slides · Feb 11, 2014
 Investor Presentation (October 2013)34 slides · Oct 17, 2013
 Q3 2013 Earnings Presentation12 slides · Oct 17, 2013
 Conference Presentation (August 2011)17 slides · Aug 24, 2011
 Conference Presentation (June 2011)17 slides · Jun 14, 2011