Ayala Land Inc. · PSE:ALI
Ayala Land — 9M 2017 Earnings Presentation
25 slides from Ayala Land's earnings presentation, Nov 7, 2017
Slide 1: Ayala Land 9M 2017 Analysts' Briefing
WK AyalaLand 9M 2017 | Analysts’ Briefing 07 November 2017

Slide 2: Contents
Contents
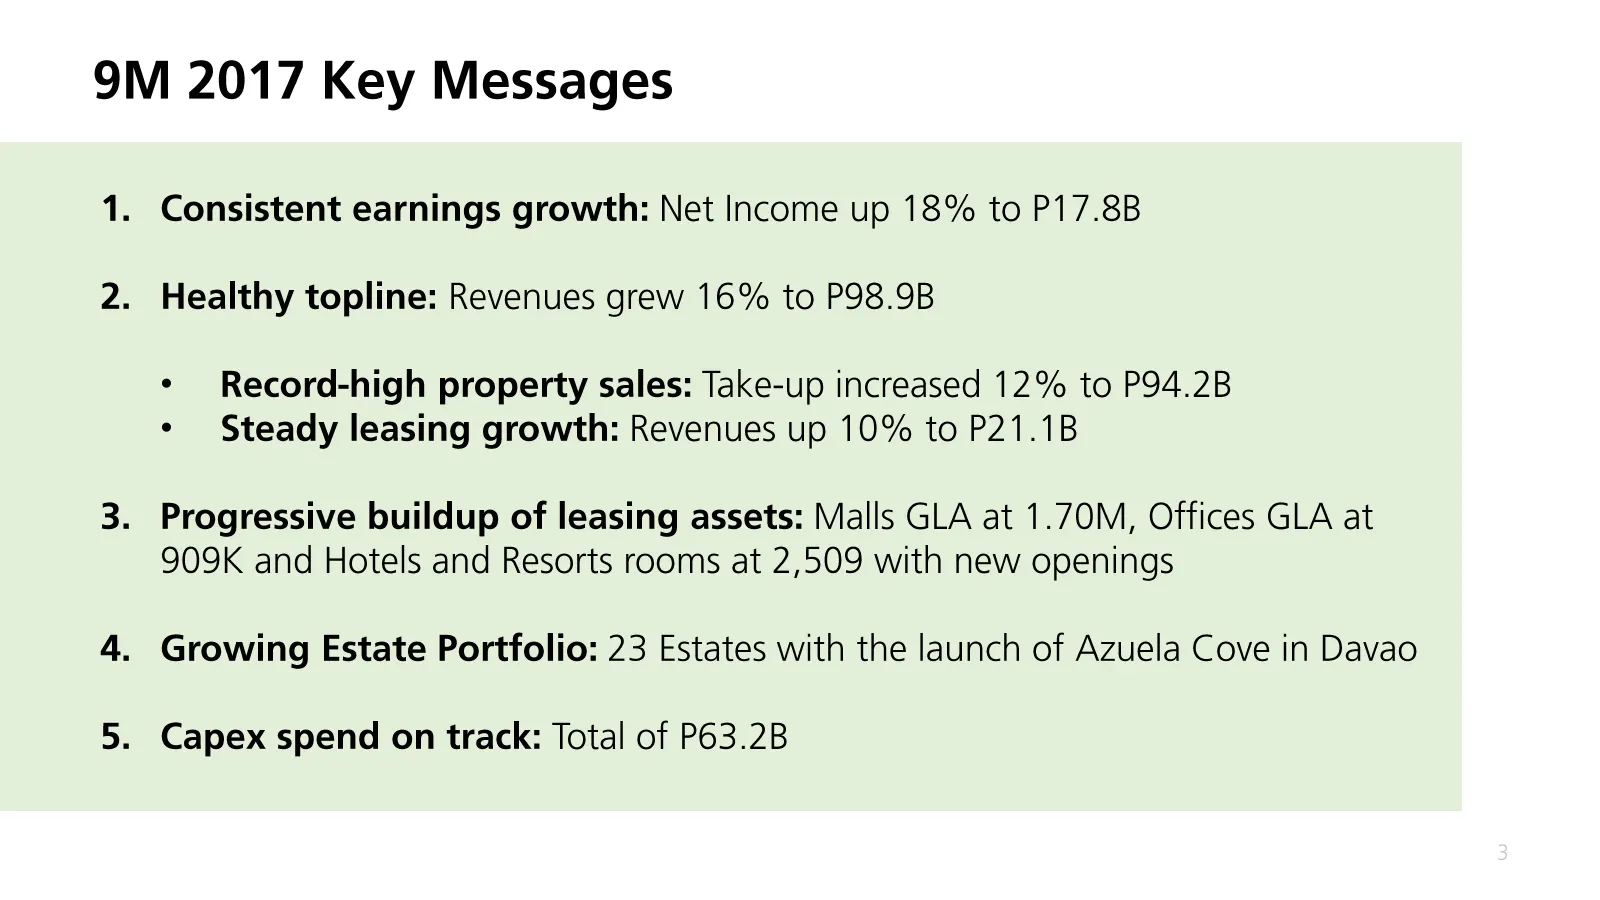
Slide 3: 9M 2017 Key Messages
9M 2017 Key Messages 1. Consistent earnings growth: Net Income up 18% to P17.8B 2. Healthy topline: Revenues grew 16% to P98.9B ¢ Record-high property sales: Take-up increased 12% to P94.2B * Steady leasing growth: Revenues up 10% to P21.1B 3. Progressive buildup of leasing assets: Malls GLA at 1.70
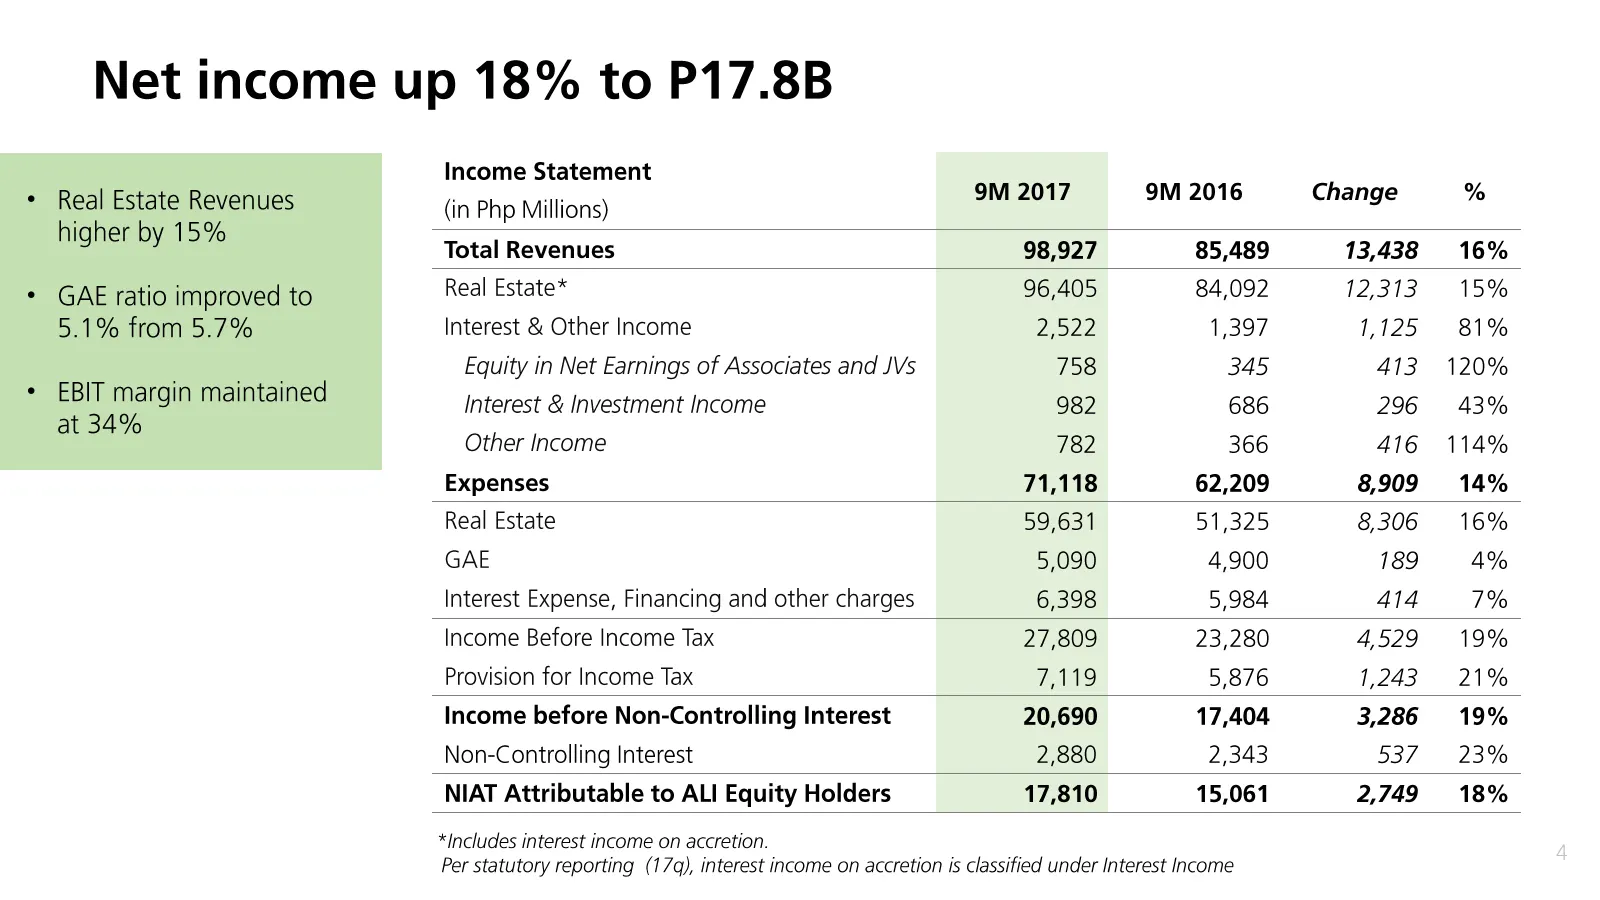
Slide 4: Net income up 18% to P17.8B
Net income up 18% to P17.8B * Real Estate Revenues higher by 15% * GAE ratio improved to 5.1% from 5.7% * EBIT margin maintained at 34% Income Statement (in Php Millions) 9M 2017 9M 2016 Change % Total Revenues 98,927 85,489 13,438 16% Real Estate* 96,405 84,092 12,313 15% Interest & Other Income 2,
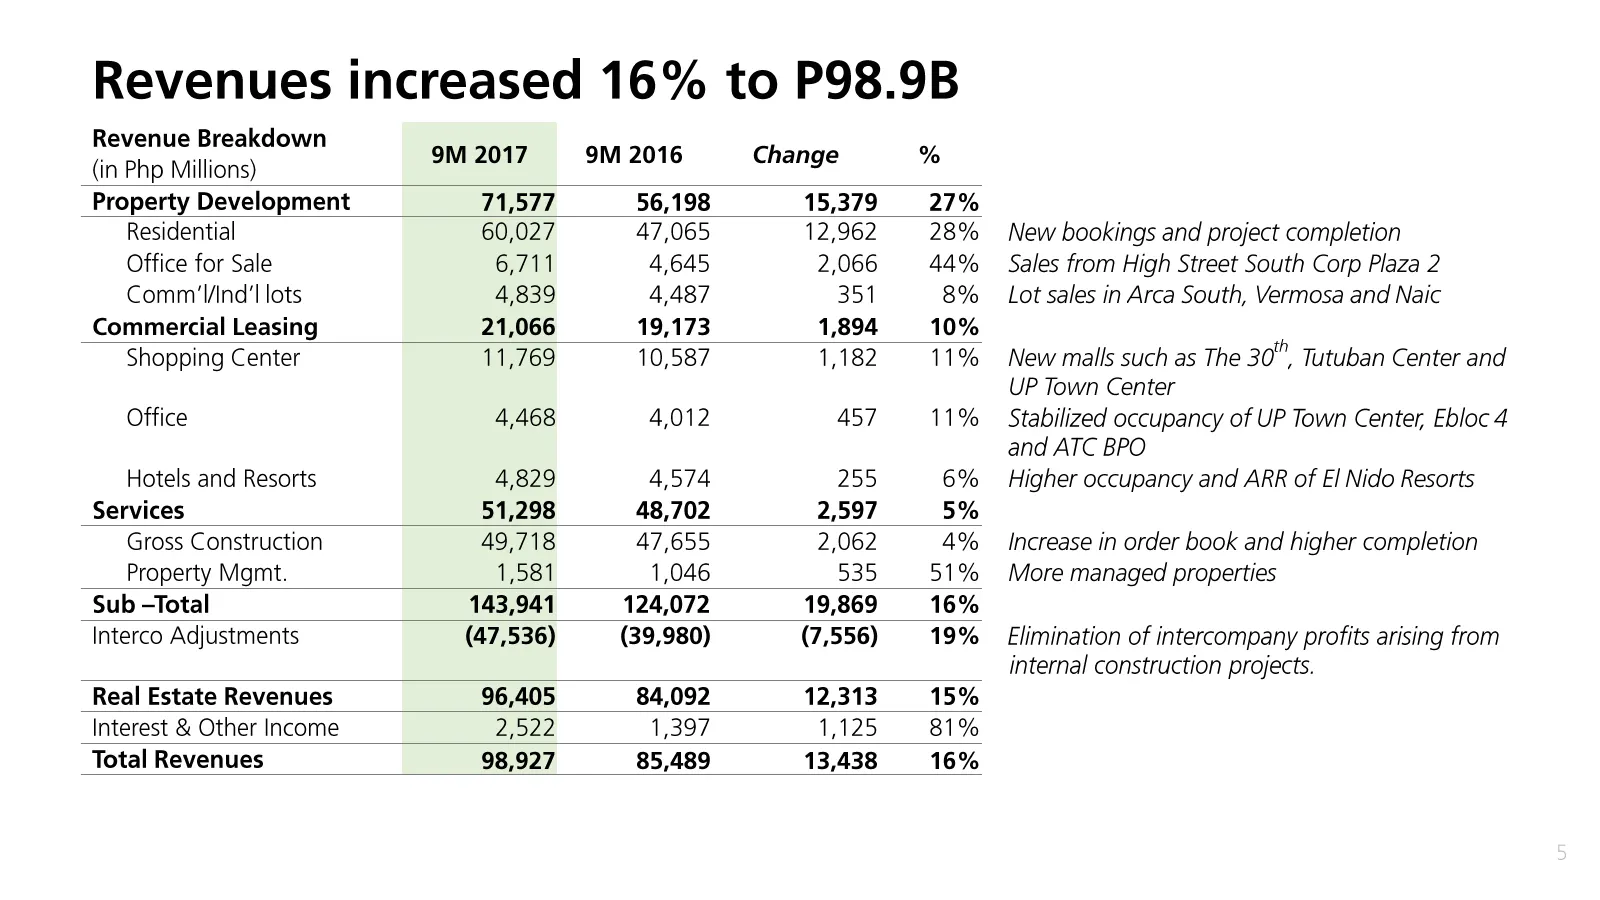
Slide 5: Revenues increased 16% to P98.9B
Revenues increased 16% to P98.9B Revenue Breakdown (in Php Millions) 9M 2017 9M 2016 Change % Property Development 71,577 56,198 15,379 27% Residential 60,027 47,065 12,962 28% Office for Sale 6,711 4,645 2,066 44% Comm'I/Ind'! lots 4,839 4,487 351 8% Commercial Leasing 21,066 19,173 1,894 10% Shopp
Slide 6: Margins are within healthy levels
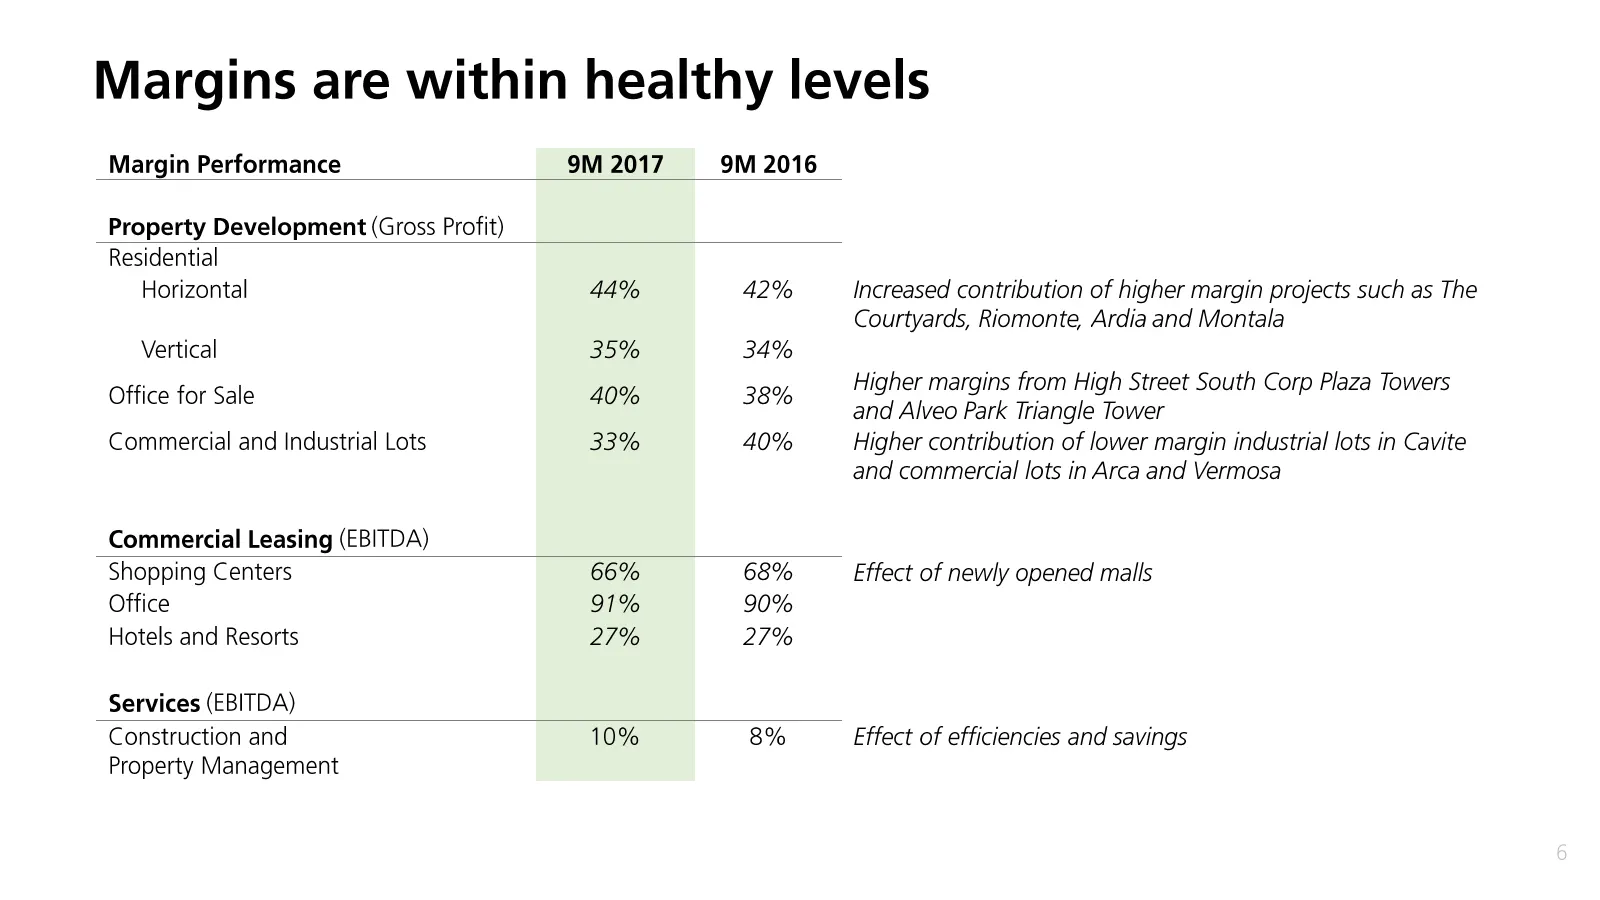
Margins are within healthy levels Margin Performance 9M 2017 9M 2016 Property Development (Gross Profit) Residential Horizontal 44% 42% Vertical 35% 34% Office for Sale 40% 38% Commercial and Industrial Lots 33% 40% Commercial Leasing (EBITDA) Shopping Centers 66% 68% Office 91% 90% Hotels and Resor
Slide 7: New growth centers continue to gain traction
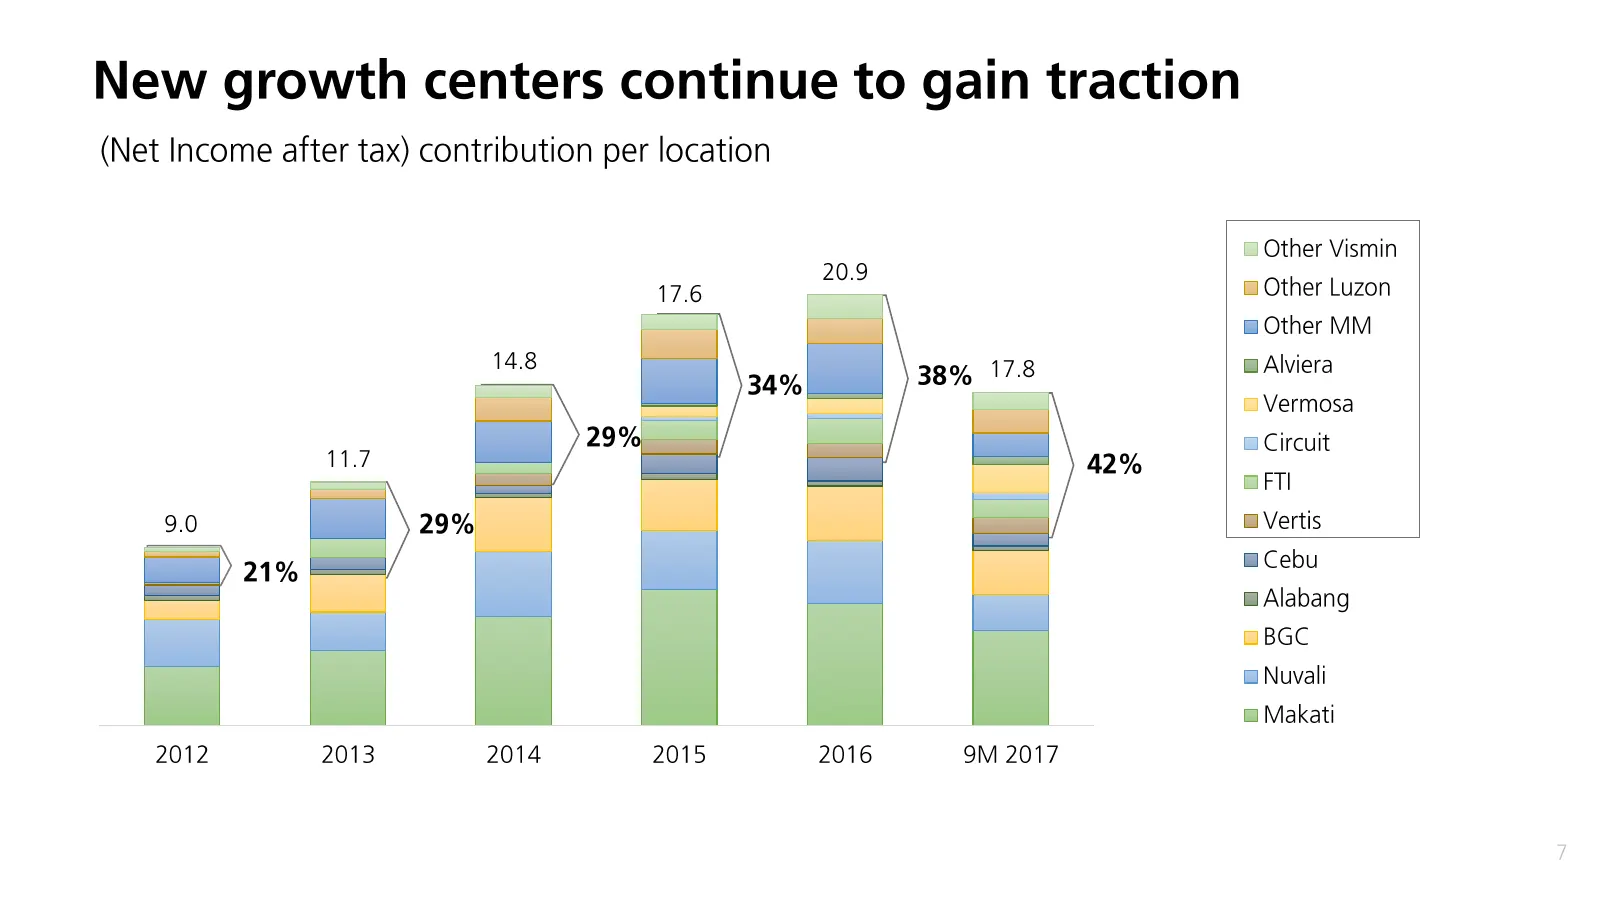
New growth centers continue to gain traction (Net Income after tax) contribution per location | Other Vismin @ Other Luzon mw Other MM 38% 17.8 BAlviera mVermosa 20.9 14.8 @ Circuit GFTI B Vertis 11.7 42% 9.0 Cebu BAlabang =m BGC GNuvali @ Makati 21% 2012 2013 2014 2015 2016 9M 2017
Slide 8: Recurring income is growing in line with the 2020-40 Plan
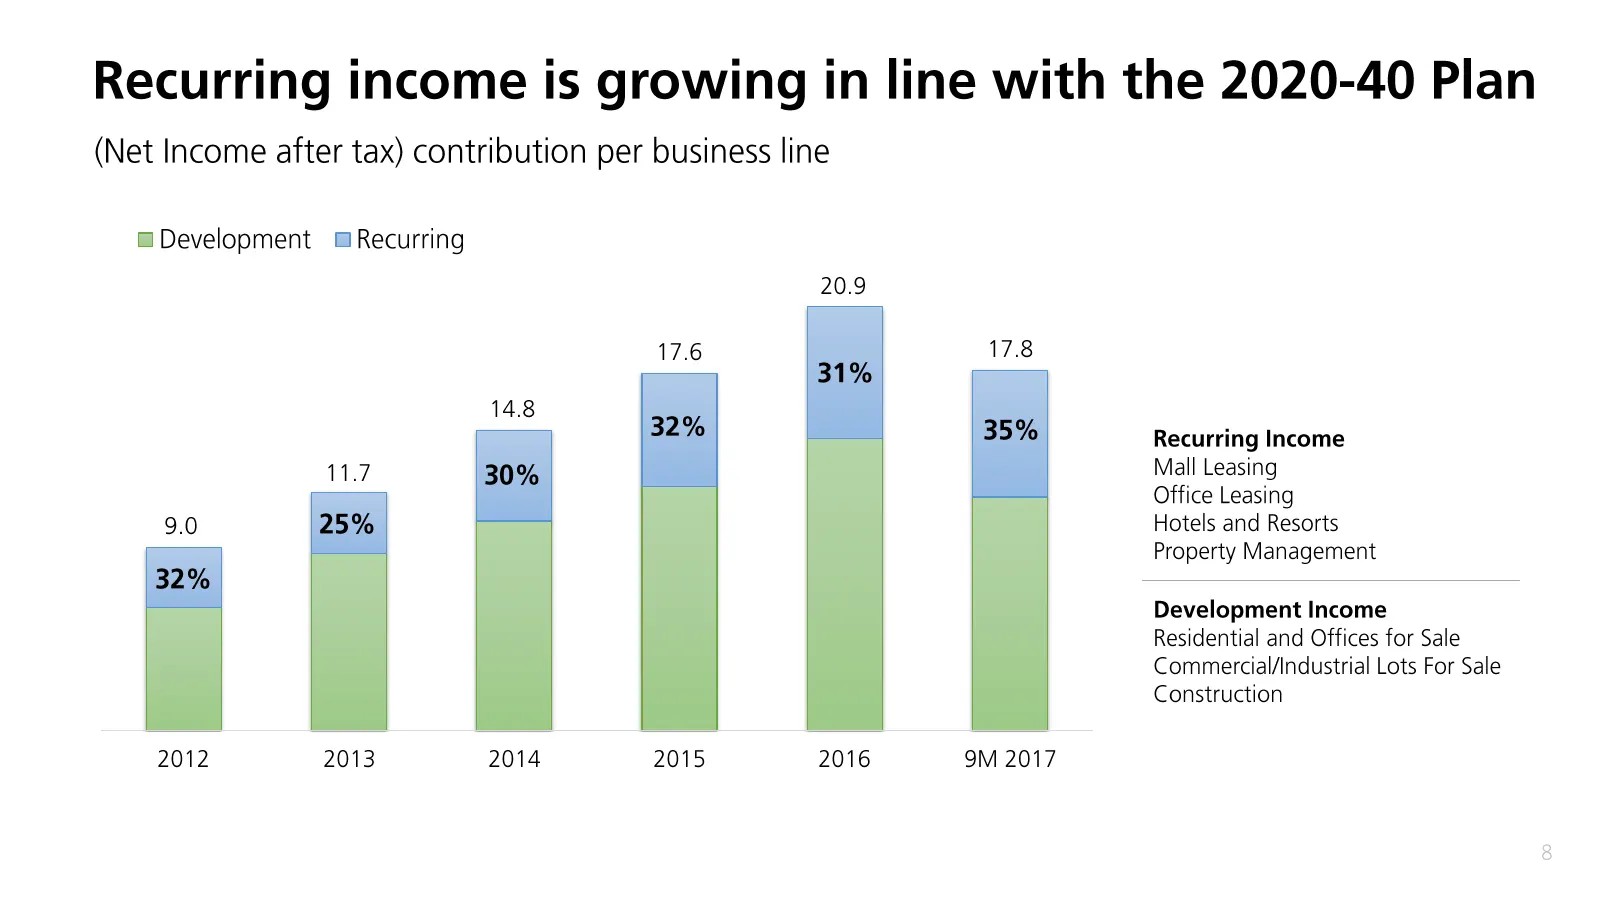
Recurring income is growing in line with the 2020-40 Plan (Net Income after tax) contribution per business line Development Recurring 17.6 17.8 14.8 Recurring Income 11.7 Mall Leasing Office Leasing 9.0 Hotels and Resorts Property Management Development Income Residential and Offices for Sale Commer
Slide 9: Our strong balance sheet supports growth plans
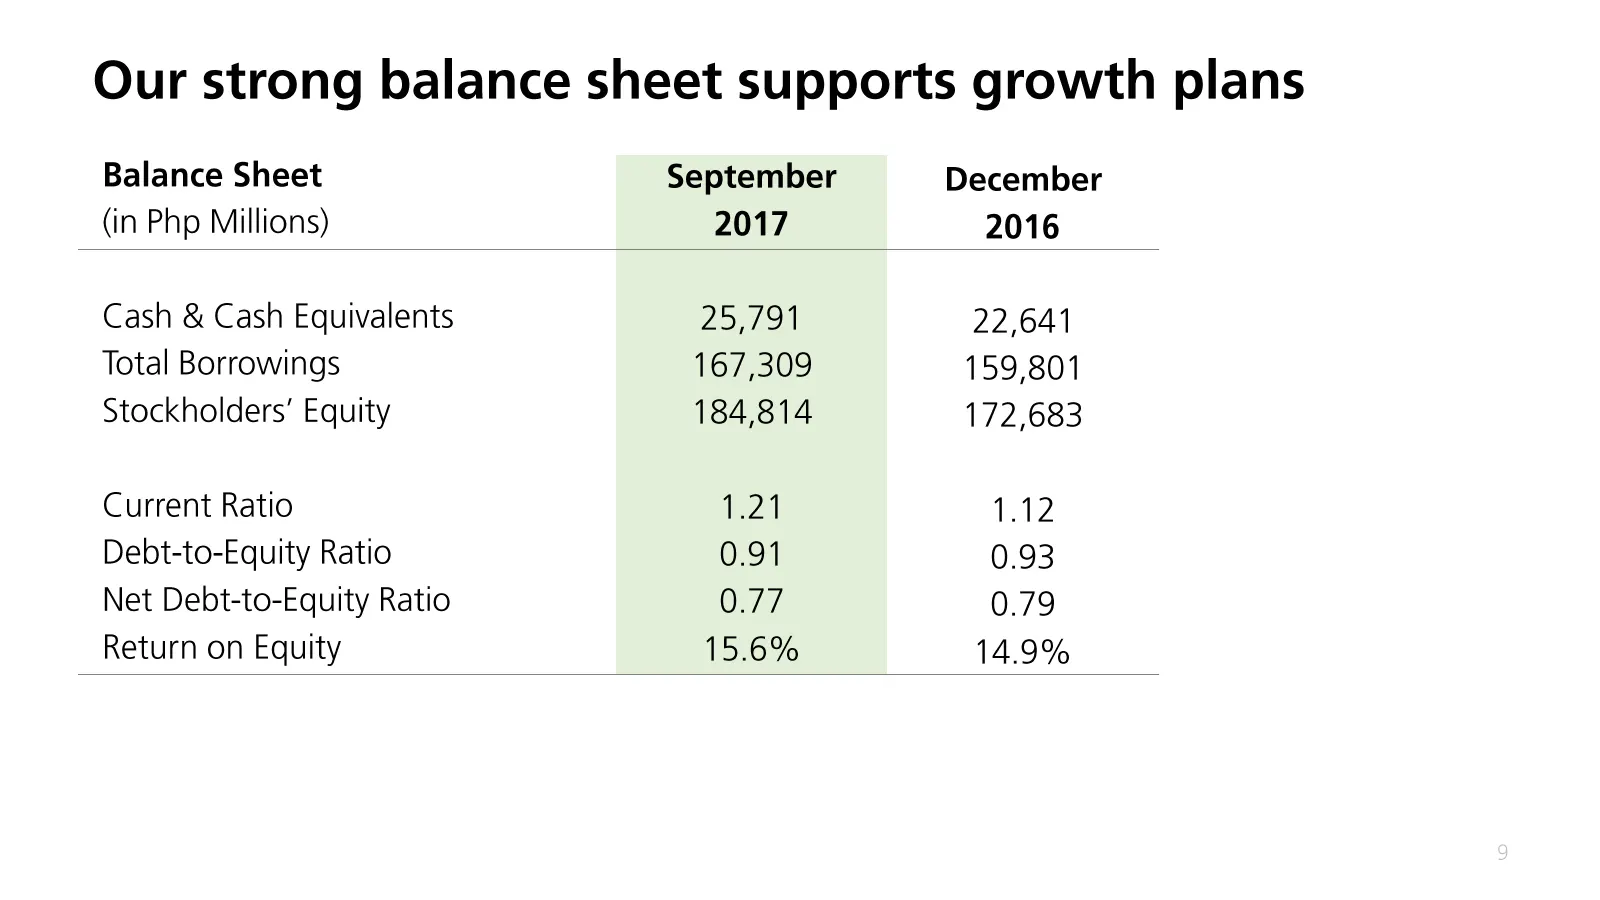
Our strong balance sheet supports growth plans Balance Sheet September December (in Php Millions) 2017 2016 Cash & Cash Equivalents 25,791 22,641 Total Borrowings 167,309 159,801 Stockholders’ Equity 184,814 172,683 Current Ratio 1.21 1.12 Debt-to-Equity Ratio 0.91 0.93 Net Debt-to-Equity Ratio 0.77
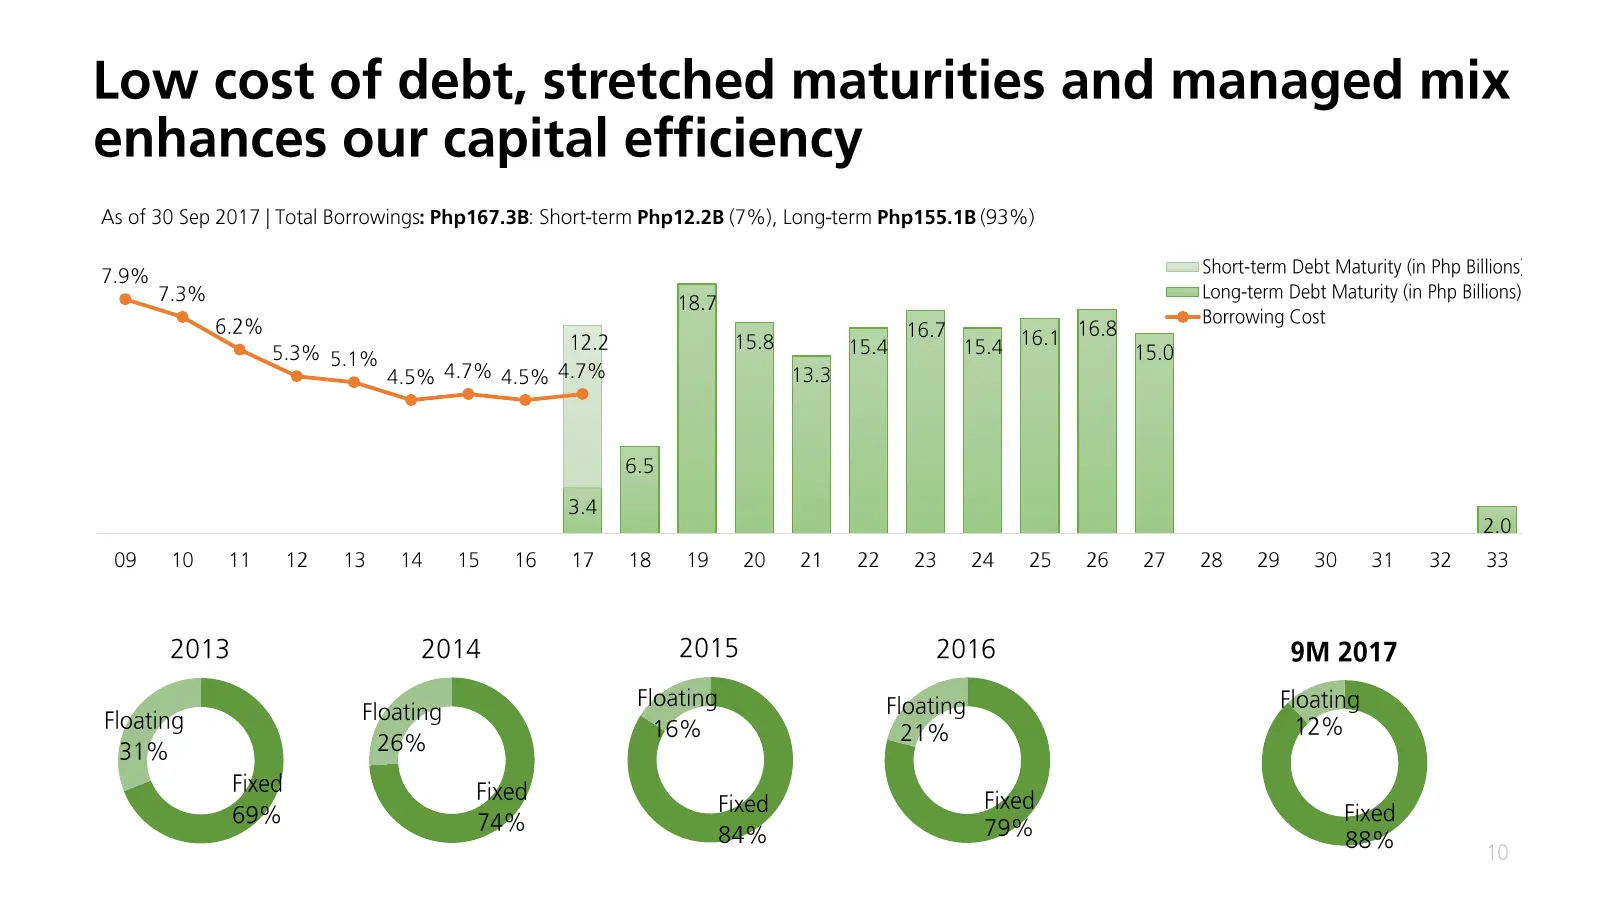
Slide 10: Low cost of debt, stretched maturities and managed mix
Low cost of debt, stretched maturities and managed mix enhances our capital efficiency As of 30 Sep 2017 | Total Borrowings: Php167.3B: Short-term Php12.2B (7%), Long-term Php155.1B (93%) 7.9% [=== Short-term Debt Maturity (in Php Billions, 7.3% [== Long-term Debt Maturity (in Php Billions) —®- Borr
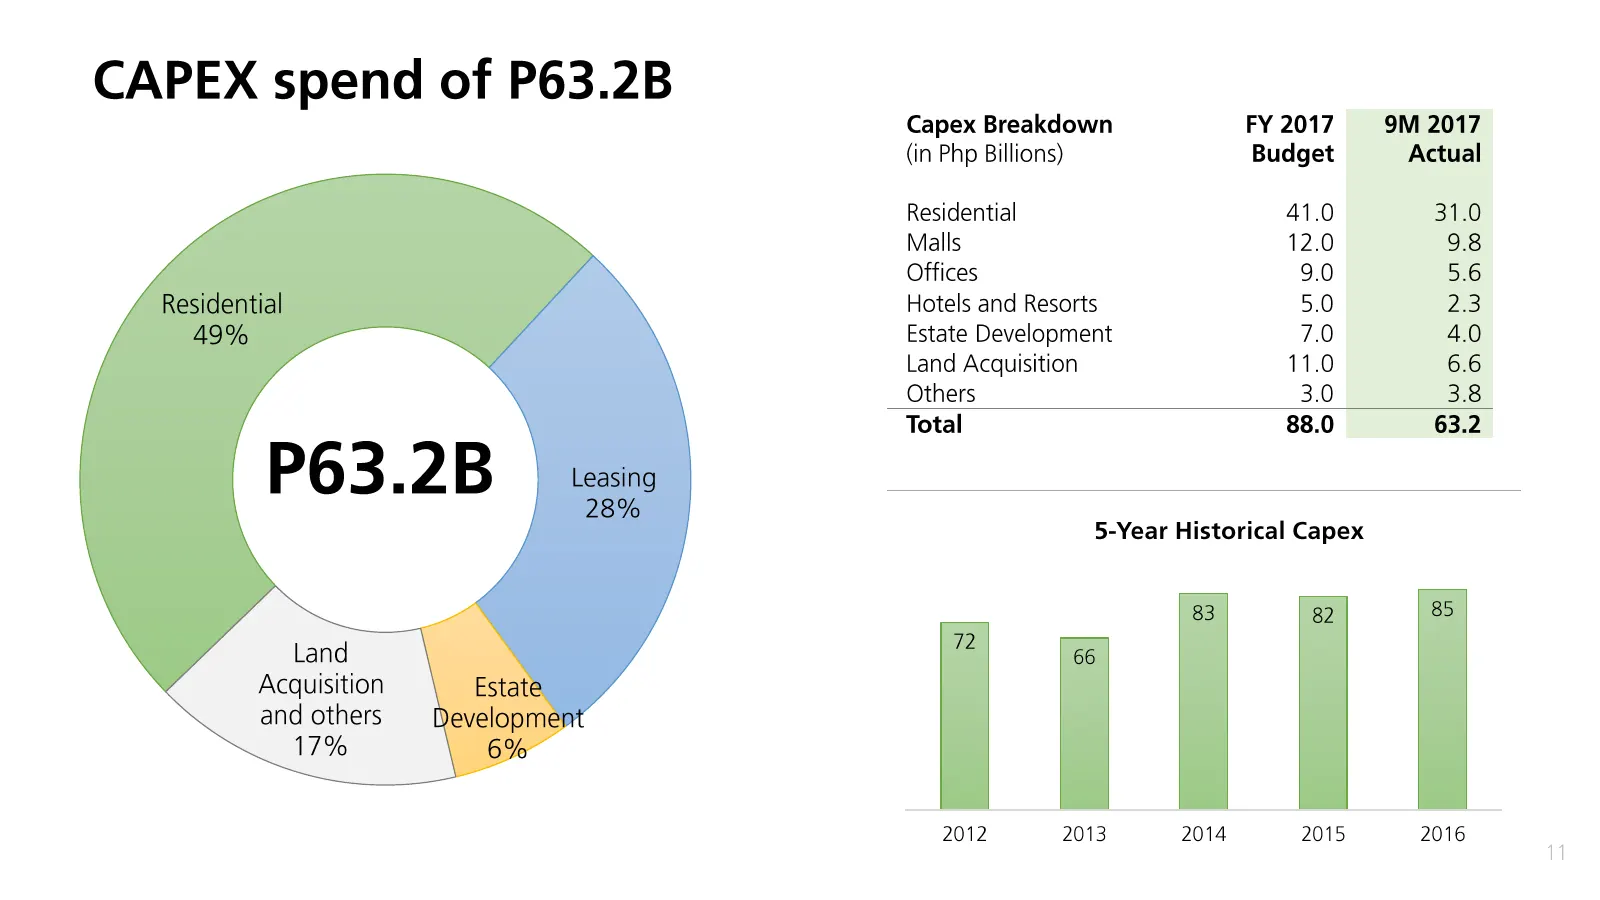
Slide 11: CAPEX spend of P63.2B
CAPEX spend of P63.2B Capex Breakdown FY 2017 9M 2017 (in Php Billions) Budget Actual Residential 41.0 31.0 Malls 12.0 9.8 Offices 9.0 5.6 Hotels and Resorts 5.0 2.3 Estate Development 7.0 4.0 Land Acquisition 11.0 6.6 Others 3.0 3.8 Total 88.0 63.2 5-Year Historical Capex 2012 2013 2014 2015 2016 L
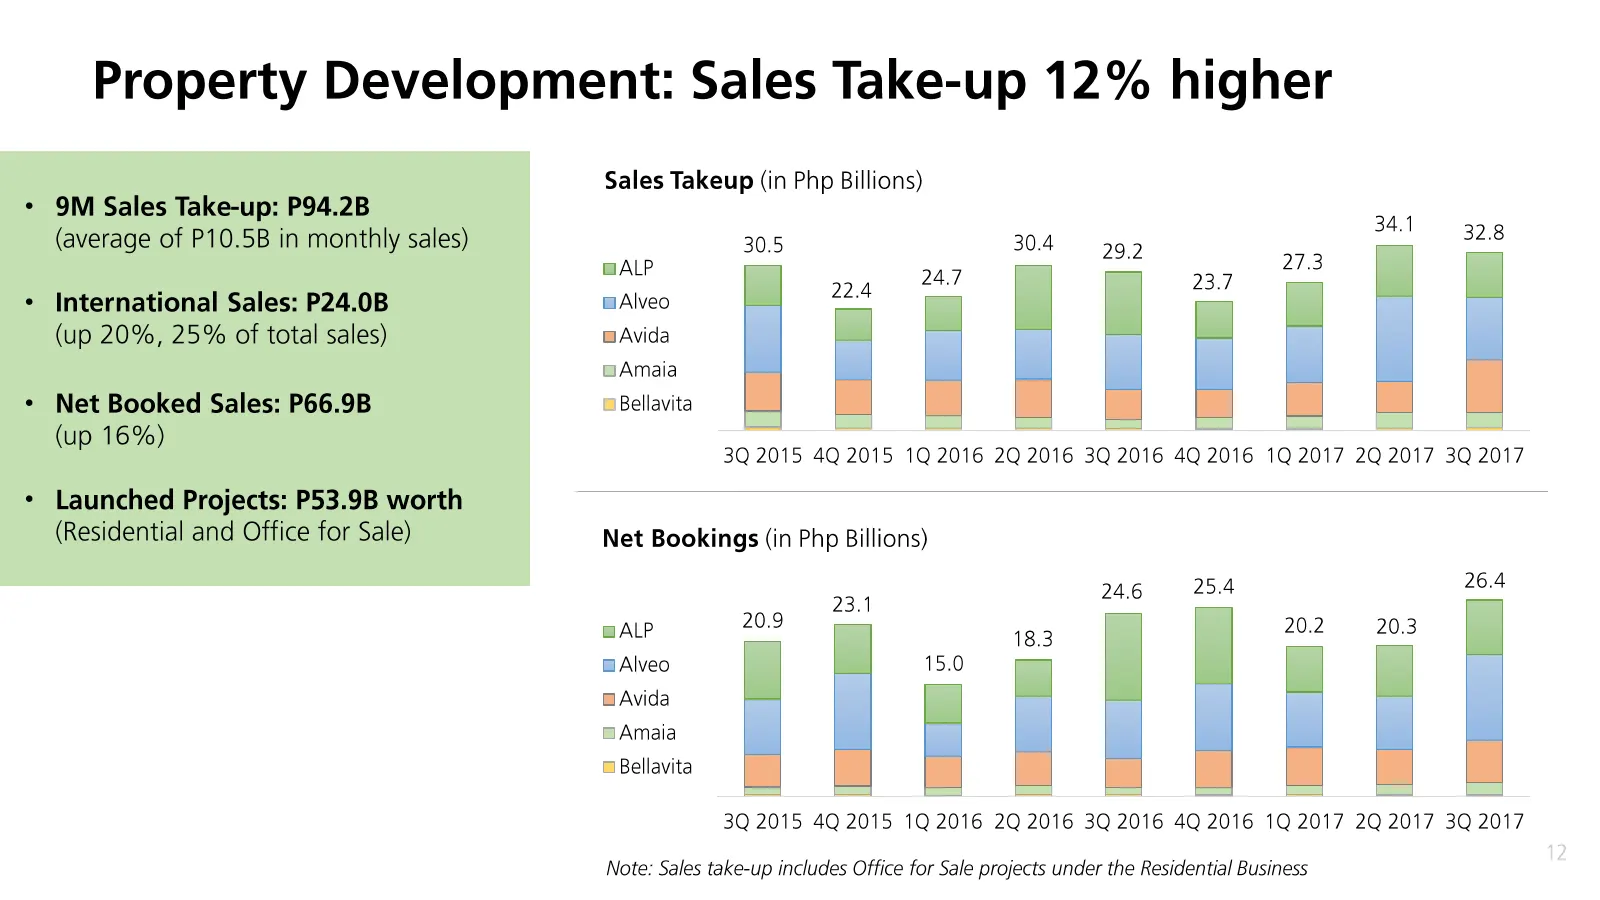
Slide 12: Property Development: Sales Take-up 12% higher
Property Development: Sales Take-up 12% higher Sales Takeup (in Php Billions) 34.1 32.8 BALP 30.5 30.4 24.7 aaa 23.7 27.3 wAlveo 22.4 wAvida Amaia mBellavita 3Q 2015 4Q 2015 1Q 2016 2Q 2016 3Q 2016 4Q 2016 1Q 2017 2Q 2017 3Q 2017 Net Bookings (in Php Billions) 26.4 23.1 ALP 20.9 24.6 25.4 183 20.2 2
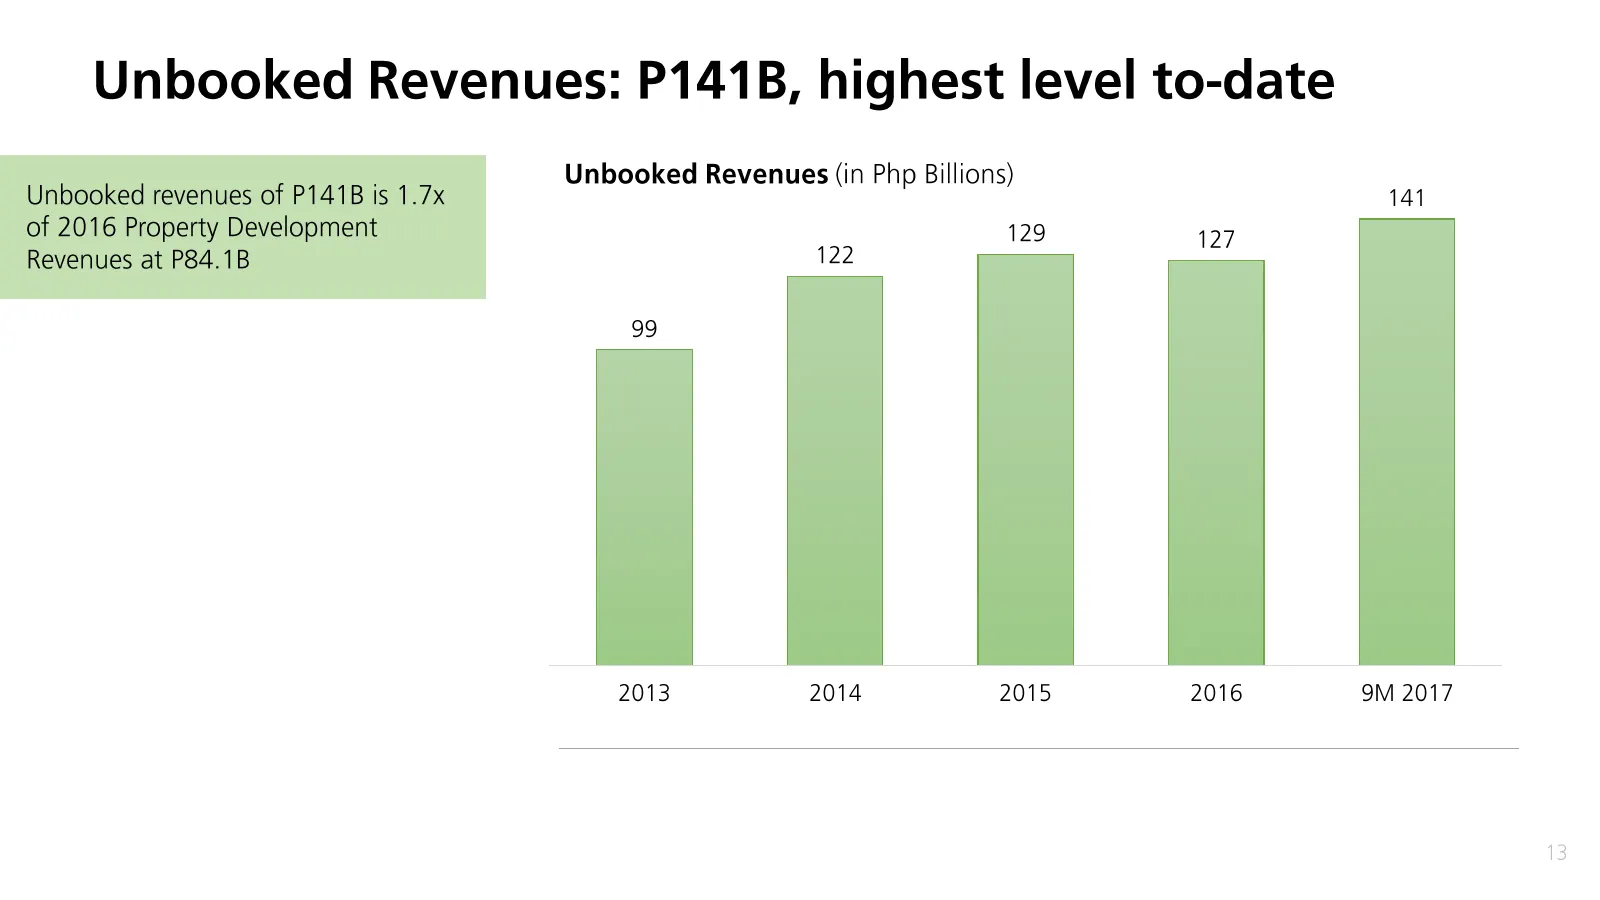
Slide 13: Unbooked Revenues: P141B, highest level to-date
Unbooked Revenues: P141B, highest level to-date Unbooked Revenues (in Php Billions) 2013 2014 2015 2016 9M 2017 13
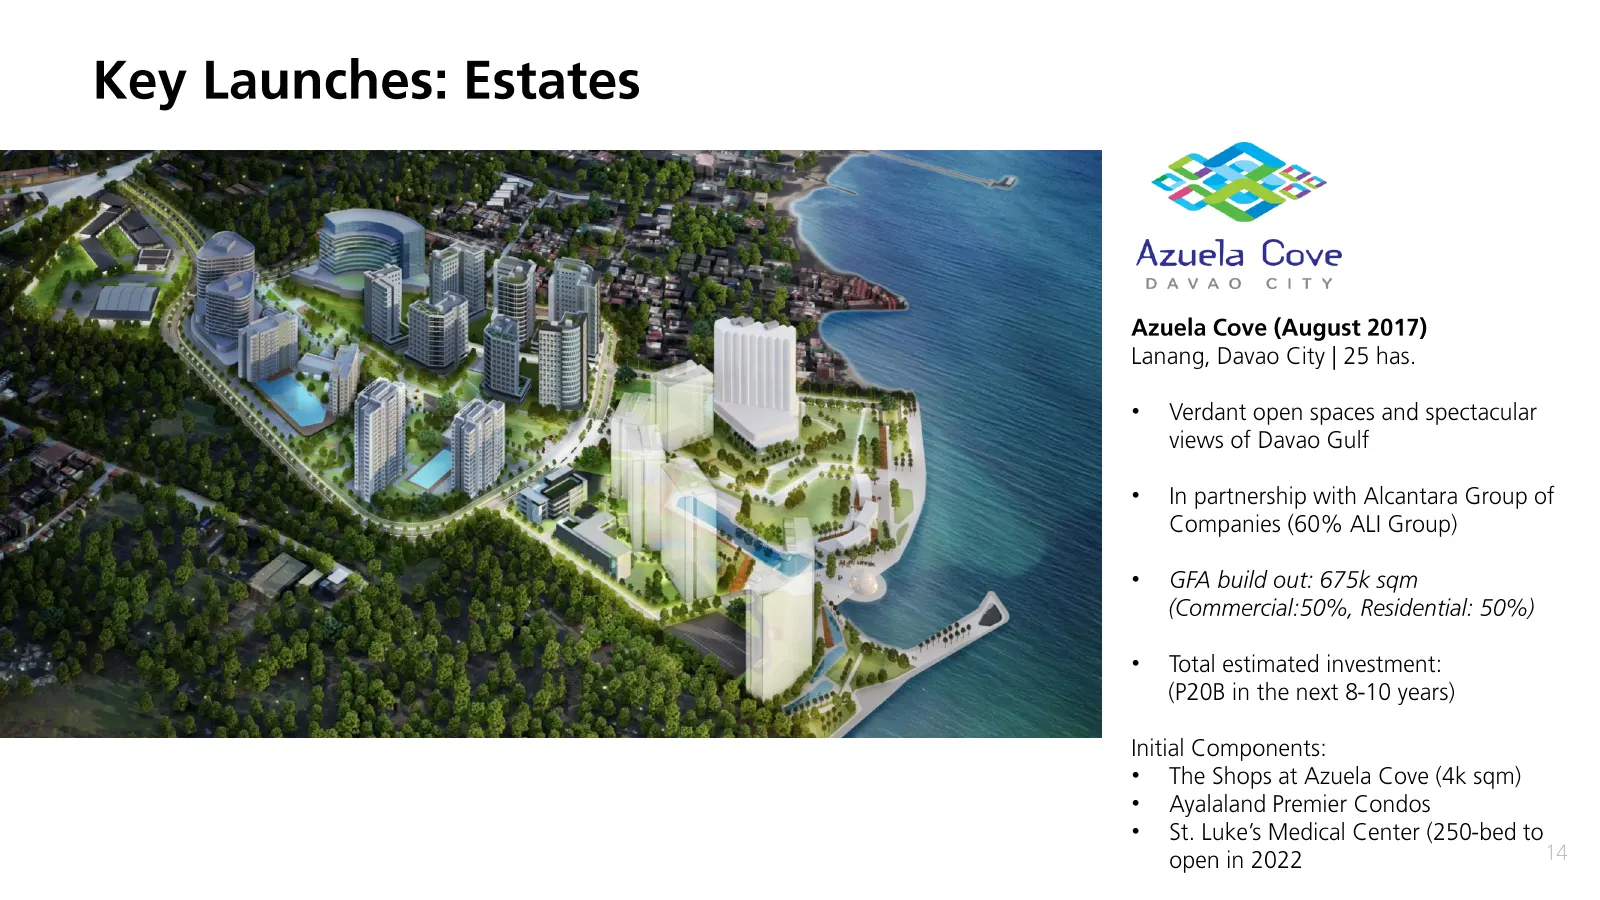
Slide 14: Key Launches: Estates
Key Launches: Estates Azuela Cove DAVAO CITY Azuela Cove (August 2017) Lanang, Davao City | 25 has. * Verdant open spaces and spectacular views of Davao Gulf * In partnership with Alcantara Group of Companies (60% ALI Group) * GFA build out: 675k sqm (Commercial:50%, Residential: 50%) * Total estima
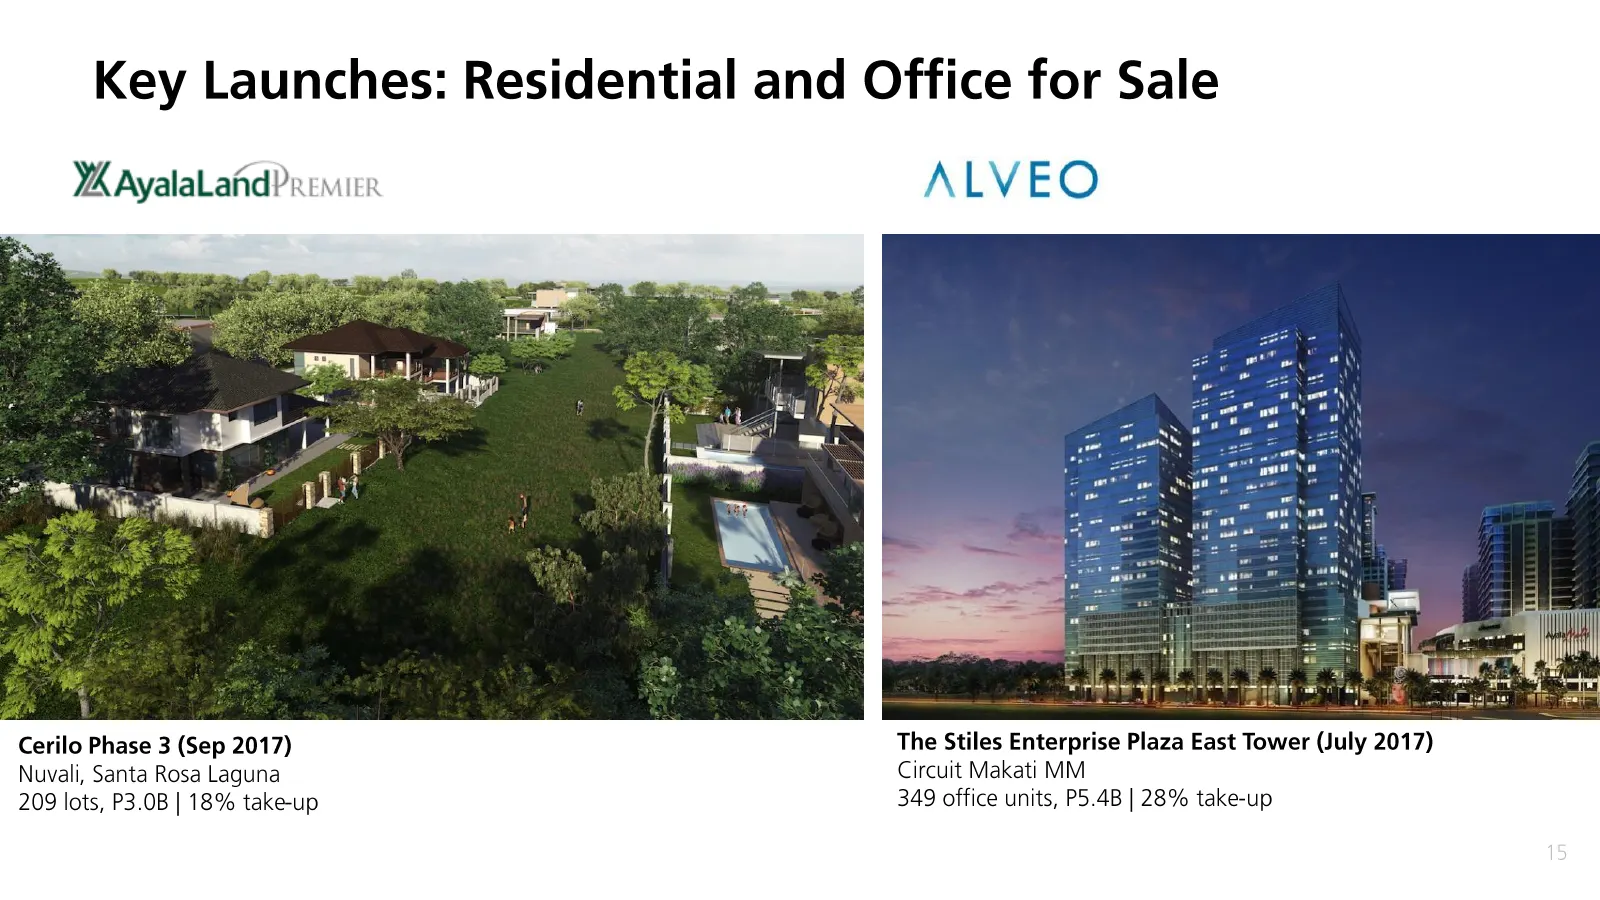
Slide 15: Key Launches: Residential and Office for Sale
Key Launches: Residential and Office for Sale WaAyalaLahdPremirr ALVEO Cerilo Phase 3 (Sep 2017) The Stiles Enterprise Plaza East Tower (July 2017) Nuvali, Santa Rosa Laguna Circuit Makati MM 209 lots, P3.0B | 18% take-up 349 office units, P5.4B | 28% take-up
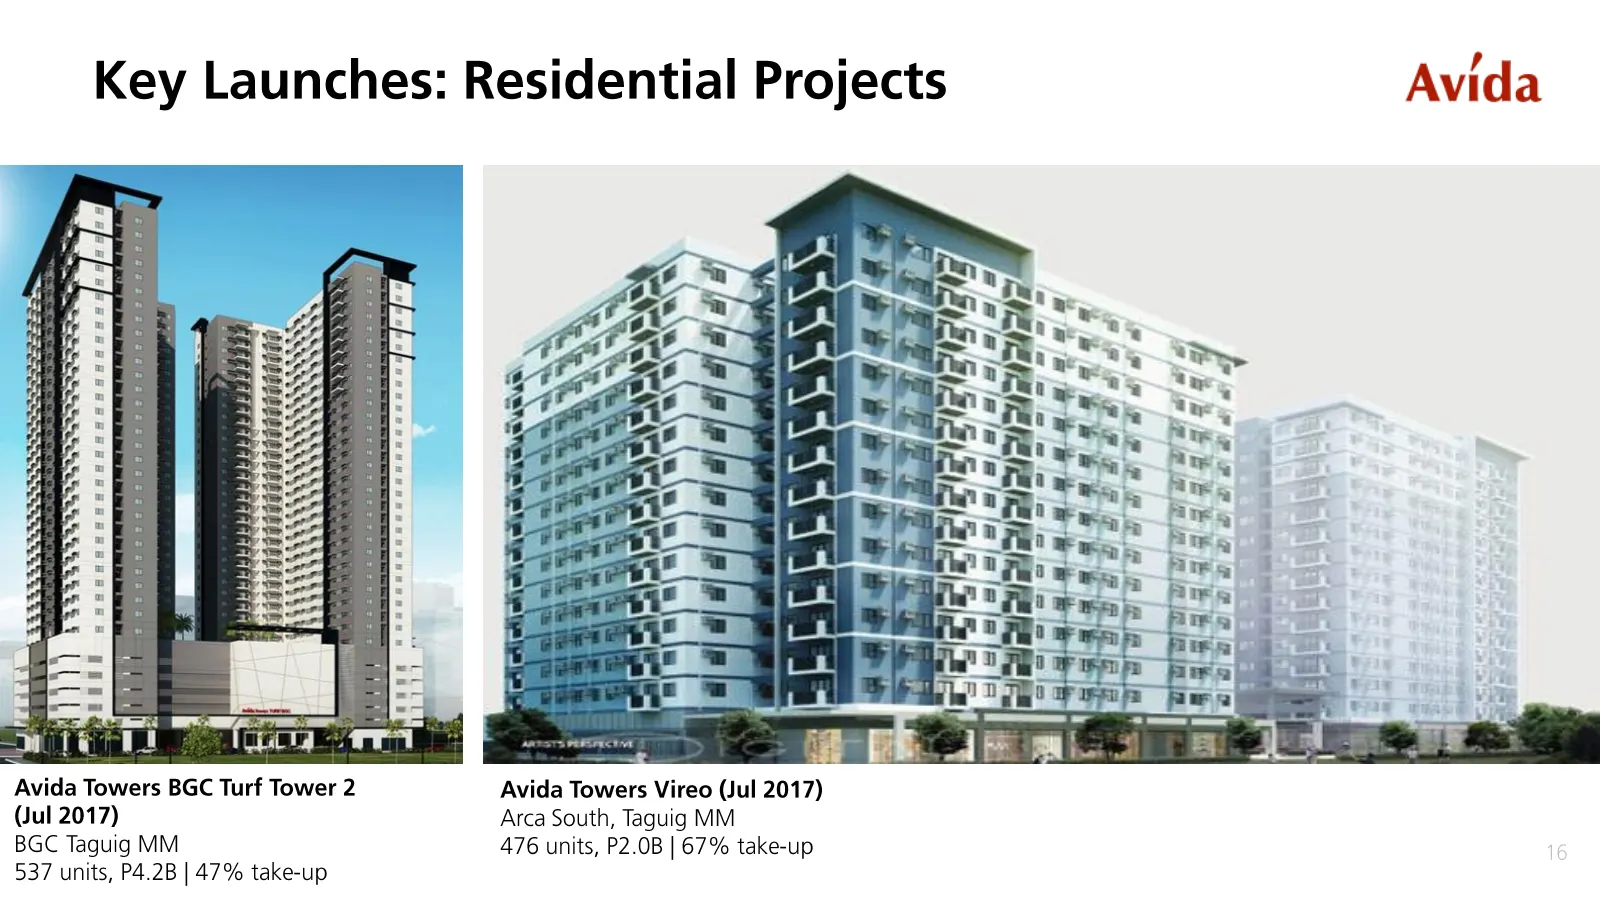
Slide 16: Key Launches: Residential Projects Avida
Key Launches: Residential Projects Avida Avida Towers BGC Turf Tower 2 Avida Towers Vireo (Jul 2017) (Jul 2017) Arca South, Taguig MM BGC Taguig MM 476 units, P2.0B | 67% take-up 537 units, P4.2B | 47% take-up
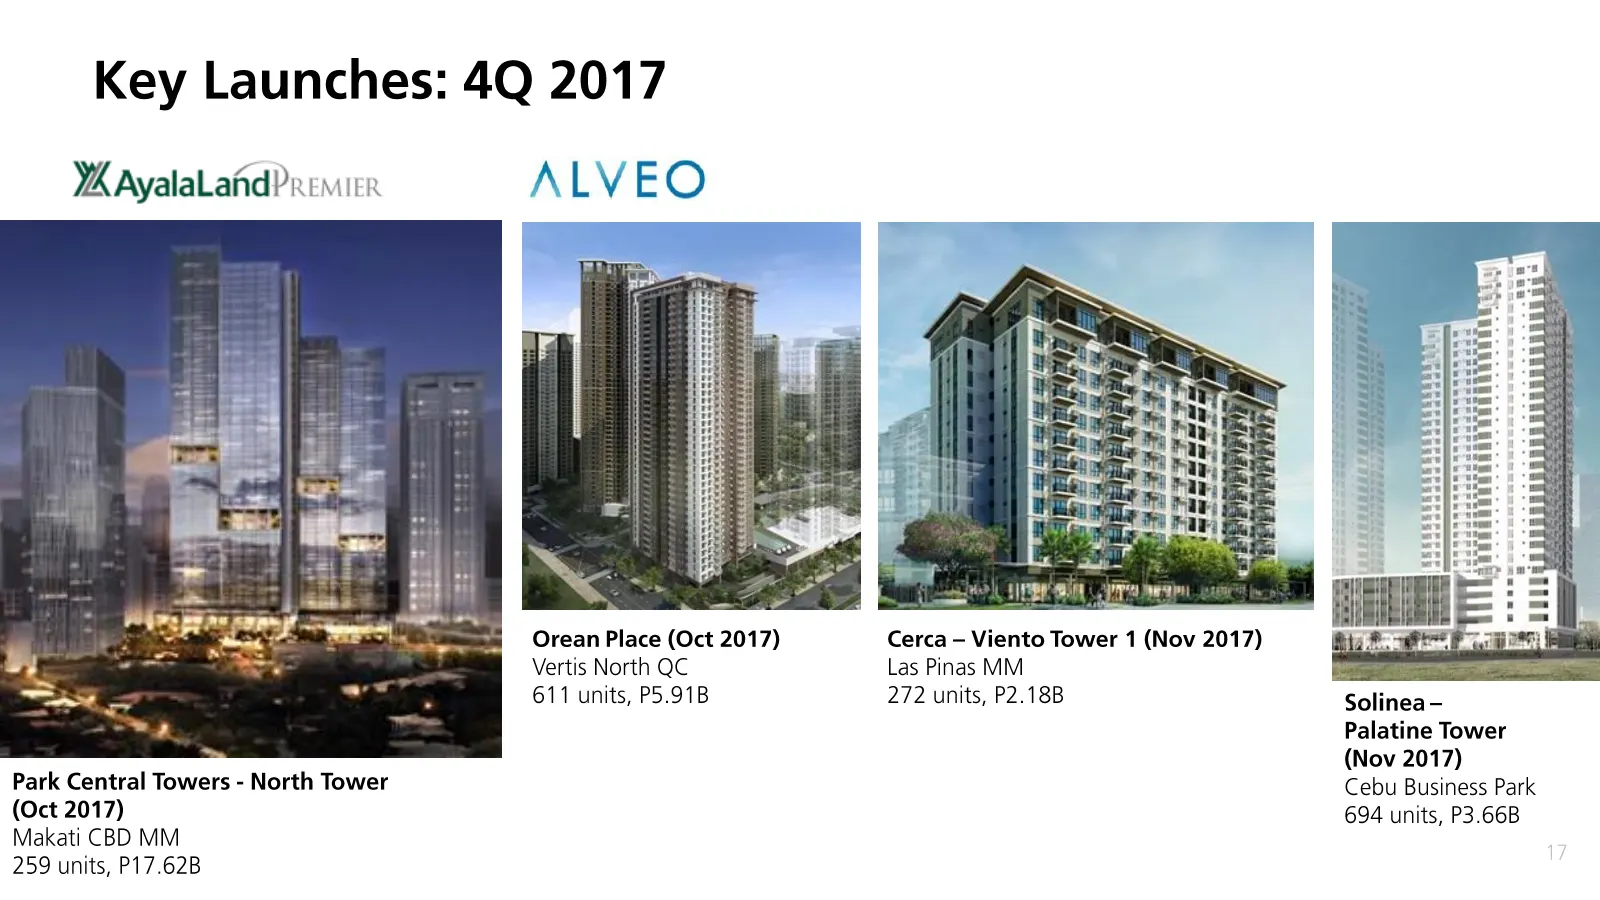
Slide 17: Key Launches: 4Q 2017
Key Launches: 4Q 2017 WK aAyalaLahdPremicr ALVEC Orean Place (Oct 2017) Vertis North QC 611 units, P5.91B Park Central Towers - North Tower (Oct 2017) Makati CBD MM 259 units, P17.62B Cerca — Viento Tower 1 (Nov 2017) Las Pinas MM 272 units, P2.18B aD 6. bene Solinea- Palatine Tower (Nov 2017) Cebu
Slide 18: Malls: GLA of 1.70M sqm
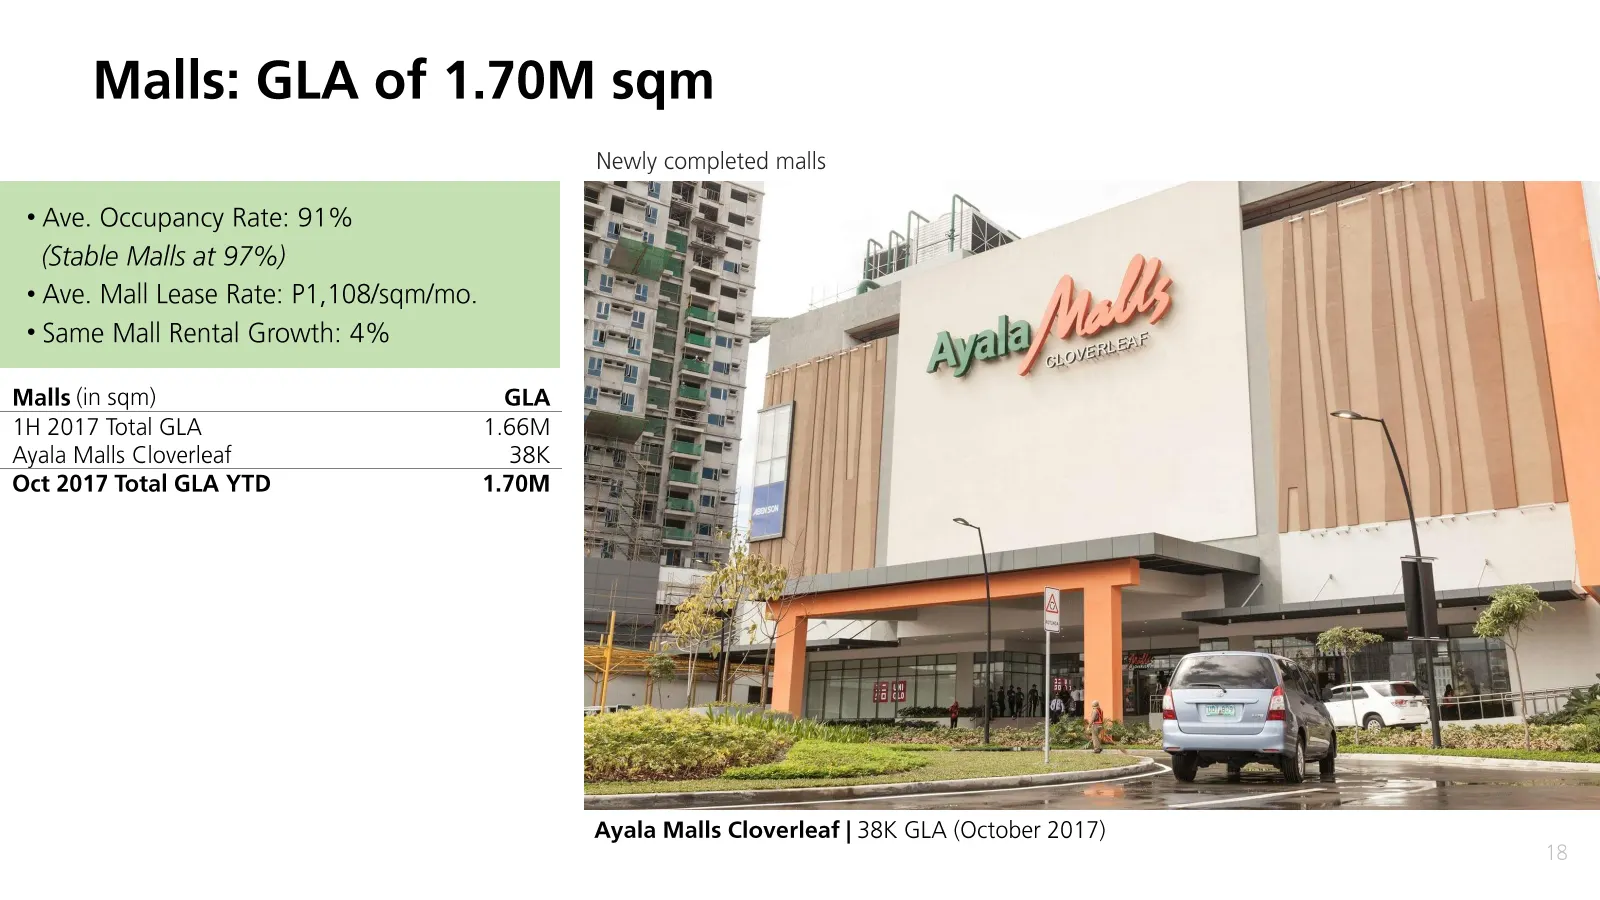
Malls: GLA of 1.70M sqm Newly completed malls * Ave. Occupancy Rate: 91% (Stable Malls at 97%) + Ave. Mall Lease Rate: P1,108/sqm/mo. *Same Mall Rental Growth: 4% Malls (in sqm) GLA 1H 2017 Total GLA 1.66M Ayala Malls Cloverleaf 38K Oct 2017 Total GLA YTD 1.70M Ayala Malls Cloverleaf | 38K GLA (Octo
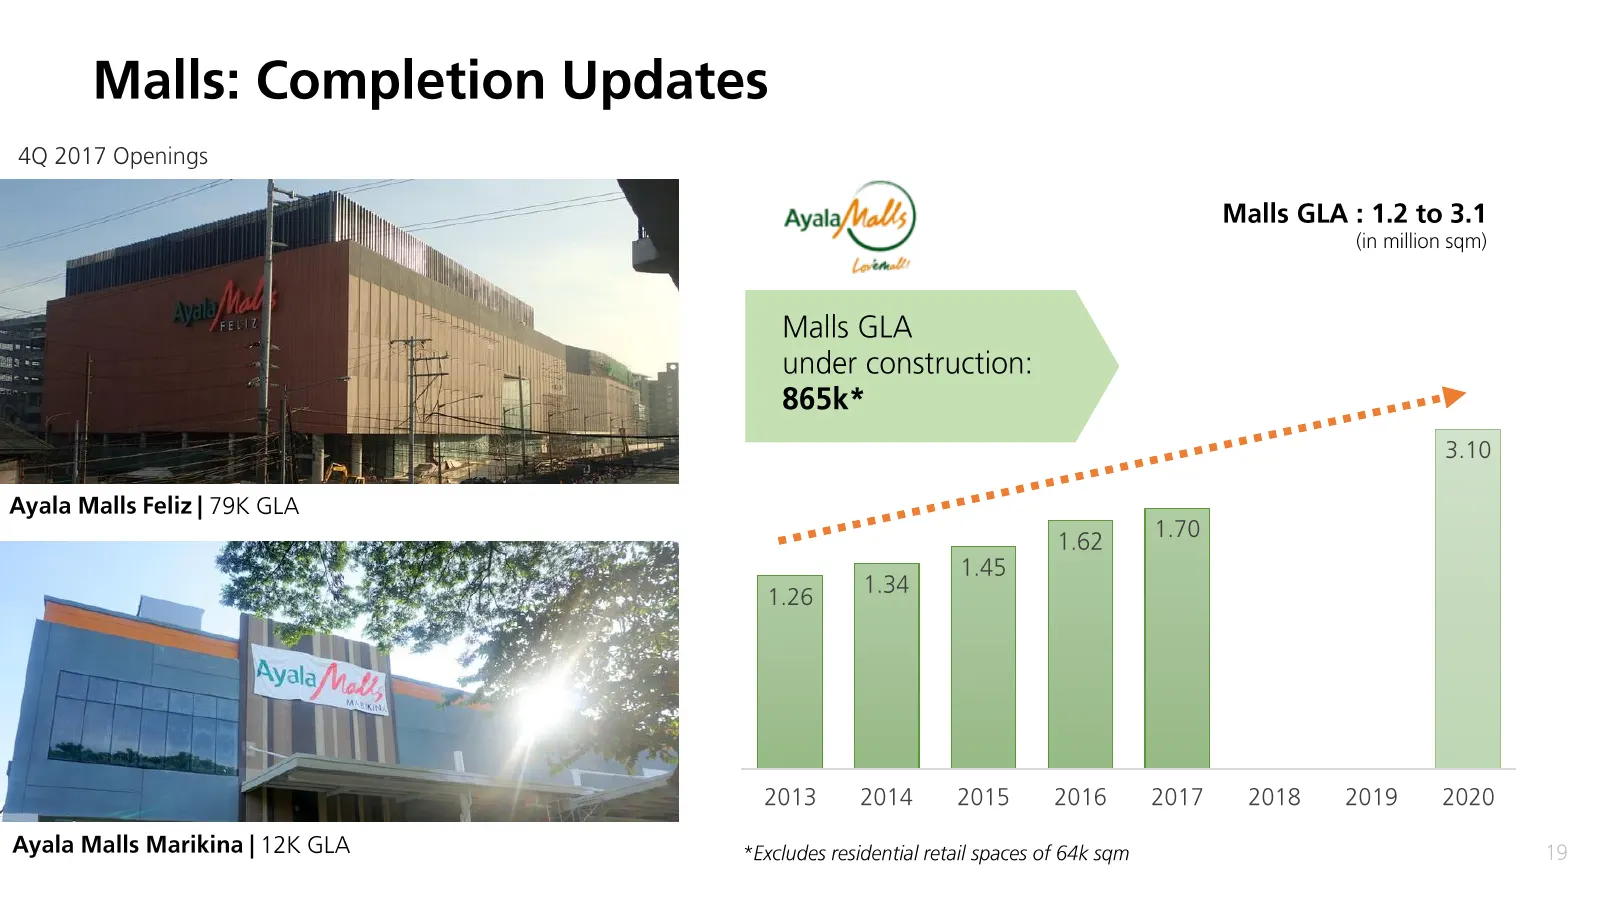
Slide 19: 2.5 3.5 2.5 1.5 1.5 0.5 0.5
2.5 3.5 3 2 2.5 1.5 2 1.5 1 1 0.5 0.5 0 0
Slide 20: Offices: GLA of 909K sqm
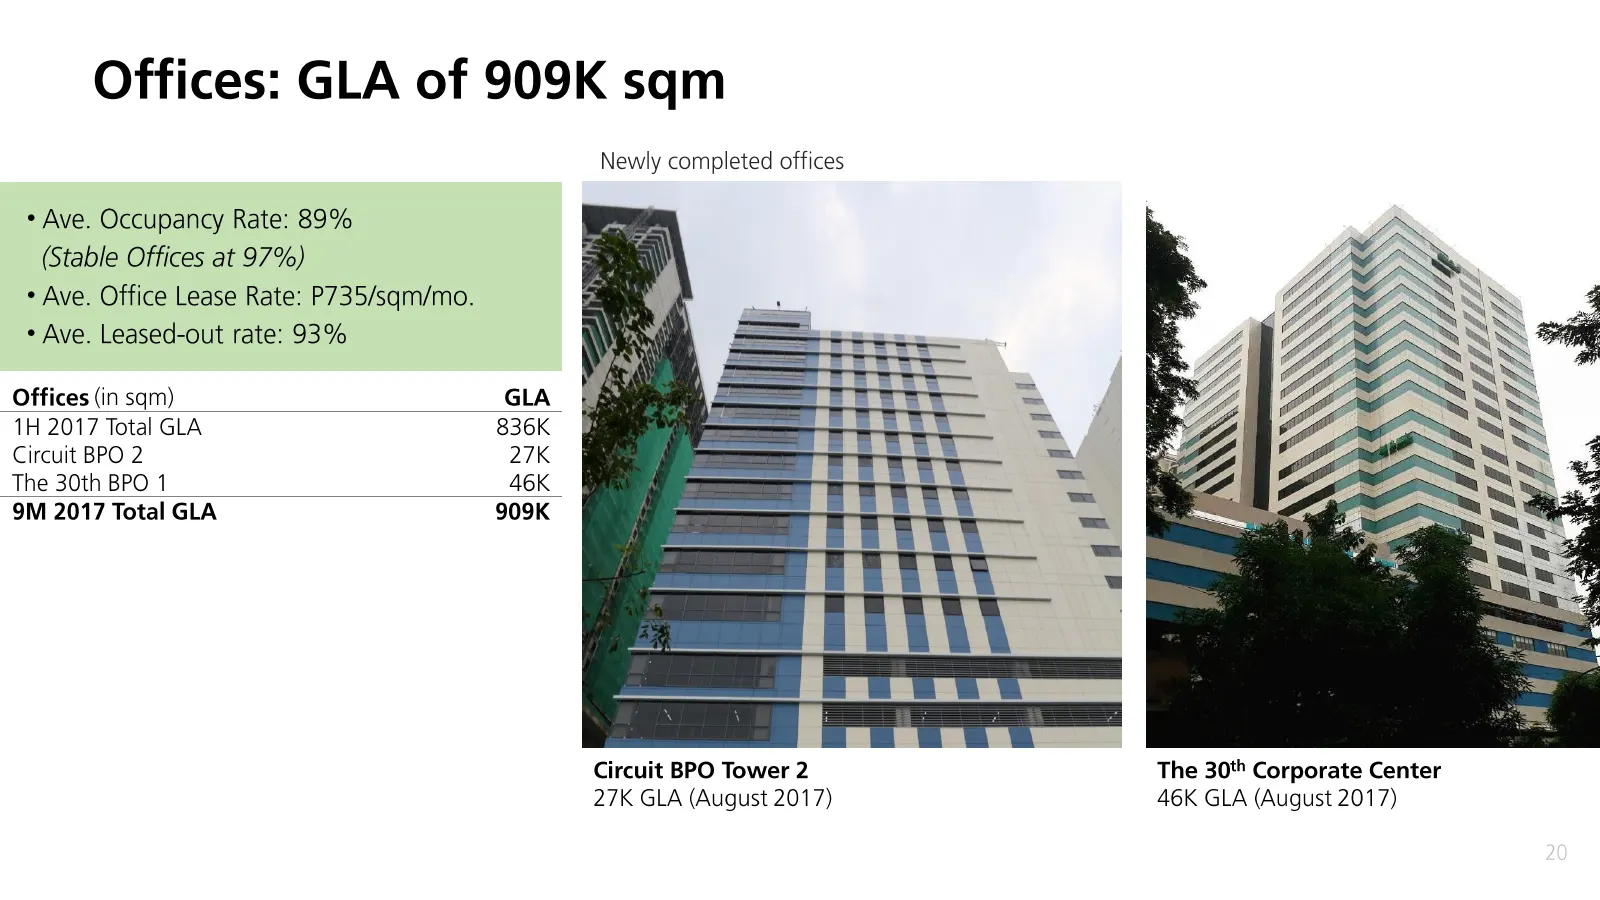
Offices: GLA of 909K sqm * Ave. Occupancy Rate: 89% (Stable Offices at 97%) + Ave. Office Lease Rate: P735/sqm/mo. + Ave. Leased-out rate: 93% Offices (in sqm) GLA 1H 2017 Total GLA 836K Circuit BPO 2 27K The 30th BPO 1 46K 9M 2017 Total GLA 909K Newly completed offices Circuit BPO Tower 2 27K GLA (
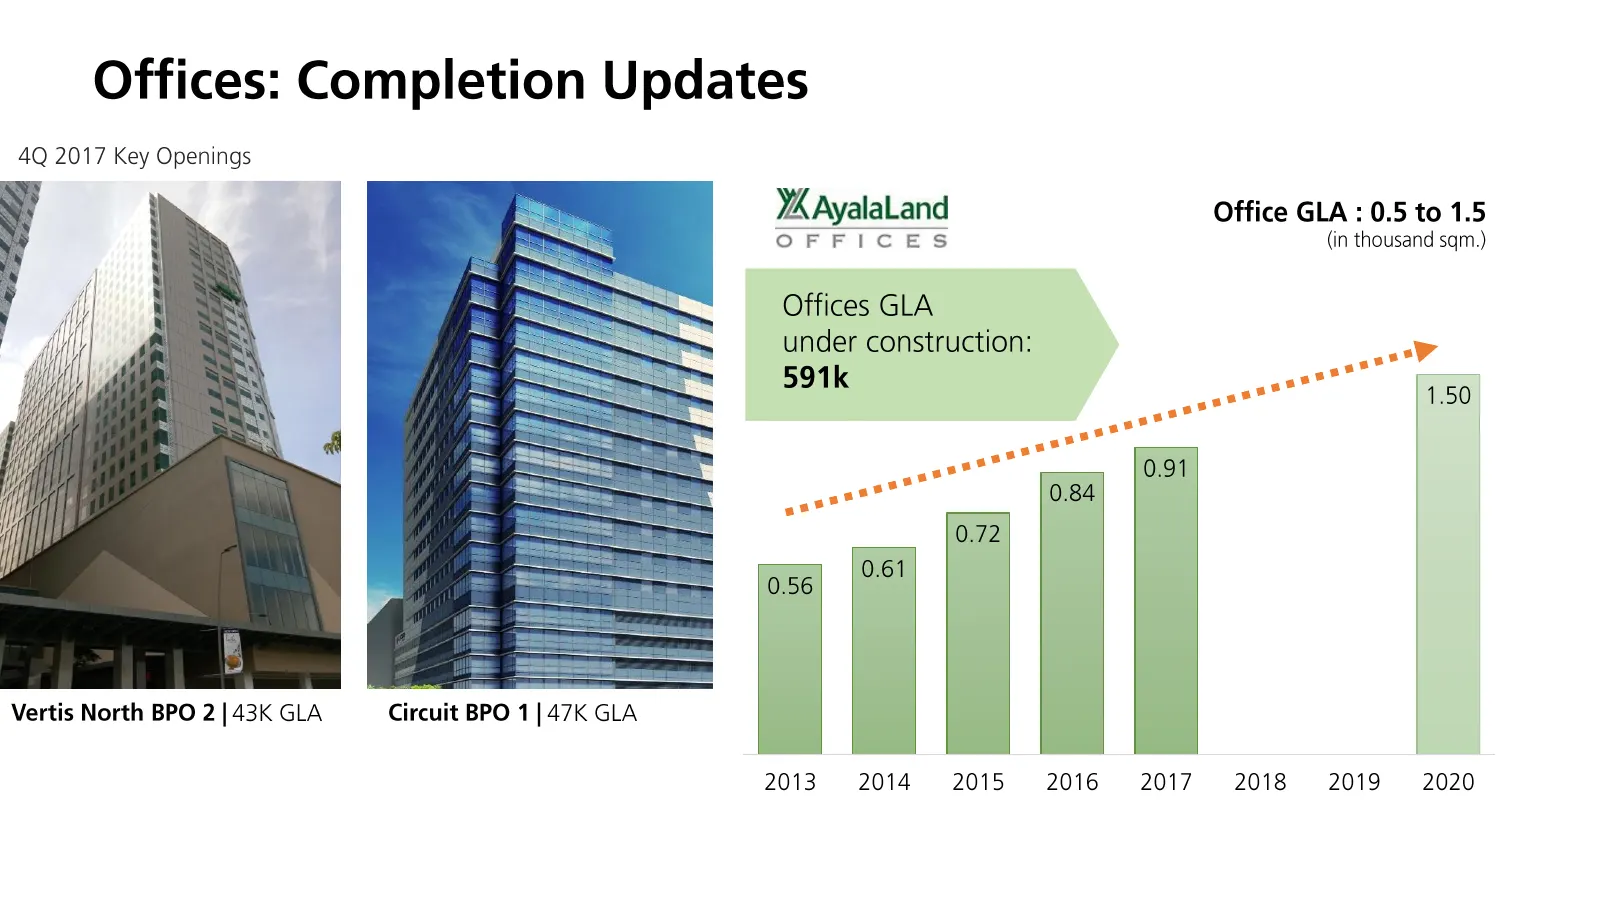
Slide 21: 1.20 1.6 1.4 1.00 1.2 0.80 0.60 0.8 0.6 0.40 0.4 0.20 0.2 0.00
1.20 1.6 1.4 1.00 1.2 0.80 1 0.60 0.8 0.6 0.40 0.4 0.20 0.2 0.00 0
Slide 22: Hotels and Resorts: 2,509 rooms in operation
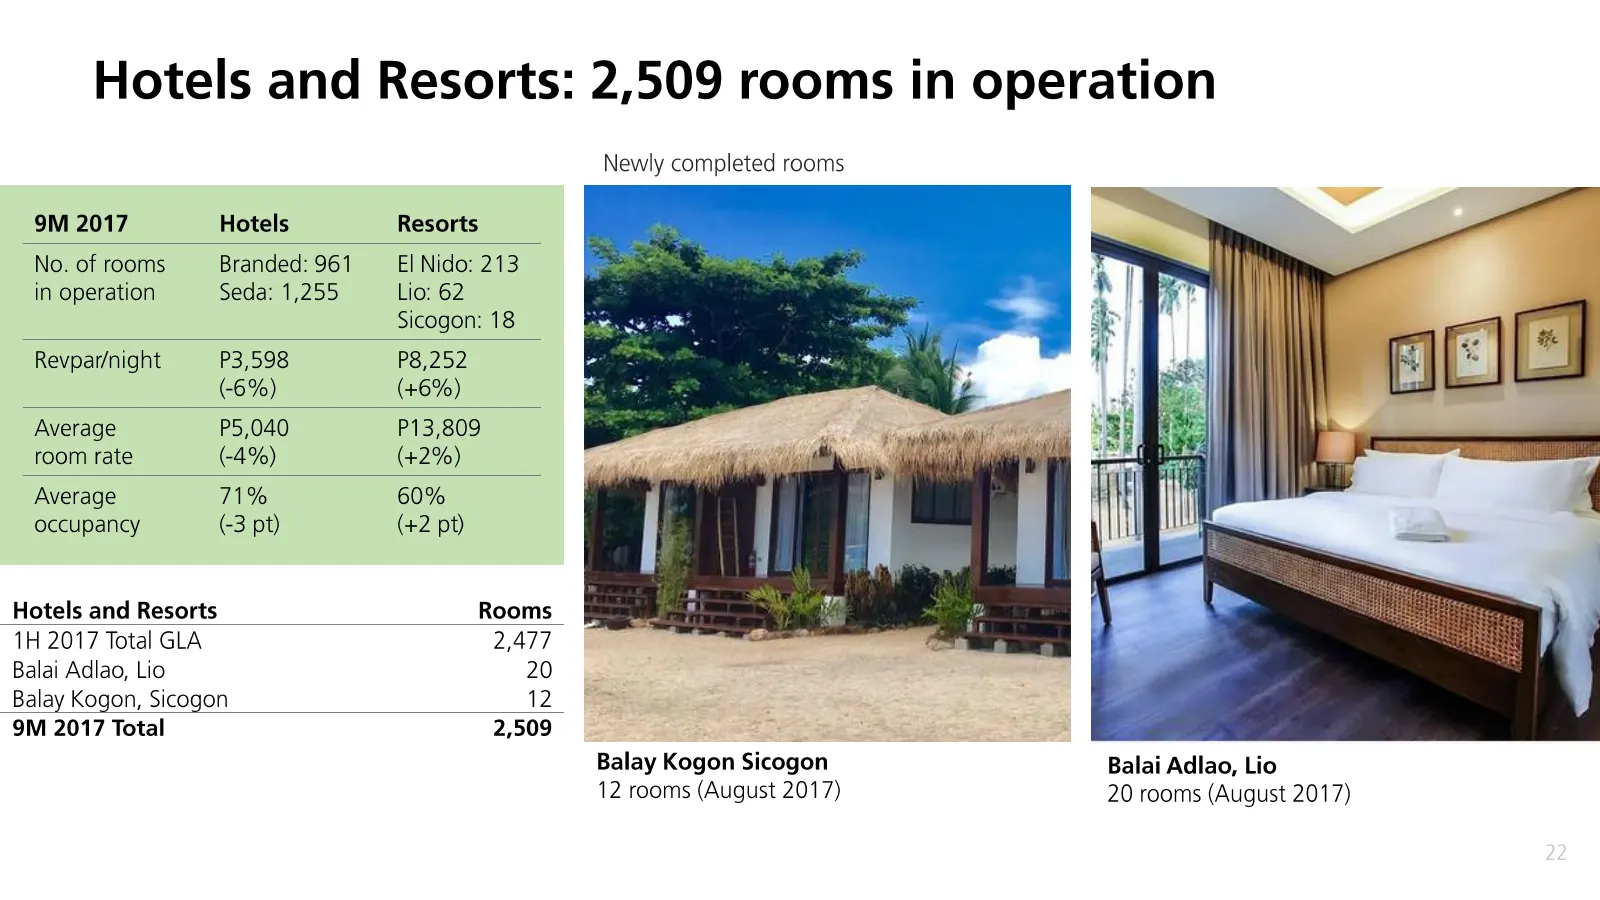
Hotels and Resorts: 2,509 rooms in operation Newly completed rooms 9M 2017 Hotels Resorts No. of rooms Branded: 961 _EI Nido: 213 in operation Seda: 1,255 Lio: 62 Sicogon: 18 Revpat/night P3,598 P8,252 (-6%) (+6%) Average P5,040 P13,809 room rate (4%) (+2%) Average 1% 60% occupancy (3 pt) (+2 pt) Ho
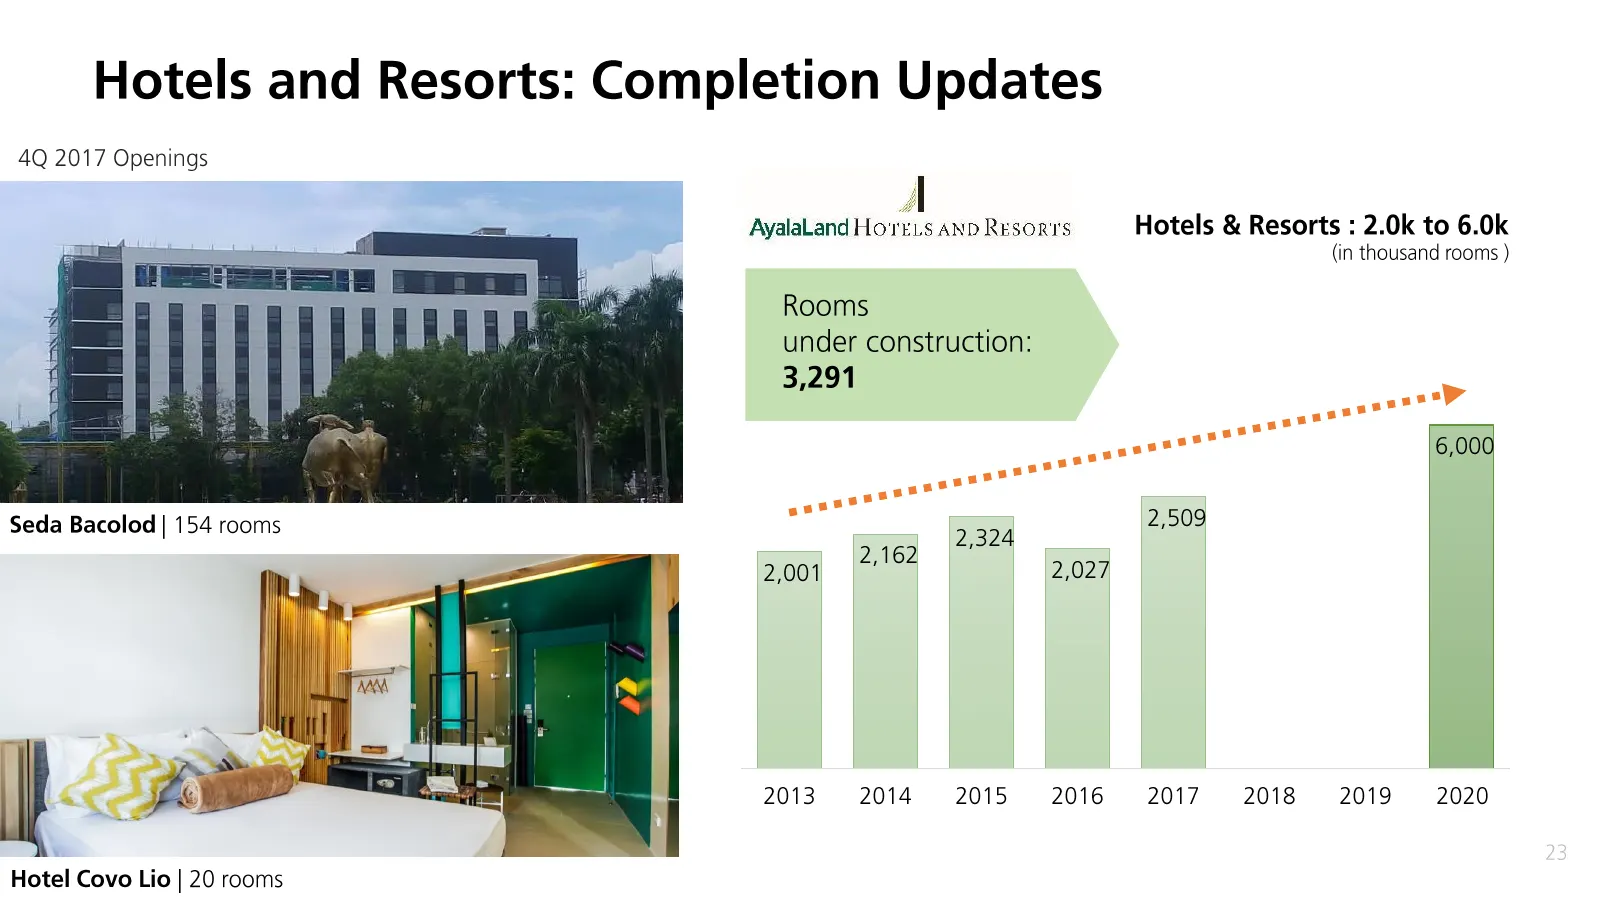
Slide 23: 7000 3,500 6000 3,000 5000 2,500 4000 2,000 1,500 3000 1,000 2000 500 1000
7000 3,500 6000 3,000 5000 2,500 4000 2,000 1,500 3000 1,000 2000 500 1000 - 0
Slide 24: In Summary
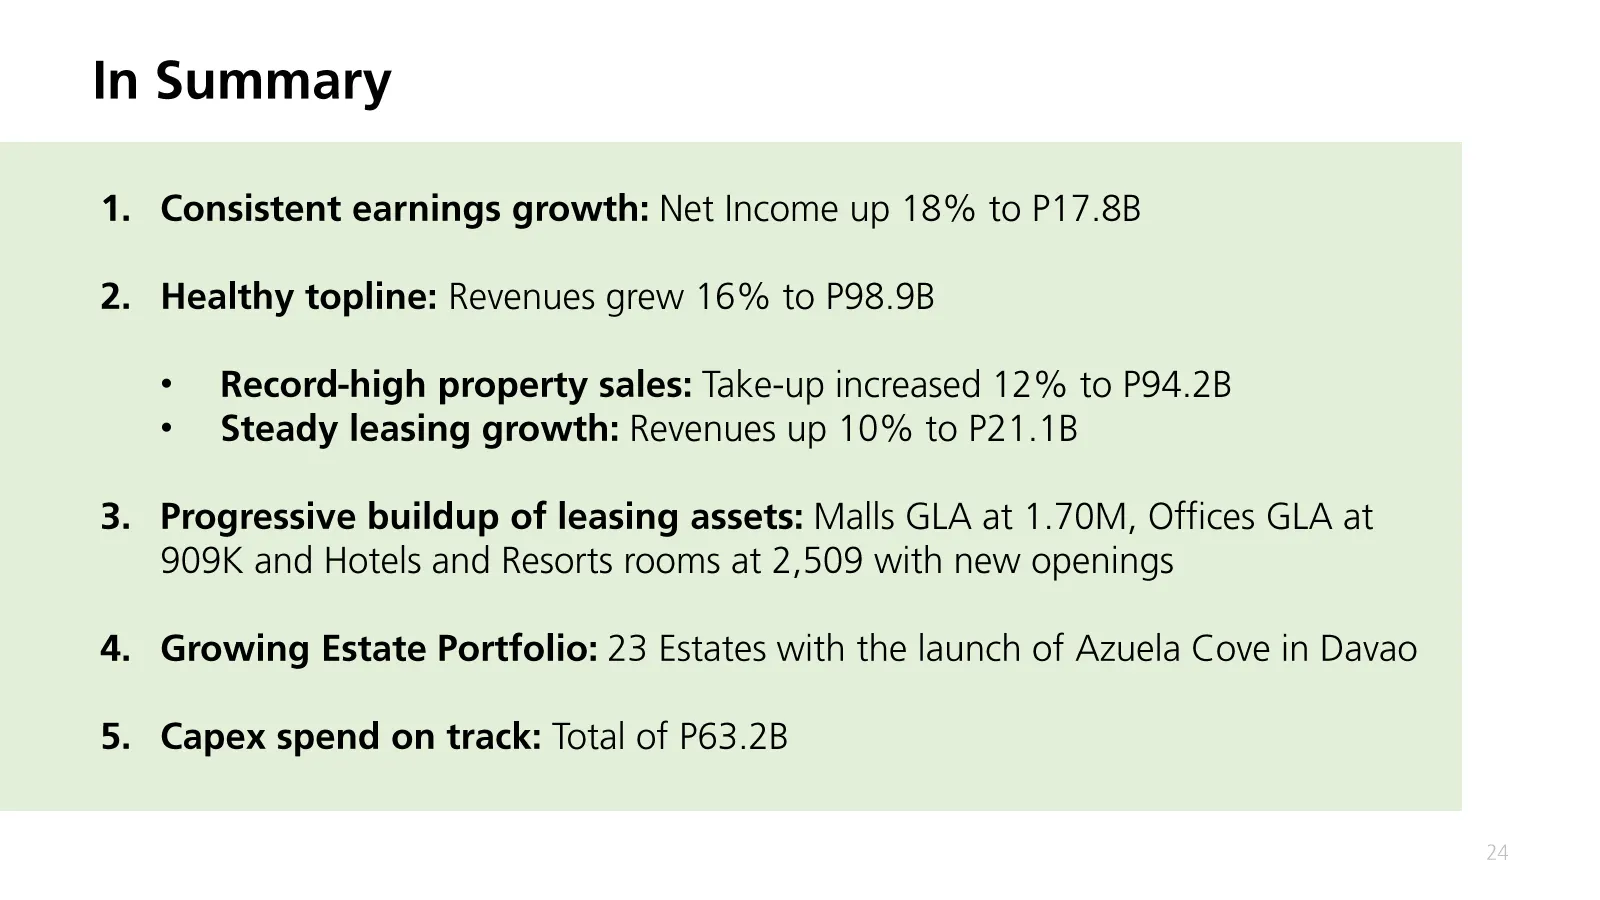
In Summary 1. Consistent earnings growth: Net Income up 18% to P17.8B 2. Healthy topline: Revenues grew 16% to P98.9B ¢ Record-high property sales: Take-up increased 12% to P94.2B * Steady leasing growth: Revenues up 10% to P21.1B 3. Progressive buildup of leasing assets: Malls GLA at 1.70M, Offices
Slide 25: Ayala Land 9M 2017 Analysts' Briefing
WK AyalaLand 9M 2017 | Analysts’ Briefing 07 November 2017
Source: Internet Archive copy of ir.ayalaland.com.ph
More decks from Ayala Land Inc.
 Q1 2026 Earnings Presentation15 slides · Apr 30, 2026
 Q4 2025 Earnings Presentation16 slides · Feb 20, 2026
 Q1 2025 Earnings Presentation10 slides · May 6, 2025
 FY2024 Earnings Presentation15 slides · Feb 20, 2025
 Q1 2024 Earnings Presentation37 slides · May 16, 2024
 Q1 2024 Earnings Presentation12 slides · May 8, 2024