Sembcorp Industries Ltd. · SGX:U96
Sembcorp Industries — H1 2015 Earnings Presentation
22 slides from Sembcorp Industries's earnings presentation, Aug 4, 2015
Slide 1: 1H2015 Results Announcement
1H2015 Results Announcement August 4, 2015 © Sembcorp Industries 2015 Scope of Presentation • CEO’s Report • Financial Review • Group Outlook © Sembcorp Industries 2015 2
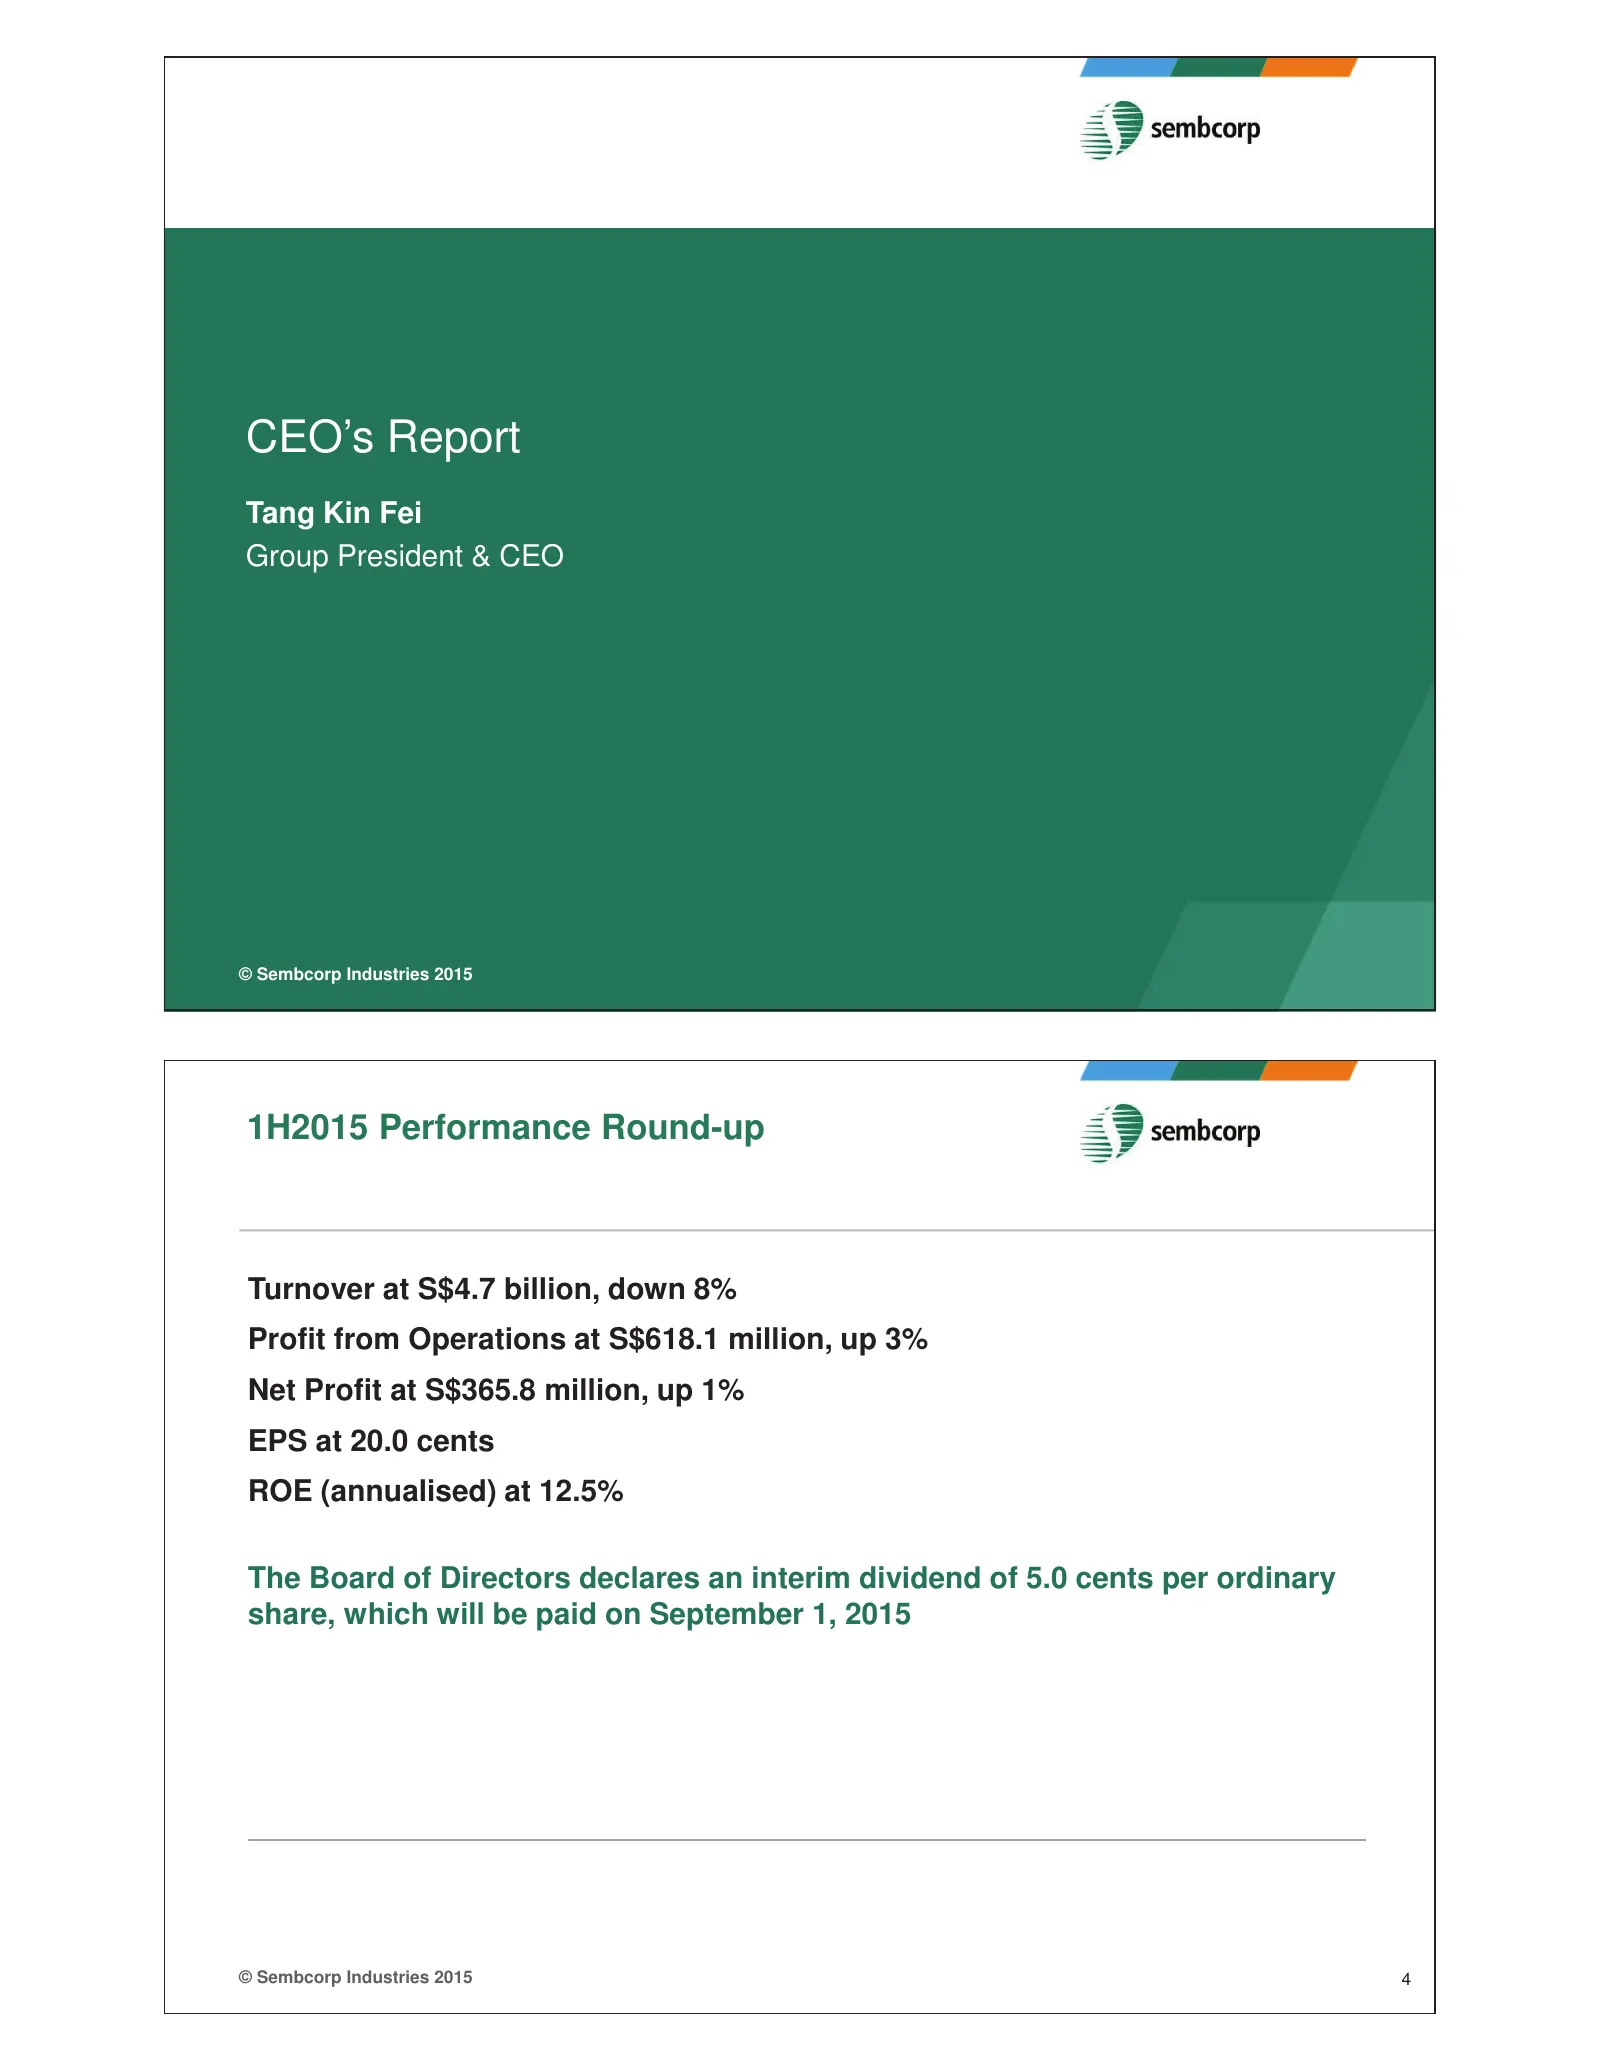
Slide 2: CEO's Report: 1H2015 Performance Round-up
CEO’s Report Tang Kin Fei Group President & CEO © Sembcorp Industries 2015 1H2015 Performance Round-up Turnover at S$4.7 billion, down 8% Profit from Operations at S$618.1 million, up 3% Net Profit at S$365.8 million, up 1% EPS at 20.0 cents ROE (annualised) at 12.5% The Board of Directors declares
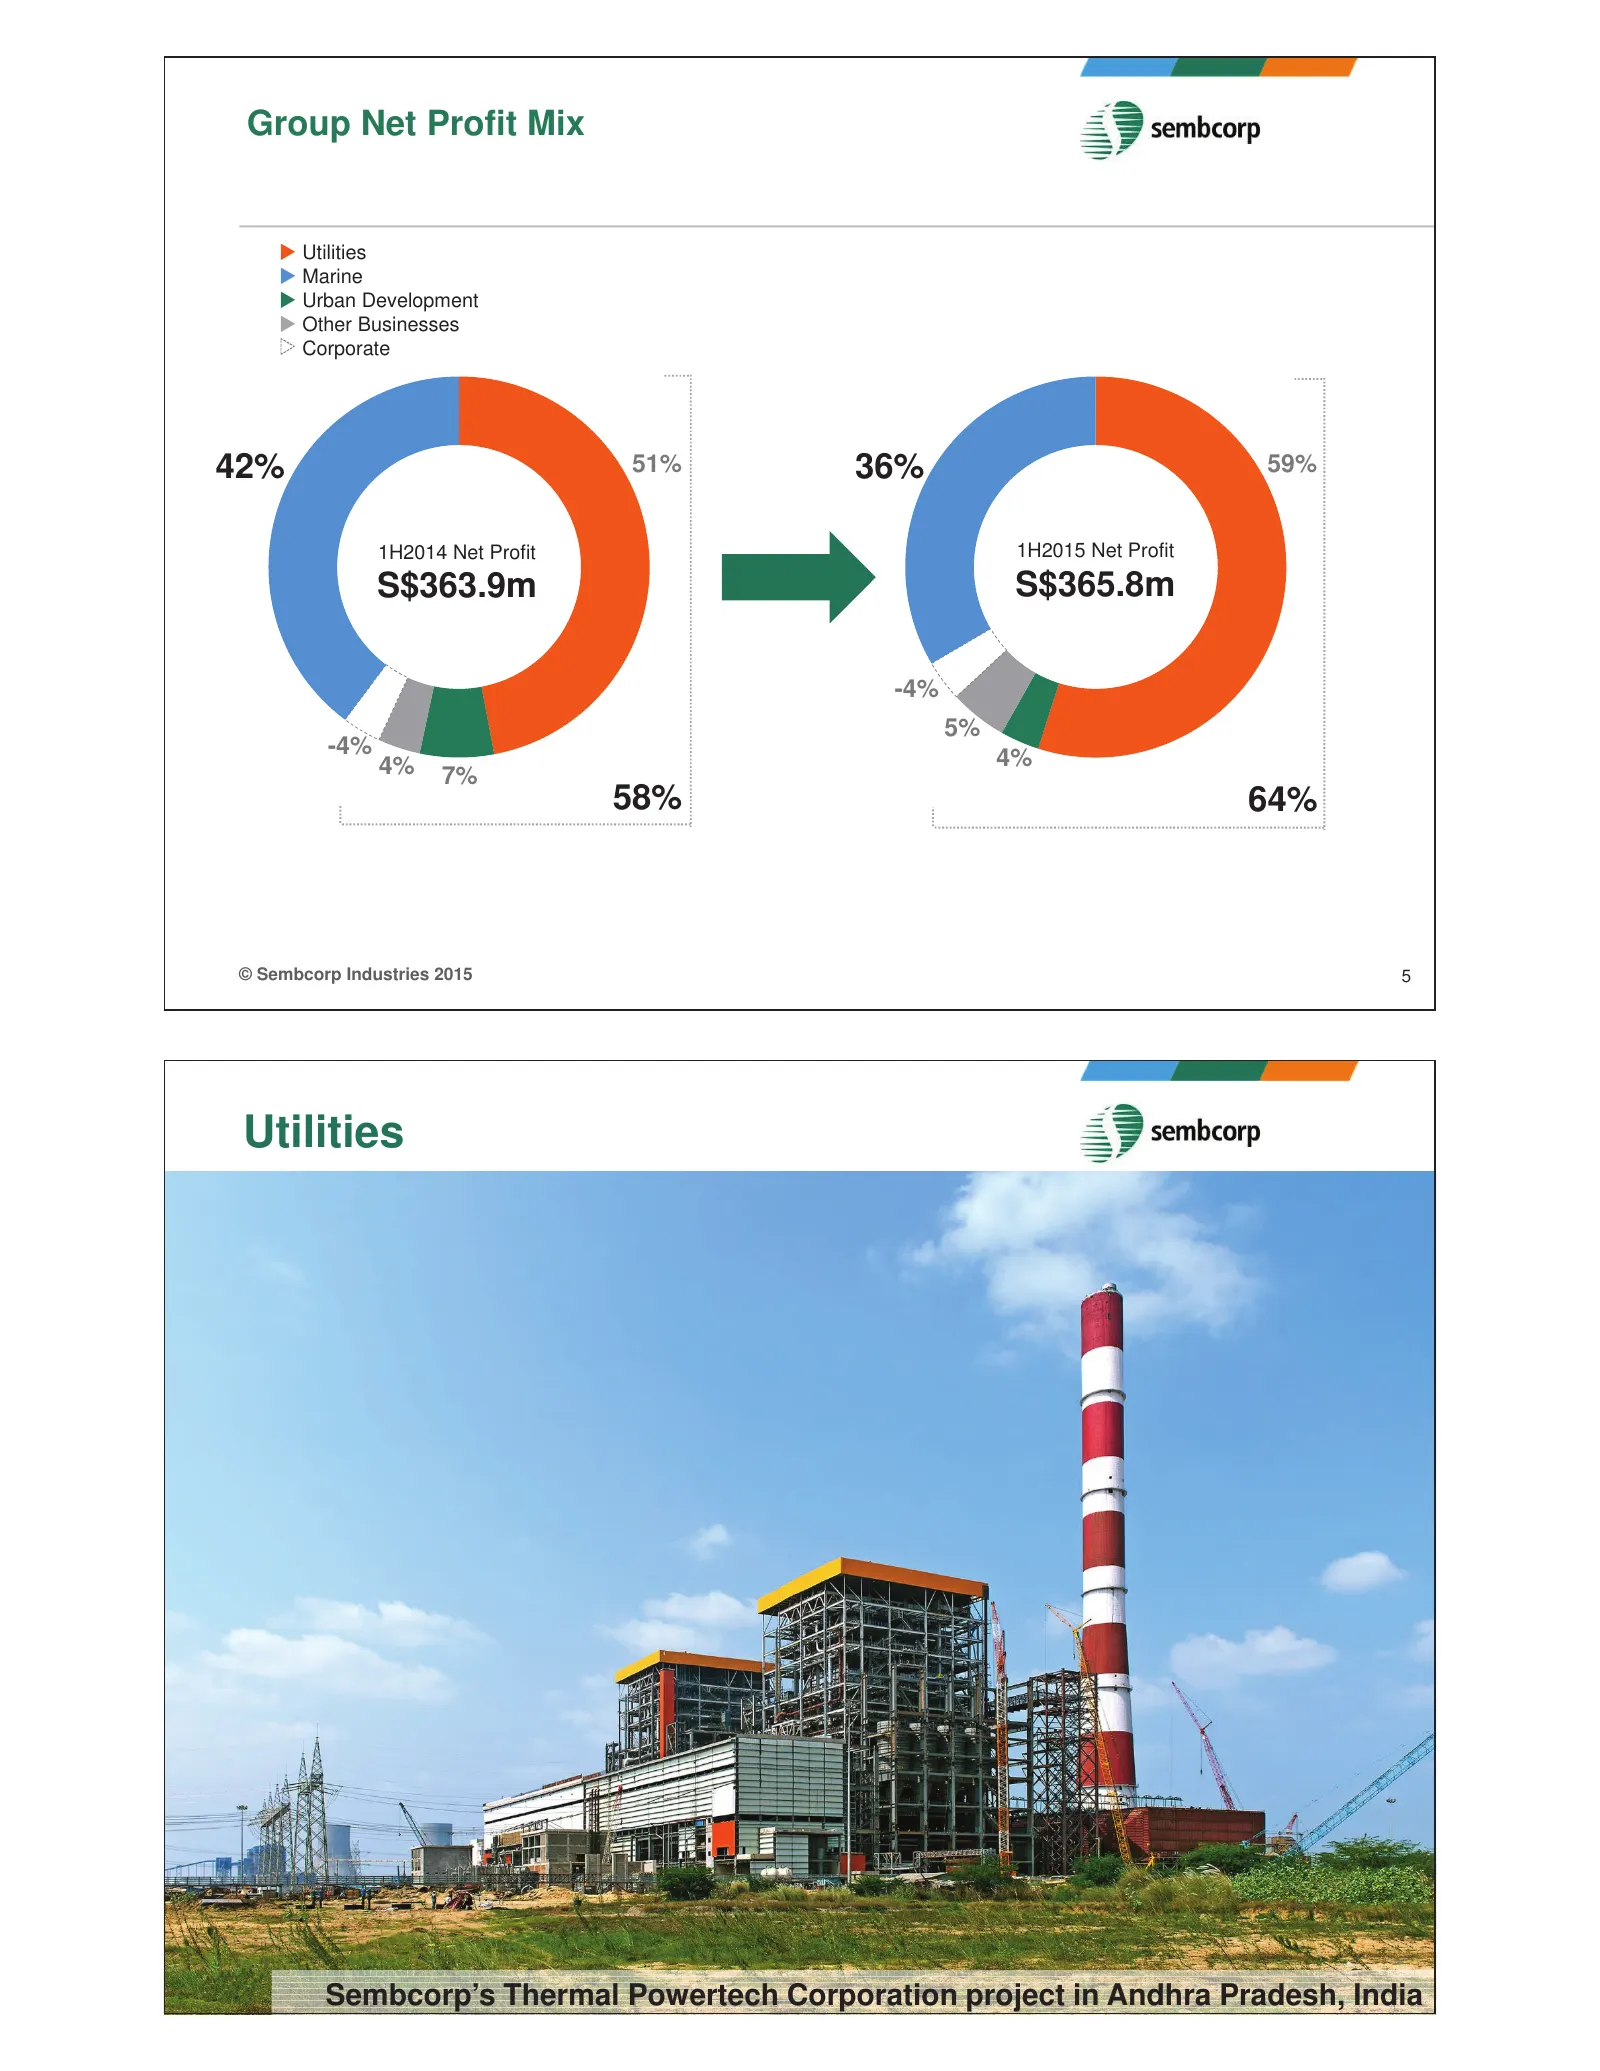
Slide 3: Group Net Profit Mix
Group Net Profit Mix X Utilities X Marine X Urban Development X Other Businesses X Corporate 42% 51% 36% 59% 1H2014 Net Profit 1H2015 Net Profit S$363.9m S$365.8m -4% 5% -4% 4% 4% 7% 58% 64% © Sembcorp Industries 2015 5 Utilities © Sembcorp Industries 2015 6 Sembcorp’s Thermal Powertech Corporation
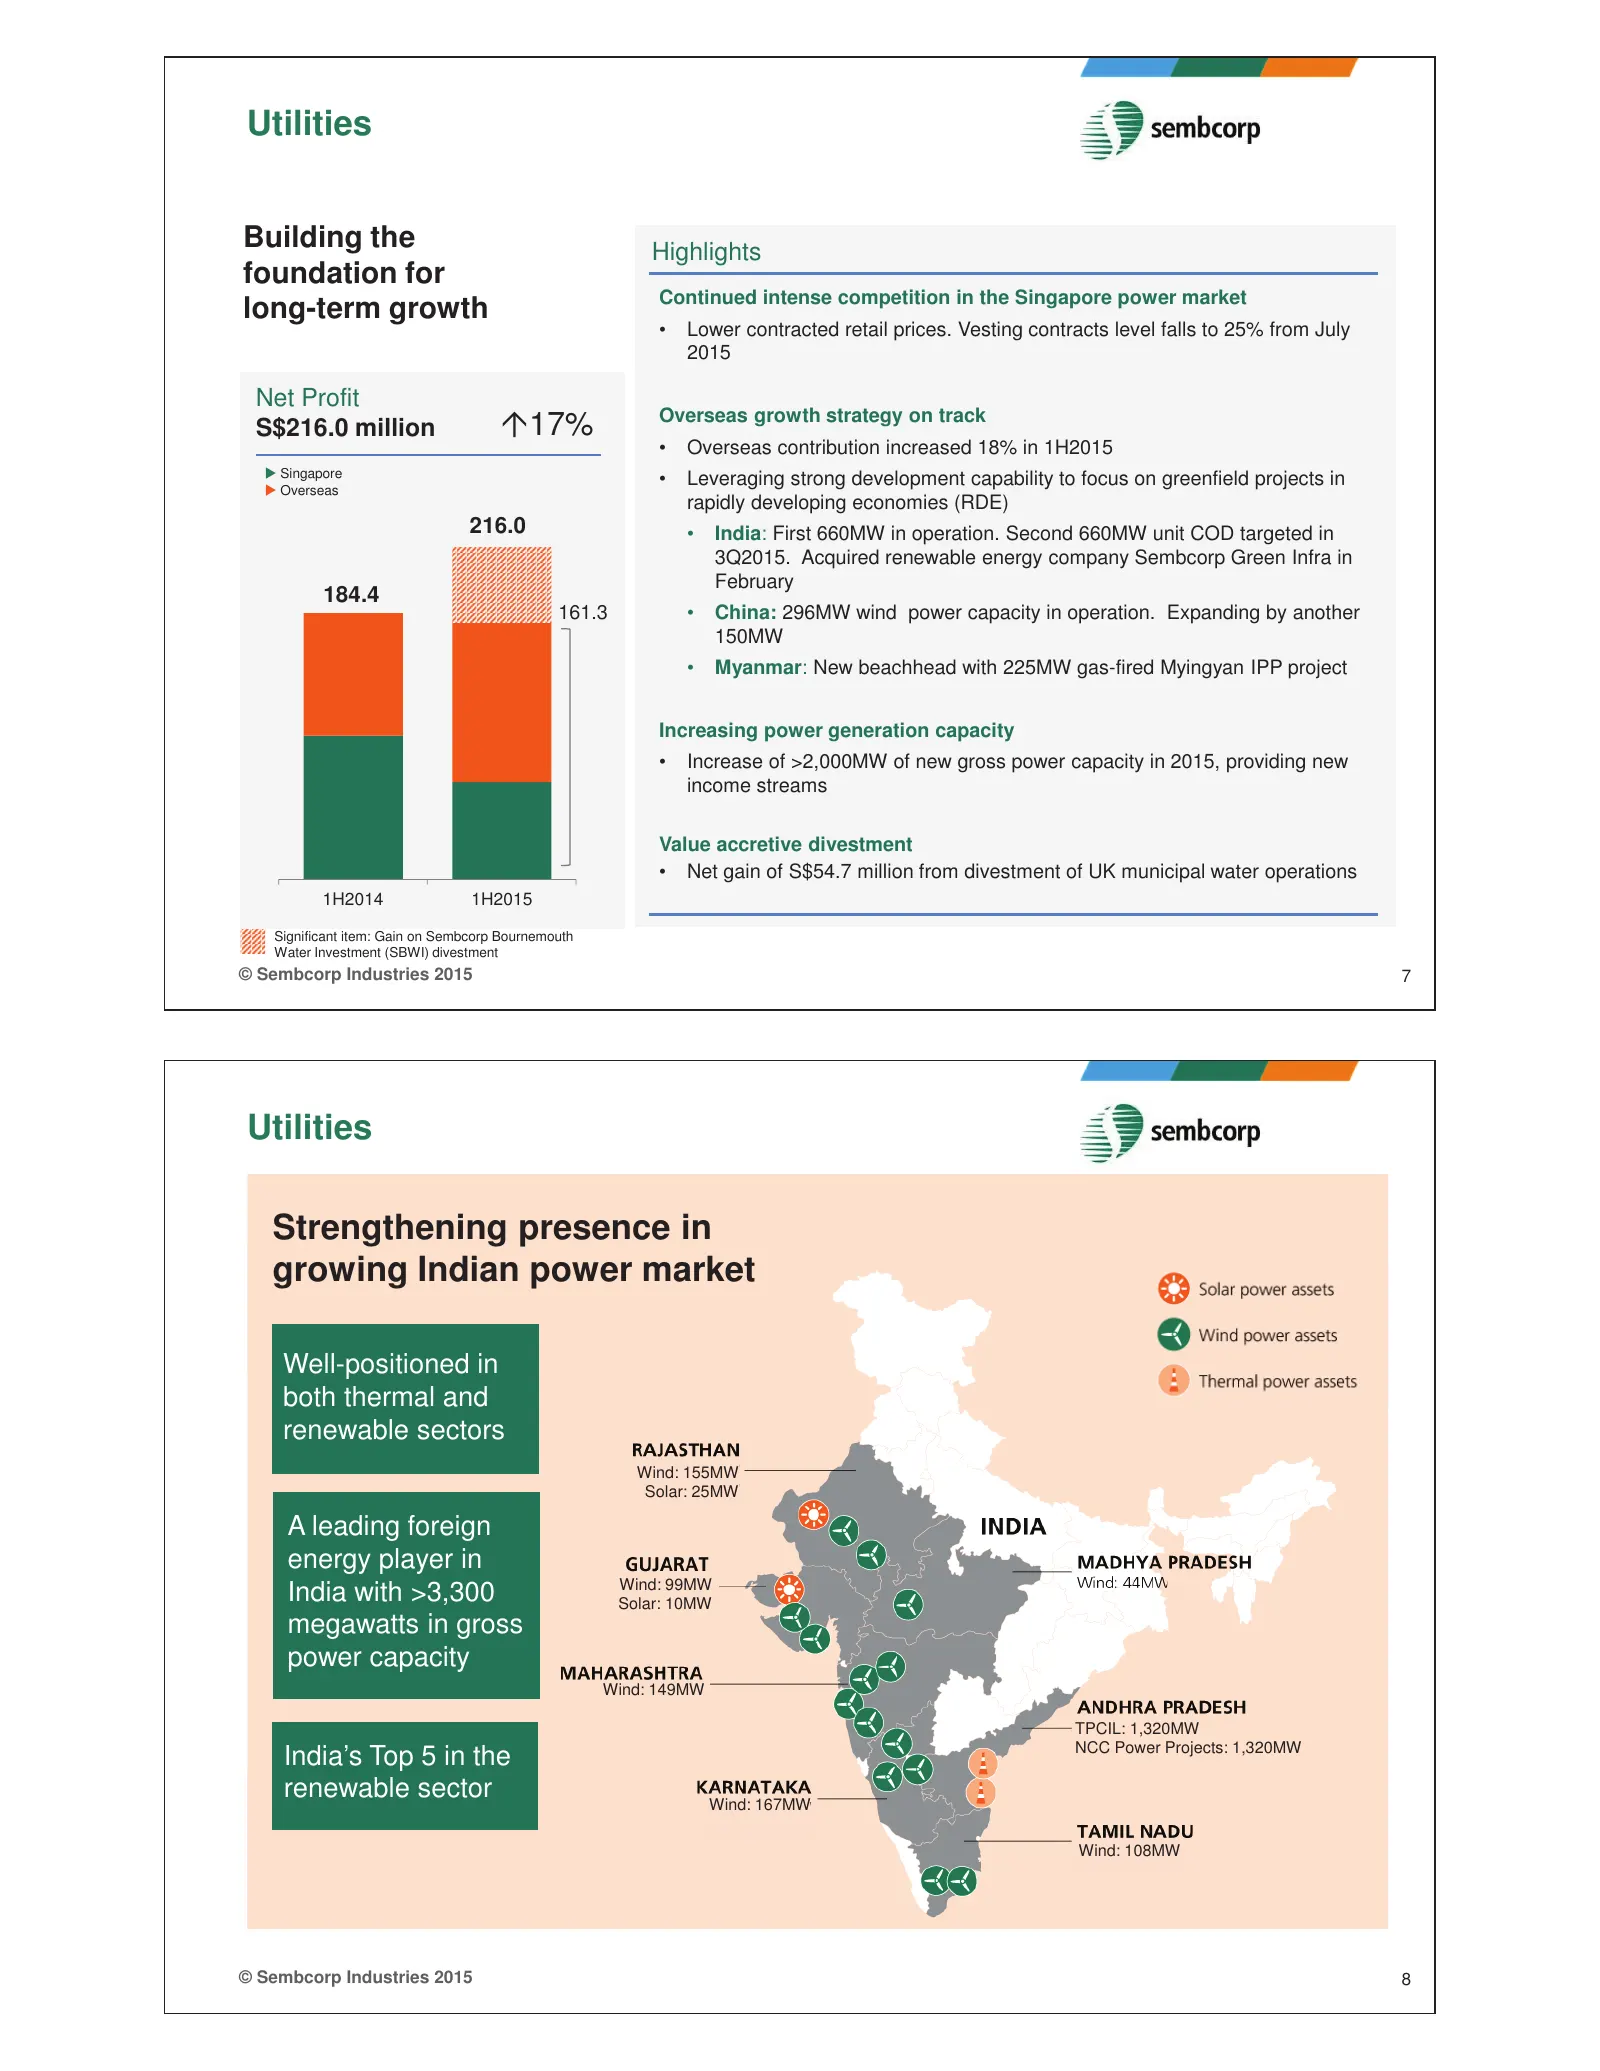
Slide 4: Utilities: Strengthening presence in growth markets
Utilities Building the Highlights foundation for Continued intense competition in the Singapore power market long-term growth • Lower contracted retail prices. Vesting contracts level falls to 25% from July 2015 Net Profit Overseas growth strategy on track S$216.0 million µ17% • Overseas contributio
Slide 5: Strengthening presence in growing Indian power market
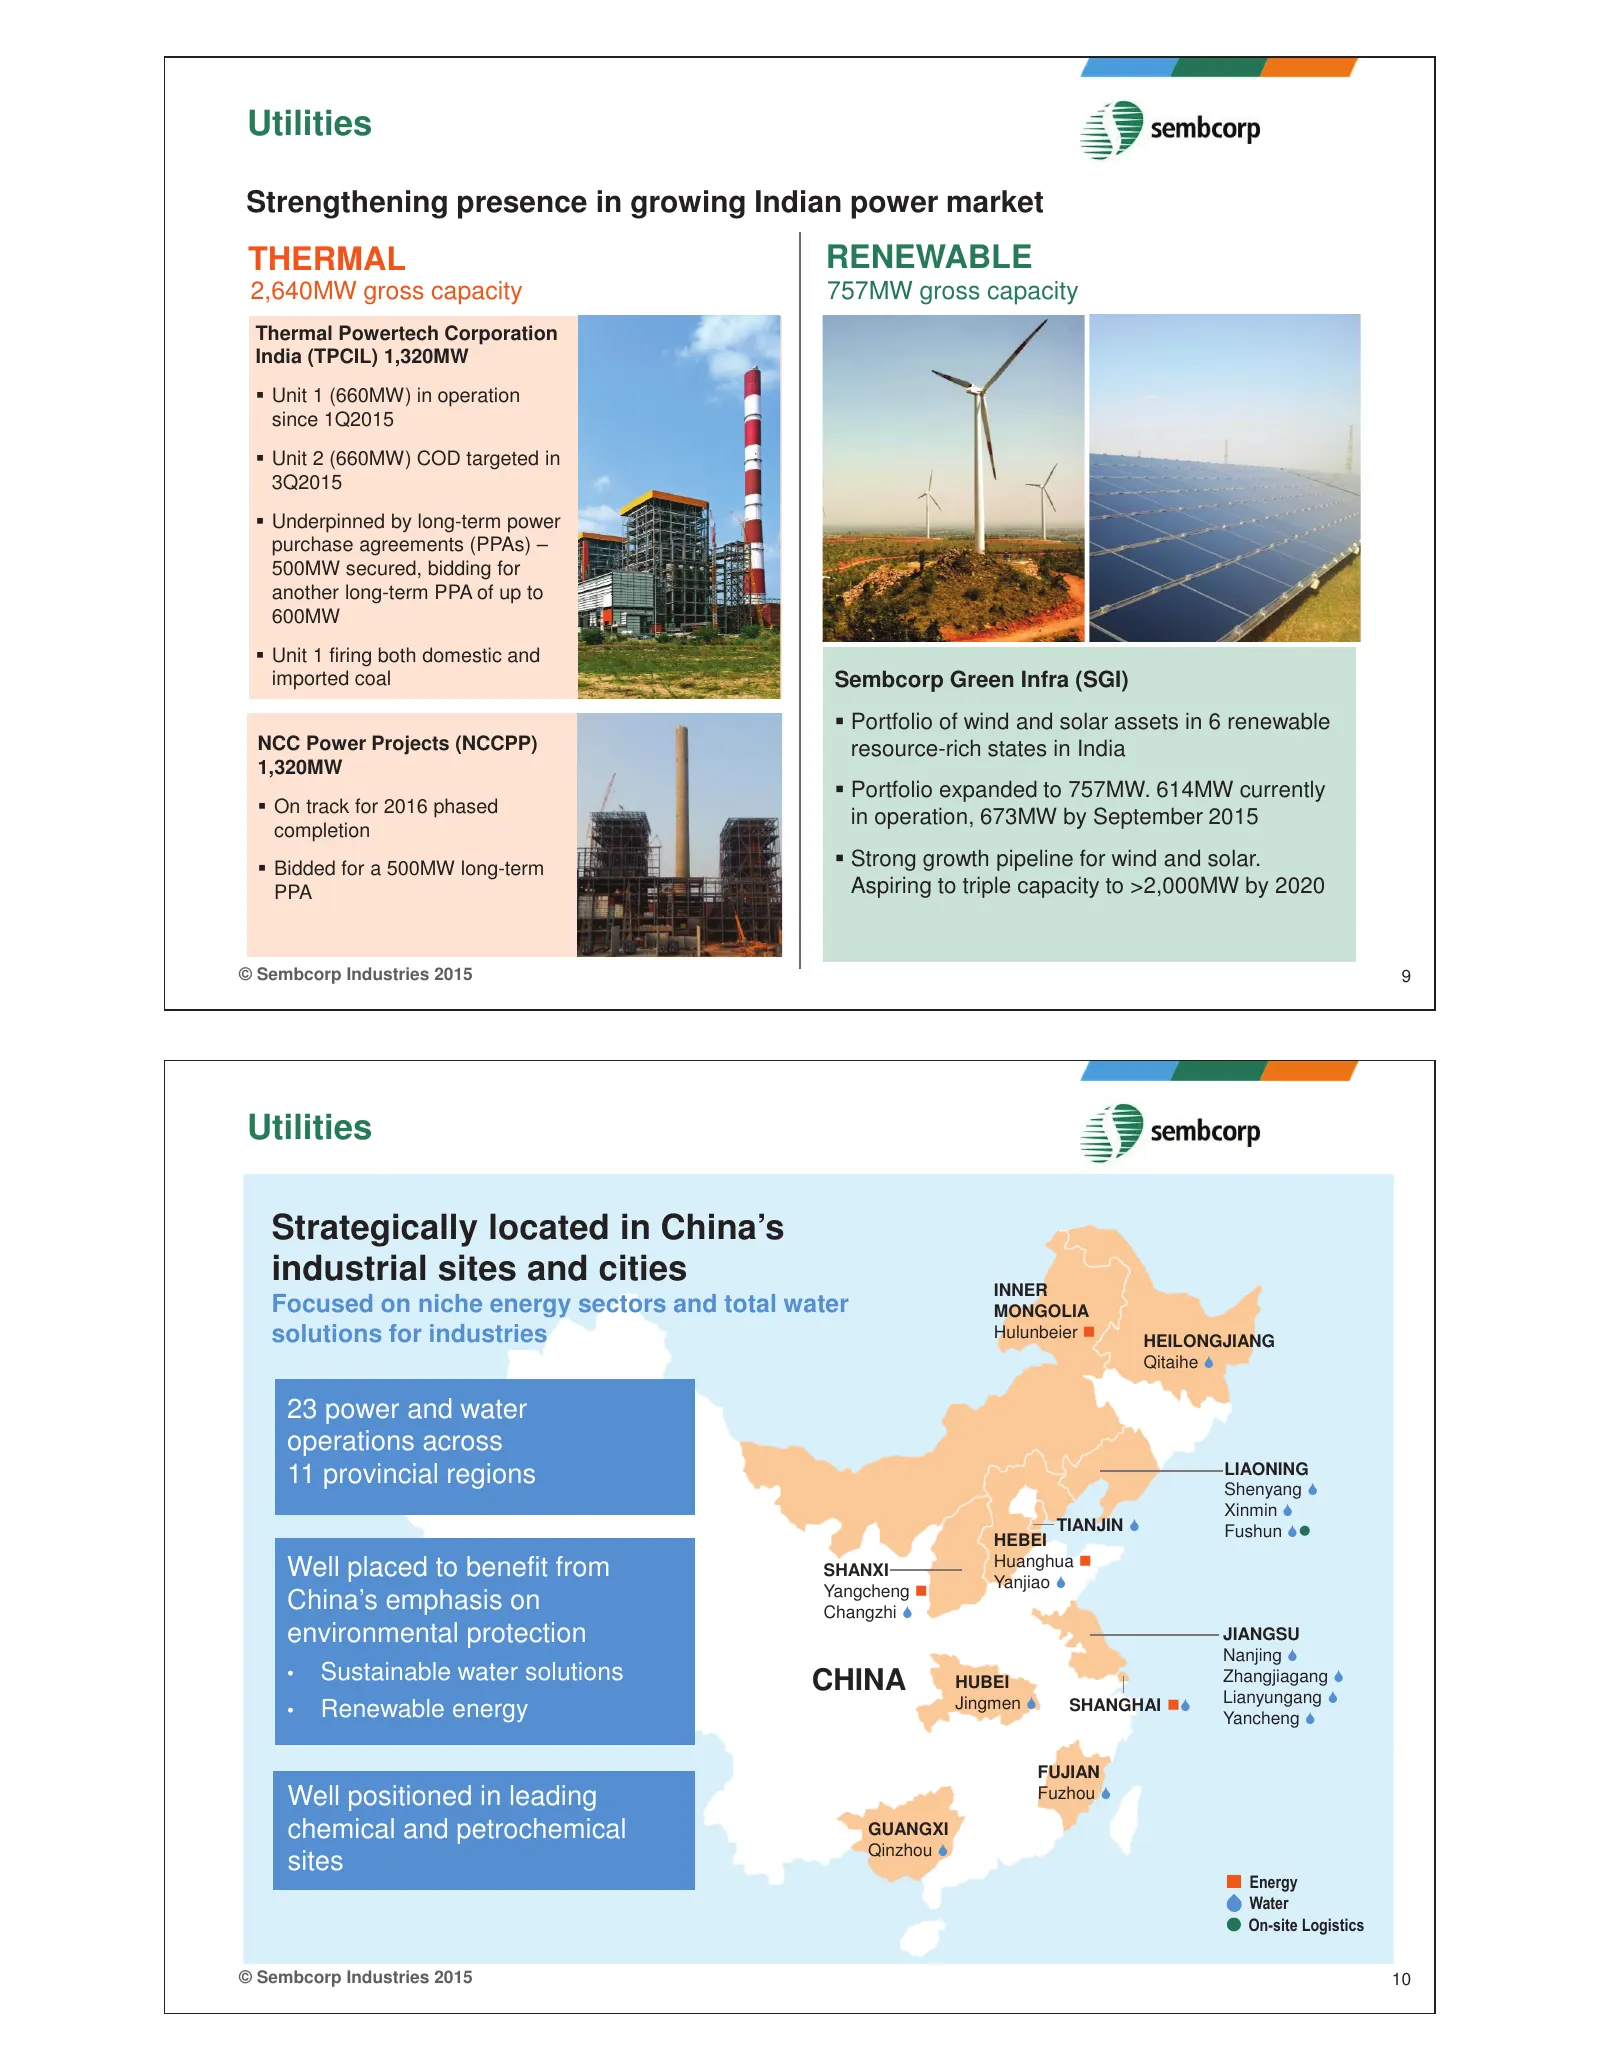
Utilities Strengthening presence in growing Indian power market THERMAL RENEWABLE 2,640MW gross capacity 757MW gross capacity Thermal Powertech Corporation India (TPCIL) 1,320MW Unit 1 (660MW) in operation since 1Q2015 Unit 2 (660MW) COD targeted in 3Q2015 Underpinned by long-term power purcha
Slide 6: Utilities in China and niche energy and water sectors
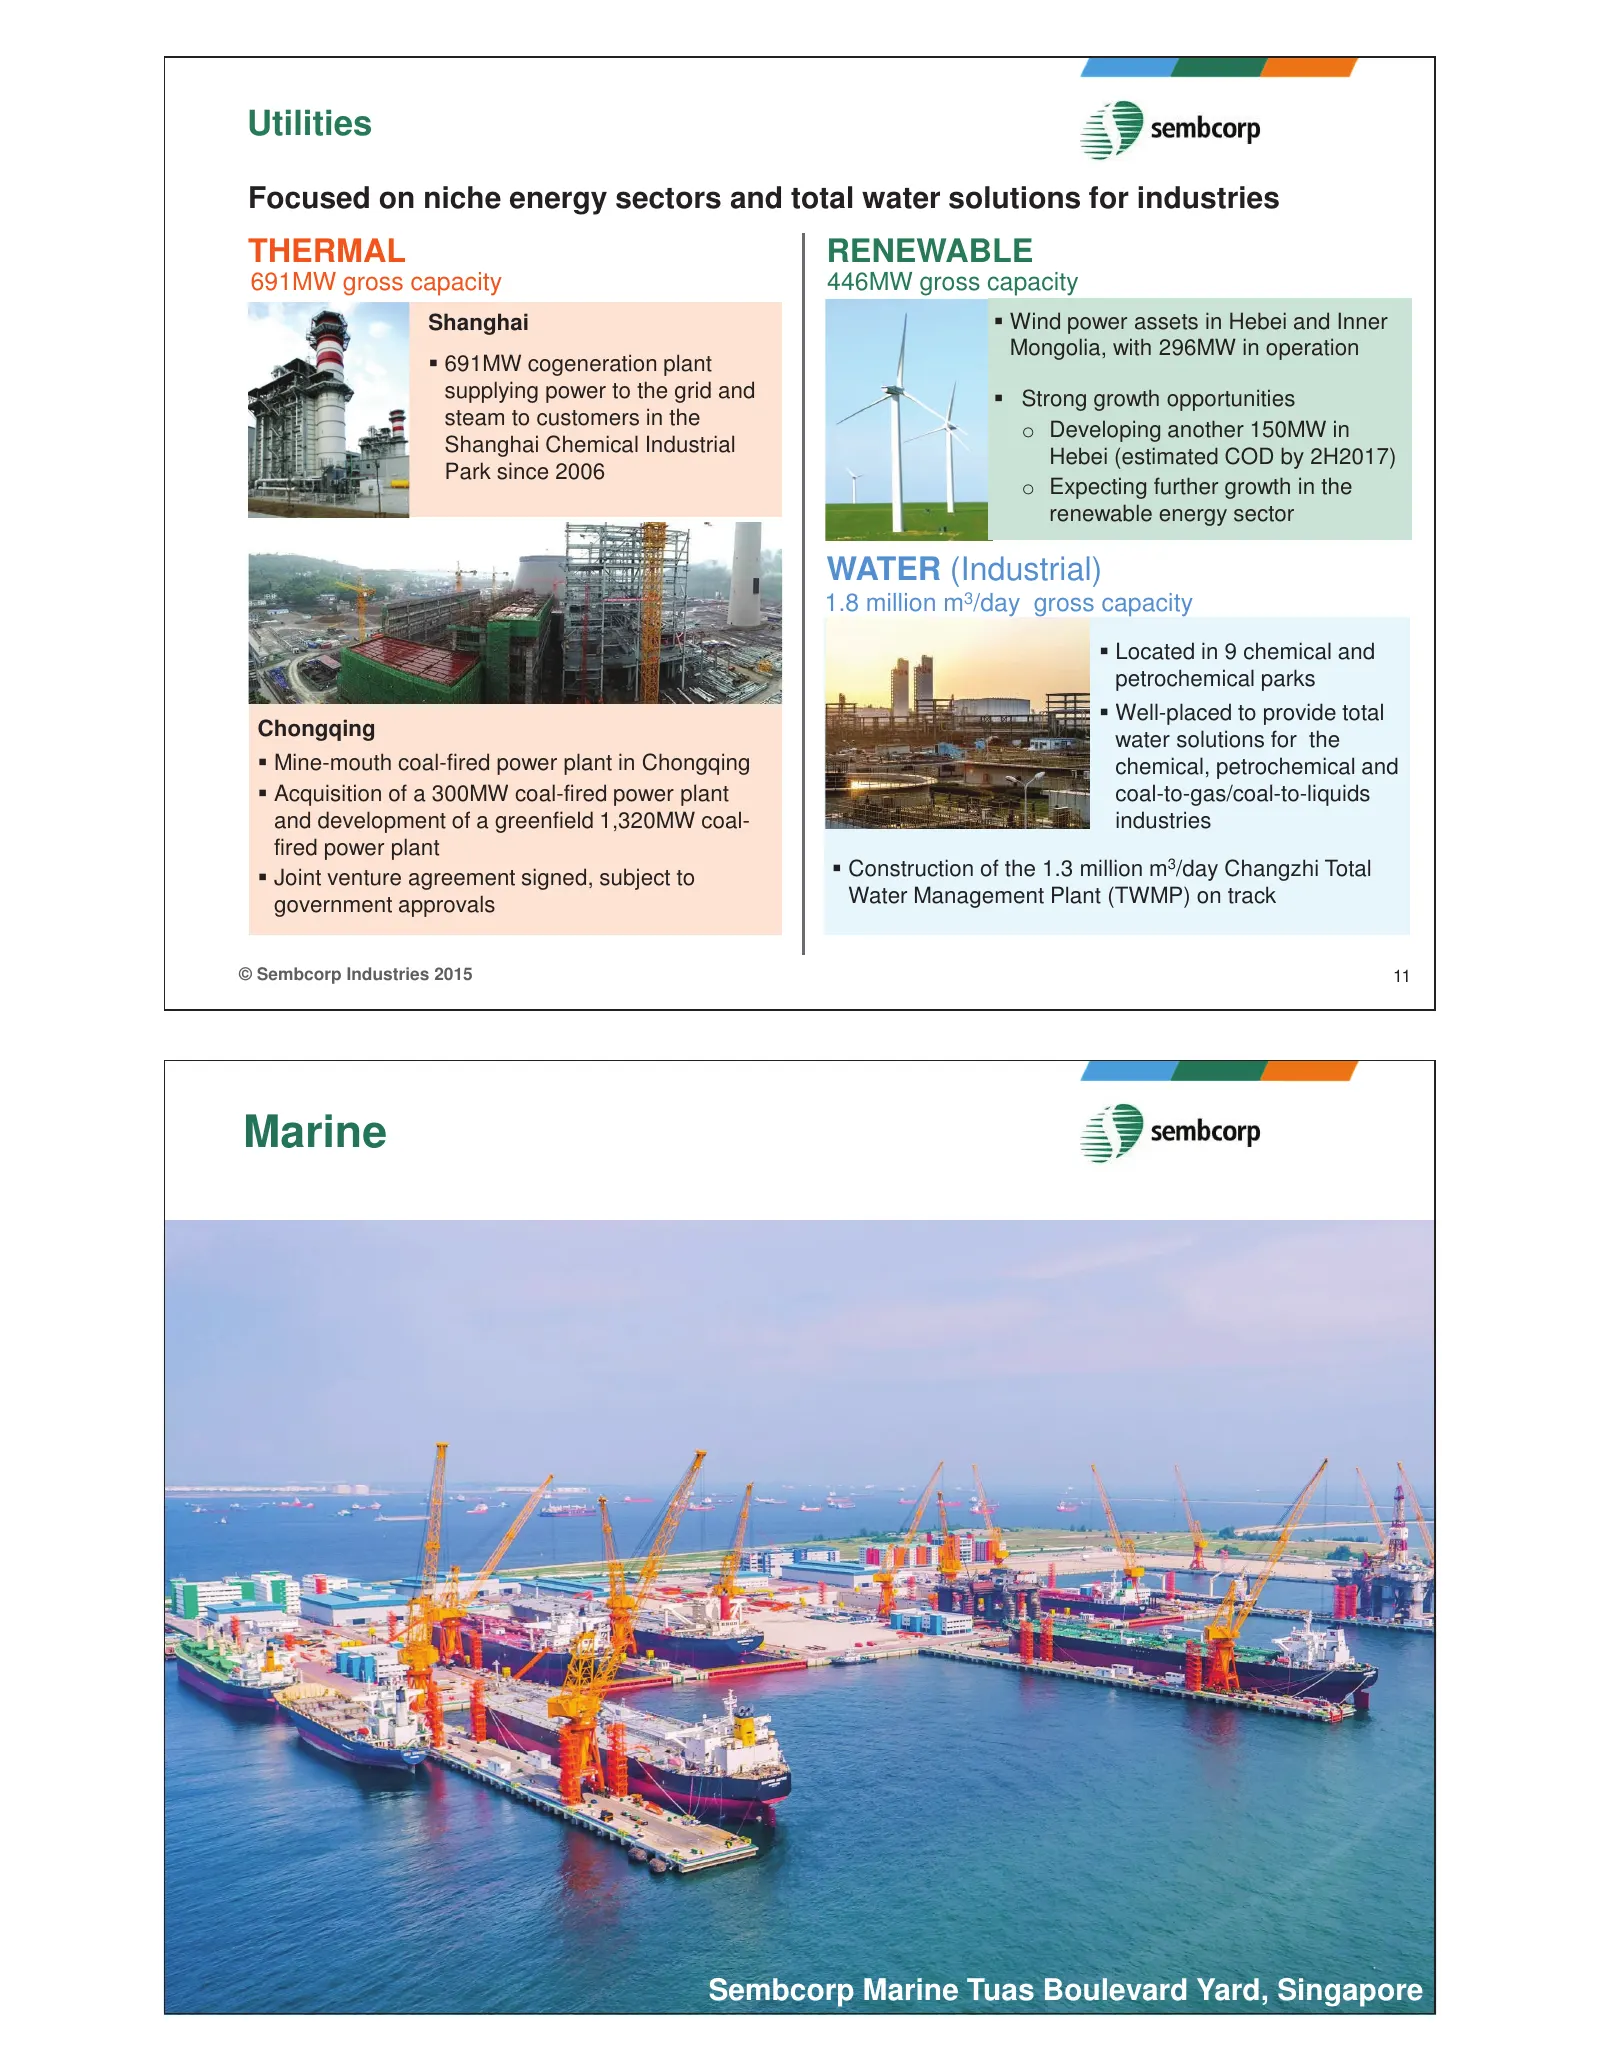
Utilities Focused on niche energy sectors and total water solutions for industries THERMAL RENEWABLE 691MW gross capacity 446MW gross capacity Shanghai Wind power assets in Hebei and Inner Mongolia, with 296MW in operation 691MW cogeneration plant supplying power to the grid and Strong growth
Slide 7: Marine: Transformation for Growth
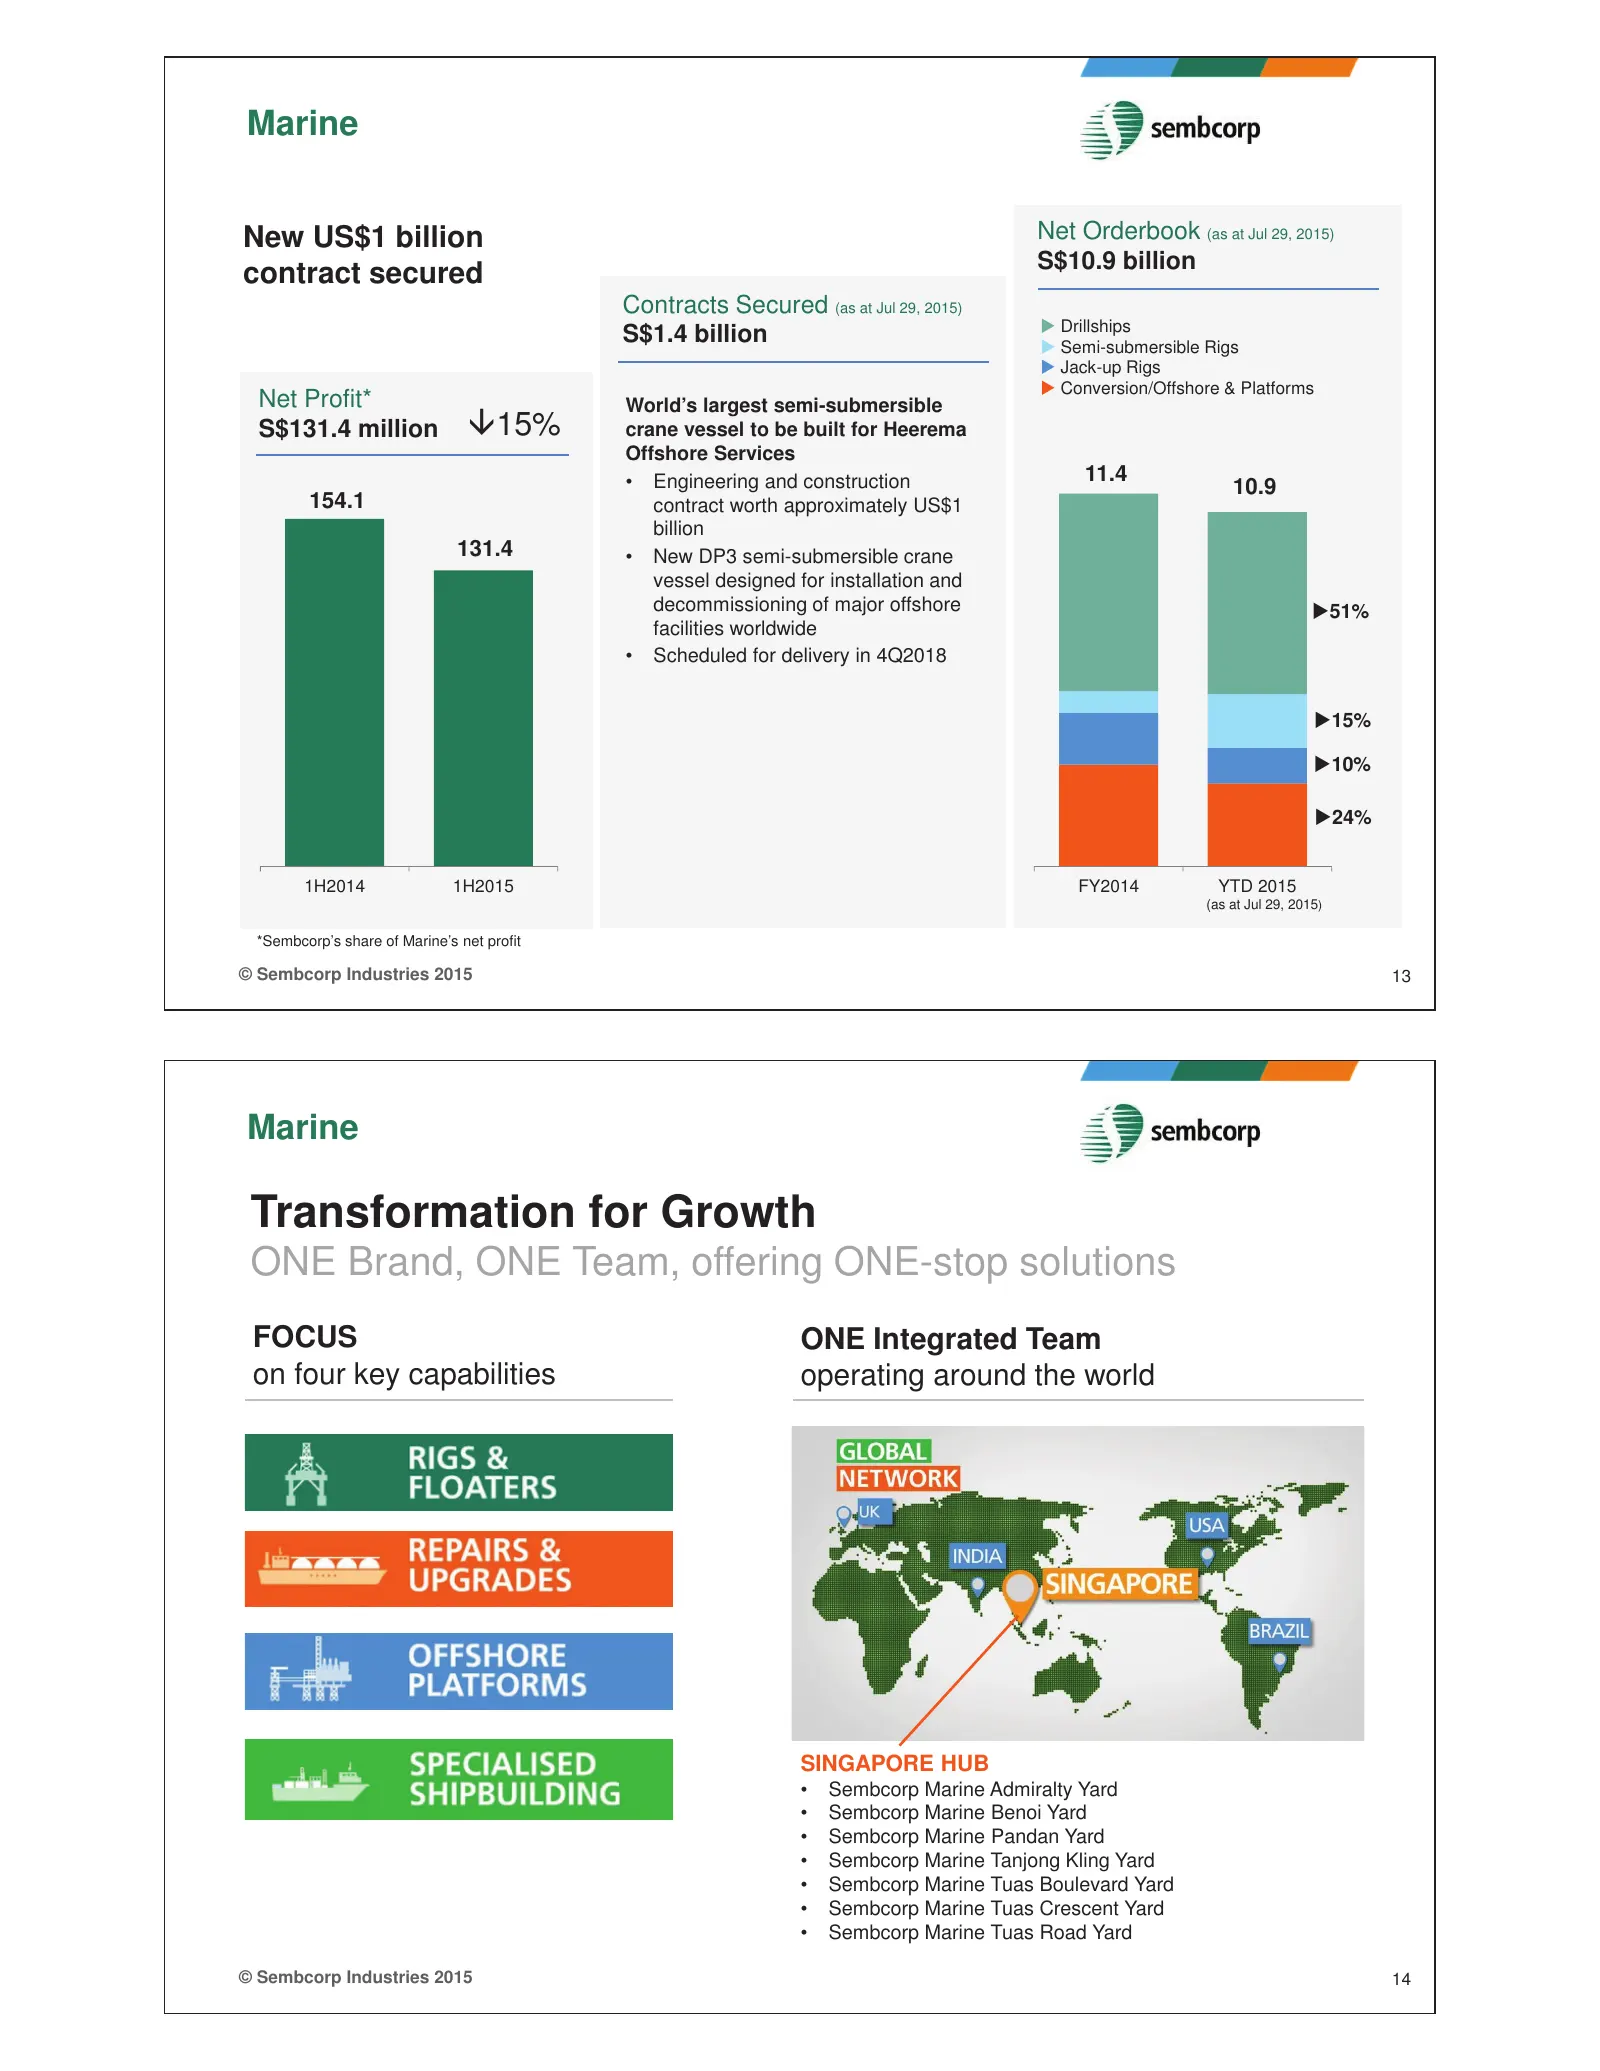
Marine New US$1 billion Net Orderbook (as at Jul 29, 2015) S$10.9 billion contract secured Contracts Secured (as at Jul 29, 2015) X Drillships S$1.4 billion X Semi-submersible Rigs X Jack-up Rigs X Conversion/Offshore & Platforms Net Profit* World’s largest semi-submersible S$131.4 million È15% cran
Slide 8: Urban Development: Land sales
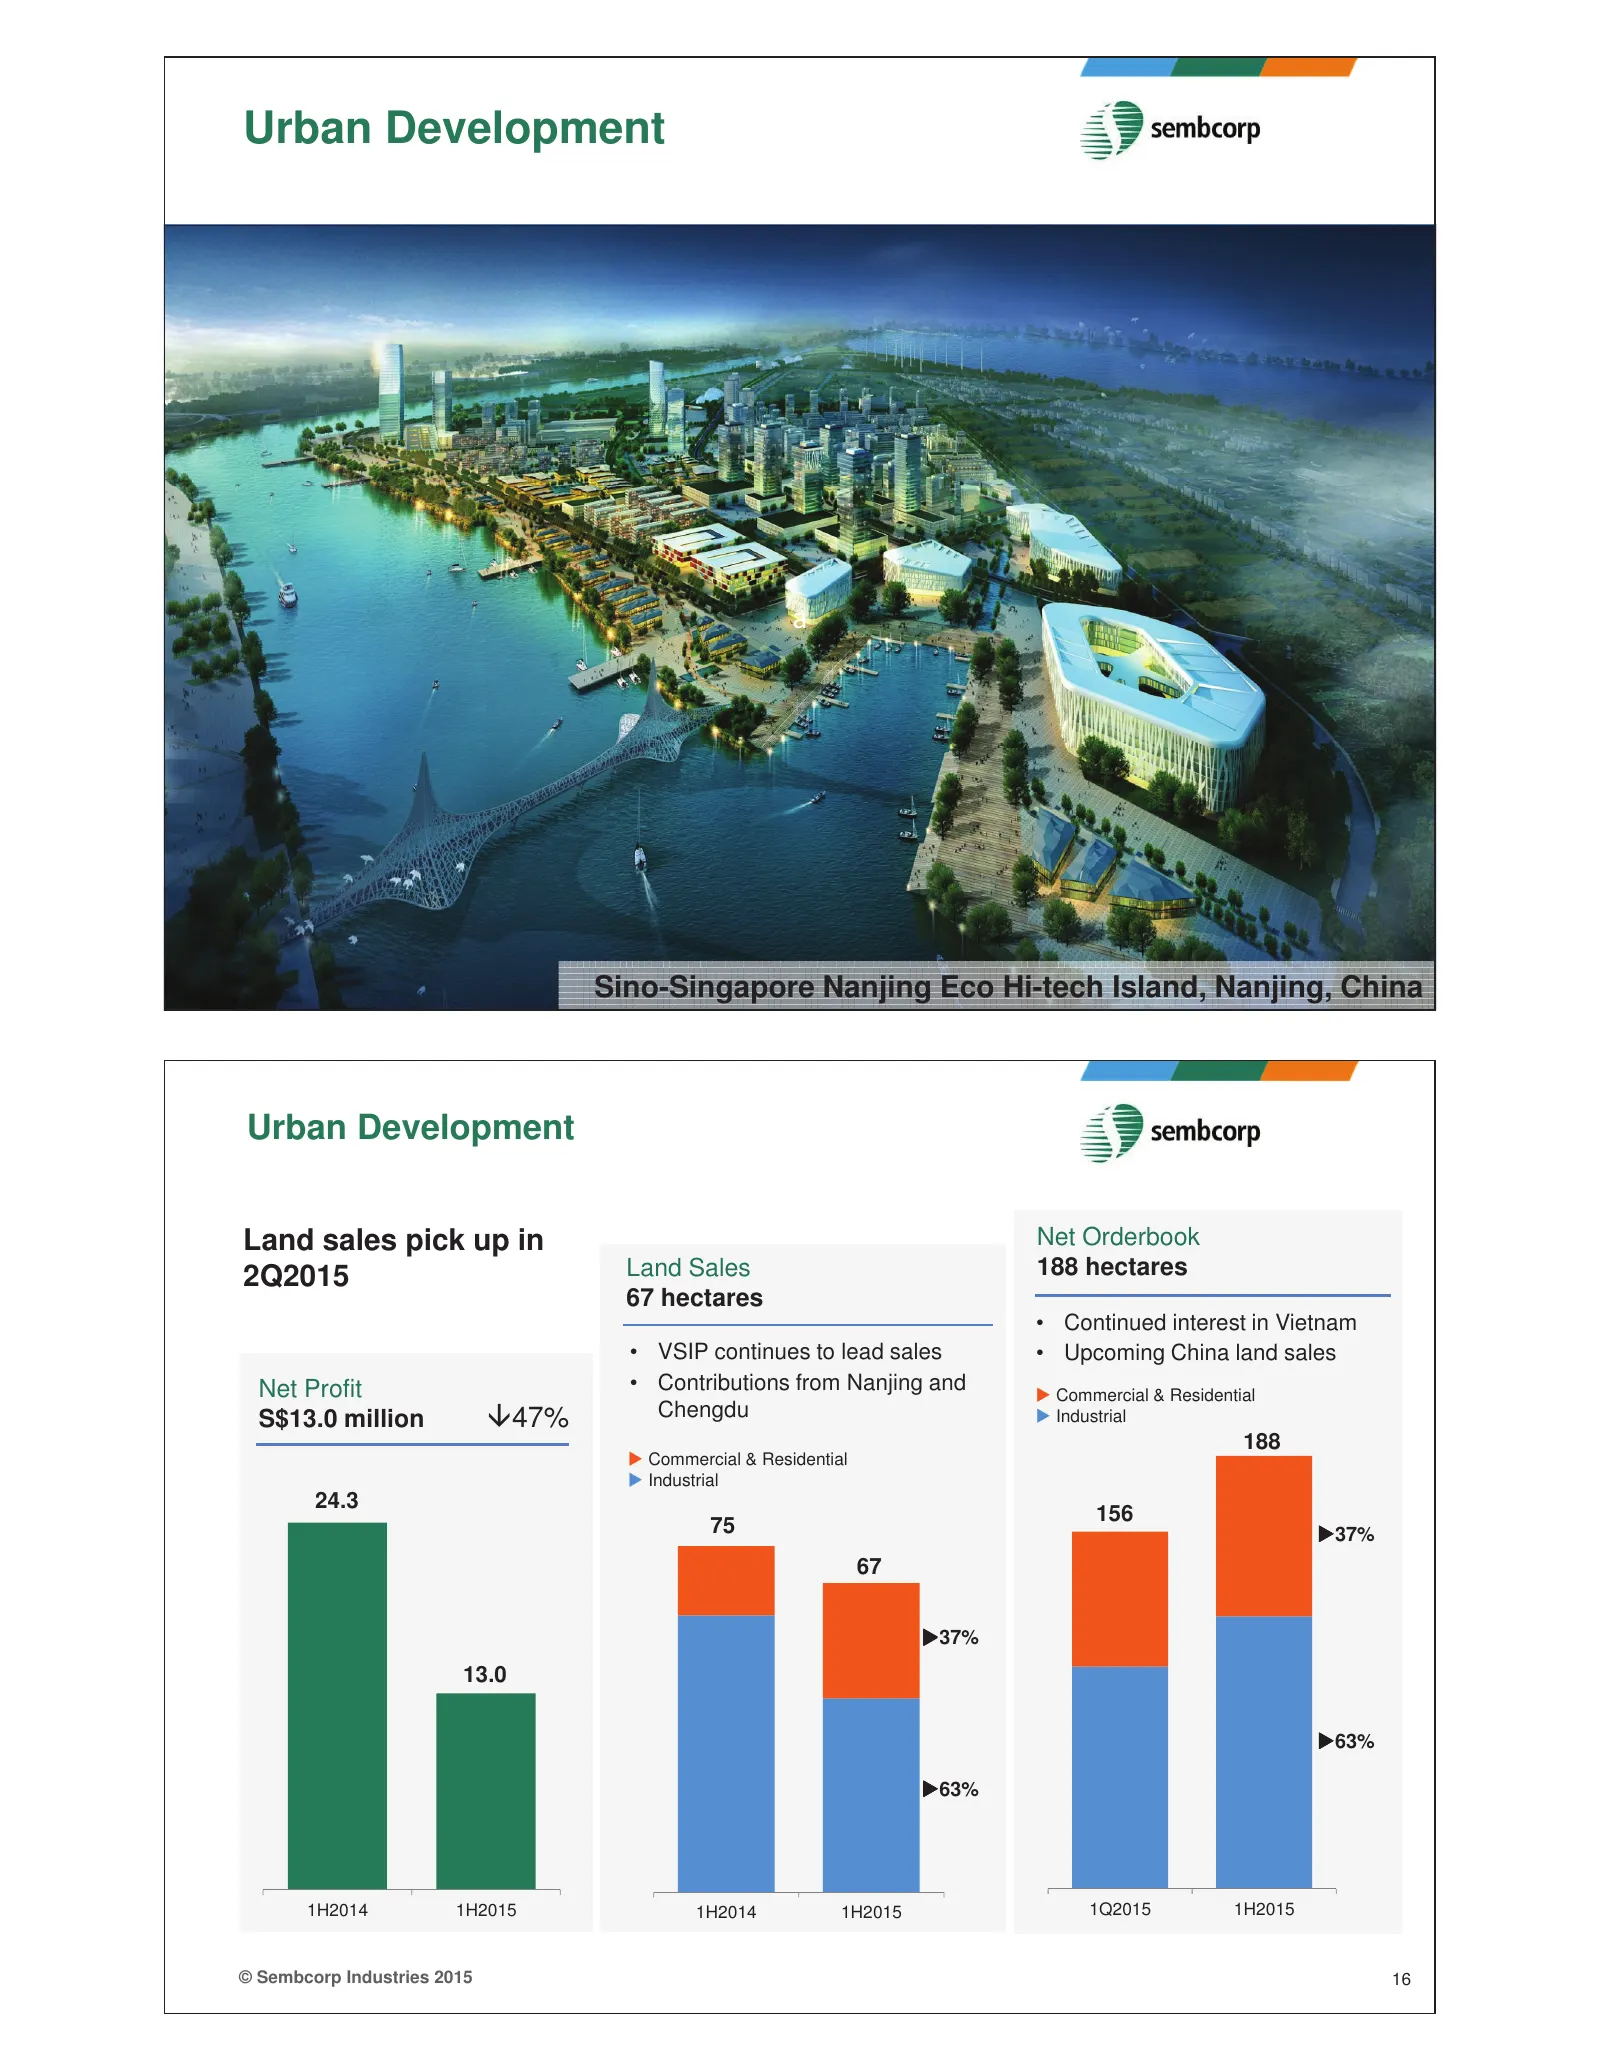
Urban Development Ă © Sembcorp Industries 2015 15 VSIP Sino-Singapore Hai Phong Integrated Township Nanjing & Industrial Eco Hi-tech Park, Vietnam Island, Nanjing, China Urban Development Land sales pick up in Net Orderbook 2Q2015 Land Sales 188 hectares 67 hectares • Continued interest in Vietnam •
Slide 9: Urban Development: New Projects Secured in 1H2015
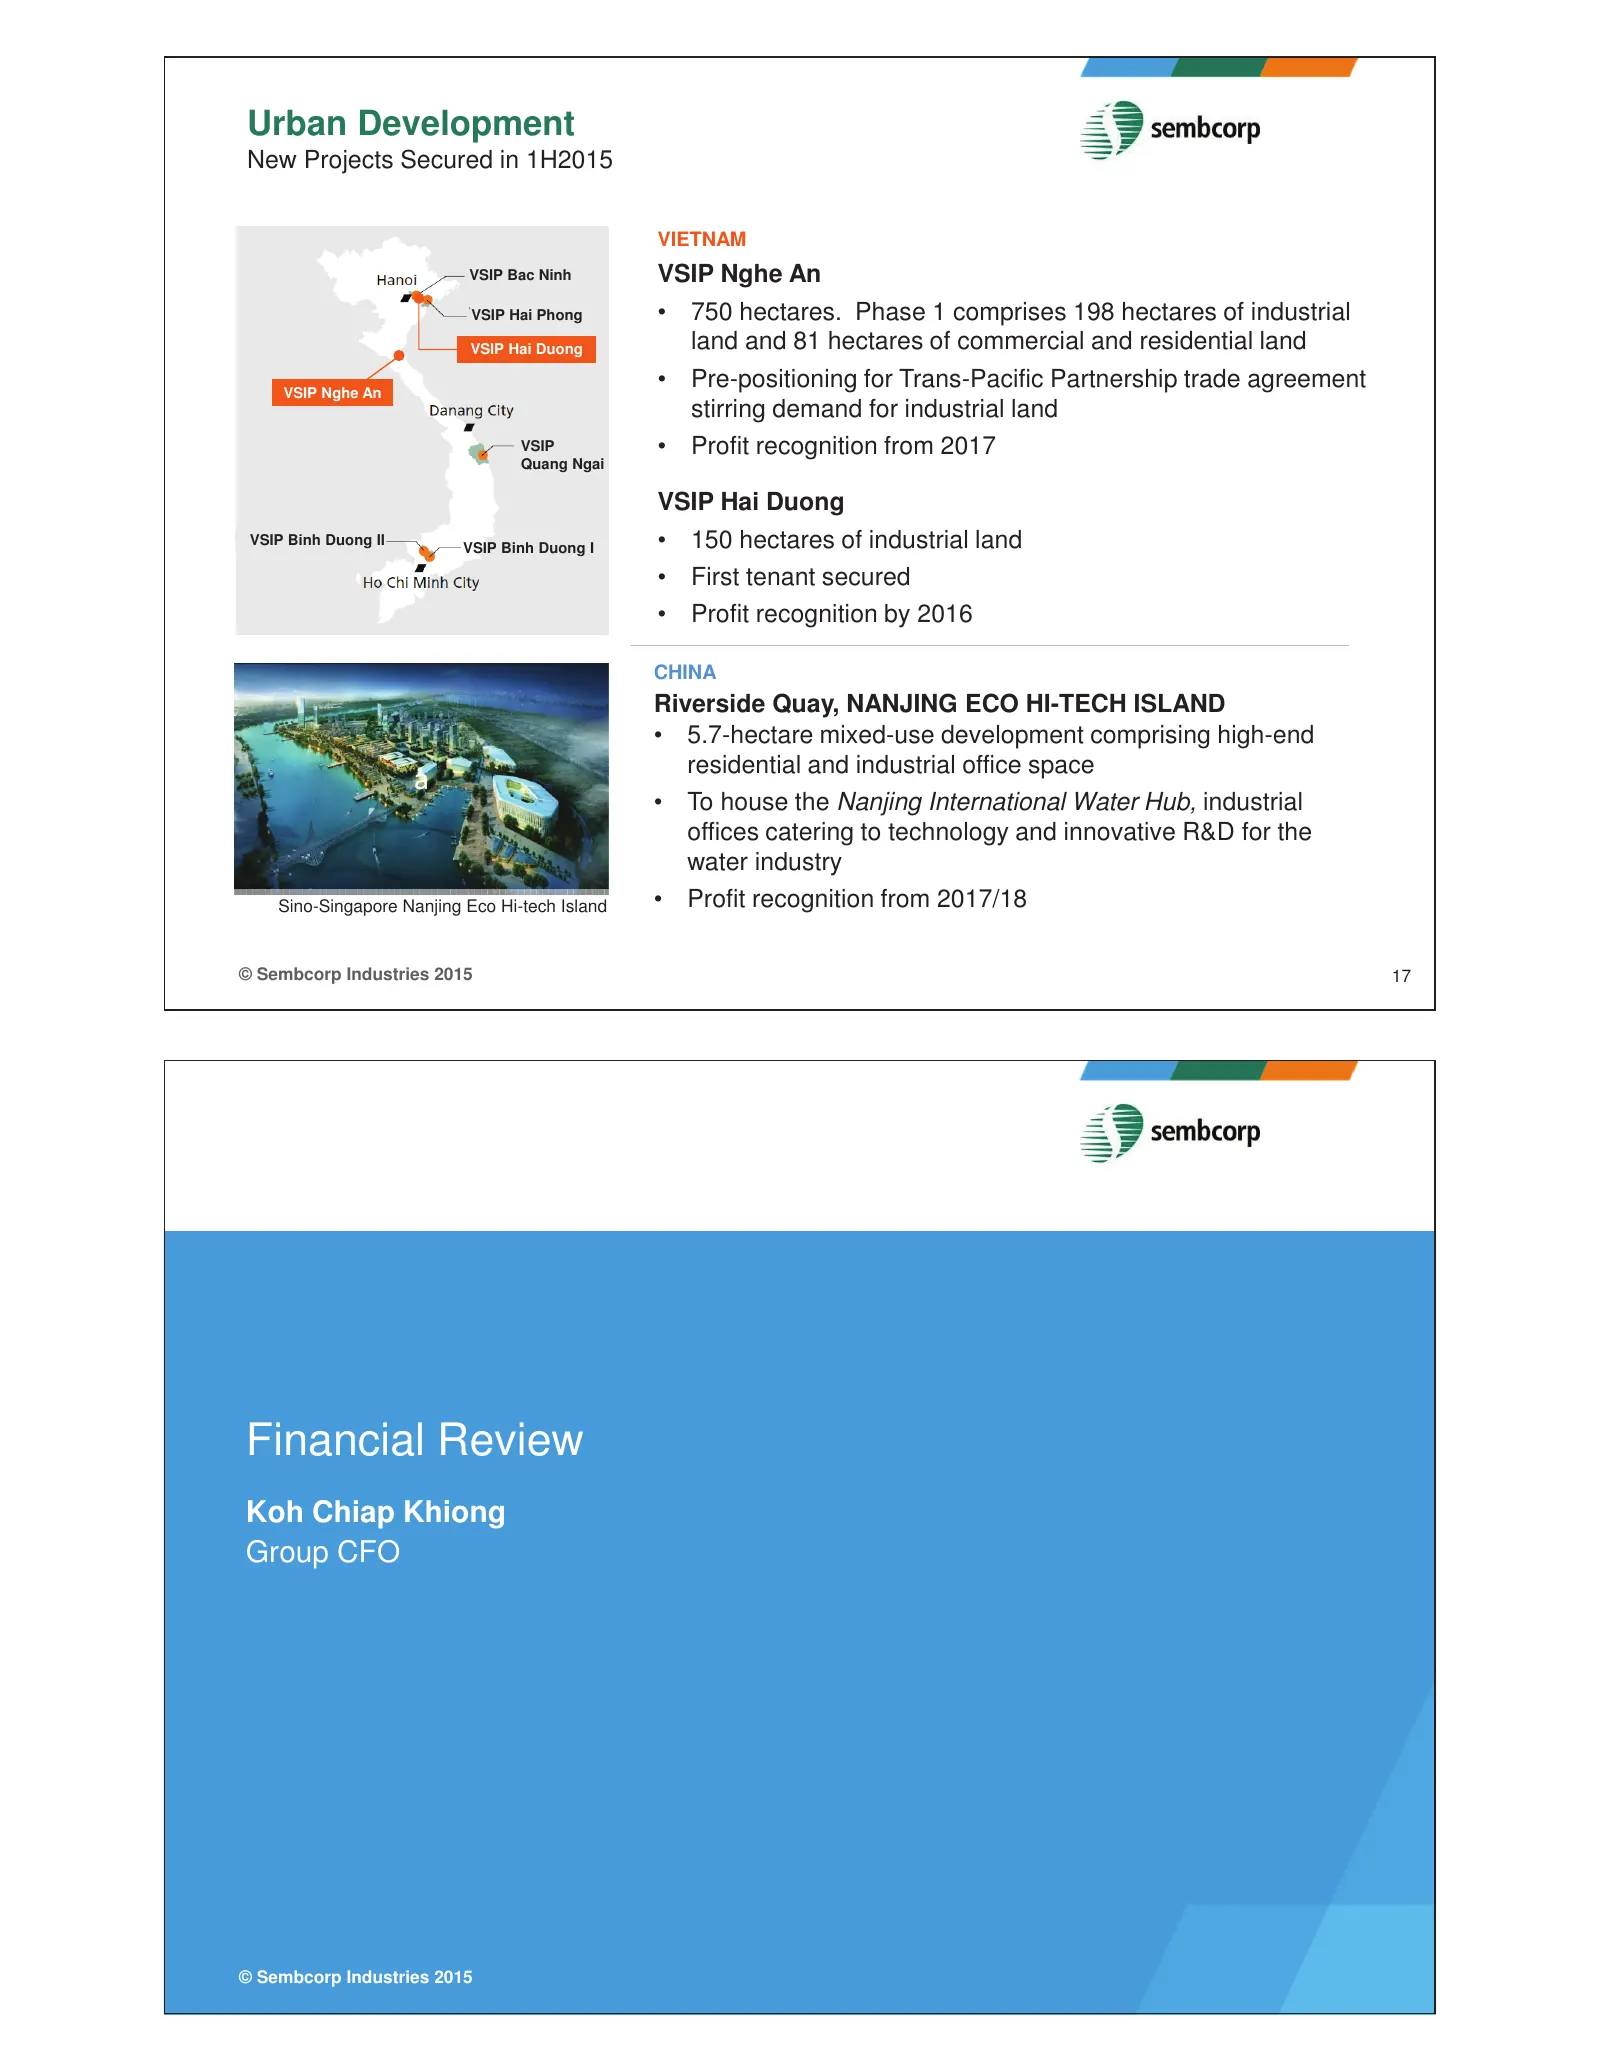
Urban Development New Projects Secured in 1H2015 VIETNAM VSIP Bac Ninh VSIP Nghe An VSIP Hai Phong • 750 hectares. Phase 1 comprises 198 hectares of industrial VSIP Hai Duong land and 81 hectares of commercial and residential land VSIP Nghe An • Pre-positioning for Trans-Pacific Partnership trade ag
Slide 10: Group Profit & Loss and Turnover
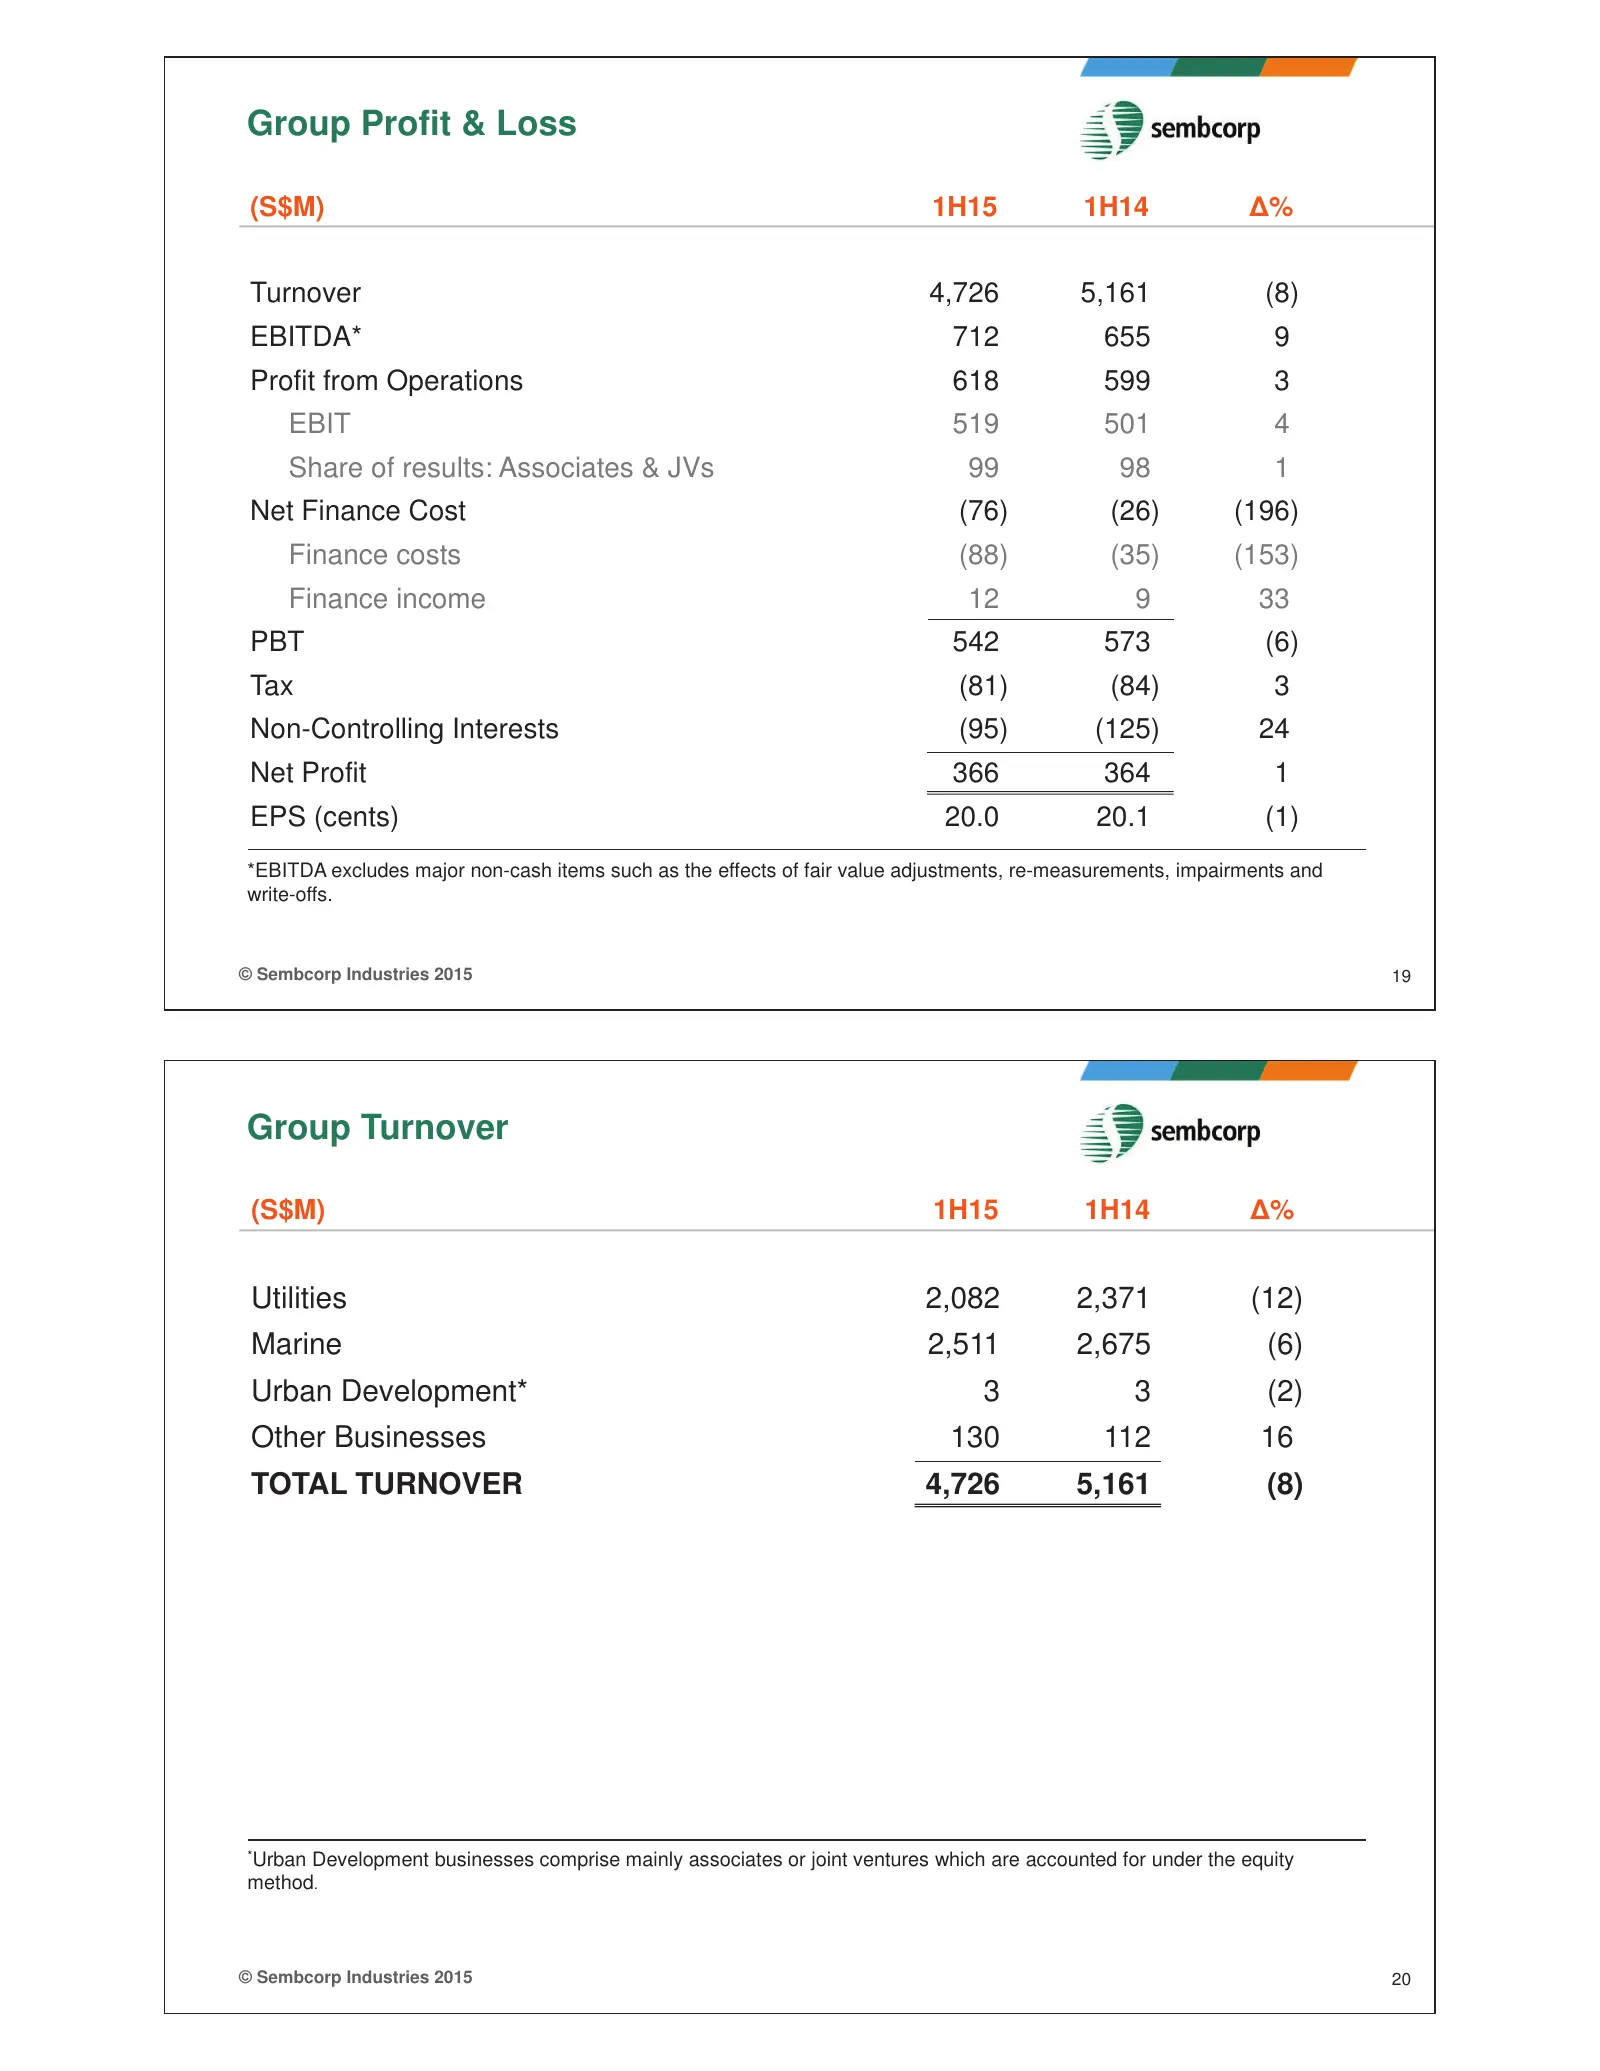
Group Profit & Loss (S$M) 1H15 1H14 ǻ% Turnover 4,726 5,161 (8) EBITDA* 712 655 9 Profit from Operations 618 599 3 EBIT 519 501 4 Share of results: Associates & JVs 99 98 1 Net Finance Cost (76) (26) (196) Finance costs (88) (35) (153) Finance income 12 9 33 PBT 542 573 (6) Tax (81) (84) 3 Non-Contr
Slide 11: Group Profit from Operations and Net Profit
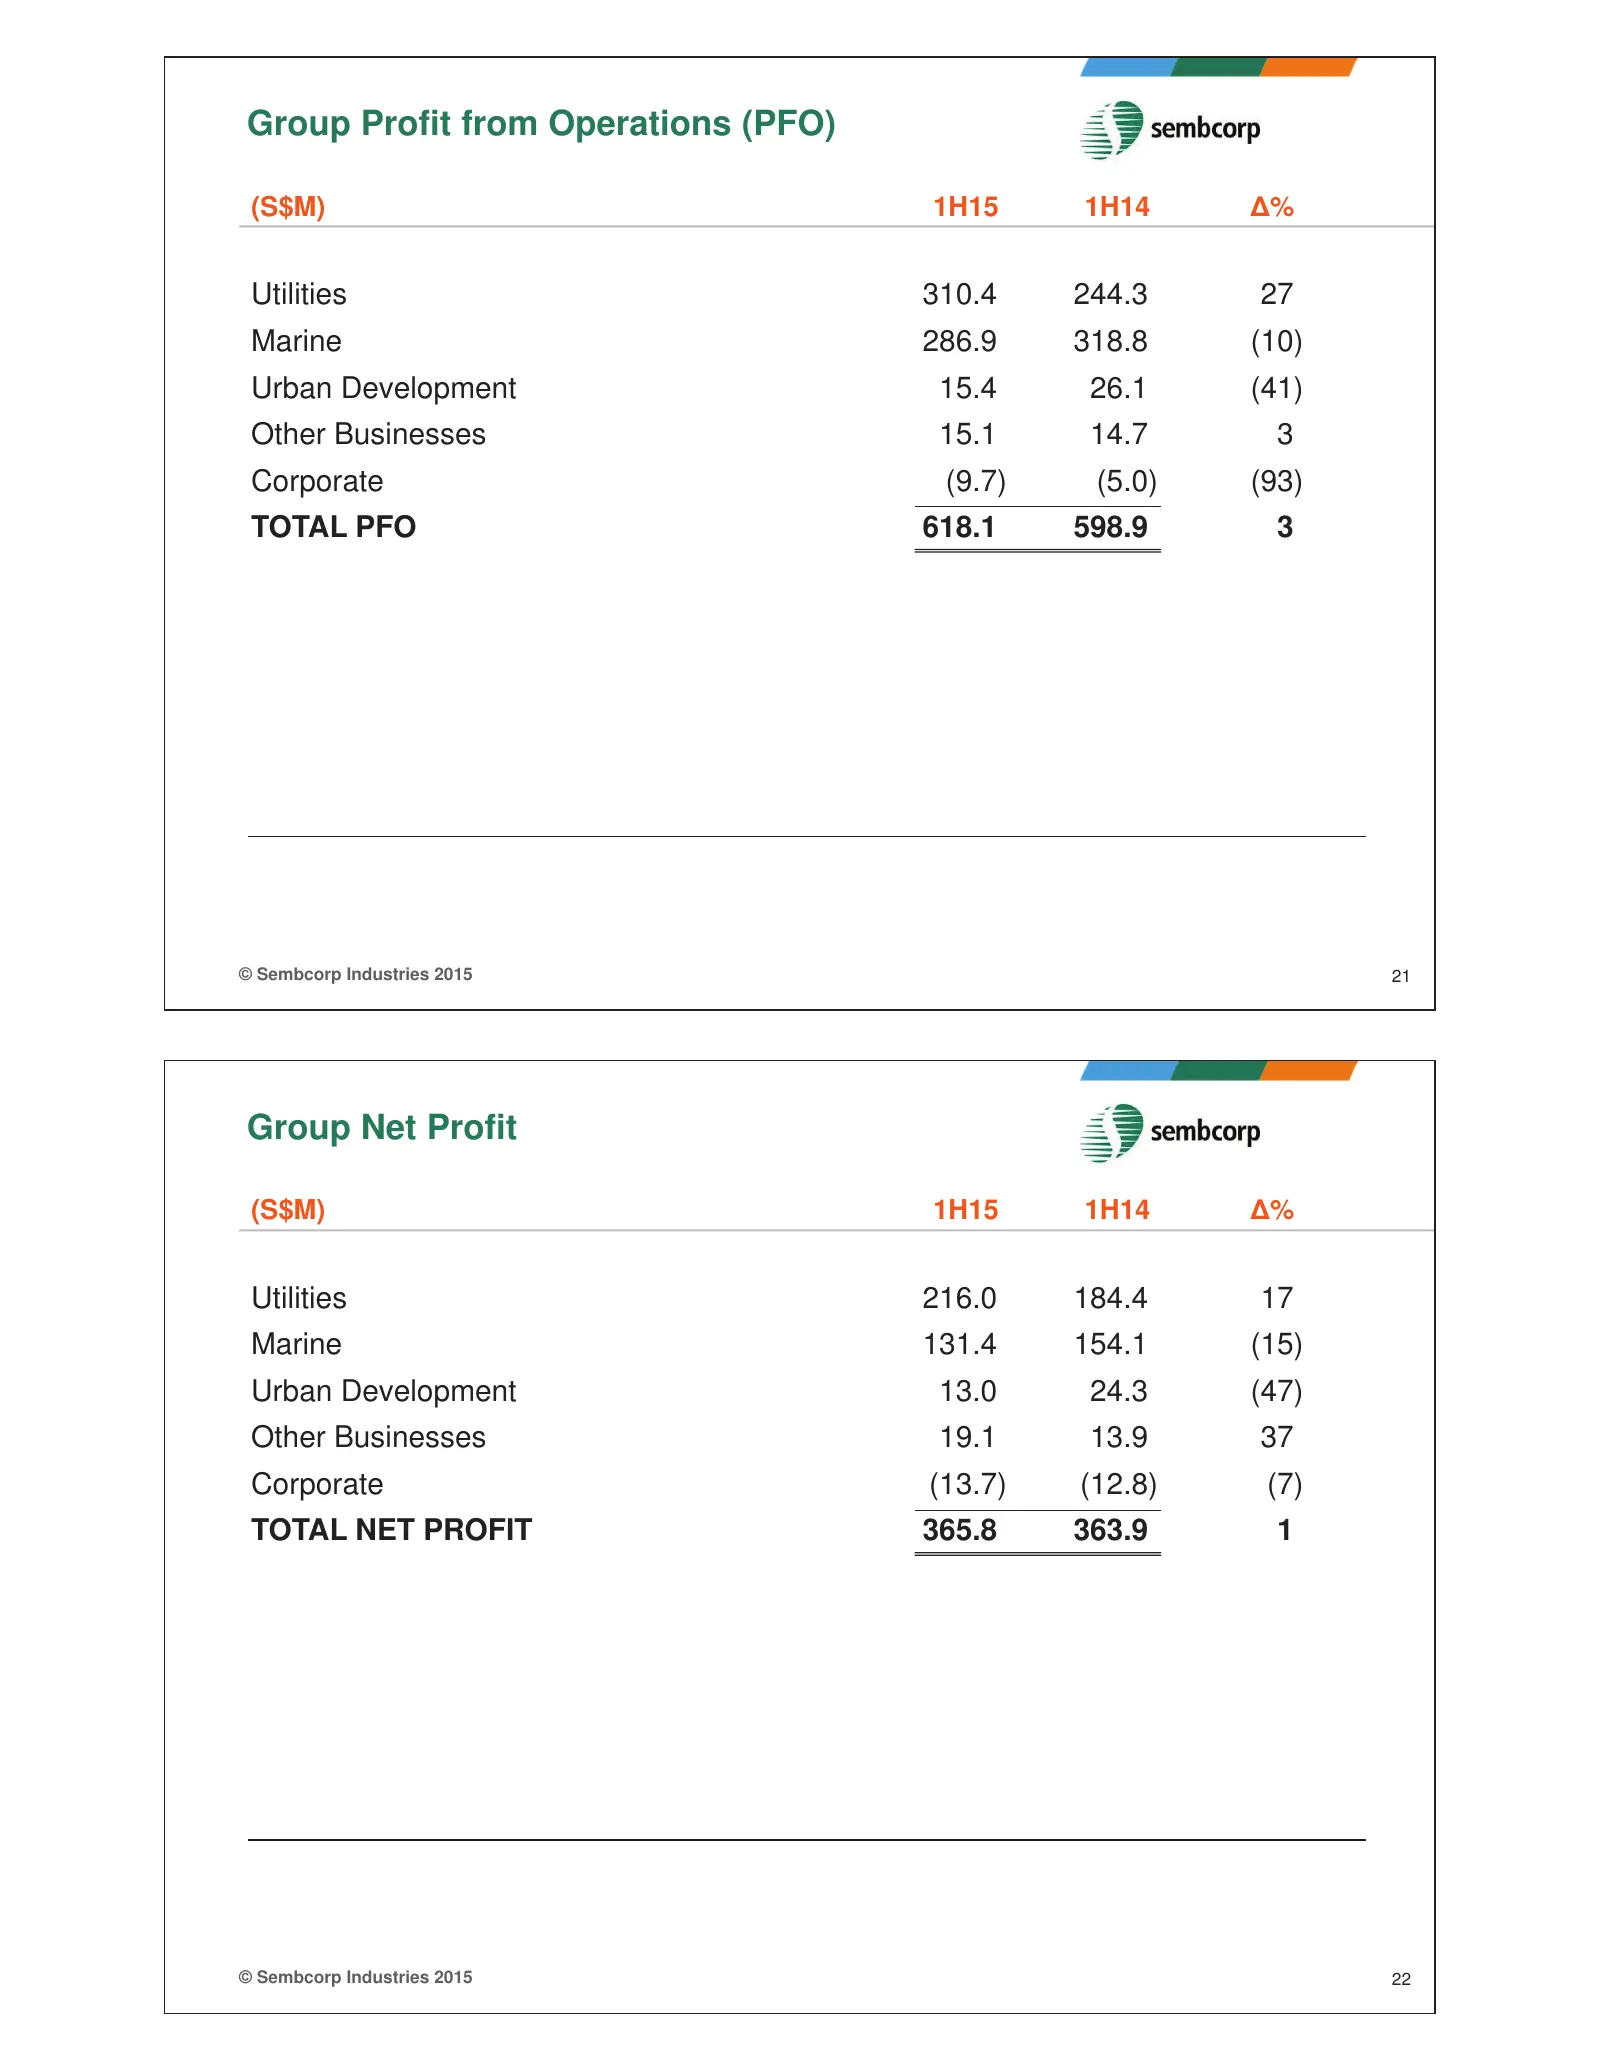
Group Profit from Operations (PFO) (S$M) 1H15 1H14 ǻ% Utilities 310.4 244.3 27 Marine 286.9 318.8 (10) Urban Development 15.4 26.1 (41) Other Businesses 15.1 14.7 3 Corporate (9.7) (5.0) (93) TOTAL PFO 618.1 598.9 3 © Sembcorp Industries 2015 21 Group Net Profit (S$M) 1H15 1H14 ǻ% Utilities 216.0 18
Slide 12: Utilities Net Profit
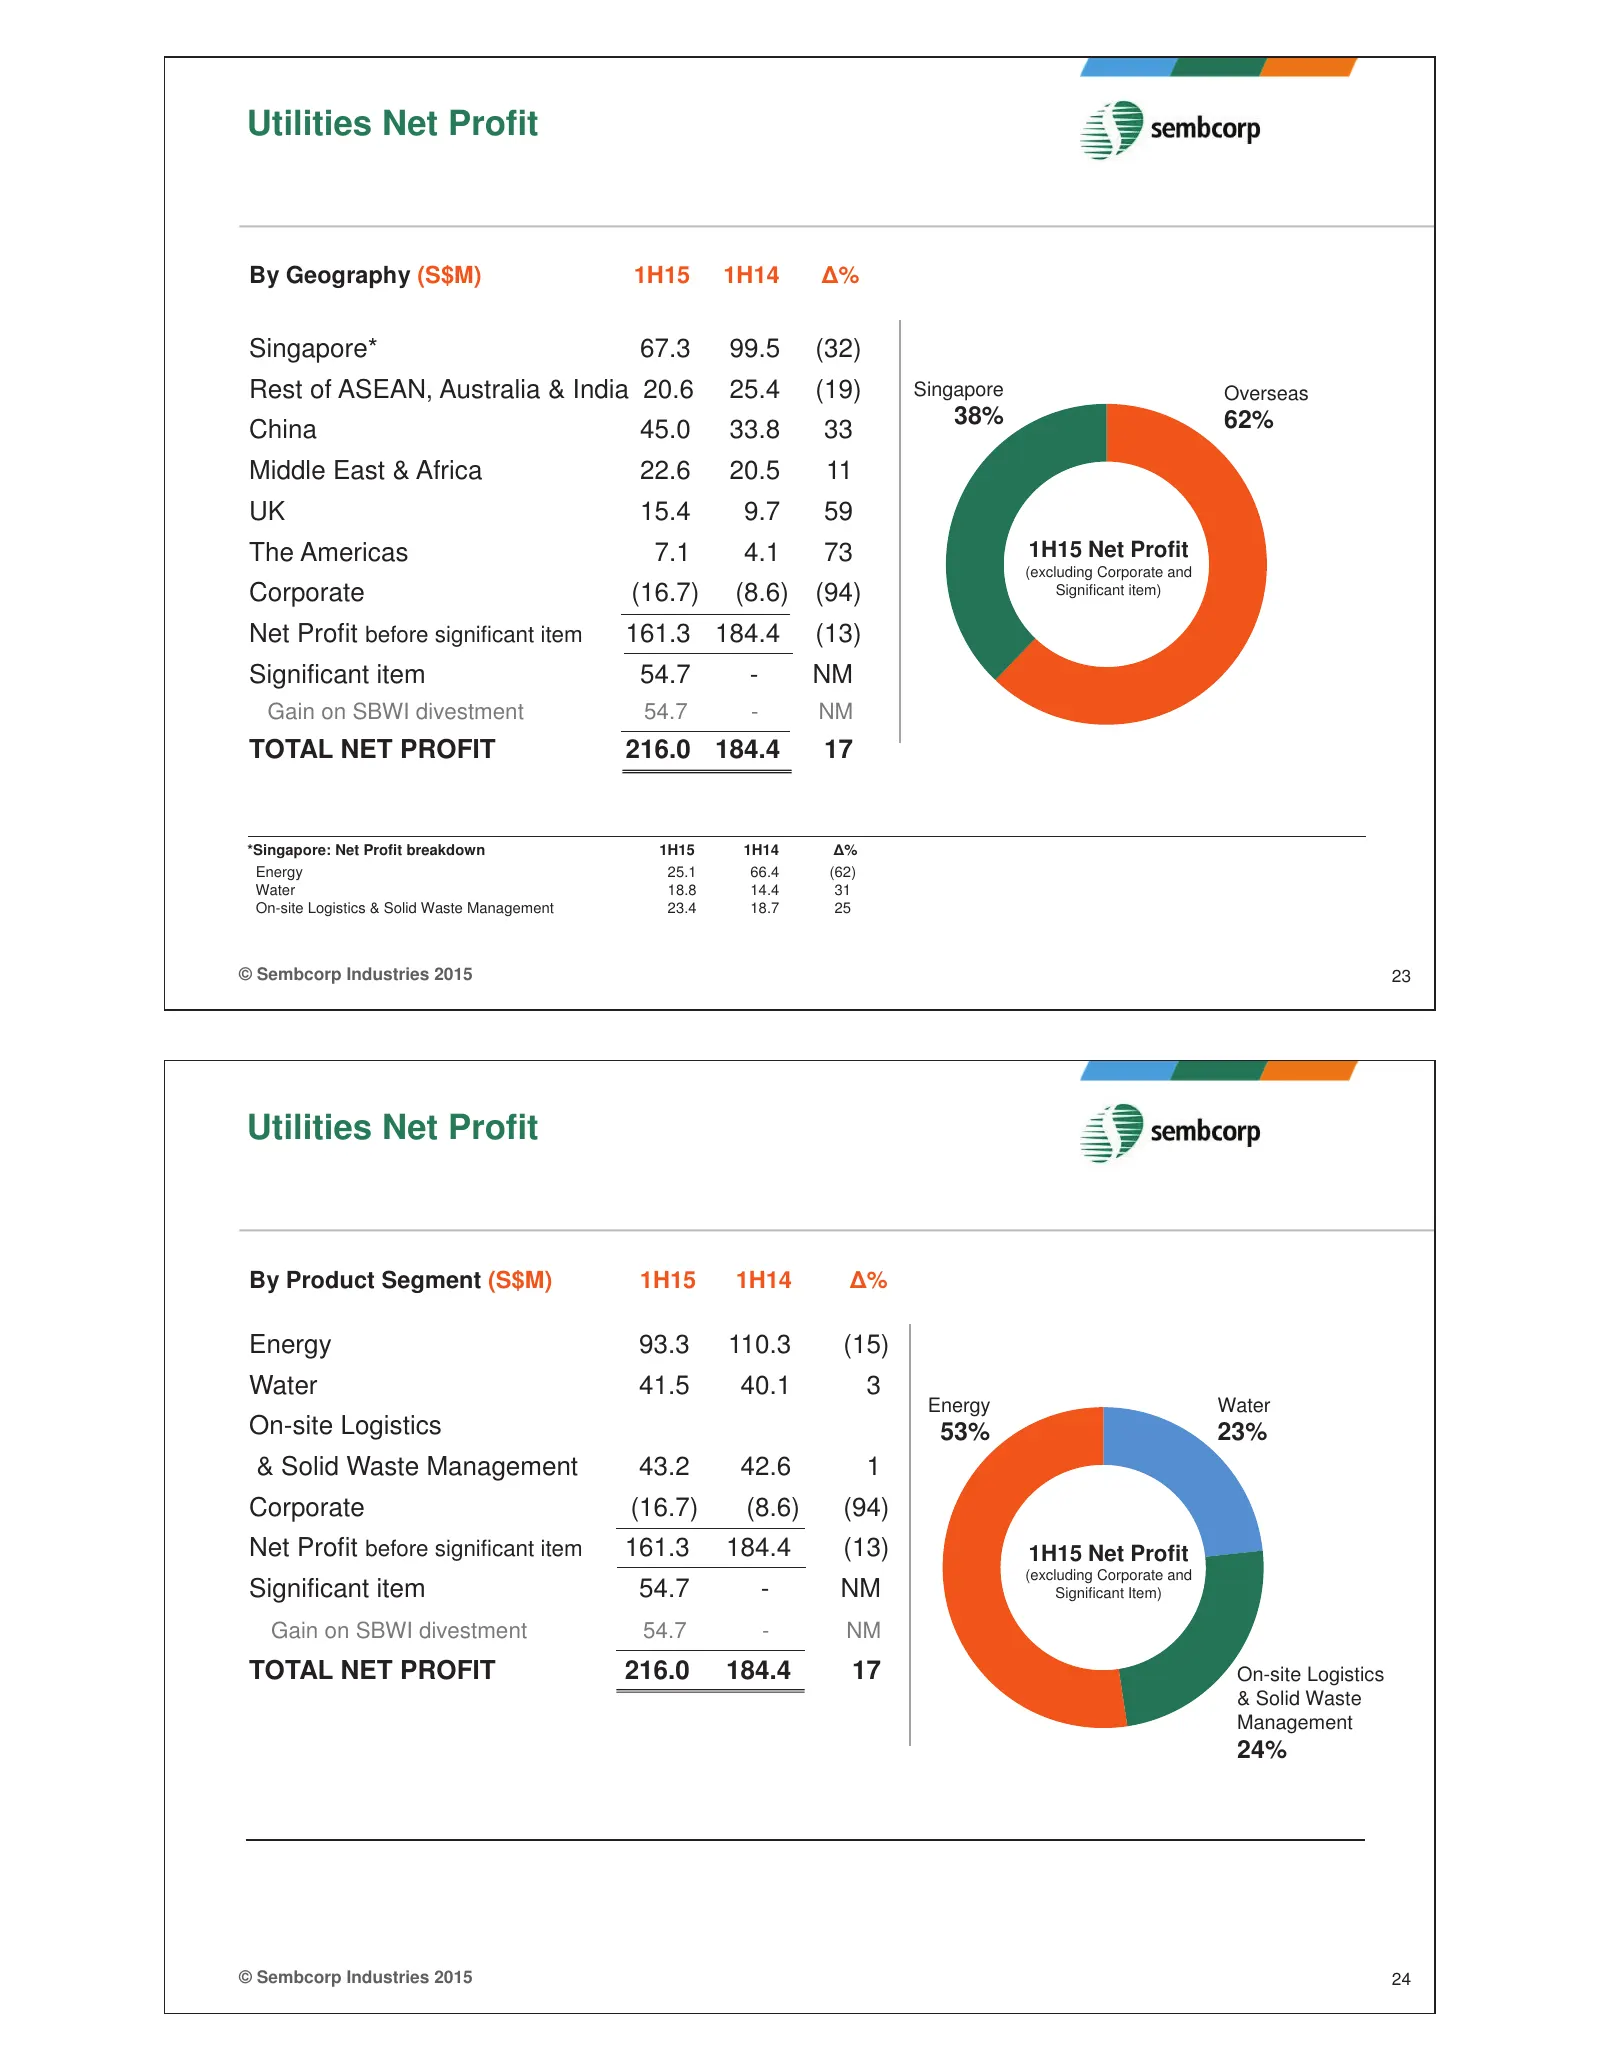
Utilities Net Profit By Geography (S$M) 1H15 1H14 ǻ% Singapore* 67.3 99.5 (32) Rest of ASEAN, Australia & India 20.6 25.4 (19) Singapore Overseas 38% 62% China 45.0 33.8 33 Middle East & Africa 22.6 20.5 11 UK 15.4 9.7 59 The Americas 7.1 4.1 73 1H15 Net Profit (excluding Corporate and Corporate (16
Slide 13: Group Capex and Free Cash Flow
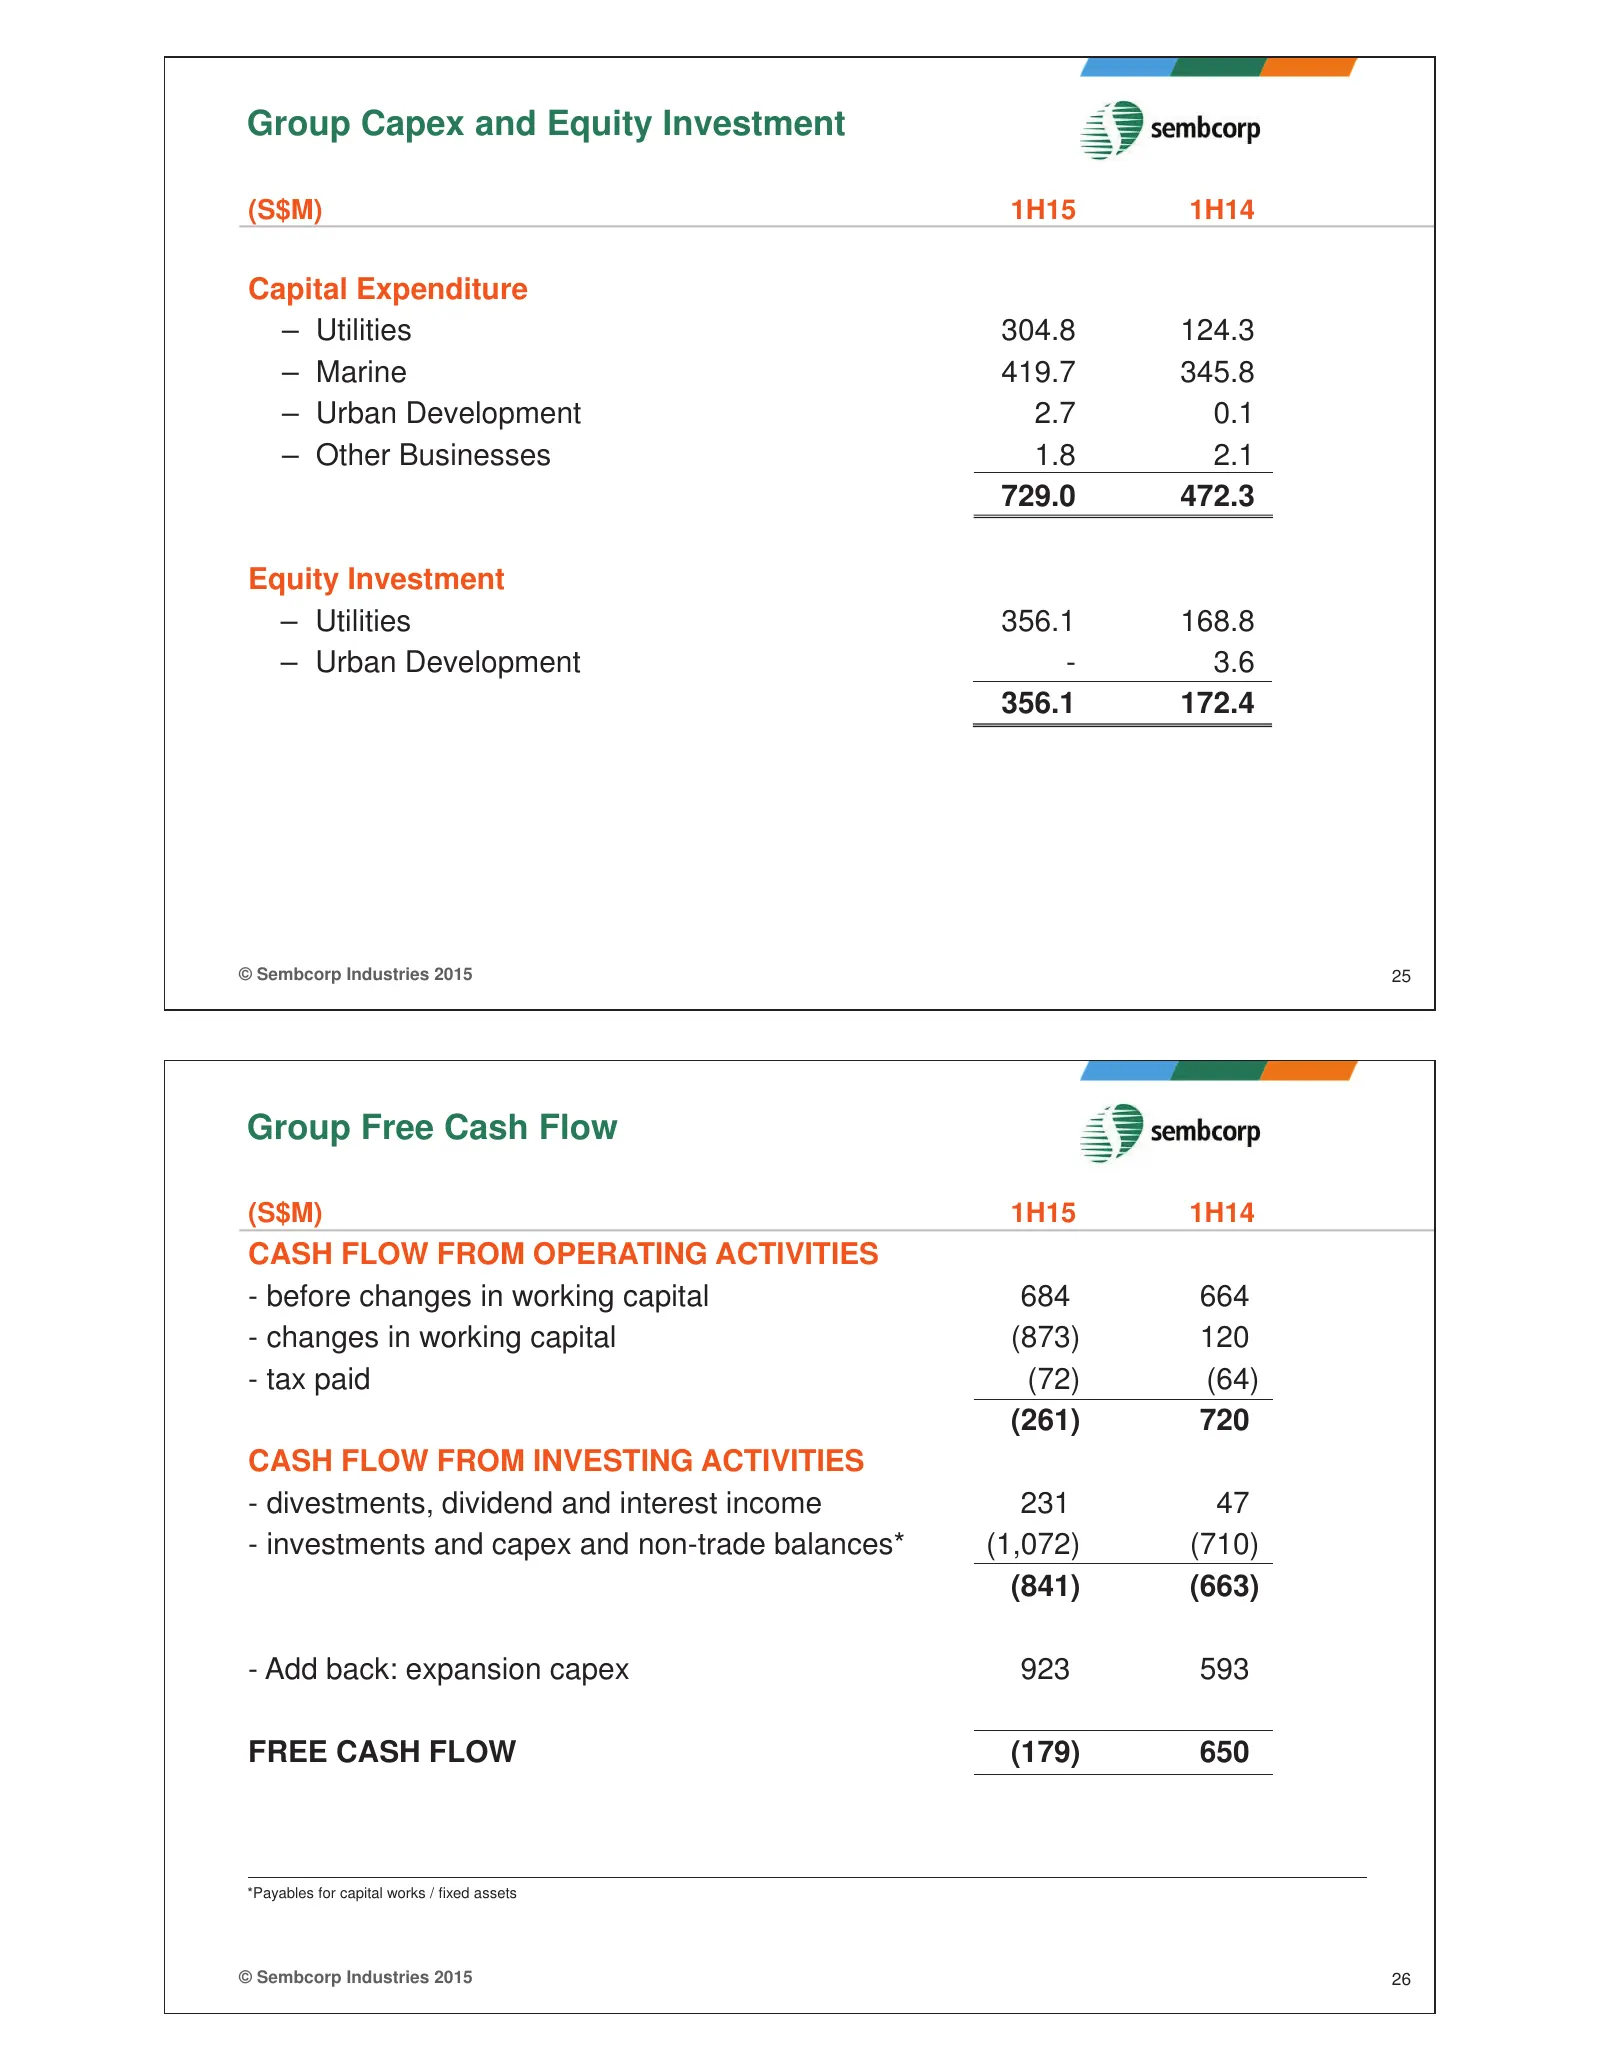
Group Capex and Equity Investment (S$M) 1H15 1H14 Capital Expenditure – Utilities 304.8 124.3 – Marine 419.7 345.8 – Urban Development 2.7 0.1 – Other Businesses 1.8 2.1 729.0 472.3 Equity Investment – Utilities 356.1 168.8 – Urban Development - 3.6 356.1 172.4 © Sembcorp Industries 2015 25 Group Fr
Slide 14: Group Borrowings and Financial Indicators
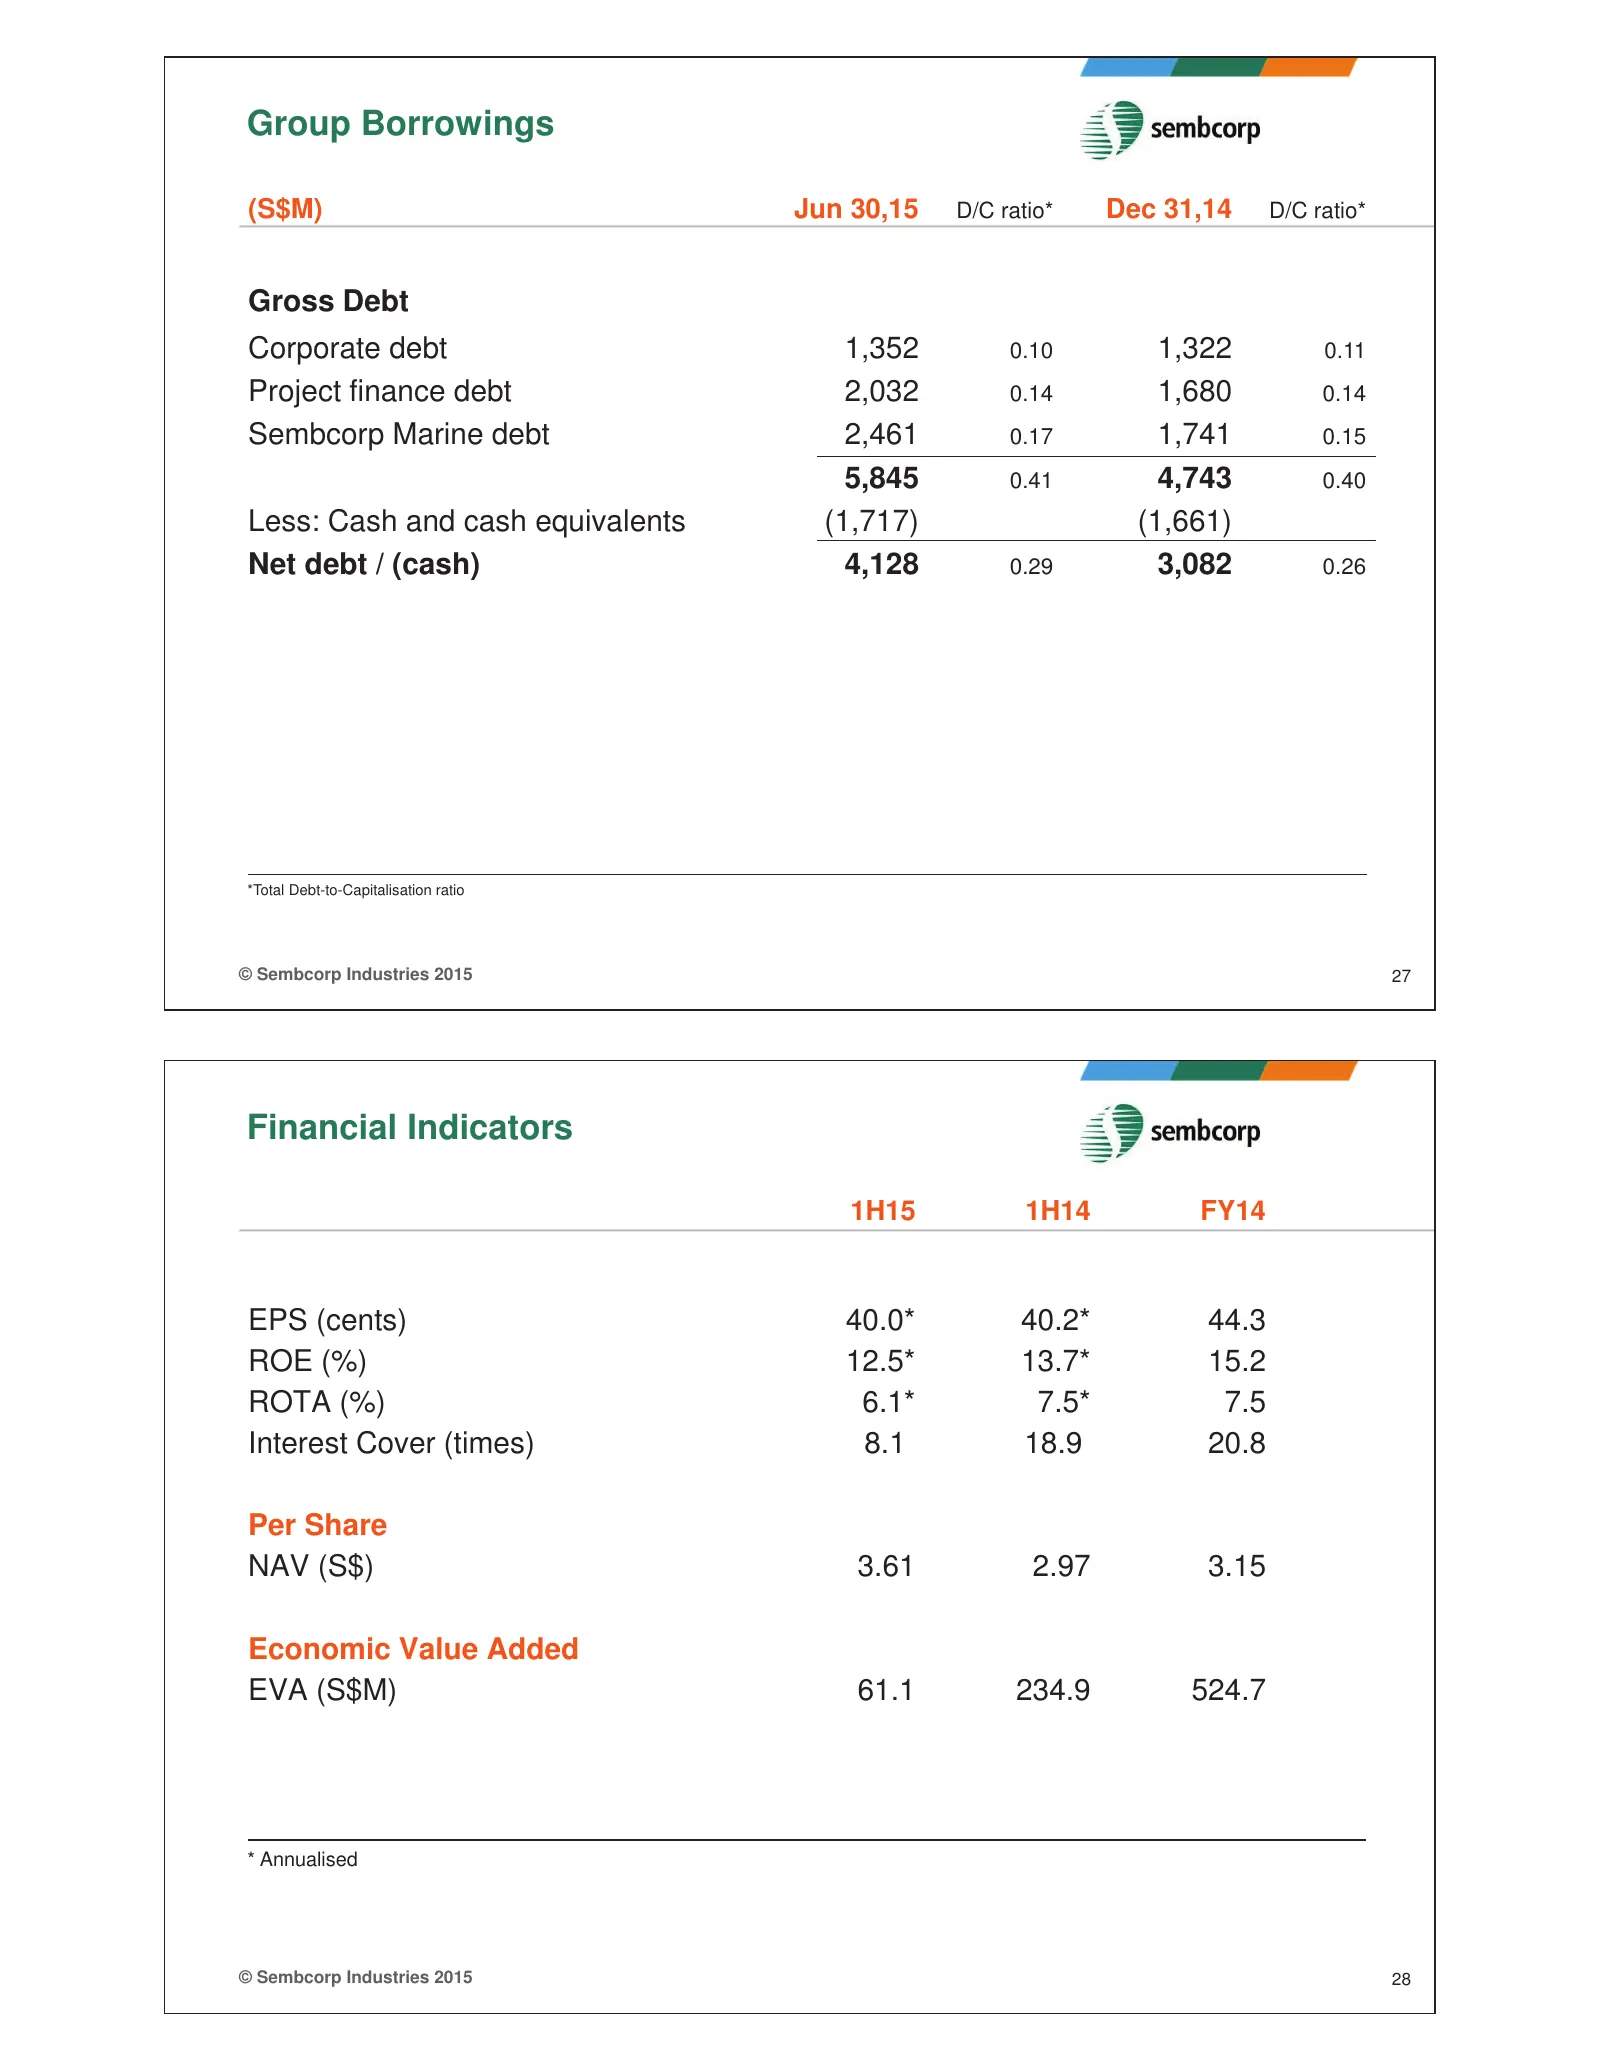
Group Borrowings (S$M) Jun 30,15 D/C ratio* Dec 31,14 D/C ratio* Gross Debt Corporate debt 1,352 0.10 1,322 0.11 Project finance debt 2,032 0.14 1,680 0.14 Sembcorp Marine debt 2,461 0.17 1,741 0.15 5,845 0.41 4,743 0.40 Less: Cash and cash equivalents (1,717) (1,661) Net debt / (cash) 4,128 0.29 3,
Slide 15: Group Outlook
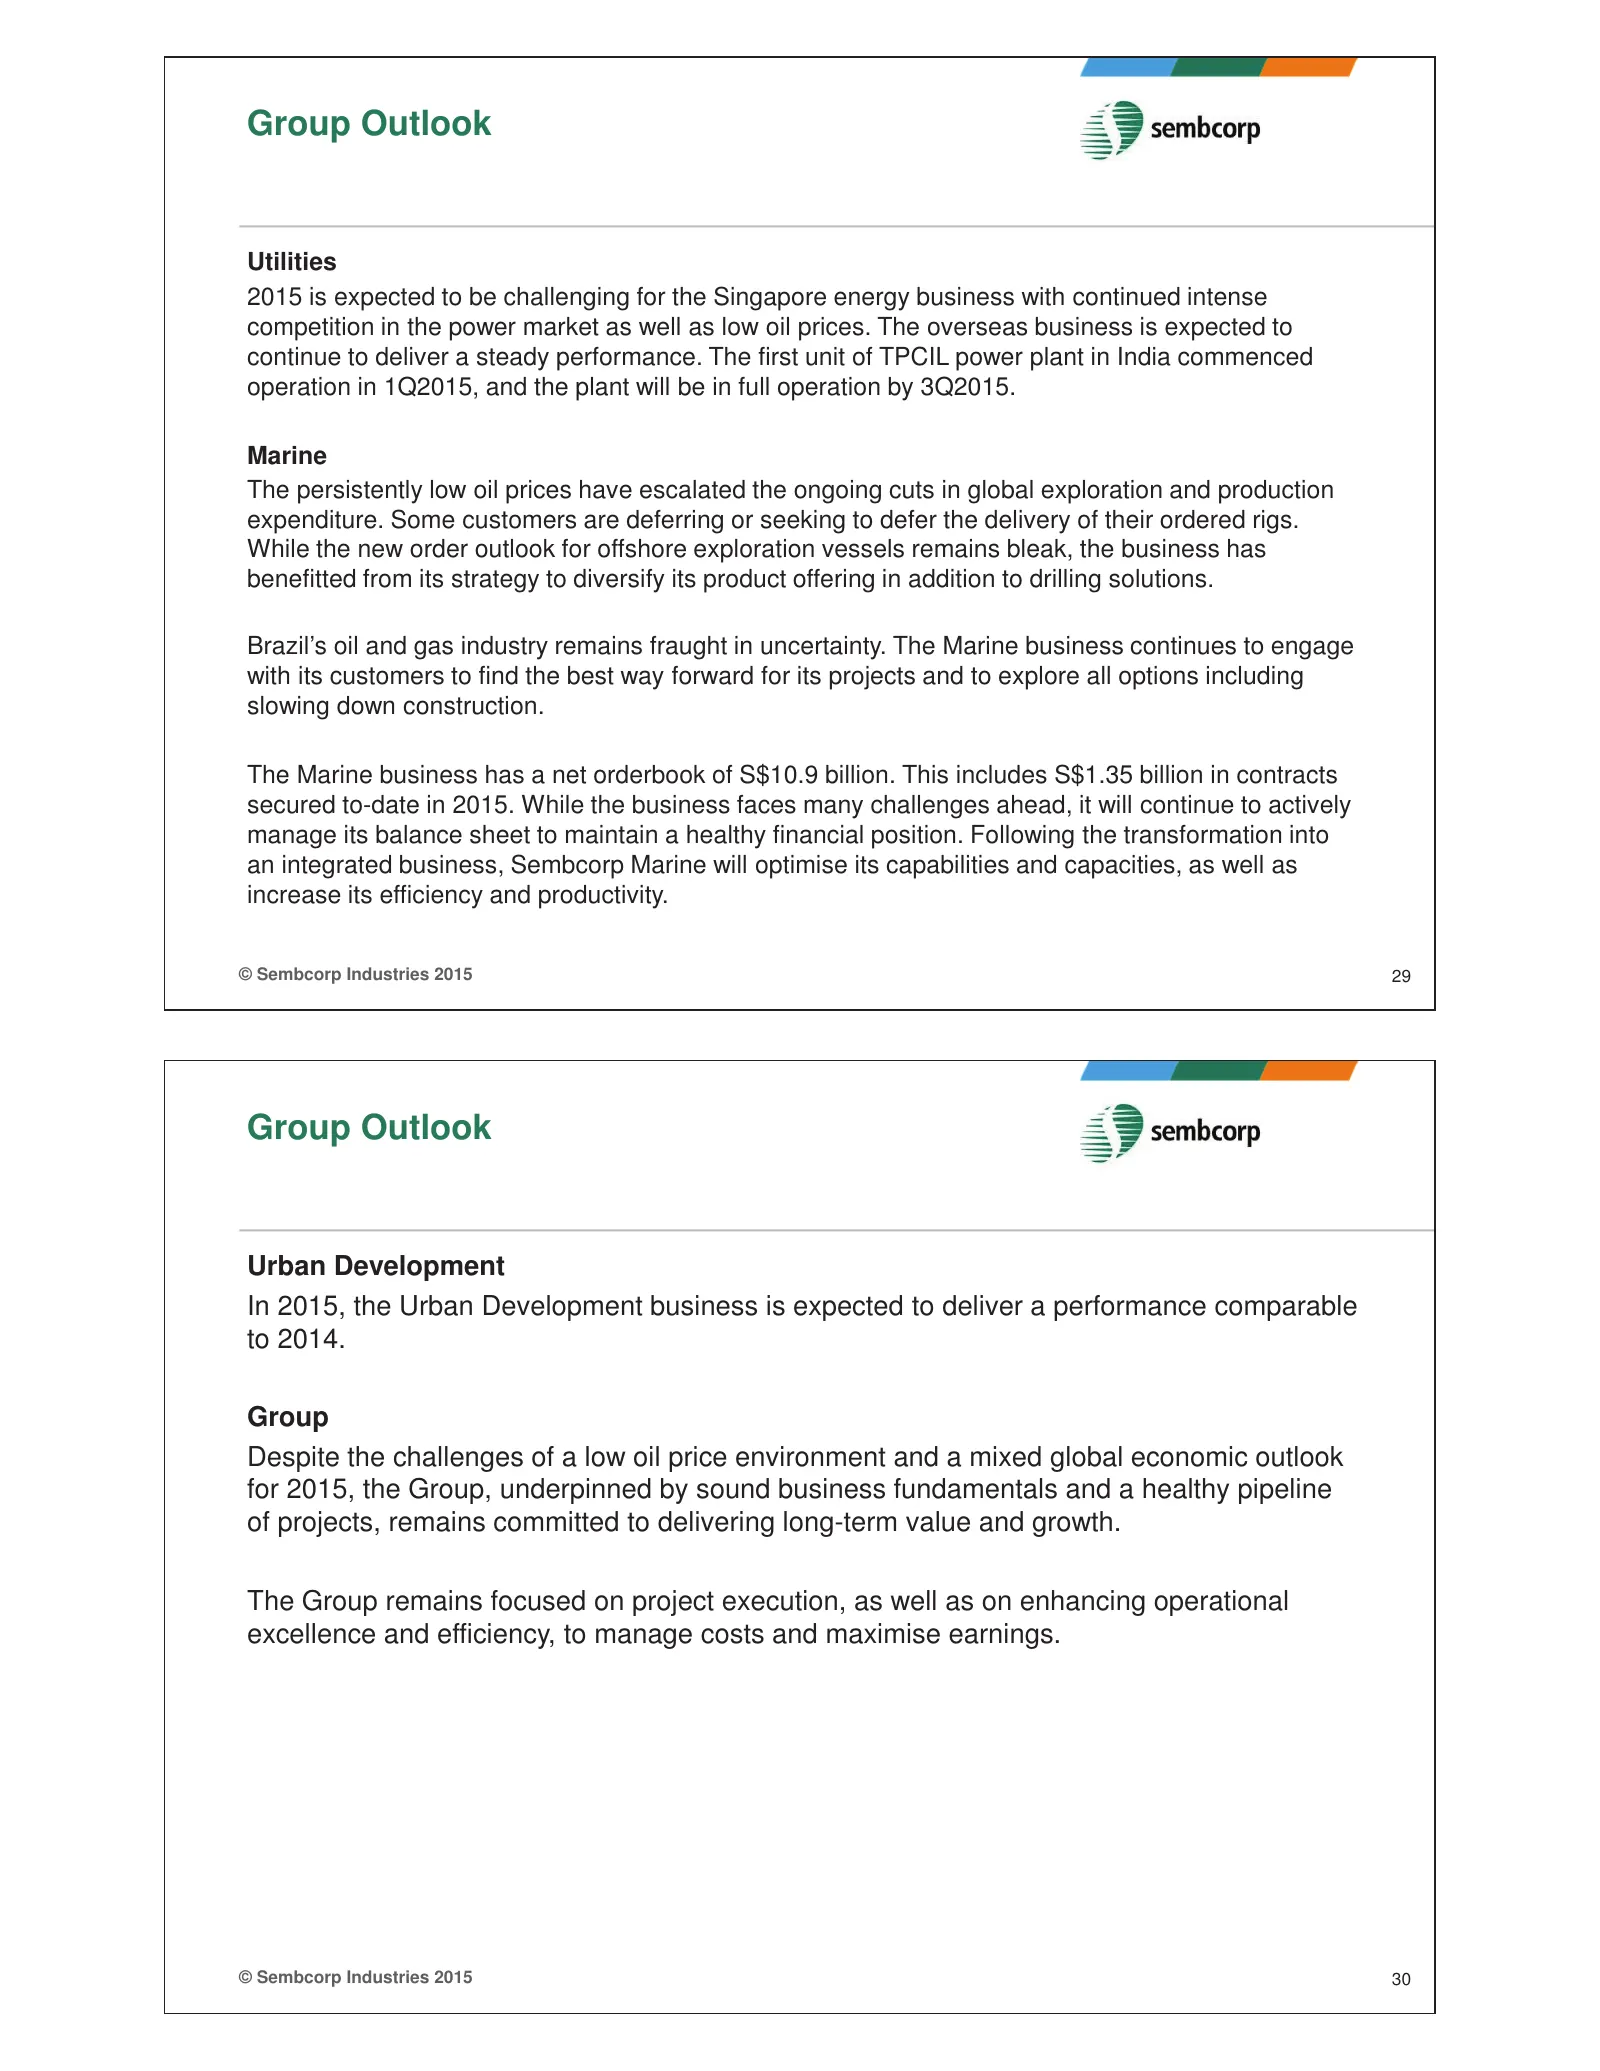
Group Outlook Utilities 2015 is expected to be challenging for the Singapore energy business with continued intense competition in the power market as well as low oil prices. The overseas business is expected to continue to deliver a steady performance. The first unit of TPCIL power plant in India c
Slide 16: Disclaimer
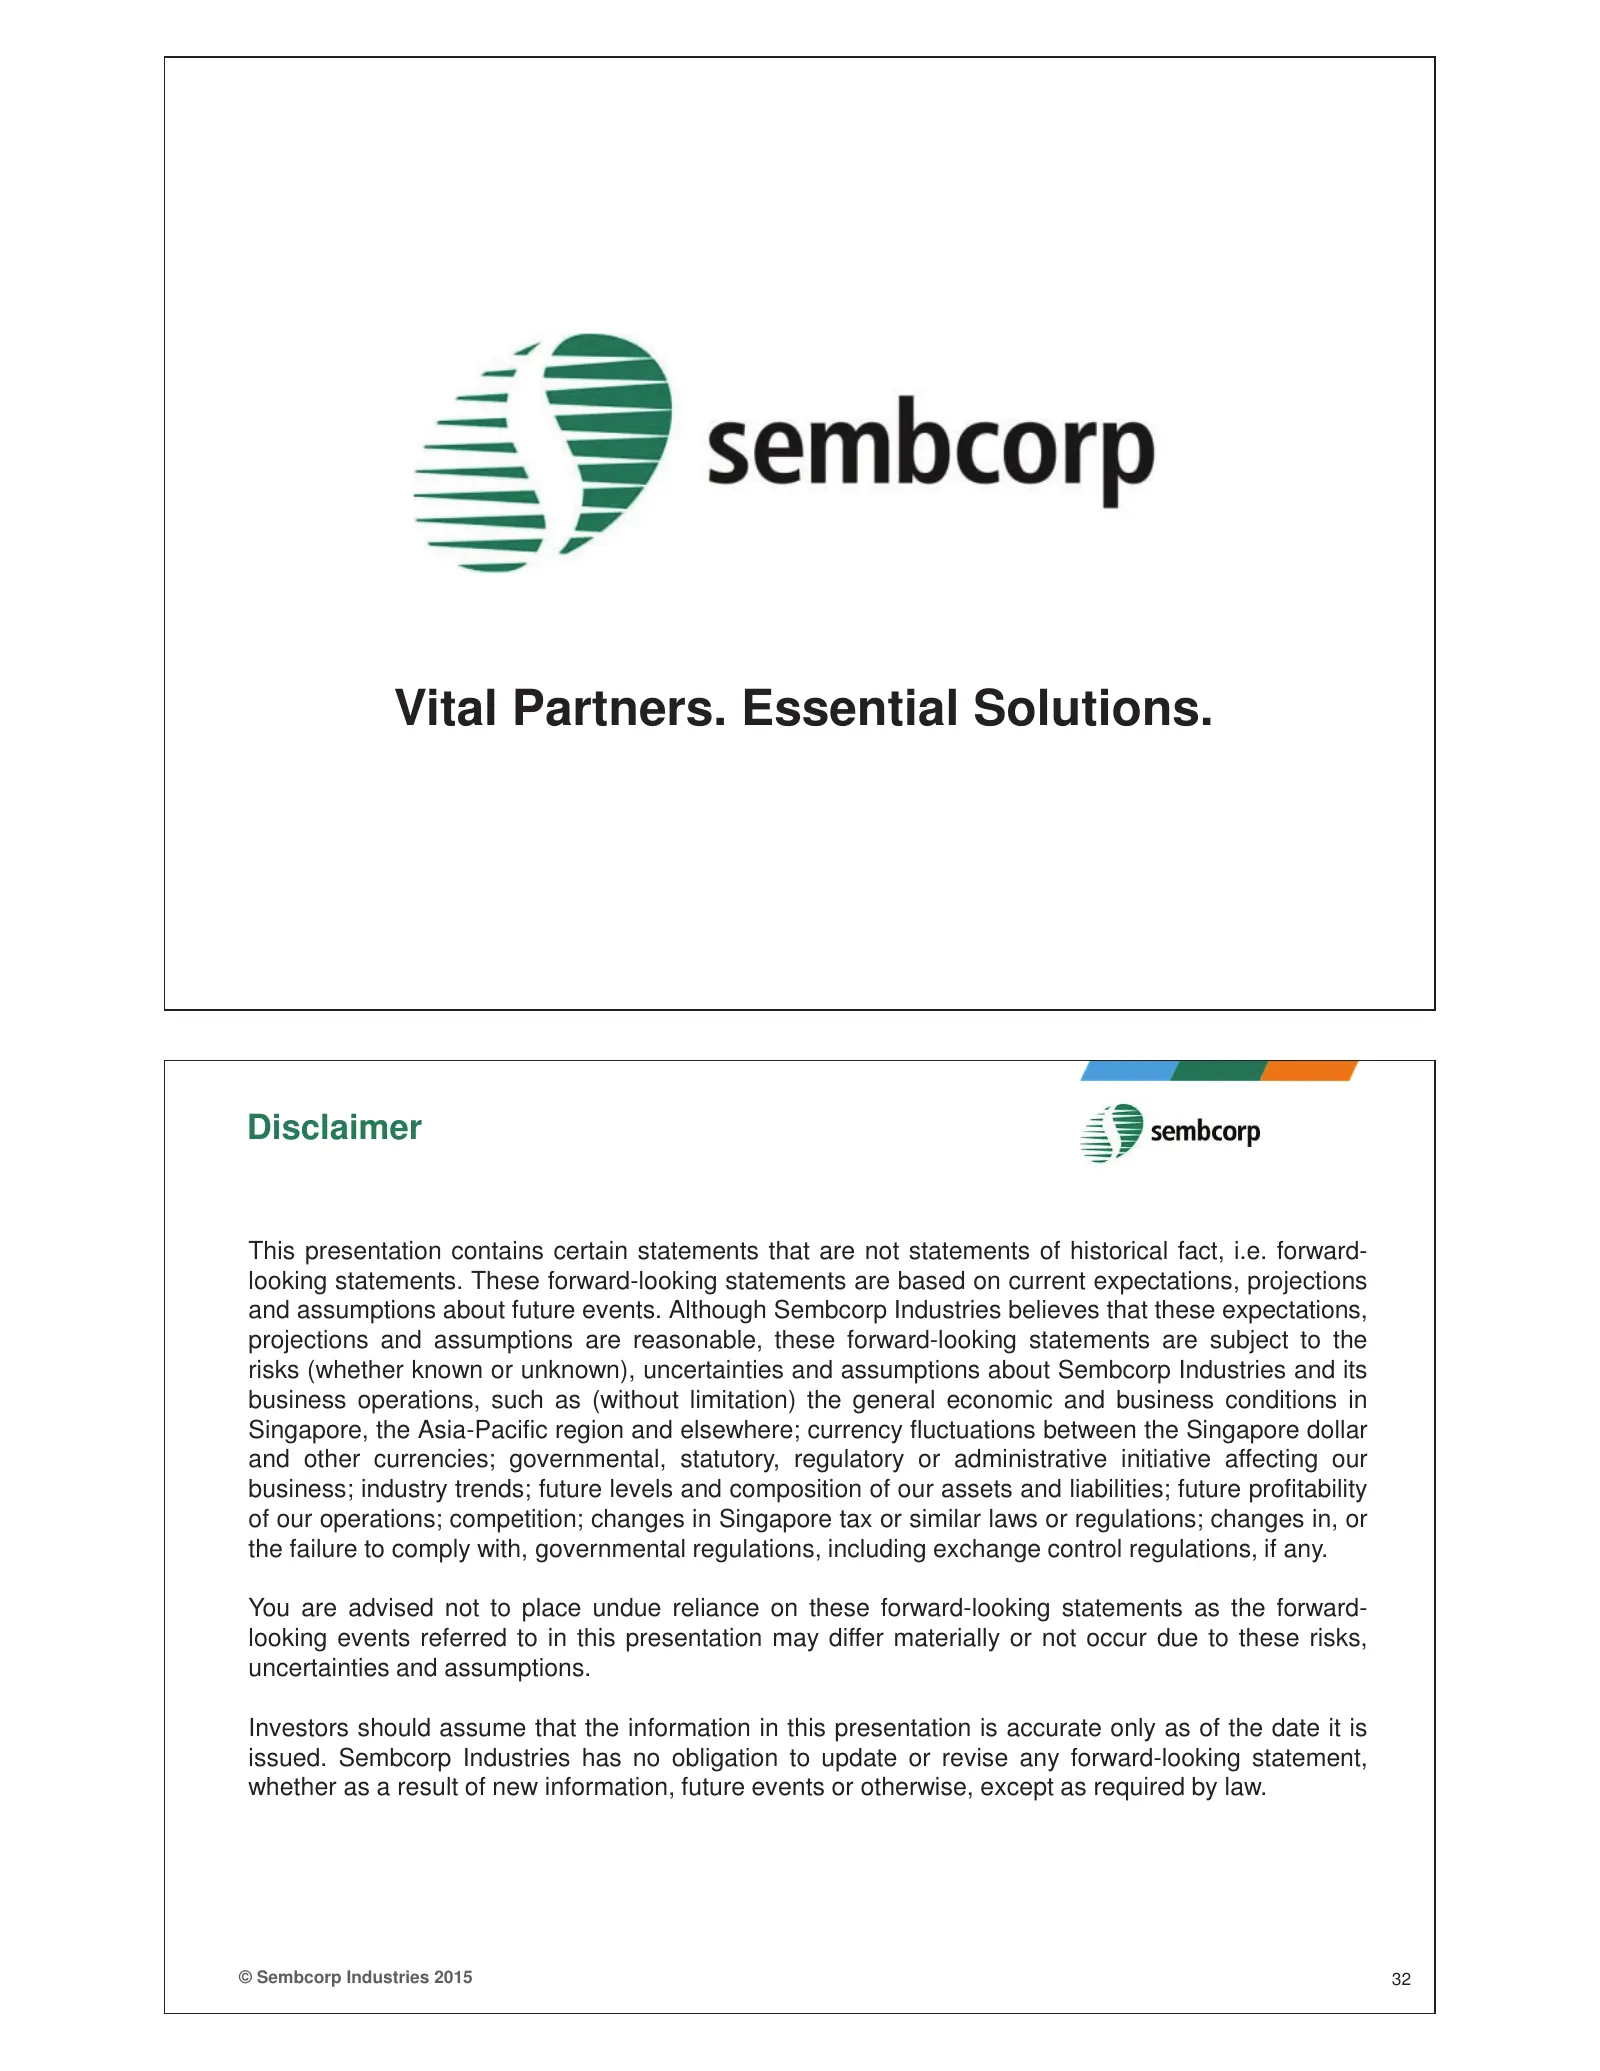
Vital Partners. Essential Solutions. Disclaimer This presentation contains certain statements that are not statements of historical fact, i.e. forward- looking statements. These forward-looking statements are based on current expectations, projections and assumptions about future events. Although Se
Slide 17: Appendix: Group Profit & Loss 2Q15
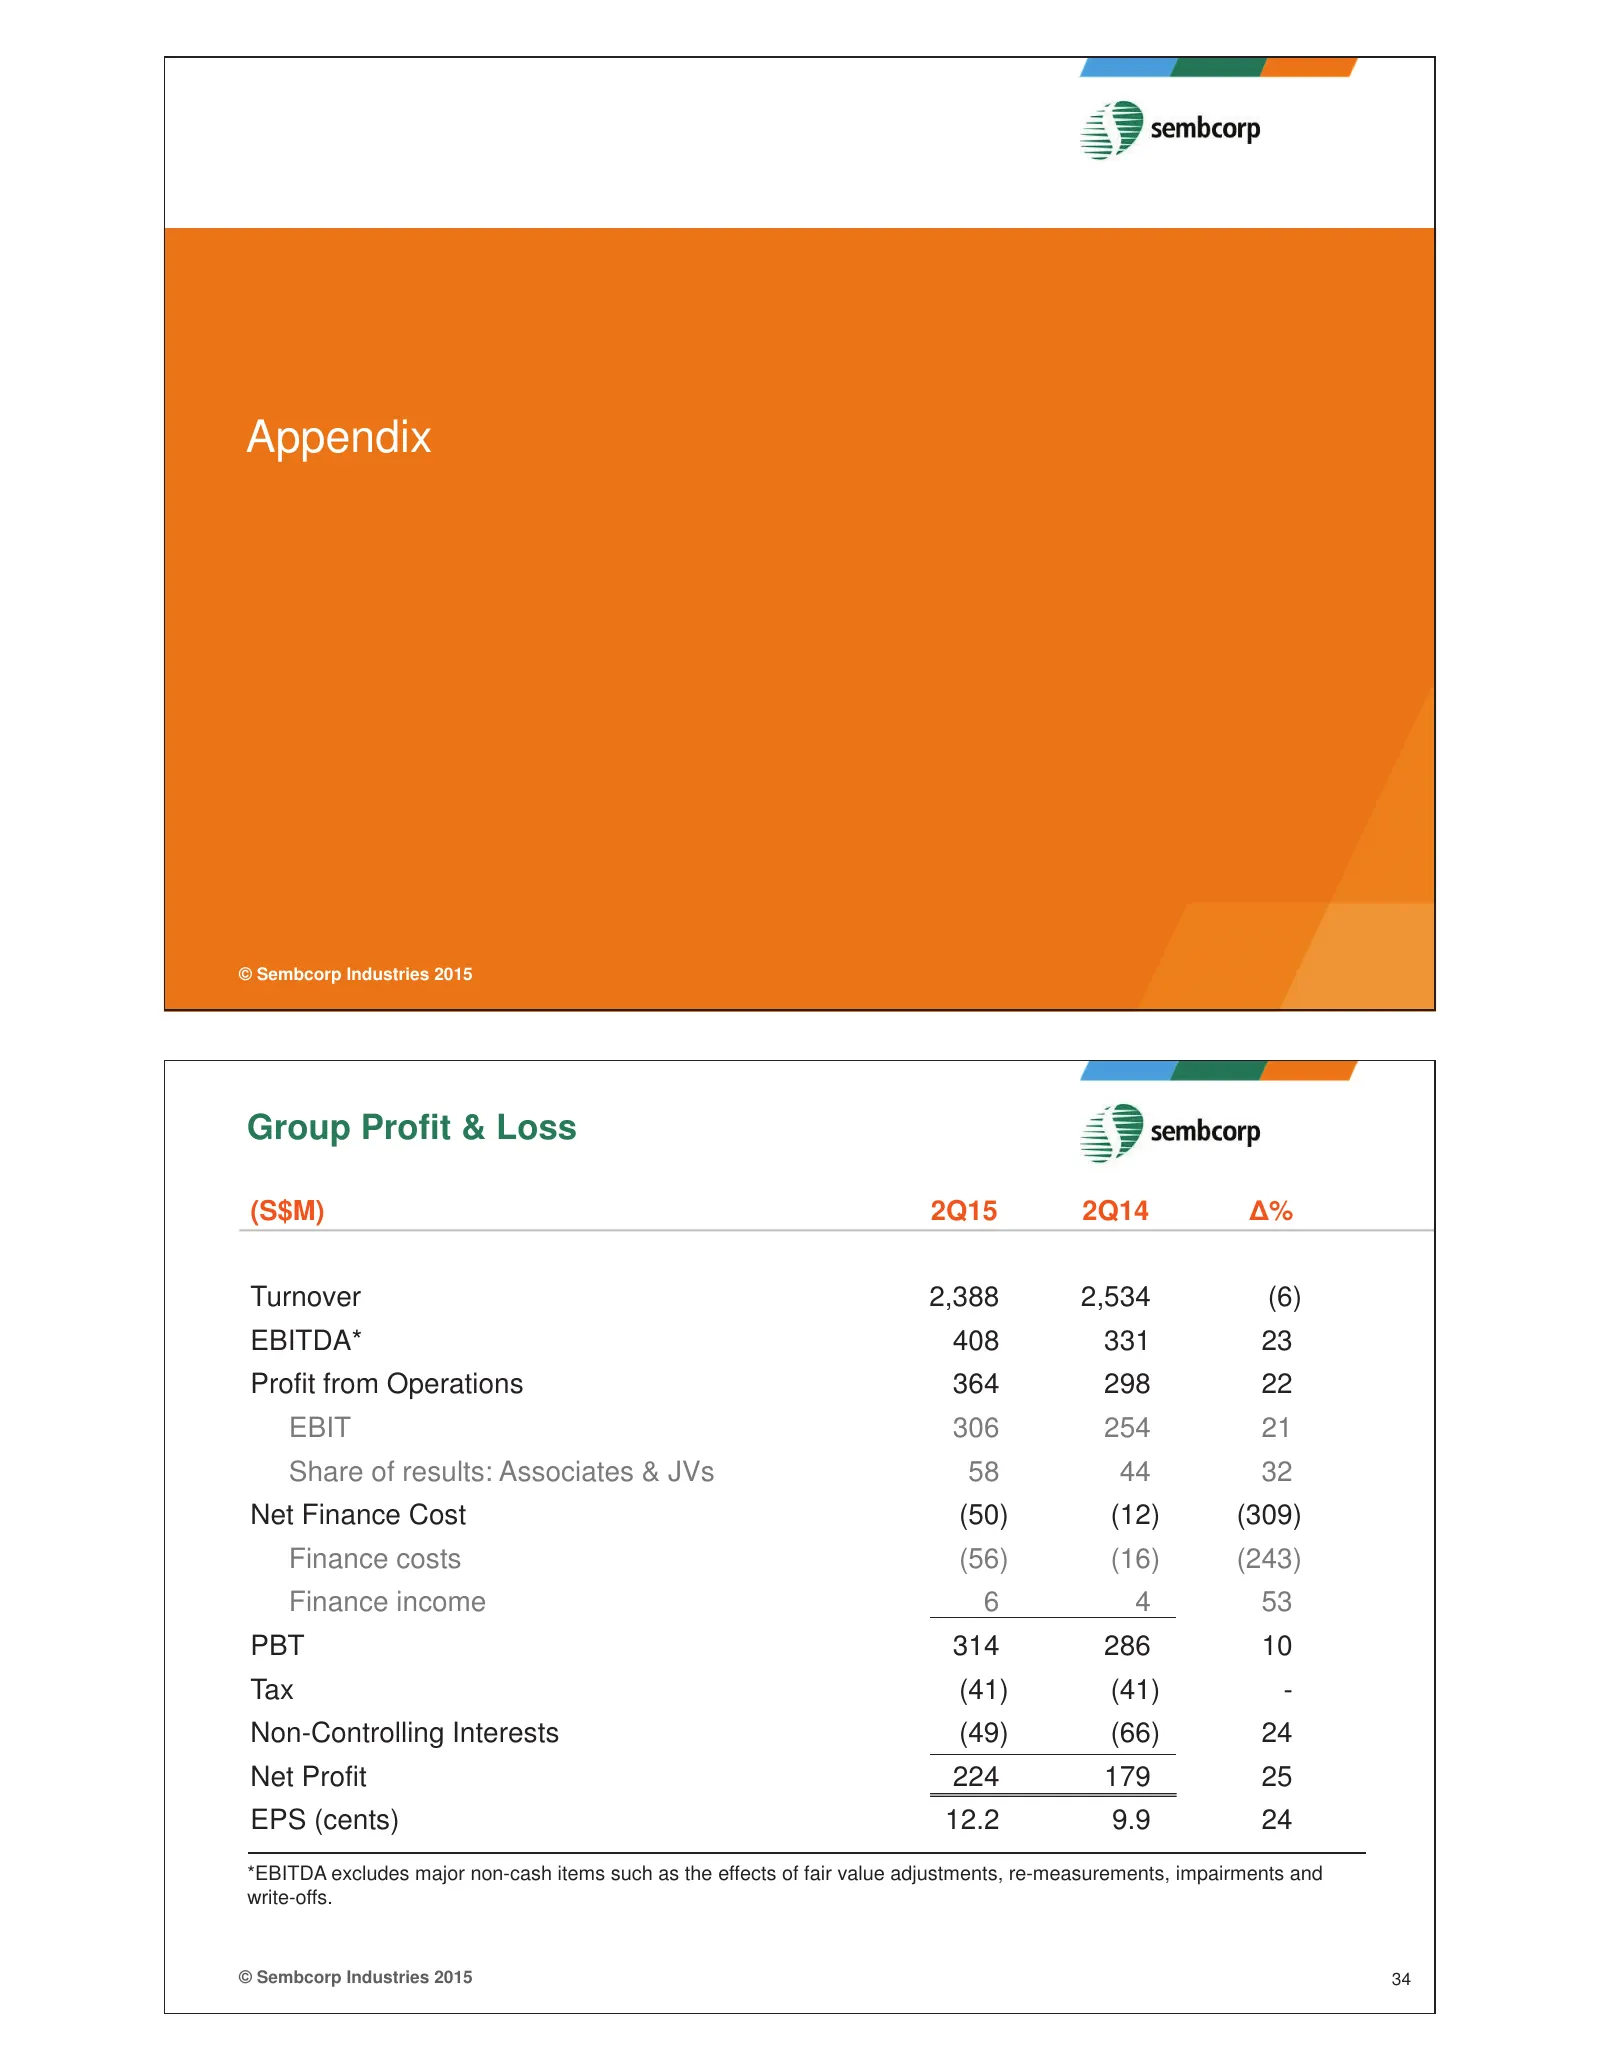
Appendix © Sembcorp Industries 2015 Group Profit & Loss (S$M) 2Q15 2Q14 ǻ% Turnover 2,388 2,534 (6) EBITDA* 408 331 23 Profit from Operations 364 298 22 EBIT 306 254 21 Share of results: Associates & JVs 58 44 32 Net Finance Cost (50) (12) (309) Finance costs (56) (16) (243) Finance income 6 4 53 PB
Slide 18: Group Turnover and Profit from Operations
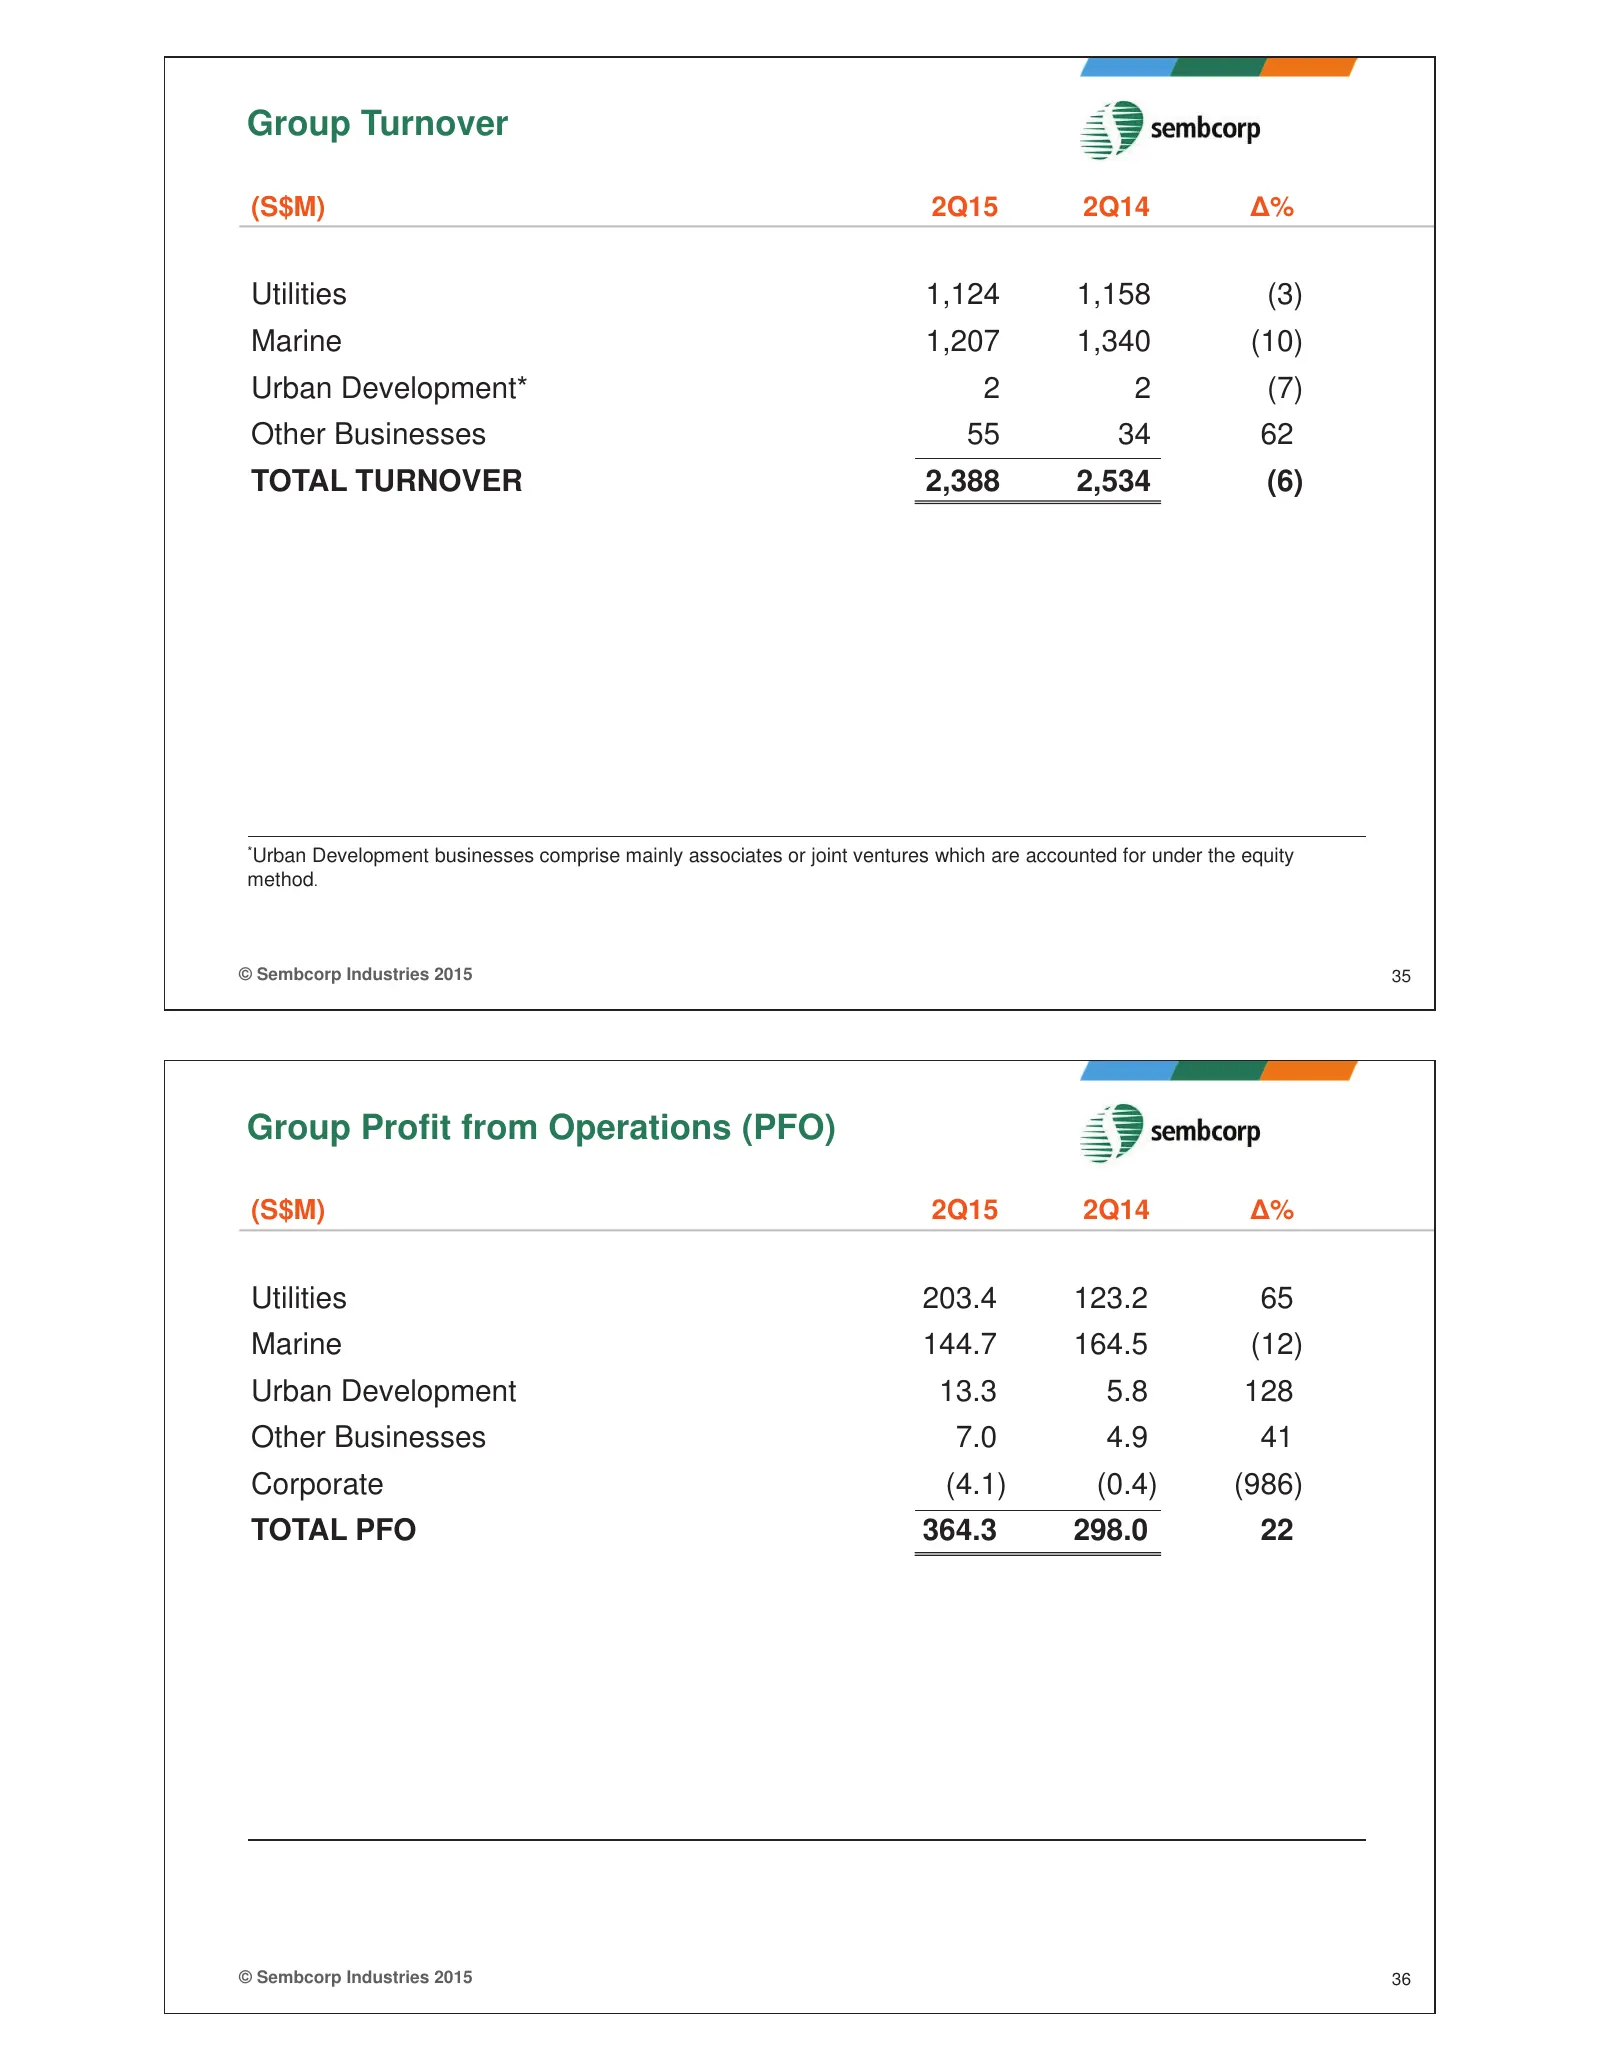
Group Turnover (S$M) 2Q15 2Q14 ǻ% Utilities 1,124 1,158 (3) Marine 1,207 1,340 (10) Urban Development* 2 2 (7) Other Businesses 55 34 62 TOTAL TURNOVER 2,388 2,534 (6) *Urban Development businesses comprise mainly associates or joint ventures which are accounted for under the equity method. © Sembco
Slide 19: Group Net Profit and Utilities Turnover
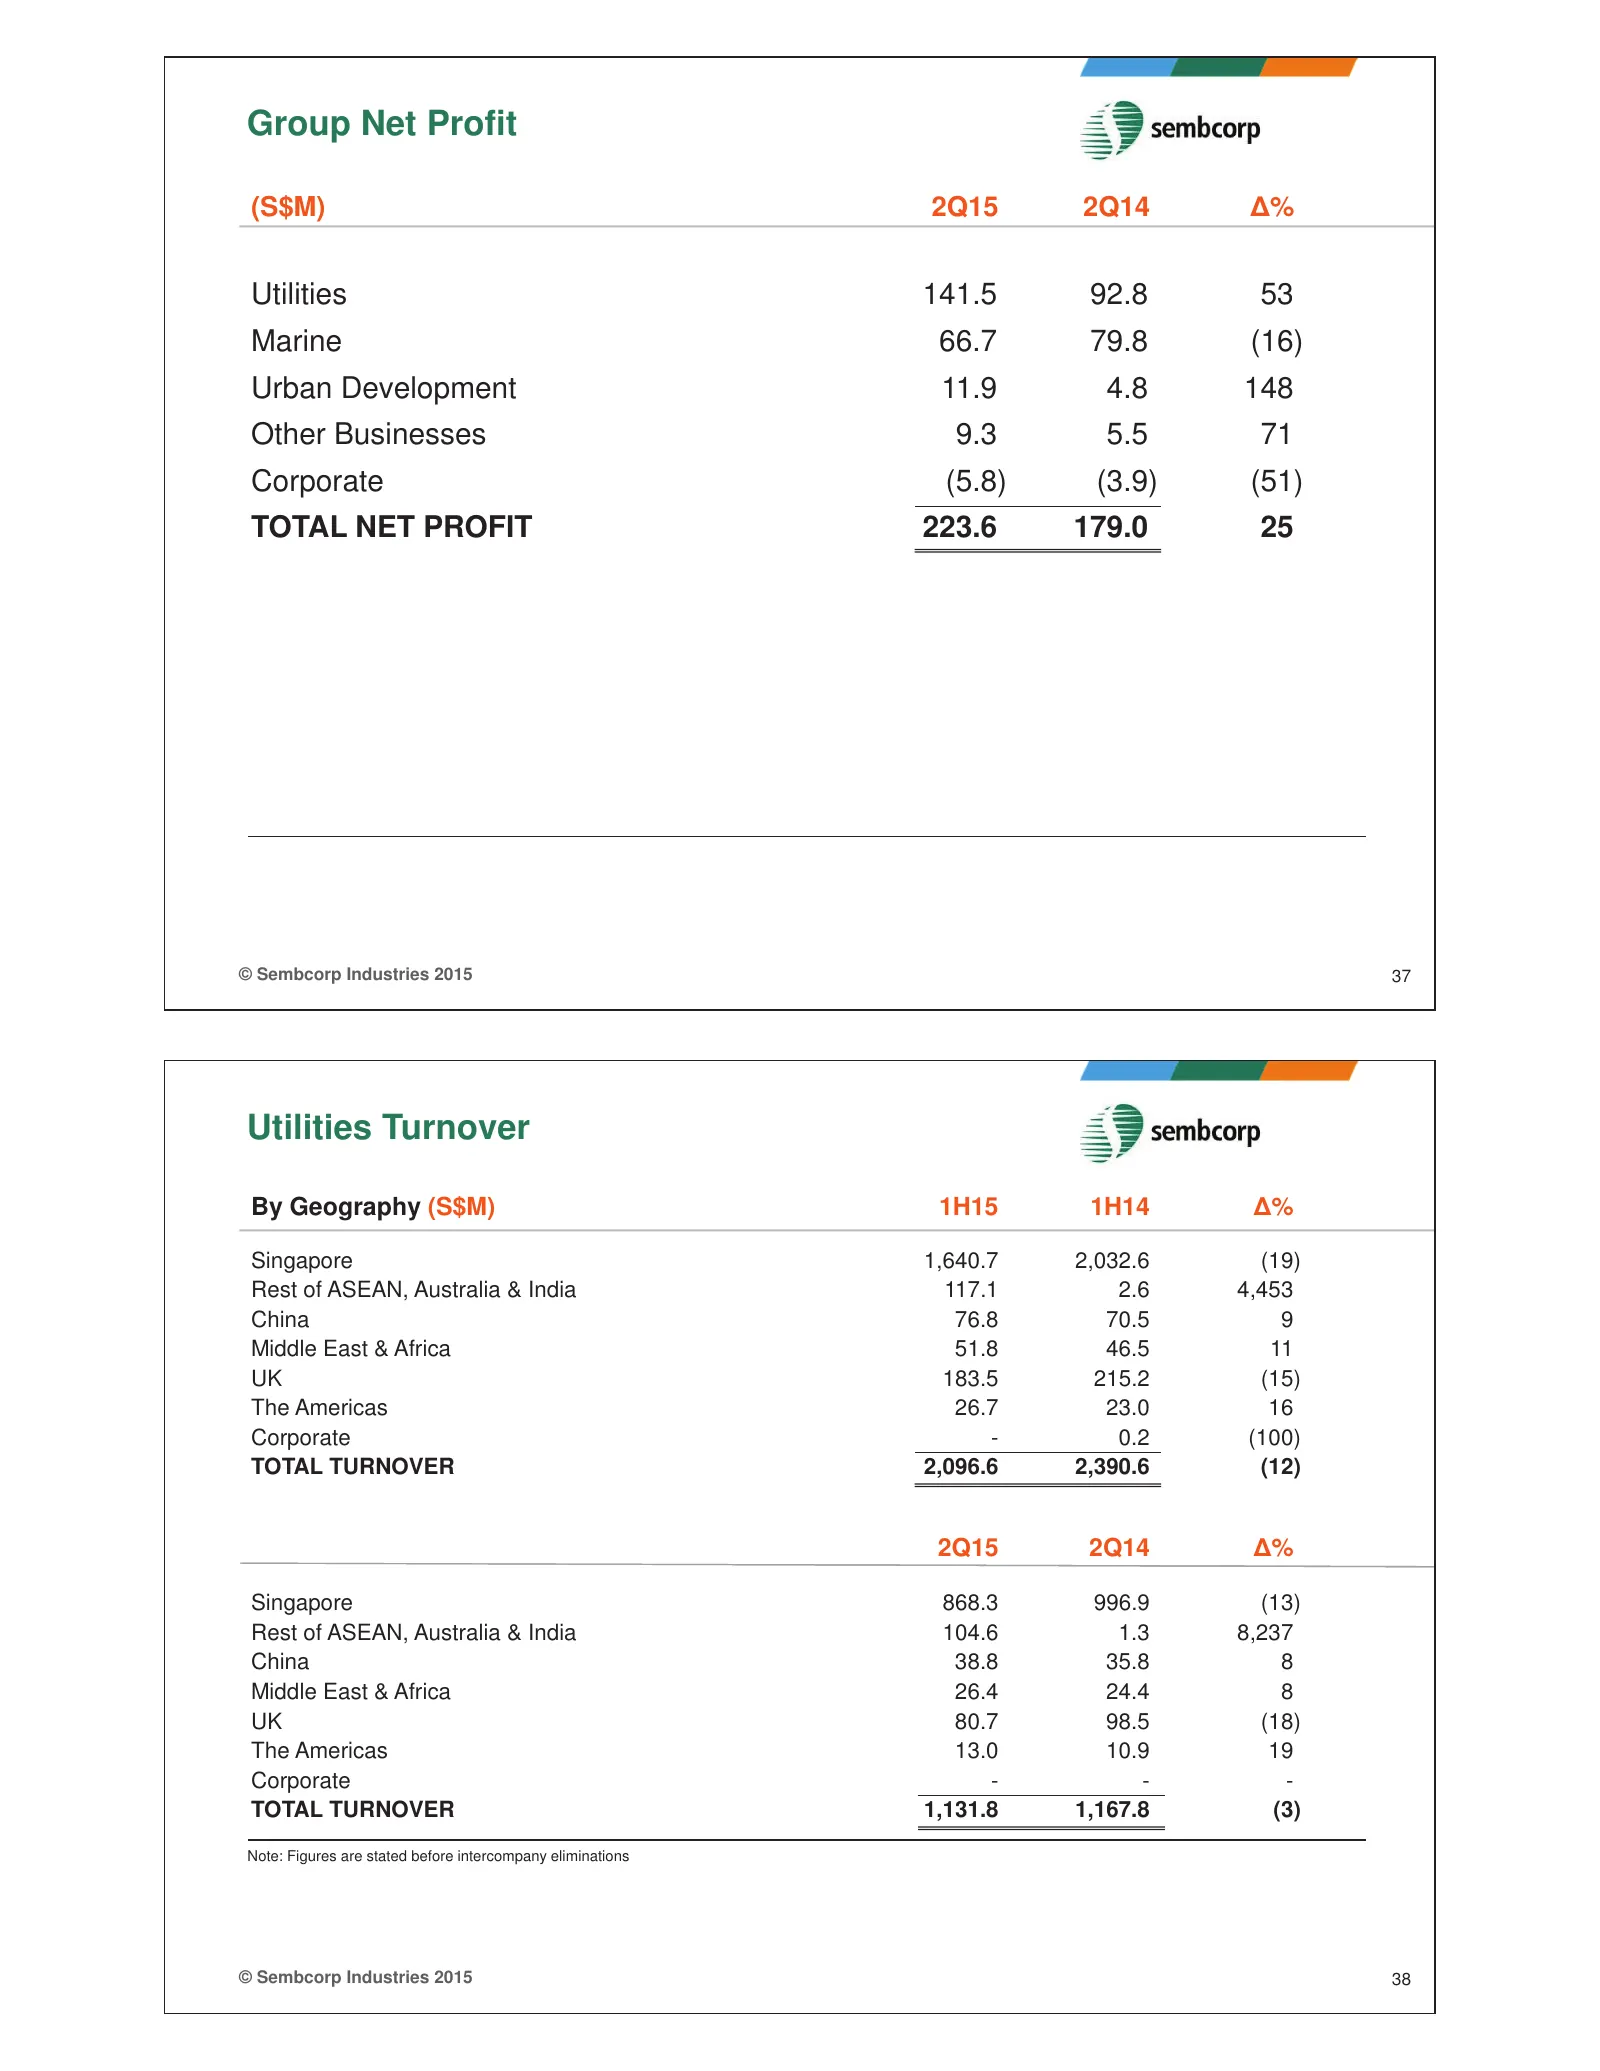
Group Net Profit (S$M) 2Q15 2Q14 ǻ% Utilities 141.5 92.8 53 Marine 66.7 79.8 (16) Urban Development 11.9 4.8 148 Other Businesses 9.3 5.5 71 Corporate (5.8) (3.9) (51) TOTAL NET PROFIT 223.6 179.0 25 © Sembcorp Industries 2015 37 Utilities Turnover By Geography (S$M) 1H15 1H14 ǻ% Singapore 1,640.7 2
Slide 20: Utilities Profit from Operations and Net Profit by Geography
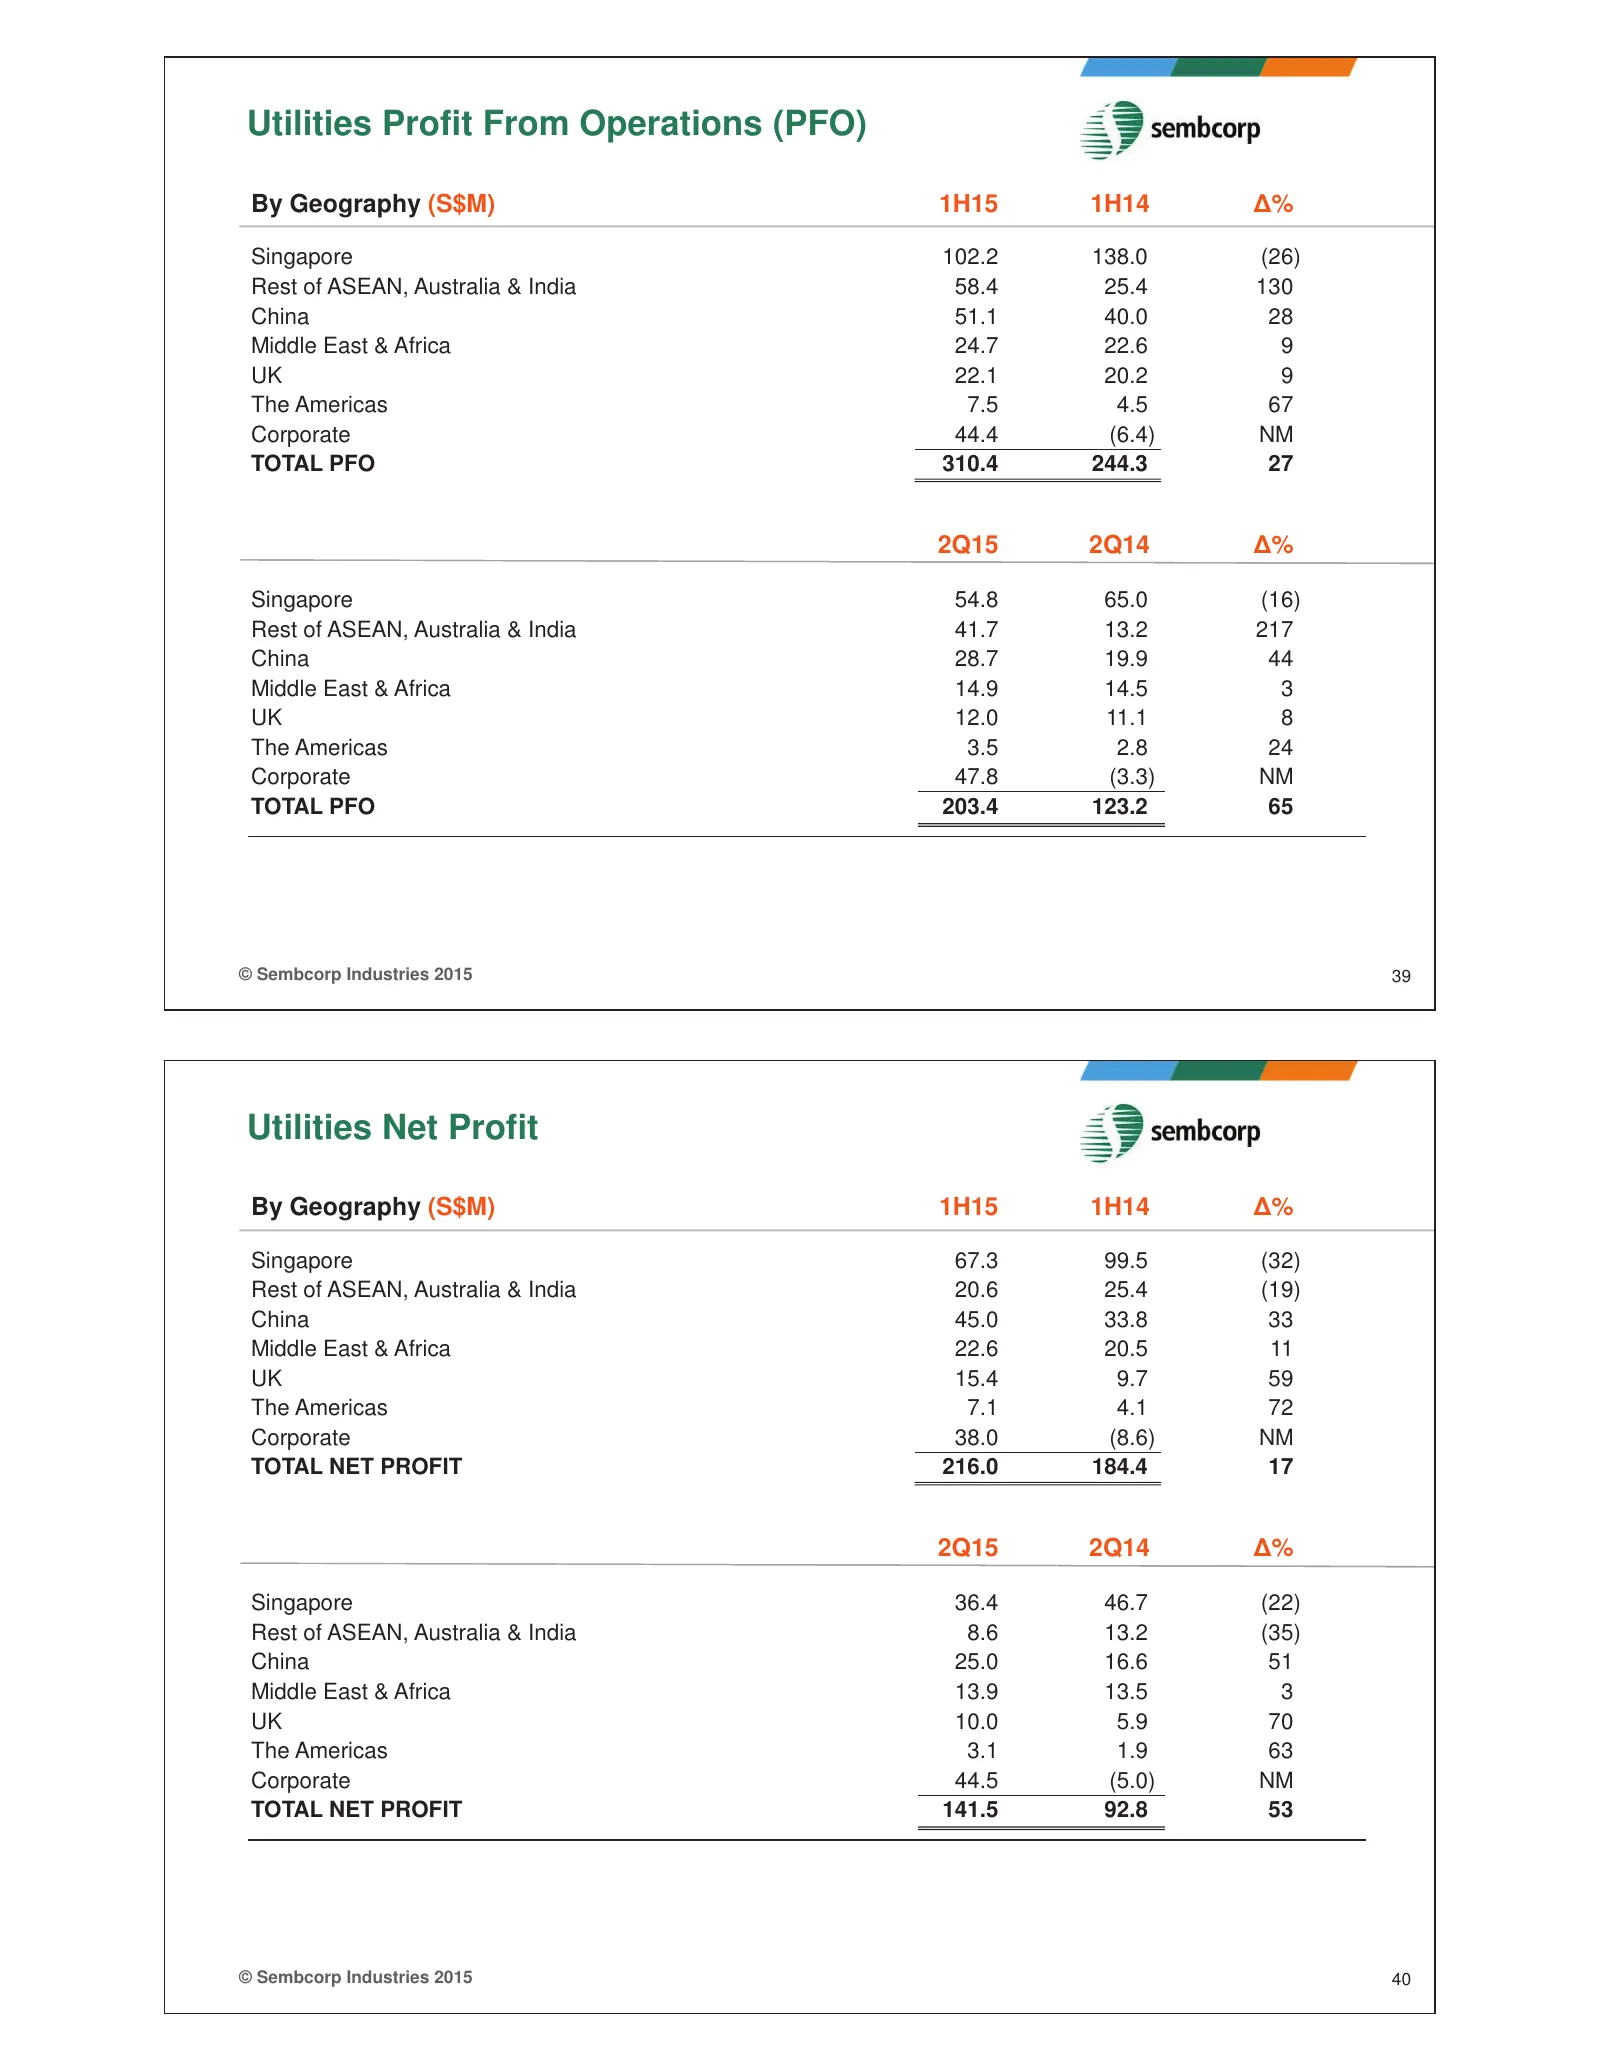
Utilities Profit From Operations (PFO) By Geography (S$M) 1H15 1H14 ǻ% Singapore 102.2 138.0 (26) Rest of ASEAN, Australia & India 58.4 25.4 130 China 51.1 40.0 28 Middle East & Africa 24.7 22.6 9 UK 22.1 20.2 9 The Americas 7.5 4.5 67 Corporate 44.4 (6.4) NM TOTAL PFO 310.4 244.3 27 2Q15 2Q14 ǻ% Si
Slide 21: Utilities Turnover and PFO by Product Segment
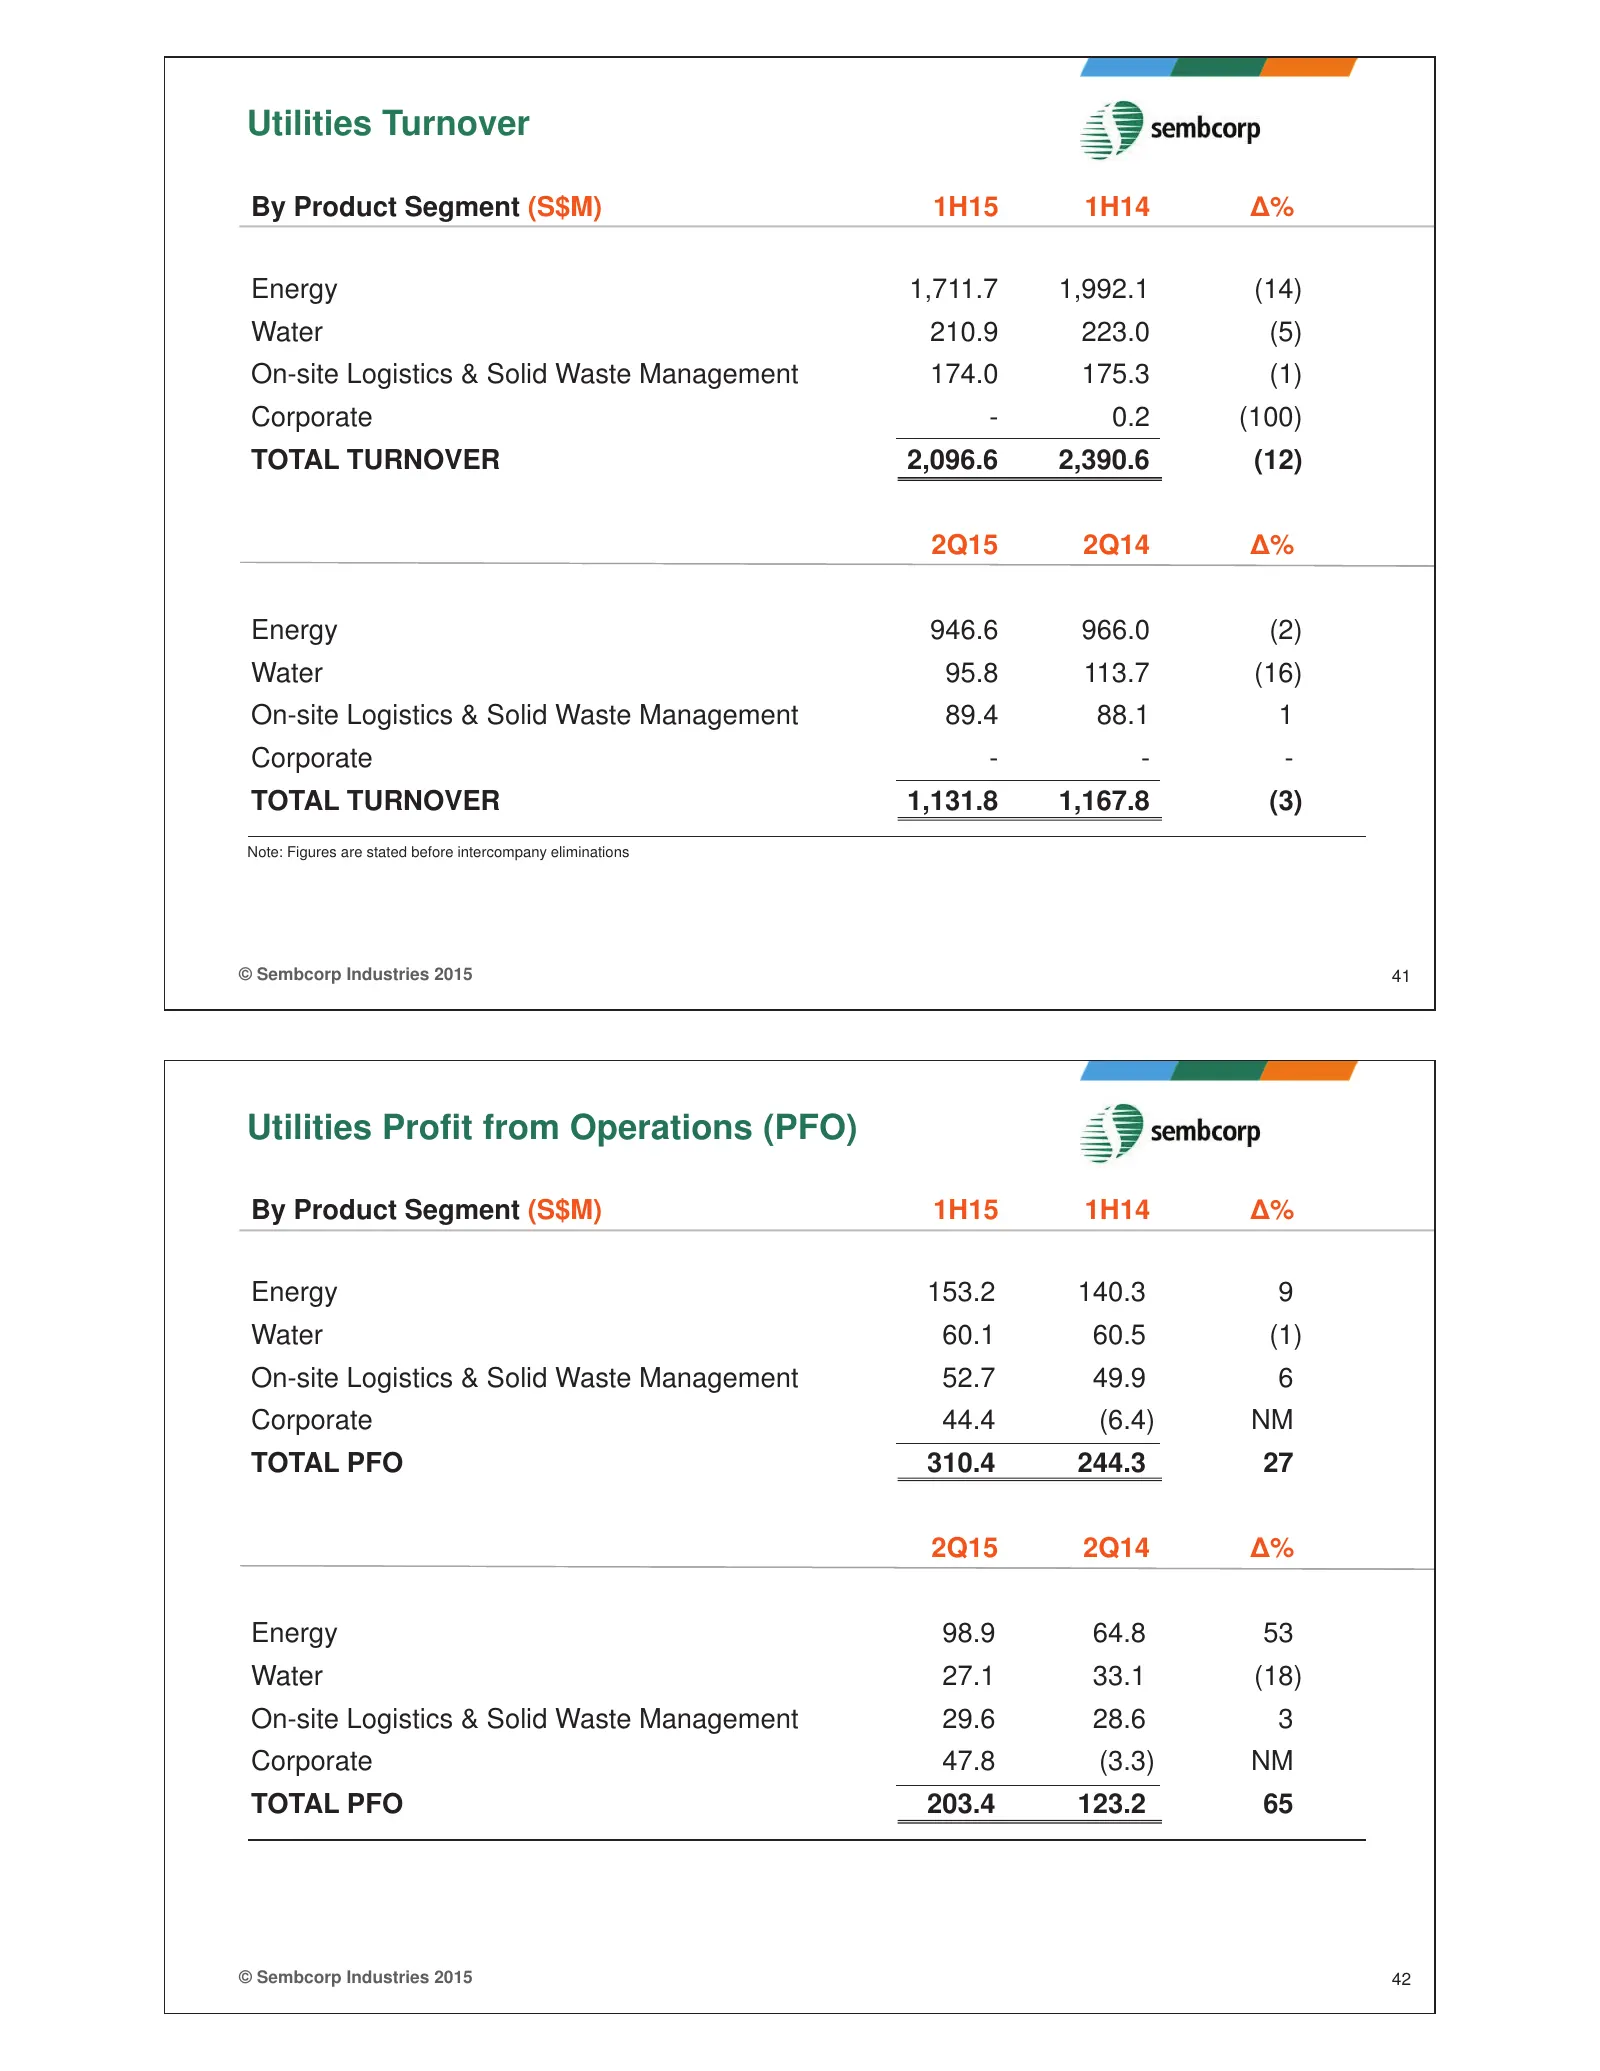
Utilities Turnover By Product Segment (S$M) 1H15 1H14 ǻ% Energy 1,711.7 1,992.1 (14) Water 210.9 223.0 (5) On-site Logistics & Solid Waste Management 174.0 175.3 (1) Corporate - 0.2 (100) TOTAL TURNOVER 2,096.6 2,390.6 (12) 2Q15 2Q14 ǻ% Energy 946.6 966.0 (2) Water 95.8 113.7 (16) On-site Logistics
Slide 22: Utilities Net Profit by Product Segment
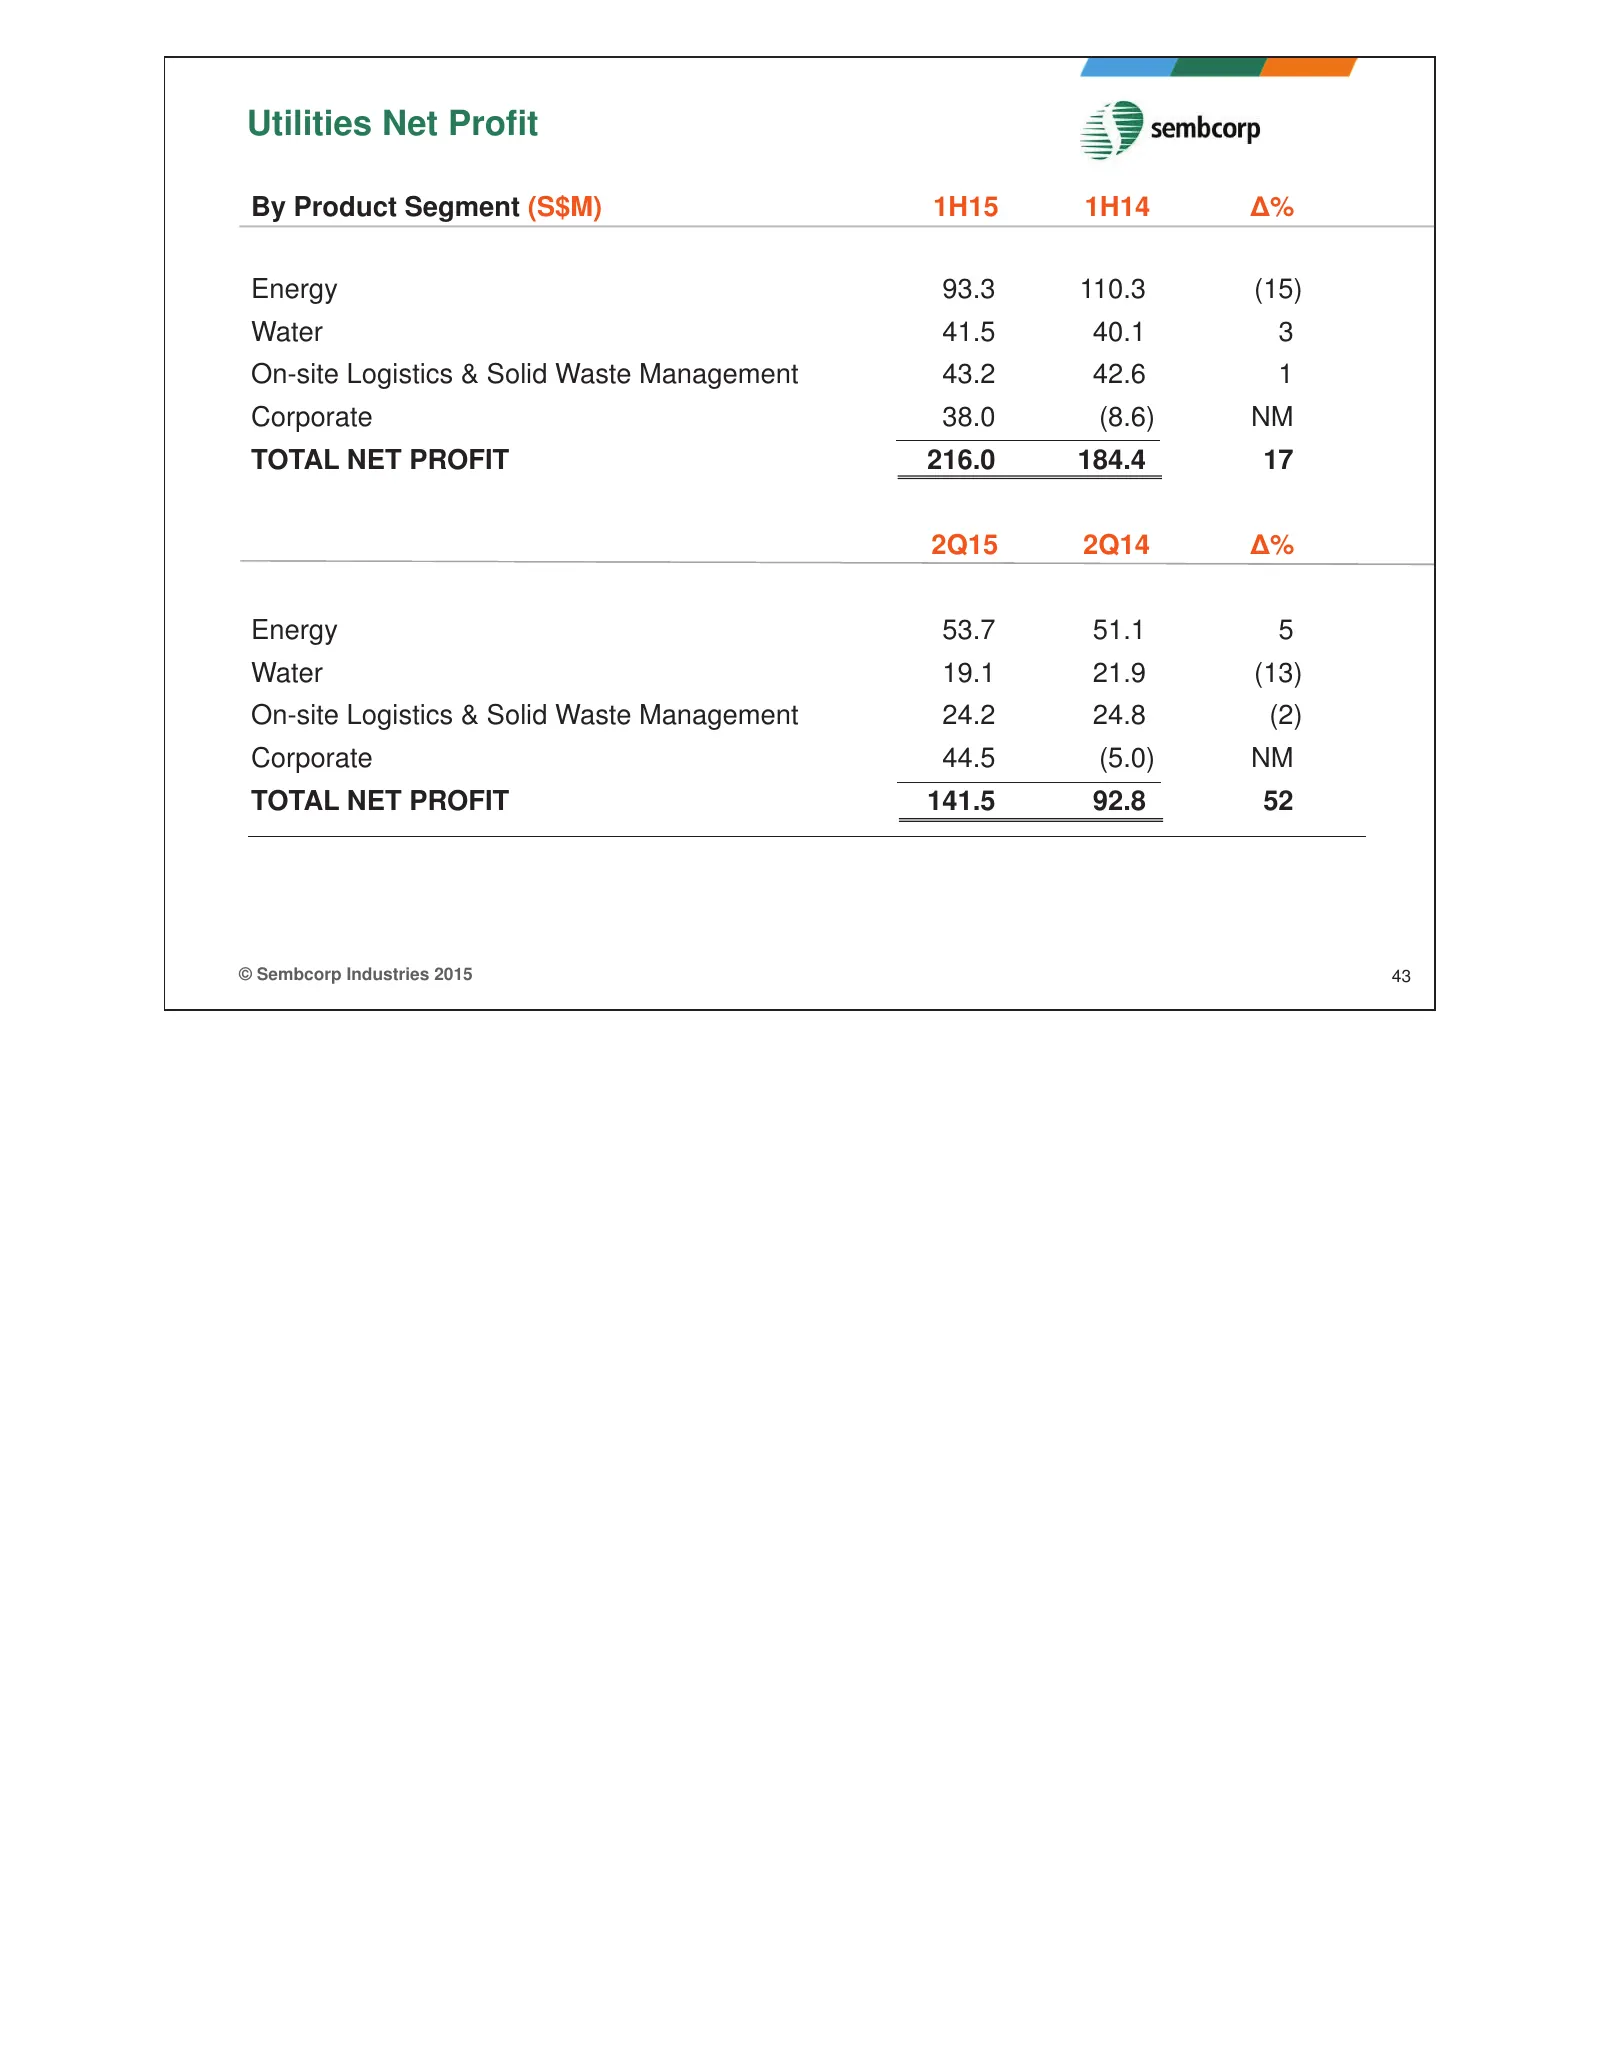
Utilities Net Profit By Product Segment (S$M) 1H15 1H14 ǻ% Energy 93.3 110.3 (15) Water 41.5 40.1 3 On-site Logistics & Solid Waste Management 43.2 42.6 1 Corporate 38.0 (8.6) NM TOTAL NET PROFIT 216.0 184.4 17 2Q15 2Q14 ǻ% Energy 53.7 51.1 5 Water 19.1 21.9 (13) On-site Logistics & Solid Waste Mana
Source: Internet Archive copy of sembcorp.com
More decks from Sembcorp Industries Ltd.
 H1 2026 Earnings Presentation26 slides · Aug 13, 2026
 Investor Presentation (June 2026)52 slides · June 2026
 Shareholder Meeting (April 2026)11 slides · Apr 29, 2026
 FY2025 Earnings Presentation35 slides · Feb 25, 2026
 Merger or Acquisition (January 2026)13 slides · Jan 30, 2026
 Merger or Acquisition (December 2025)24 slides · Dec 11, 2025