Spirit Realty Capital — Investor Presentation (September 2018)
31 slides from Spirit Realty Capital's investor presentation, Sep 10, 2018

Slide 1: Investor Presentation September 2018
Investor Presentation SEPTEMBER 2018
Slide 2: Disclaimer
Disclaimer This presentation contains forward-looking statements within the meaning of the Private Securities Litigation Reform Act of 1995 and other federal securities laws. These forward-looking statements can be identified by the use of words such as “expect,” “plan,” "will," “estimate,” “project
Slide 3: Snapshot
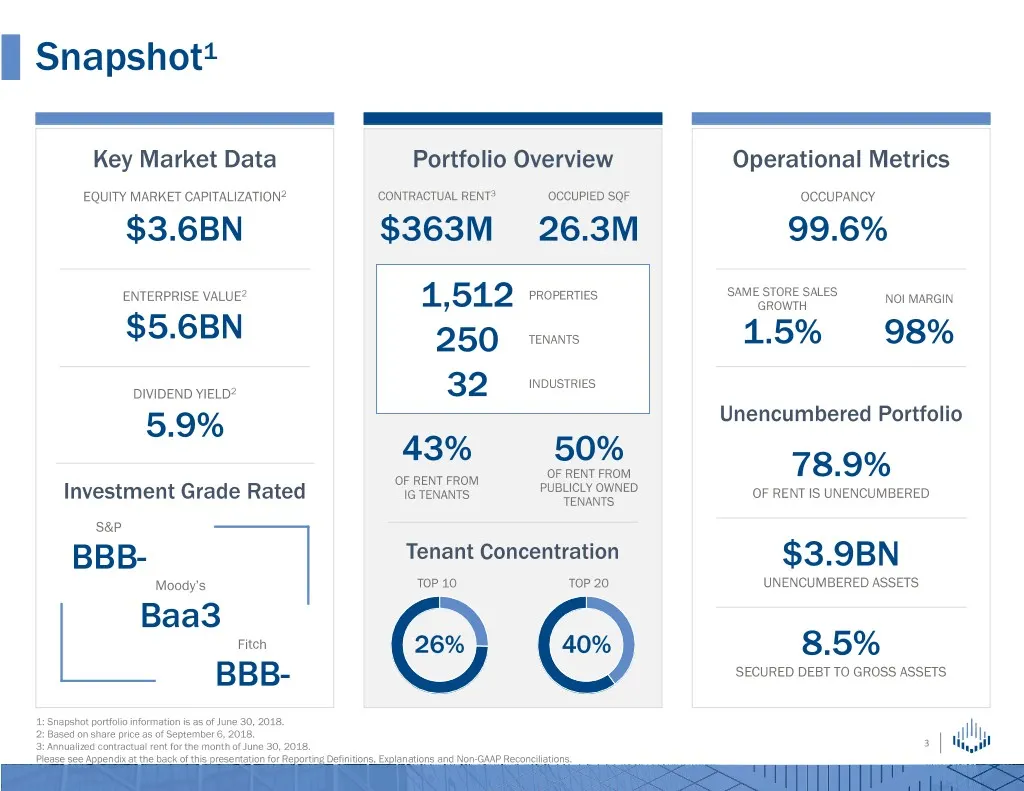
Snapshot1 Key Market Data Portfolio Overview Operational Metrics EQUITY MARKET CAPITALIZATION2 CONTRACTUAL RENT3 OCCUPIED SQF OCCUPANCY $3.6BN $363M 26.3M 99.6% 2 SAME STORE SALES ENTERPRISE VALUE PROPERTIES NOI MARGIN 1,512 GROWTH $5.6BN 250 TENANTS 1.5% 98% INDUSTRIES DIVIDEND YIELD2 32 5.9% Unenc
Slide 4: Strategy
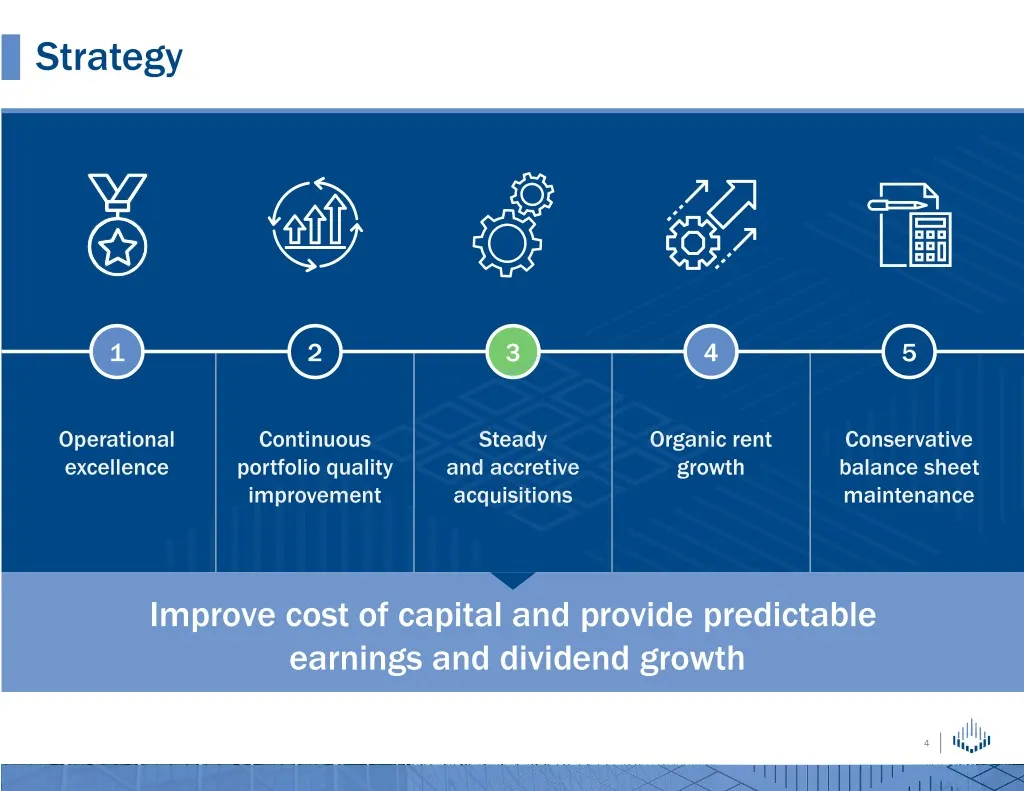
Strategy 1 2 3 4 5 Operational Continuous Steady Organic rent Conservative excellence portfolio quality and accretive growth balance sheet improvement acquisitions maintenance Improve cost of capital and provide predictable earnings and dividend growth 4
Slide 5: Operational Platform
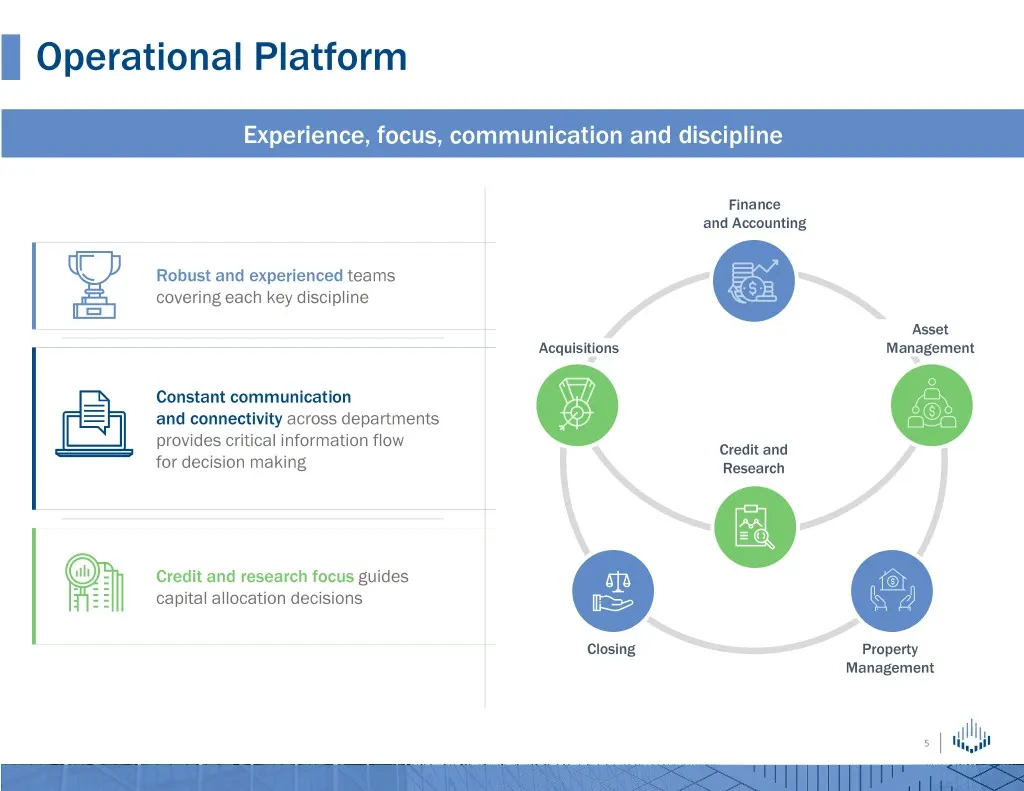
Operational Platform Experience, focus, communication and discipline Finance and Accounting Robust and experienced teams covering each key discipline Asset Acquisitions Management Constant communication and connectivity across departments provides critical information flow Credit and for decision ma
Slide 6: Asset Allocation Tools
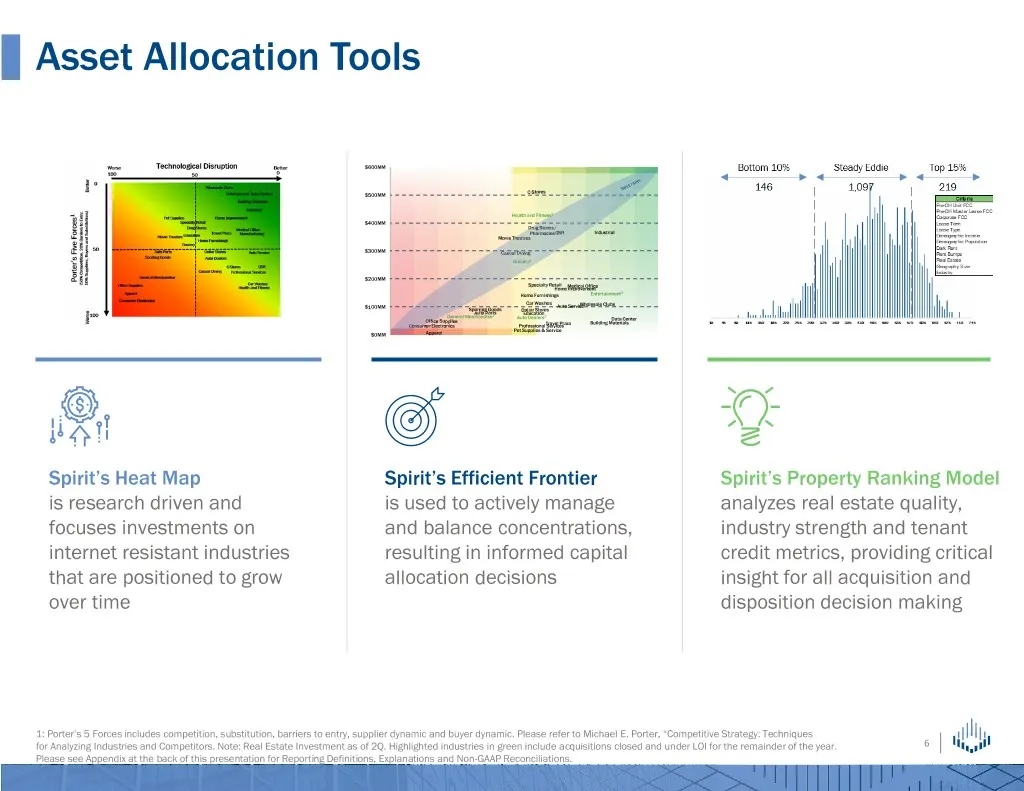
Asset Allocation Tools $600MM C-Stores $500MM Health and Fitness2 $400MM Drug Stores / PharmaciesQSR Industrial Movie Theatres $300MM Casual Dining Grocery2 $200MM Specialty Retail Medical Office Home Improvement 2 Home Furnishings Entertainment Car Washes Wholesale Clubs $100MM Auto Service Sportin
Slide 7: Portfolio Transformation
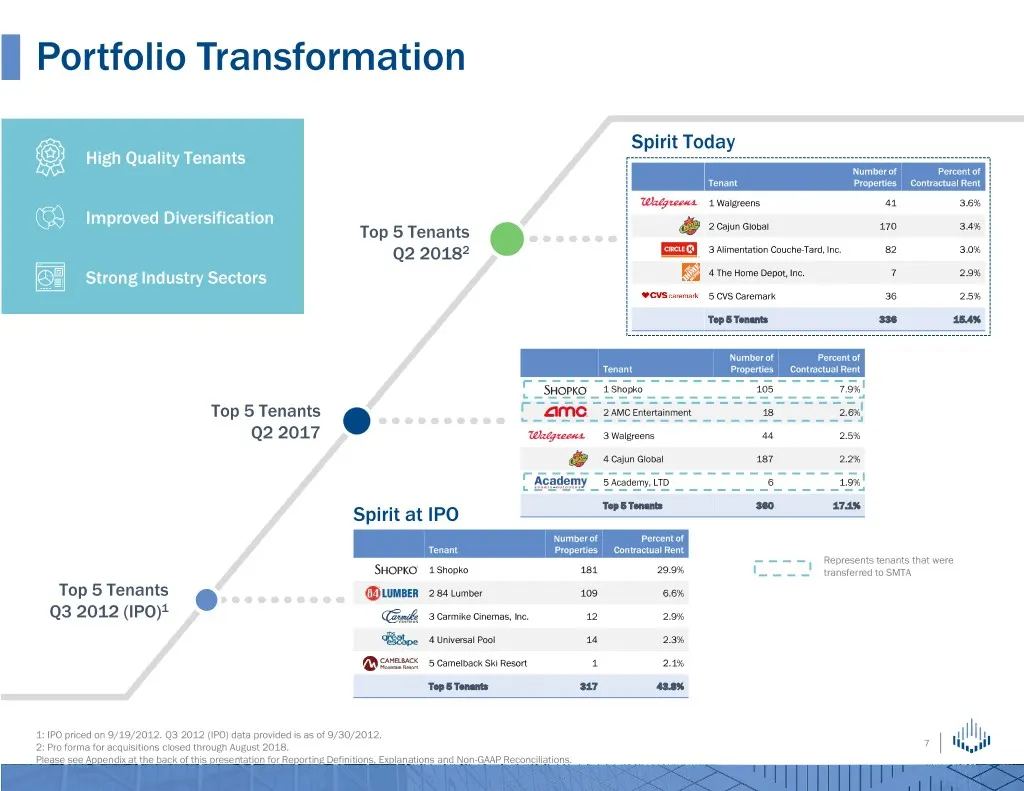
Portfolio Transformation Spirit Today High Quality Tenants Number of Percent of Tenant Properties Contractual Rent 1 Walgreens 41 3.6% Improved Diversification Top 5 Tenants 2 Cajun Global 170 3.4% Q2 20182 3 Alimentation Couche-Tard, Inc. 82 3.0% Strong Industry Sectors 4 The Home Depot, Inc. 7 2.9
Slide 8: Fortress Portfolio
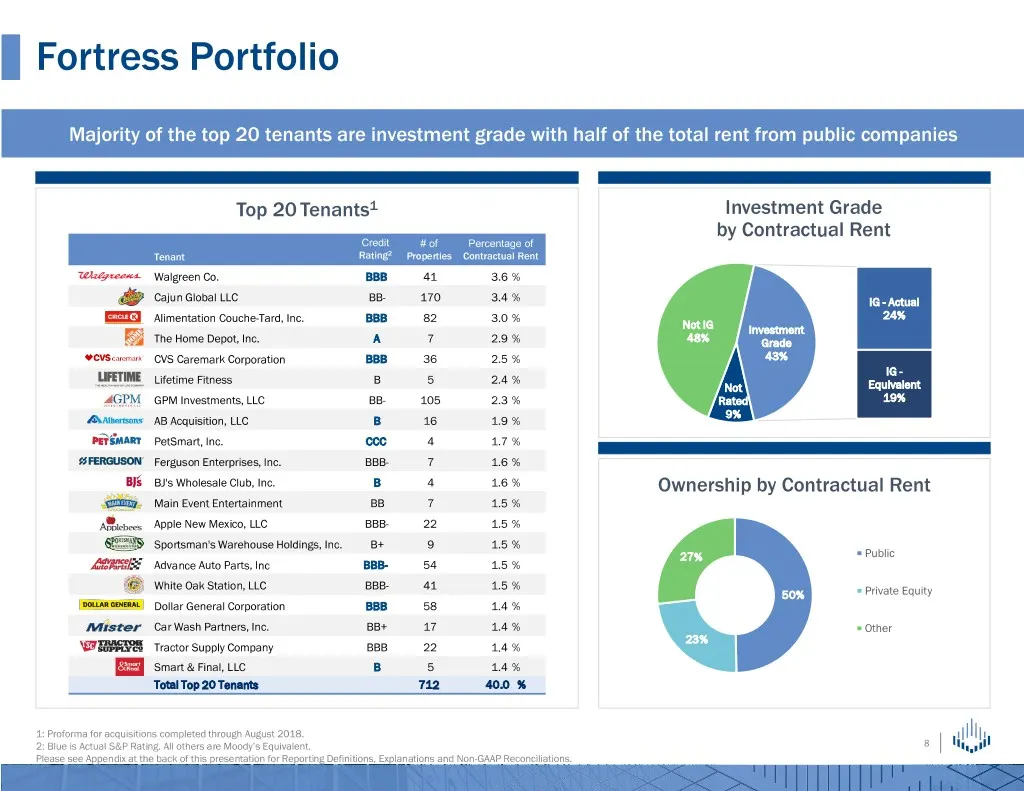
Fortress Portfolio Majority of the top 20 tenants are investment grade with half of the total rent from public companies Top 20 Tenants1 Investment Grade by Contractual Rent Credit # of Percentage of Tenant Rating2 Properties Contractual Rent Walgreen Co. BBB 41 3.6 % Cajun Global LLC BB- 170 3.4 %
Slide 9: Diversified Industries
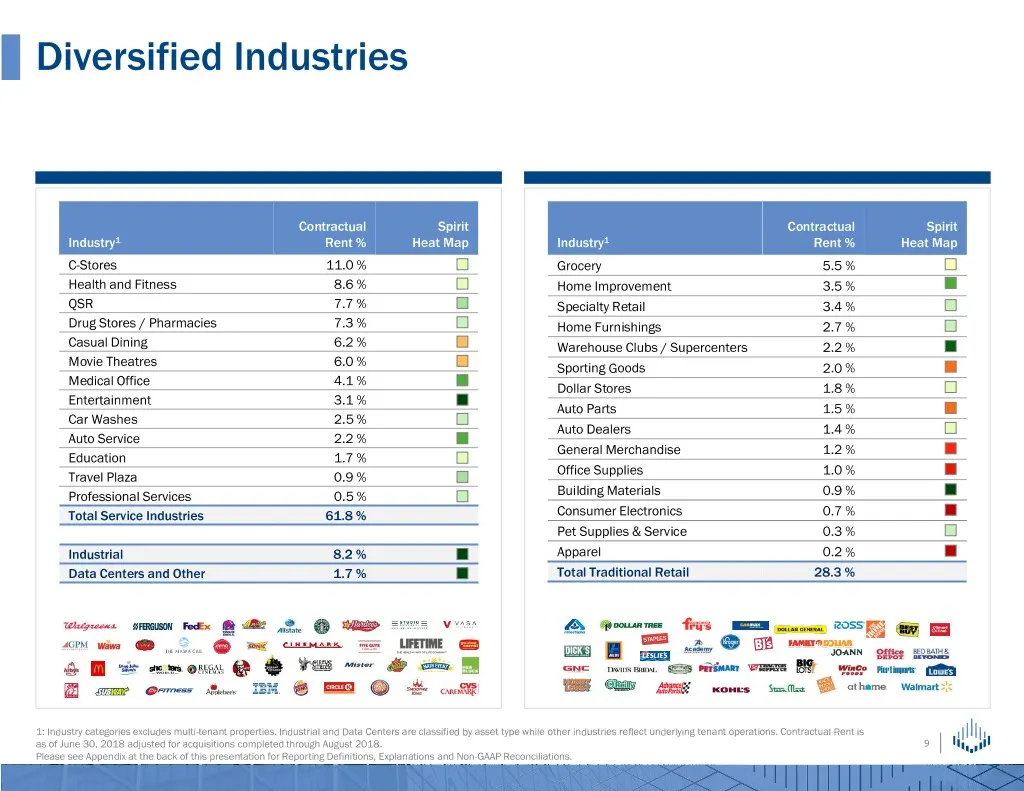
Diversified Industries Contractual Spirit Contractual Spirit Industry1 Rent % Heat Map Industry1 Rent % Heat Map C-Stores 11.0 % Grocery 5.5 % Health and Fitness 8.6 % Home Improvement 3.5 % QSR 7.7 % Specialty Retail 3.4 % Drug Stores / Pharmacies 7.3 % Home Furnishings 2.7 % Casual Dining 6.2 % Wa
Slide 10: Comparison Versus Peers
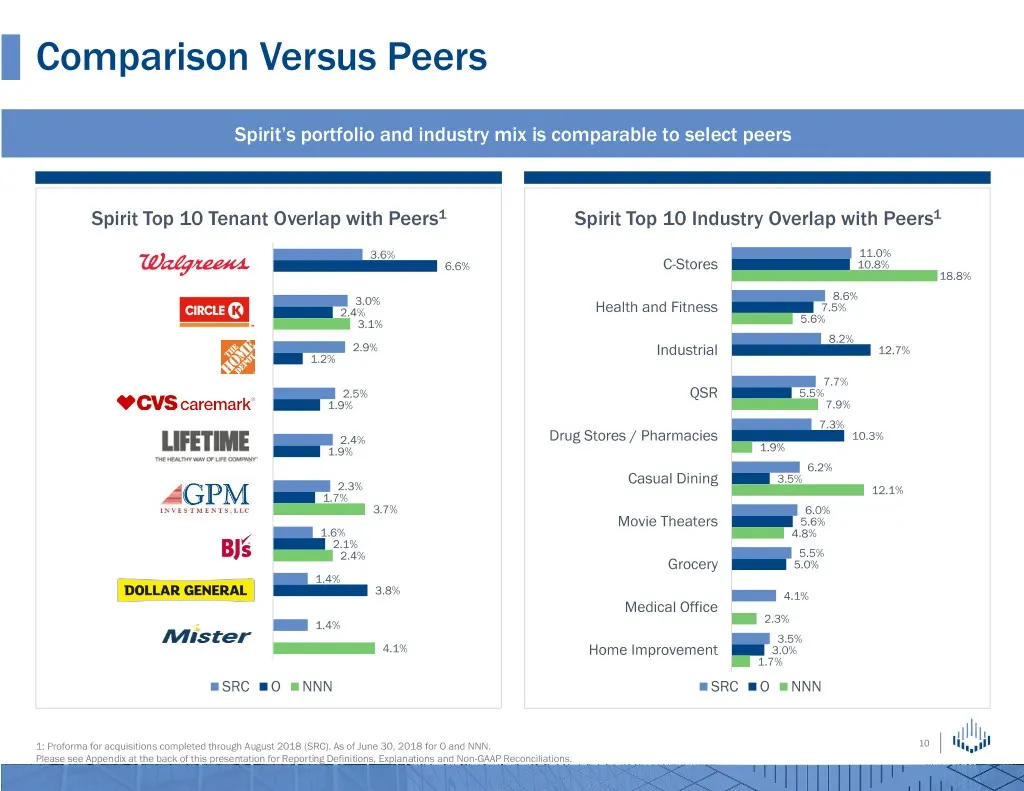
Comparison Versus Peers Spirit’s portfolio and industry mix is comparable to select peers Spirit Top 10 Tenant Overlap with Peers1 Spirit Top 10 Industry Overlap with Peers1 3.6% 11.0% Walgreen Co. 6.6% C-Stores 10.8% 18.8% 3.0% 8.6% Alimentation Couche-Tard, Inc. 2.4% Health and Fitness 7.5% 3.1% 5
Slide 11: Recent Acquisition Activity
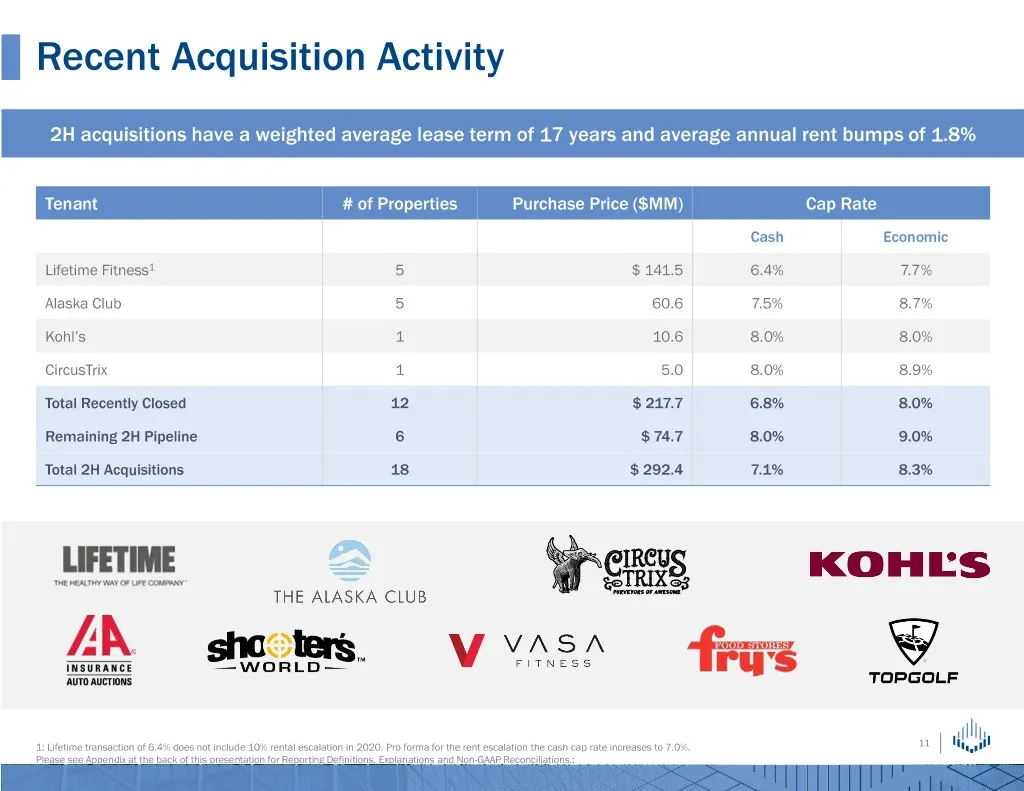
Recent Acquisition Activity 2H acquisitions have a weighted average lease term of 17 years and average annual rent bumps of 1.8% Tenant # of Properties Purchase Price ($MM) Cap Rate Cash Economic Lifetime Fitness1 5 $ 141.5 6.4% 7.7% Alaska Club 5 60.6 7.5% 8.7% Kohl’s 1 10.6 8.0% 8.0% CircusTrix 1
Slide 12: 2018 Acquisitions
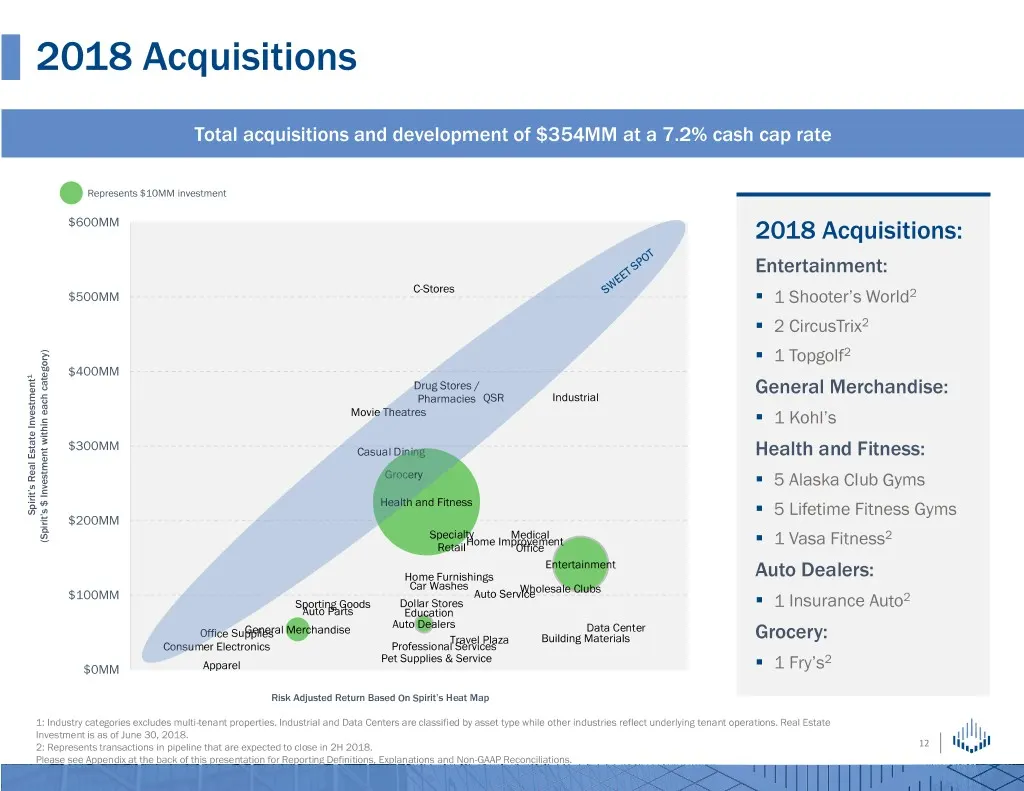
2018 Acquisitions Total acquisitions and development of $354MM at a 7.2% cash cap rate Represents $10MM investment $600MM 2018 Acquisitions: Entertainment: C-Stores $500MM . 1 Shooter’s World2 . 2 CircusTrix2 ) . 1 Topgolf2 1 $400MM Drug Stores / General Merchandise: Pharmacies QSR Industrial Movie
Slide 13: 2018 YTD Dispositions
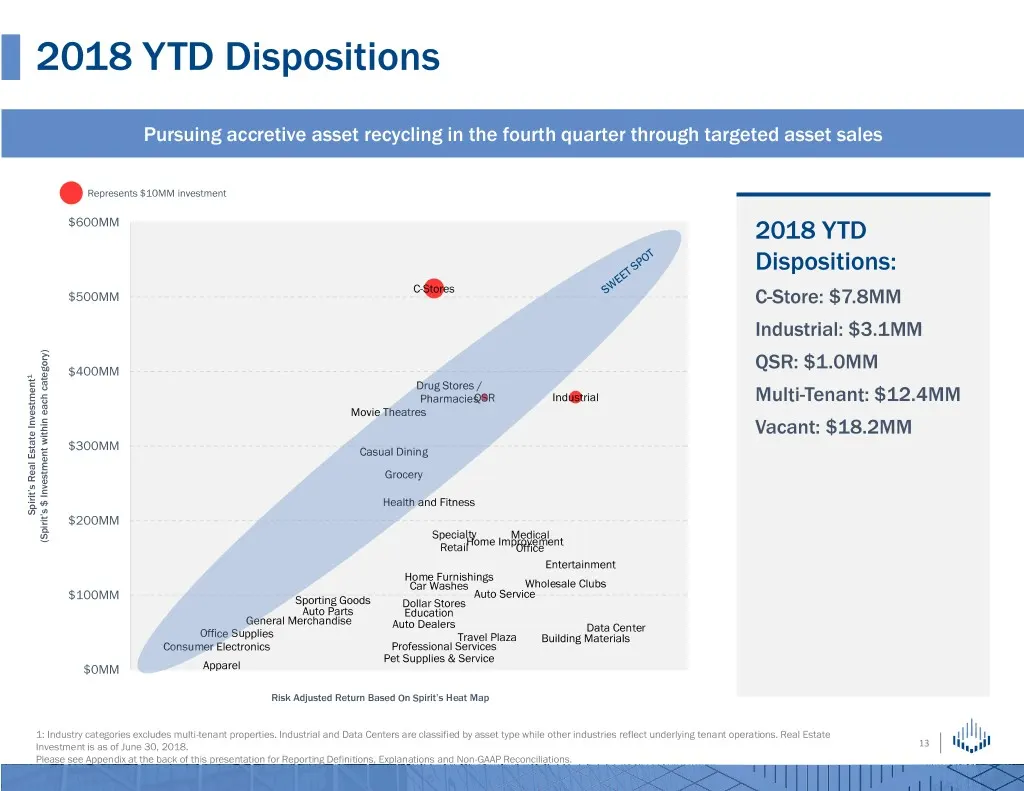
2018 YTD Dispositions Pursuing accretive asset recycling in the fourth quarter through targeted asset sales Represents $10MM investment $600MM 2018 YTD Dispositions: C-Stores $500MM C-Store: $7.8MM Industrial: $3.1MM ) QSR: $1.0MM 1 $400MM Drug Stores / PharmaciesQSR Industrial Multi-Tenant: $12.4MM
Slide 14: Balance Sheet Improvement
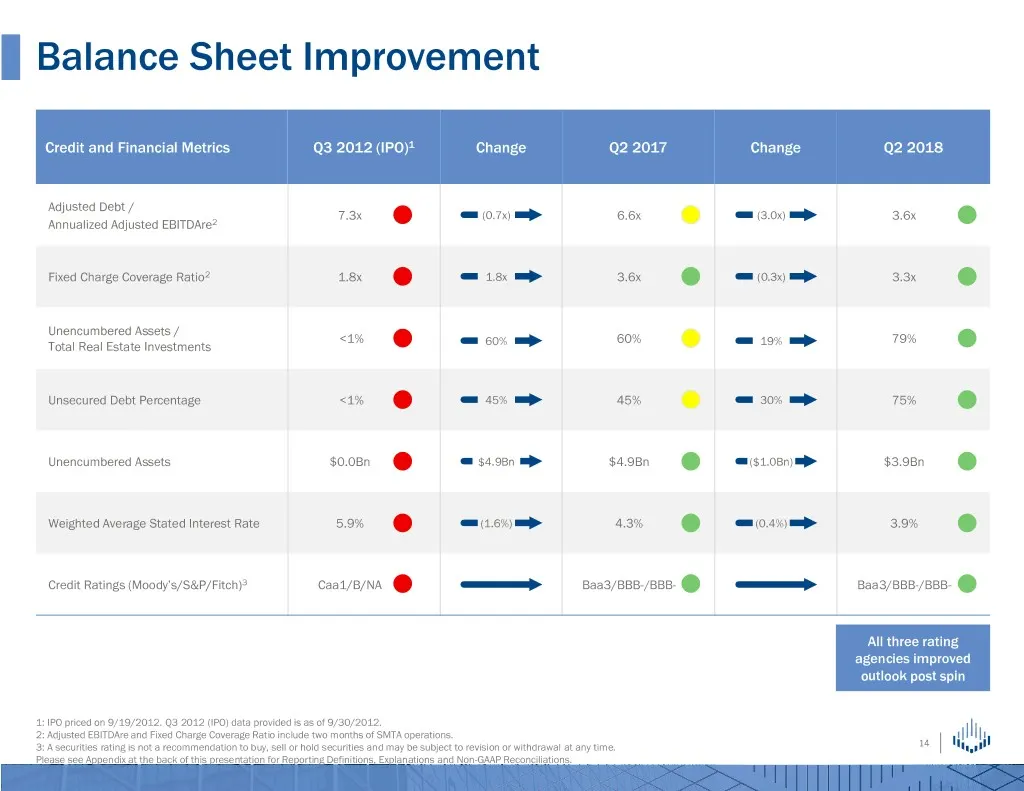
Balance Sheet Improvement Credit and Financial Metrics Q3 2012 (IPO)1 Change Q2 2017 Change Q2 2018 Adjusted Debt / 7.3x (0.7x) 6.6x (3.0x) 3.6x Annualized Adjusted EBITDAre2 Fixed Charge Coverage Ratio2 1.8x 1.8x 3.6x (0.3x) 3.3x Unencumbered Assets / <1% 60% 79% Total Real Estate Investments 60% 1
Slide 15: Rating Agencies Outlook Updates
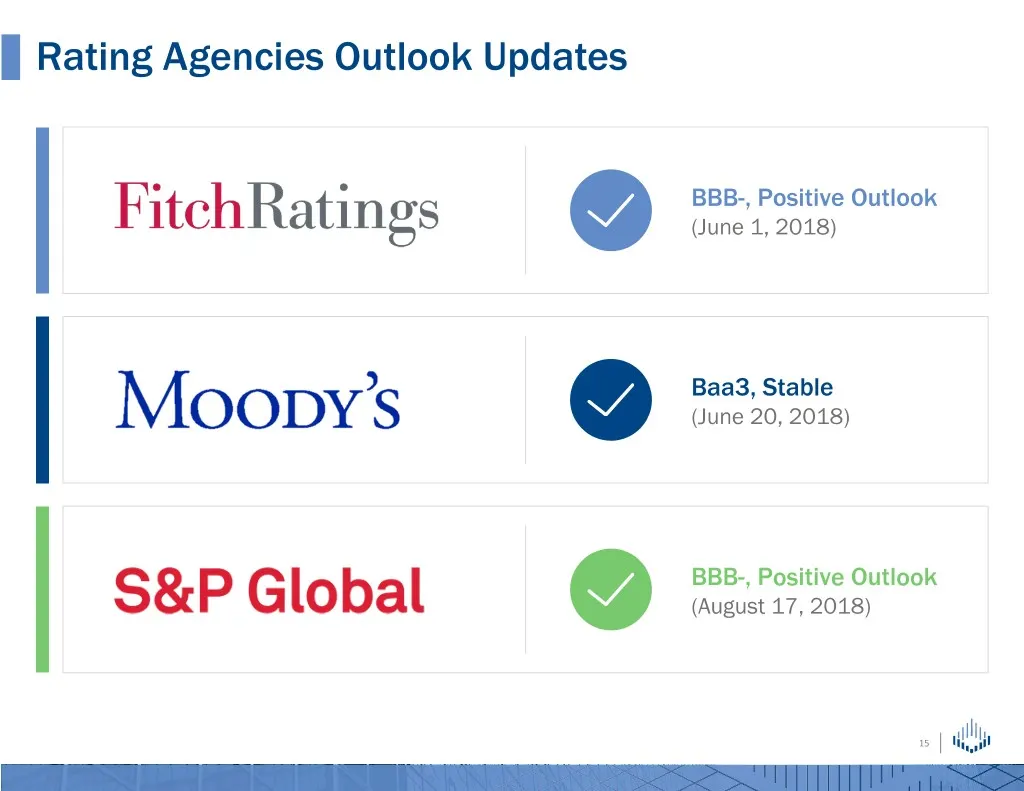
Rating Agencies Outlook Updates BBB-, Positive Outlook (June 1, 2018) Baa3, Stable (June 20, 2018) BBB-, Positive Outlook (August 17, 2018) 15
Slide 16: Appendix: Spirit Tools and Additional Information
Appendix Spirit Tools and Additional Information
Slide 17: Spirit's Heat Map
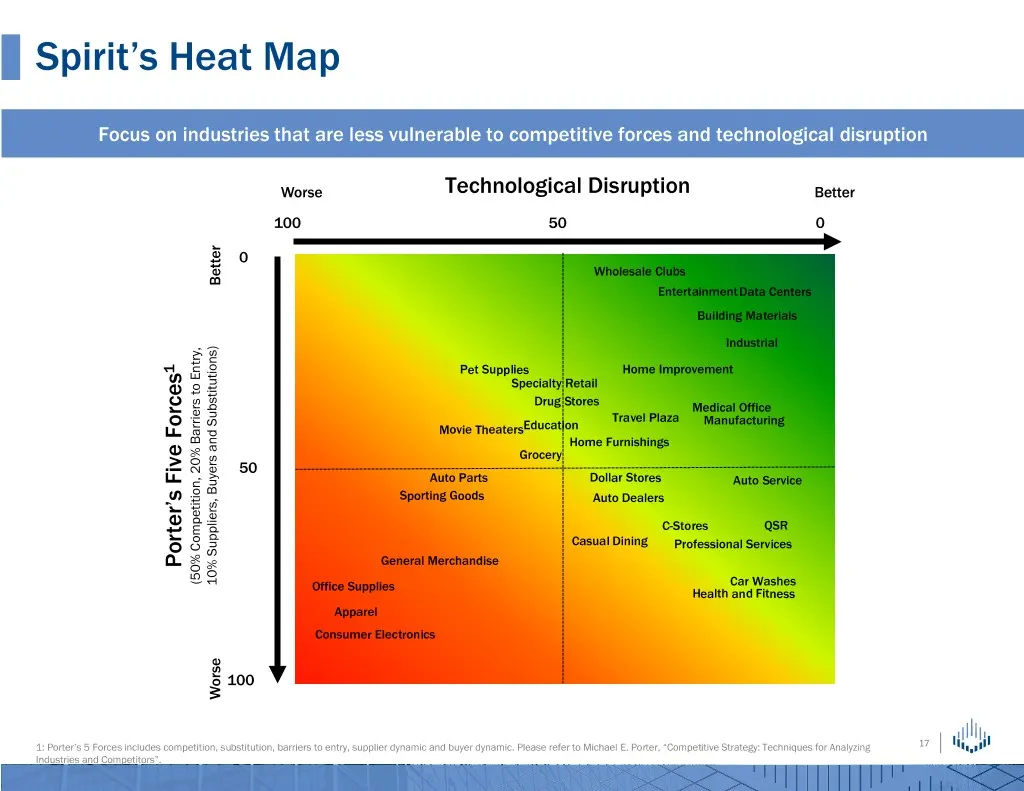
Spirit’s Heat Map Focus on industries that are less vulnerable to competitive forces and technological disruption Worse Technological Disruption Better 100 50 0 0 Wholesale Clubs Better EntertainmentData Centers Building Materials Industrial 1 Pet Supplies Home Improvement Specialty Retail Drug Stor
Slide 18: Spirit's Efficient Frontier
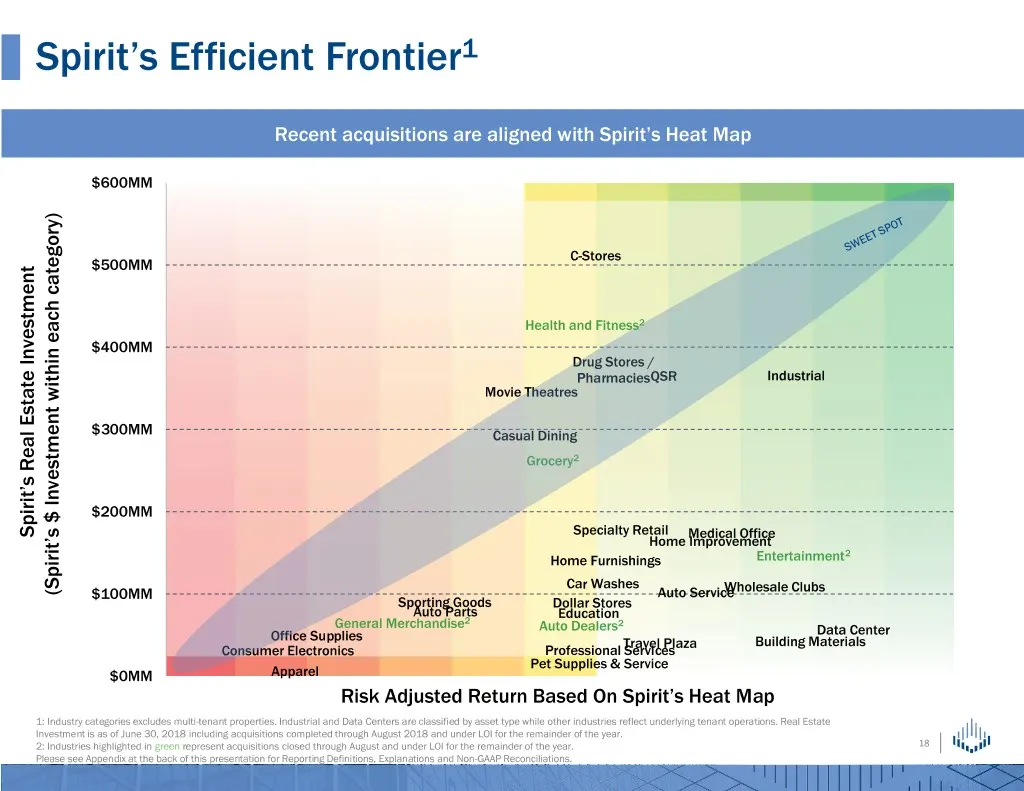
Spirit’s Efficient Frontier1 Recent acquisitions are aligned with Spirit’s Heat Map $600MM C-Stores $500MM Health and Fitness2 $400MM Drug Stores / PharmaciesQSR Industrial Movie Theatres $300MM Casual Dining Grocery2 $200MM Spirit’s Real Estate Real Spirit’s Estate Investment Specialty Retail Medic
Slide 19: Spirit's Property Ranking Model
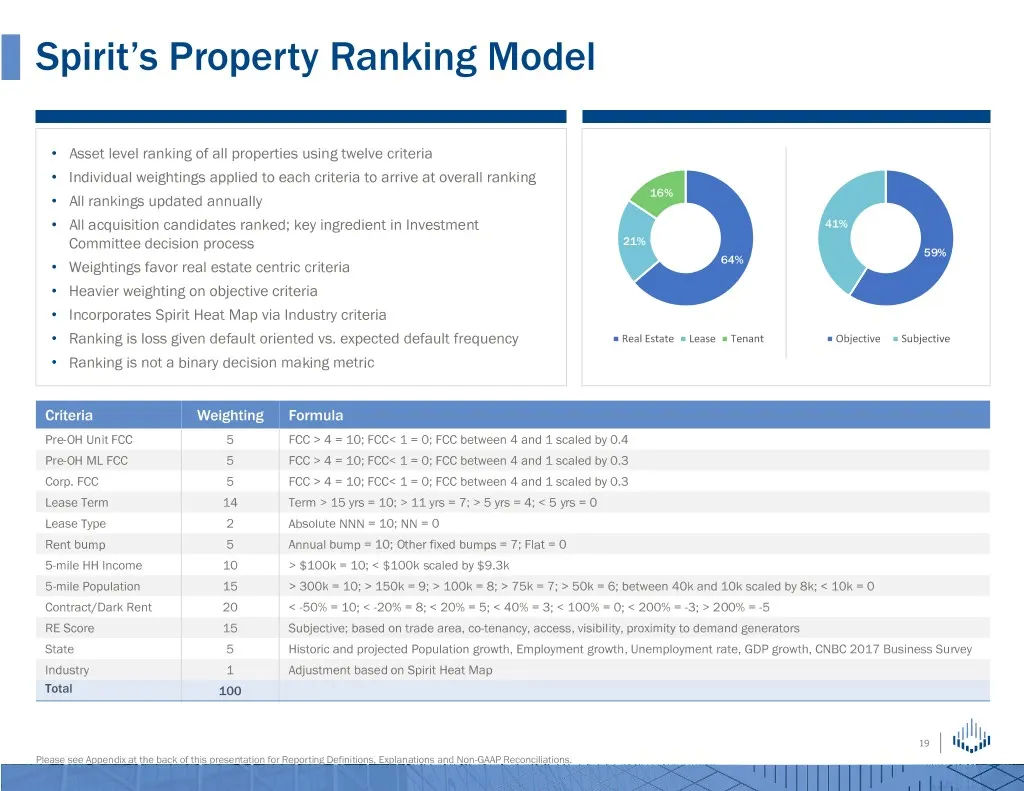
Spirit’s Property Ranking Model • Asset level ranking of all properties using twelve criteria • Individual weightings applied to each criteria to arrive at overall ranking 16% • All rankings updated annually • All acquisition candidates ranked; key ingredient in Investment 41% Committee decision pro
Slide 20: Relationship with Spirit MTA REIT
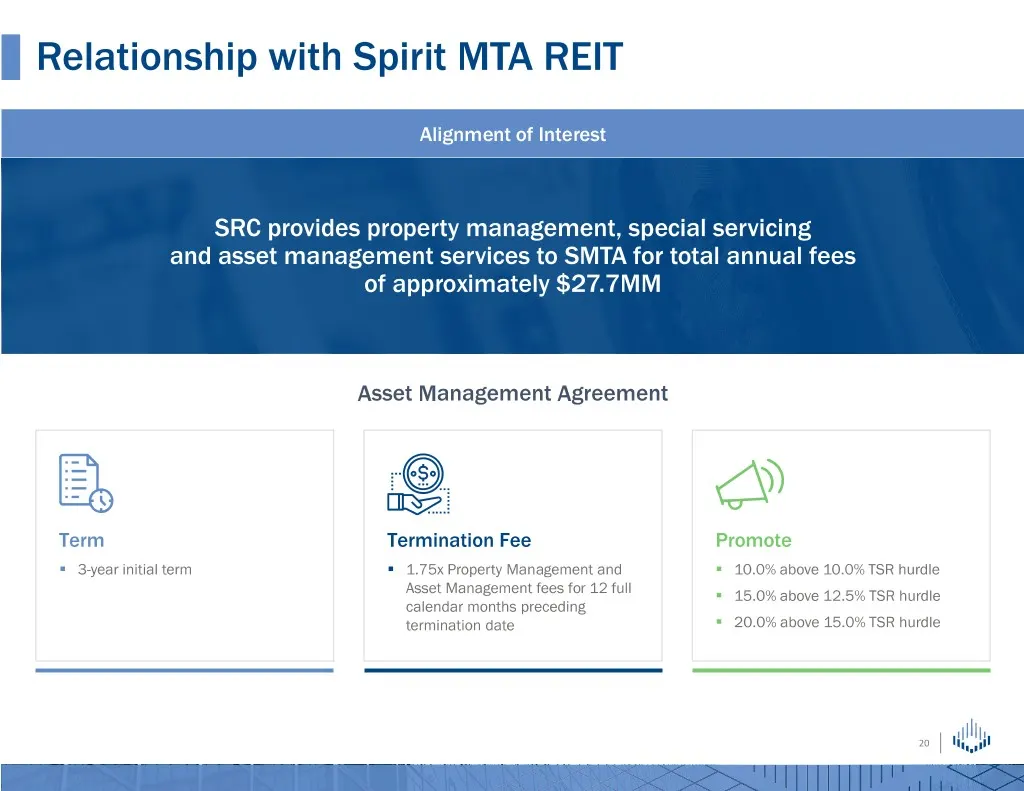
Relationship with Spirit MTA REIT Alignment of Interest SRC provides property management, special servicing and asset management services to SMTA for total annual fees of approximately $27.7MM Asset Management Agreement Term Termination Fee Promote . 3-year initial term . 1.75x Property Management a
Slide 21: Appendix: Select Industry Views
Appendix Select Industry Views
Slide 22: Convenience Stores
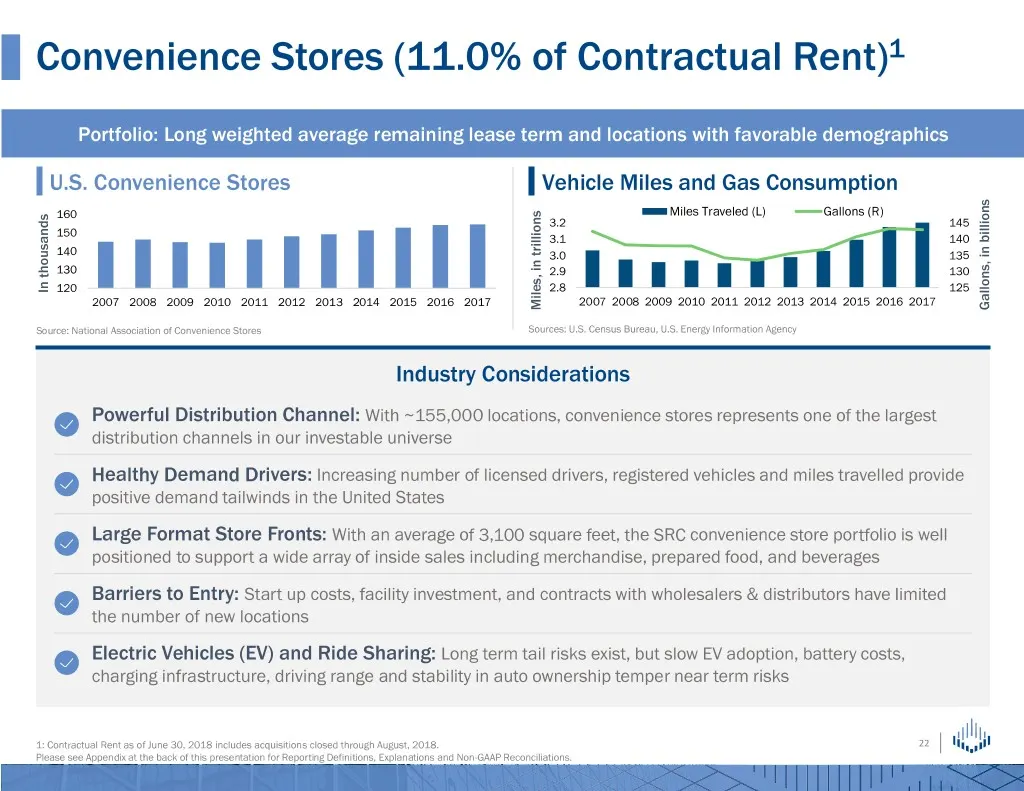
Convenience Stores (11.0% of Contractual Rent)1 Portfolio: Long weighted average remaining lease term and locations with favorable demographics U.S. Convenience Stores Vehicle Miles and Gas Consumption 160 Miles Traveled (L) Gallons (R) 3.2 145 150 3.1 140 140 3.0 135 130 2.9 130 In thousands 120 2.
Slide 23: Health & Fitness
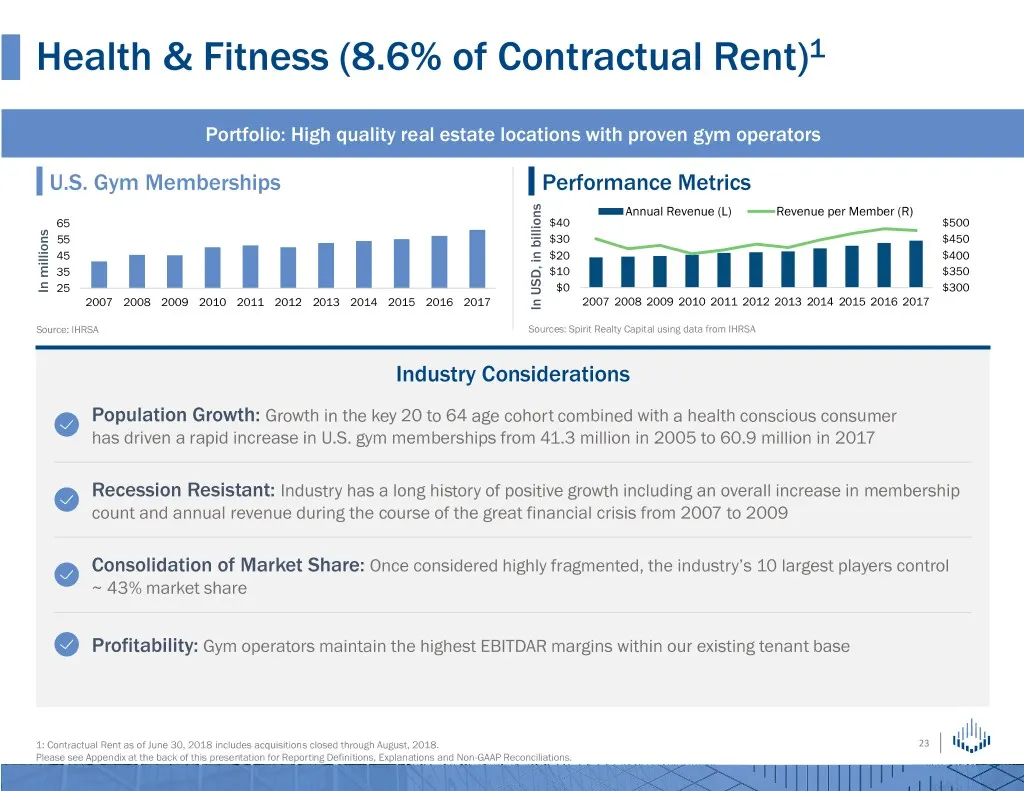
Health & Fitness (8.6% of Contractual Rent)1 Portfolio: High quality real estate locations with proven gym operators U.S. Gym Memberships Performance Metrics Annual Revenue (L) Revenue per Member (R) 65 $40 $500 55 $30 $450 45 $20 $400 35 $10 $350 In millions In 25 $0 $300 2007 2008 2009 2010 2011 2
Slide 24: Quick Service Restaurants
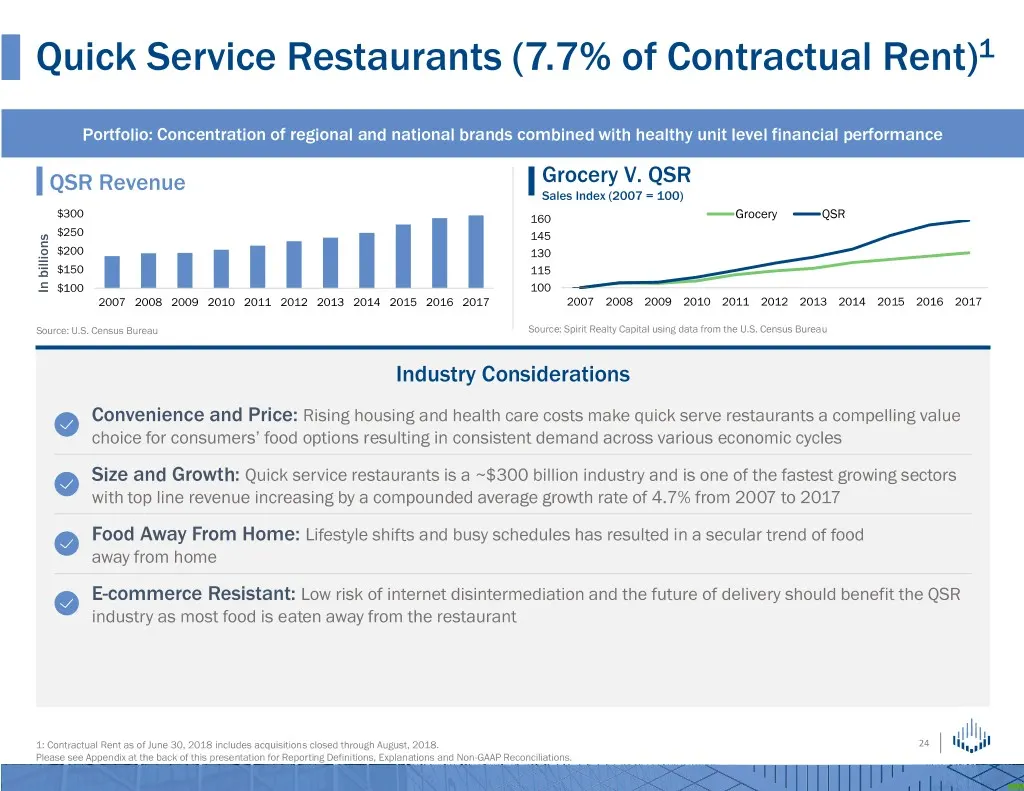
Quick Service Restaurants (7.7% of Contractual Rent)1 Portfolio: Concentration of regional and national brands combined with healthy unit level financial performance QSR Revenue Grocery V. QSR Sales Index (2007 = 100) $300 160 Grocery QSR $250 145 $200 130 $150 115 In billions In $100 100 2007 2008
Slide 25: Drug Stores/Pharmacies
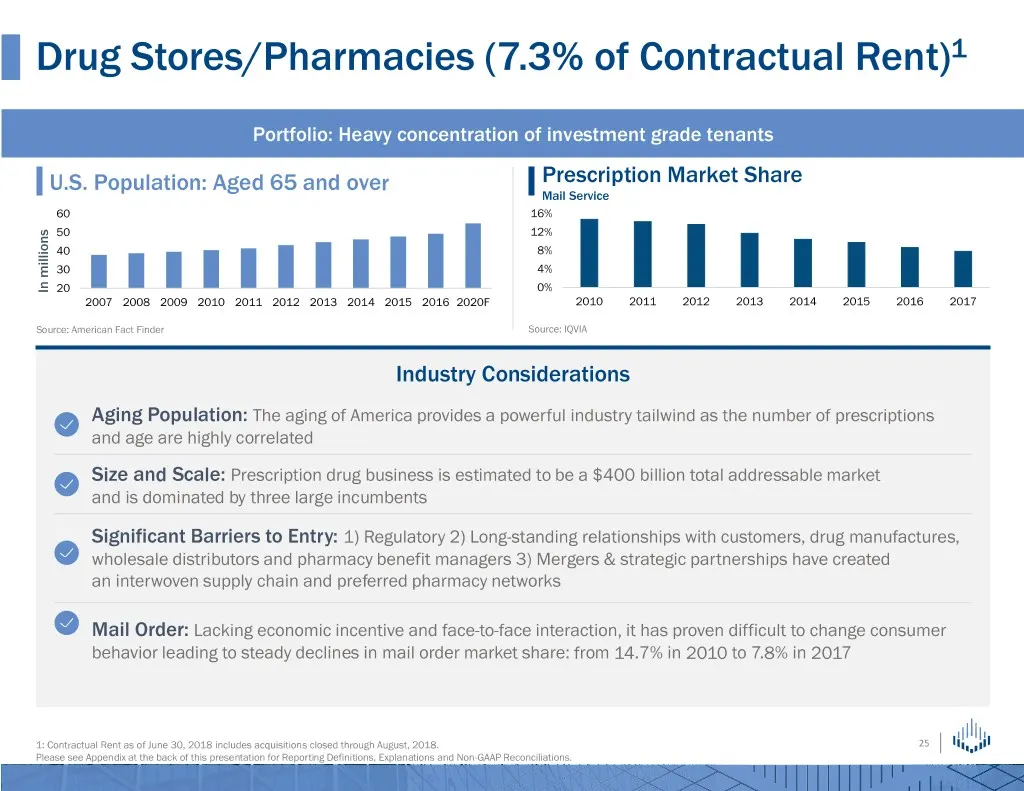
Drug Stores/Pharmacies (7.3% of Contractual Rent)1 Portfolio: Heavy concentration of investment grade tenants U.S. Population: Aged 65 and over Prescription Market Share Mail Service 60 16% 50 12% 40 8% 30 4% In millions In 20 0% 2007 2008 2009 2010 2011 2012 2013 2014 2015 2016 2020F 2010 2011 2012
Slide 26: Casual Dining Restaurants
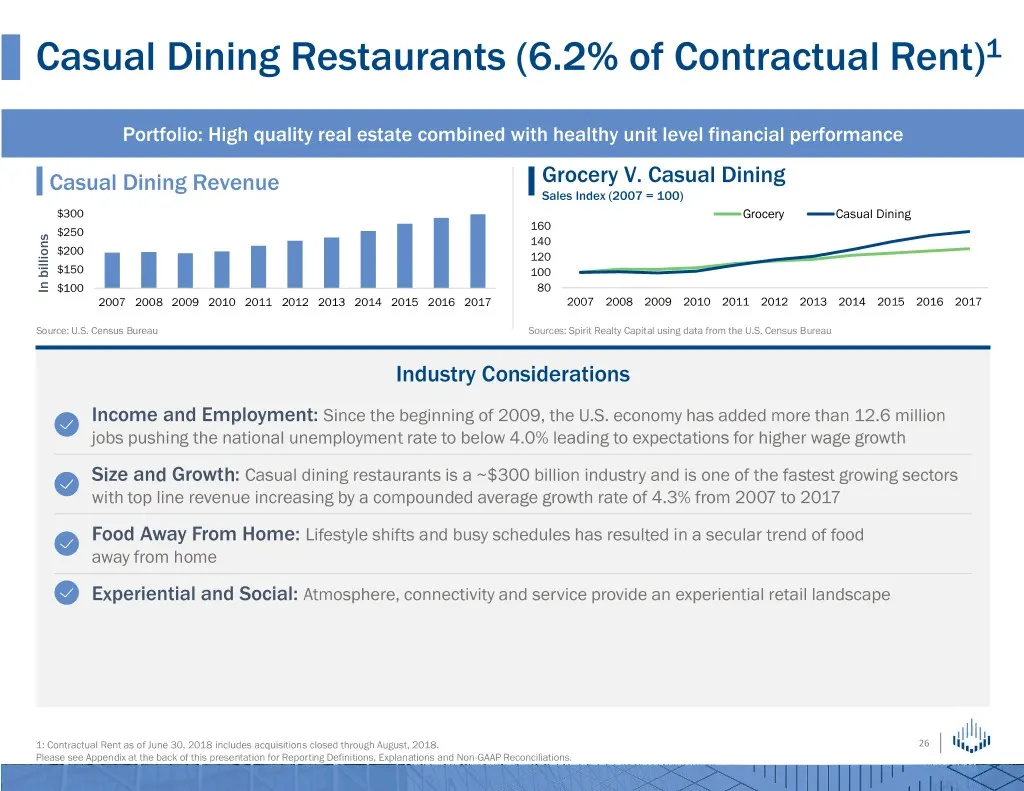
Casual Dining Restaurants (6.2% of Contractual Rent)1 Portfolio: High quality real estate combined with healthy unit level financial performance Casual Dining Revenue Grocery V. Casual Dining Sales Index (2007 = 100) $300 Grocery Casual Dining 160 $250 140 $200 120 $150 100 In billions In $100 80 20
Slide 27: Movie Theaters
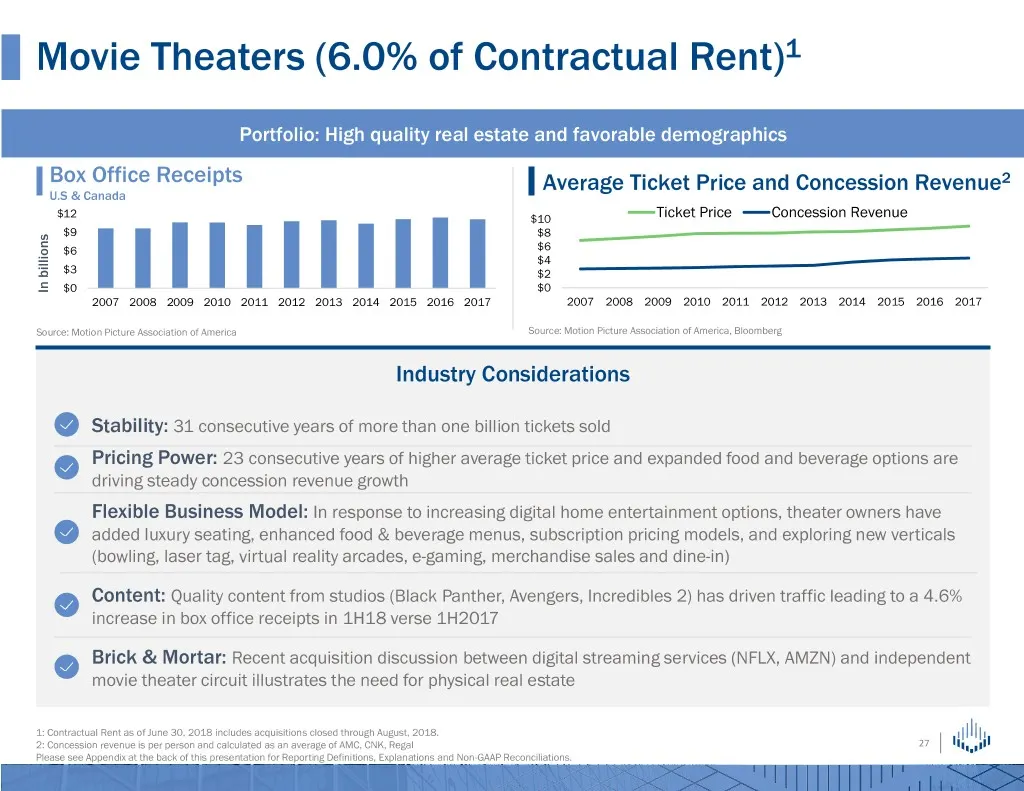
Movie Theaters (6.0% of Contractual Rent)1 Portfolio: High quality real estate and favorable demographics Box Office Receipts Average Ticket Price and Concession Revenue2 U.S & Canada $12 $10 Ticket Price Concession Revenue $9 $8 $6 $6 $4 $3 $2 In billions In $0 $0 2007 2008 2009 2010 2011 2012 2013
Slide 28: Appendix: Non-GAAP Reconciliation and Reporting Definitions
Appendix Non-GAAP Reconciliation and Reporting Definitions
Slide 29: Reporting Definitions
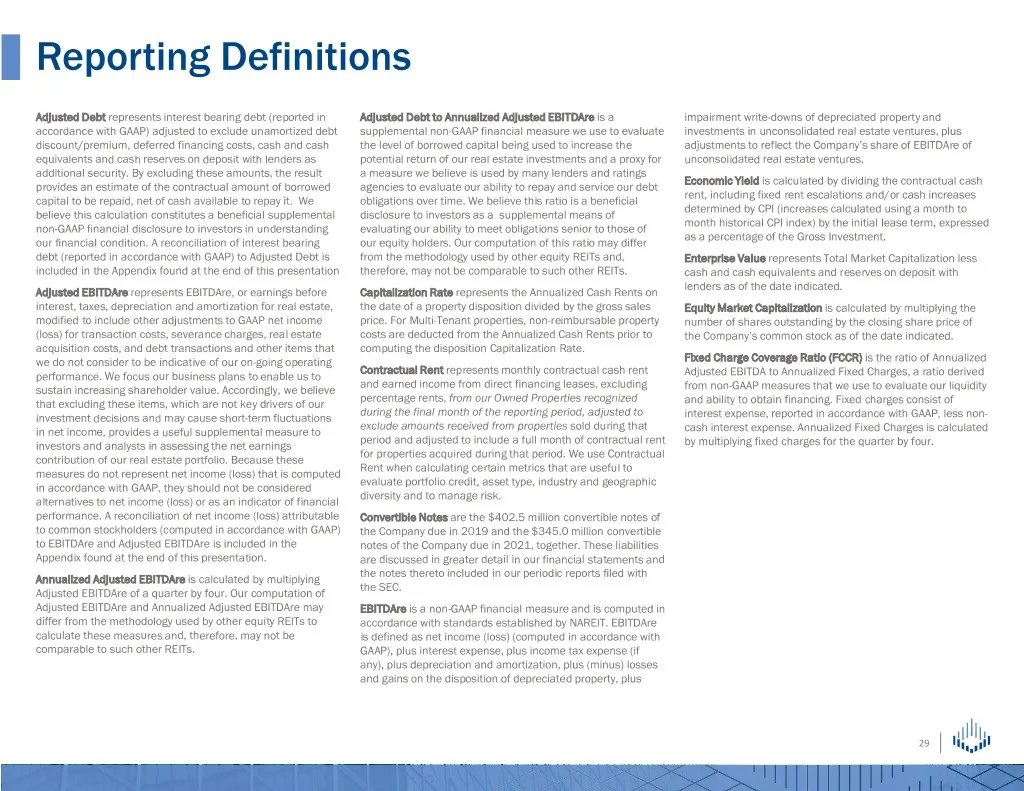
Reporting Definitions Adjusted Debt represents interest bearing debt (reported in Adjusted Debt to Annualized Adjusted EBITDAre is a impairment write-downs of depreciated property and accordance with GAAP) adjusted to exclude unamortized debt supplemental non-GAAP financial measure we use to evaluat
Slide 30: Reporting Definitions
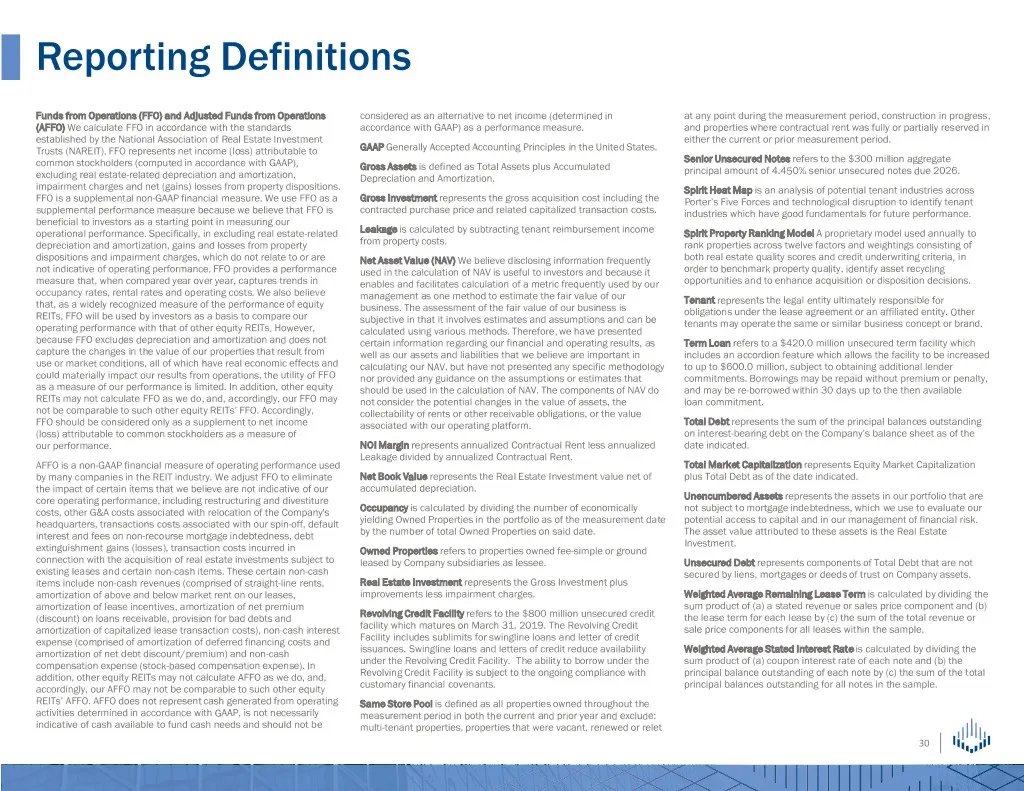
Reporting Definitions Funds from Operations (FFO) and Adjusted Funds from Operations considered as an alternative to net income (determined in at any point during the measurement period, construction in progress, (AFFO) We calculate FFO in accordance with the standards accordance with GAAP) as a per
Slide 31: Non-GAAP Reconciliation
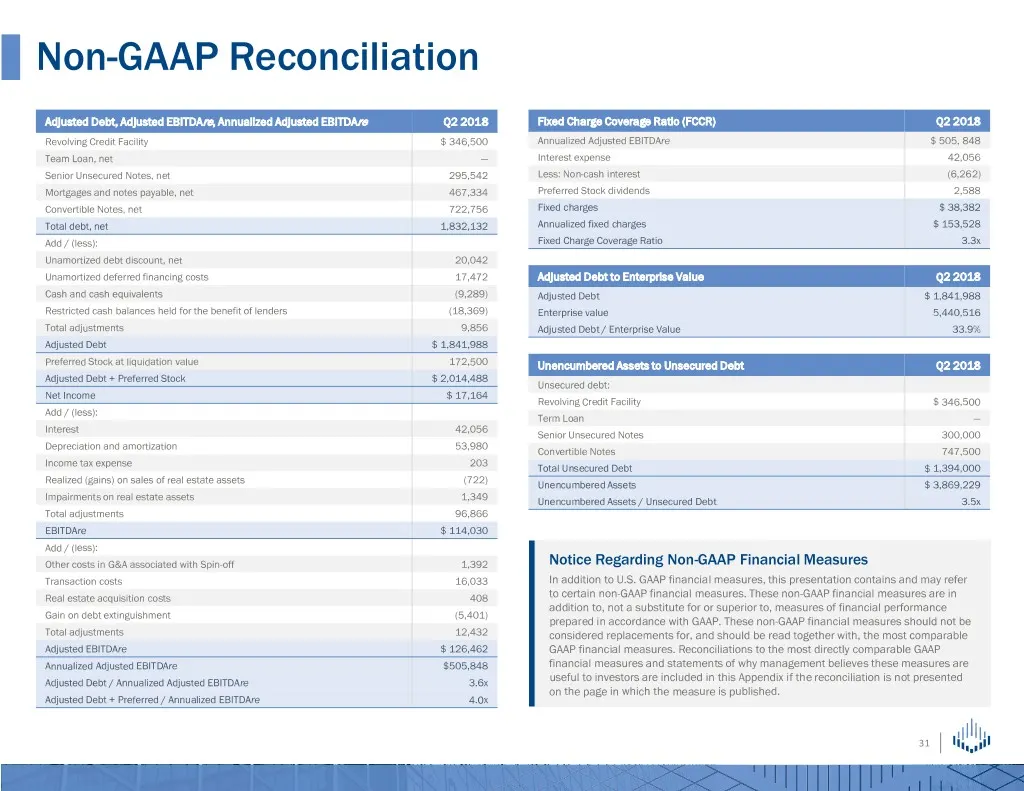
Non-GAAP Reconciliation Adjusted Debt, Adjusted EBITDAre, Annualized Adjusted EBITDAre Q2 2018 Fixed Charge Coverage Ratio (FCCR) Q2 2018 Revolving Credit Facility $ 346,500 Annualized Adjusted EBITDAre $ 505, 848 Team Loan, net — Interest expense 42,056 Senior Unsecured Notes, net 295,542 Less: Non
Source: SEC EDGAR · 8-K filed Sep 10, 2018
More decks from Spirit Realty Capital Inc
 Q3 2023 Earnings Presentation28 slides · Nov 2, 2023
 Merger or Acquisition (October 2023)20 slides · Oct 30, 2023
 Q2 2023 Earnings Presentation26 slides · Aug 7, 2023
 Q2 2023 Earnings Presentation26 slides · August 2023
 Q1 2023 Earnings Presentation27 slides · May 3, 2023
 Q4 2022 Earnings Presentation31 slides · Feb 28, 2023