Shake Shack, Inc. · NYSE:SHAK
Shake Shack — Q3 2026 Earnings Presentation
30 slides from Shake Shack's earnings presentation, Nov 5, 2026
Slide 1: Third Quarter 2026 Shareholder Letter
Third Quarter 2026 Shareholder Letter
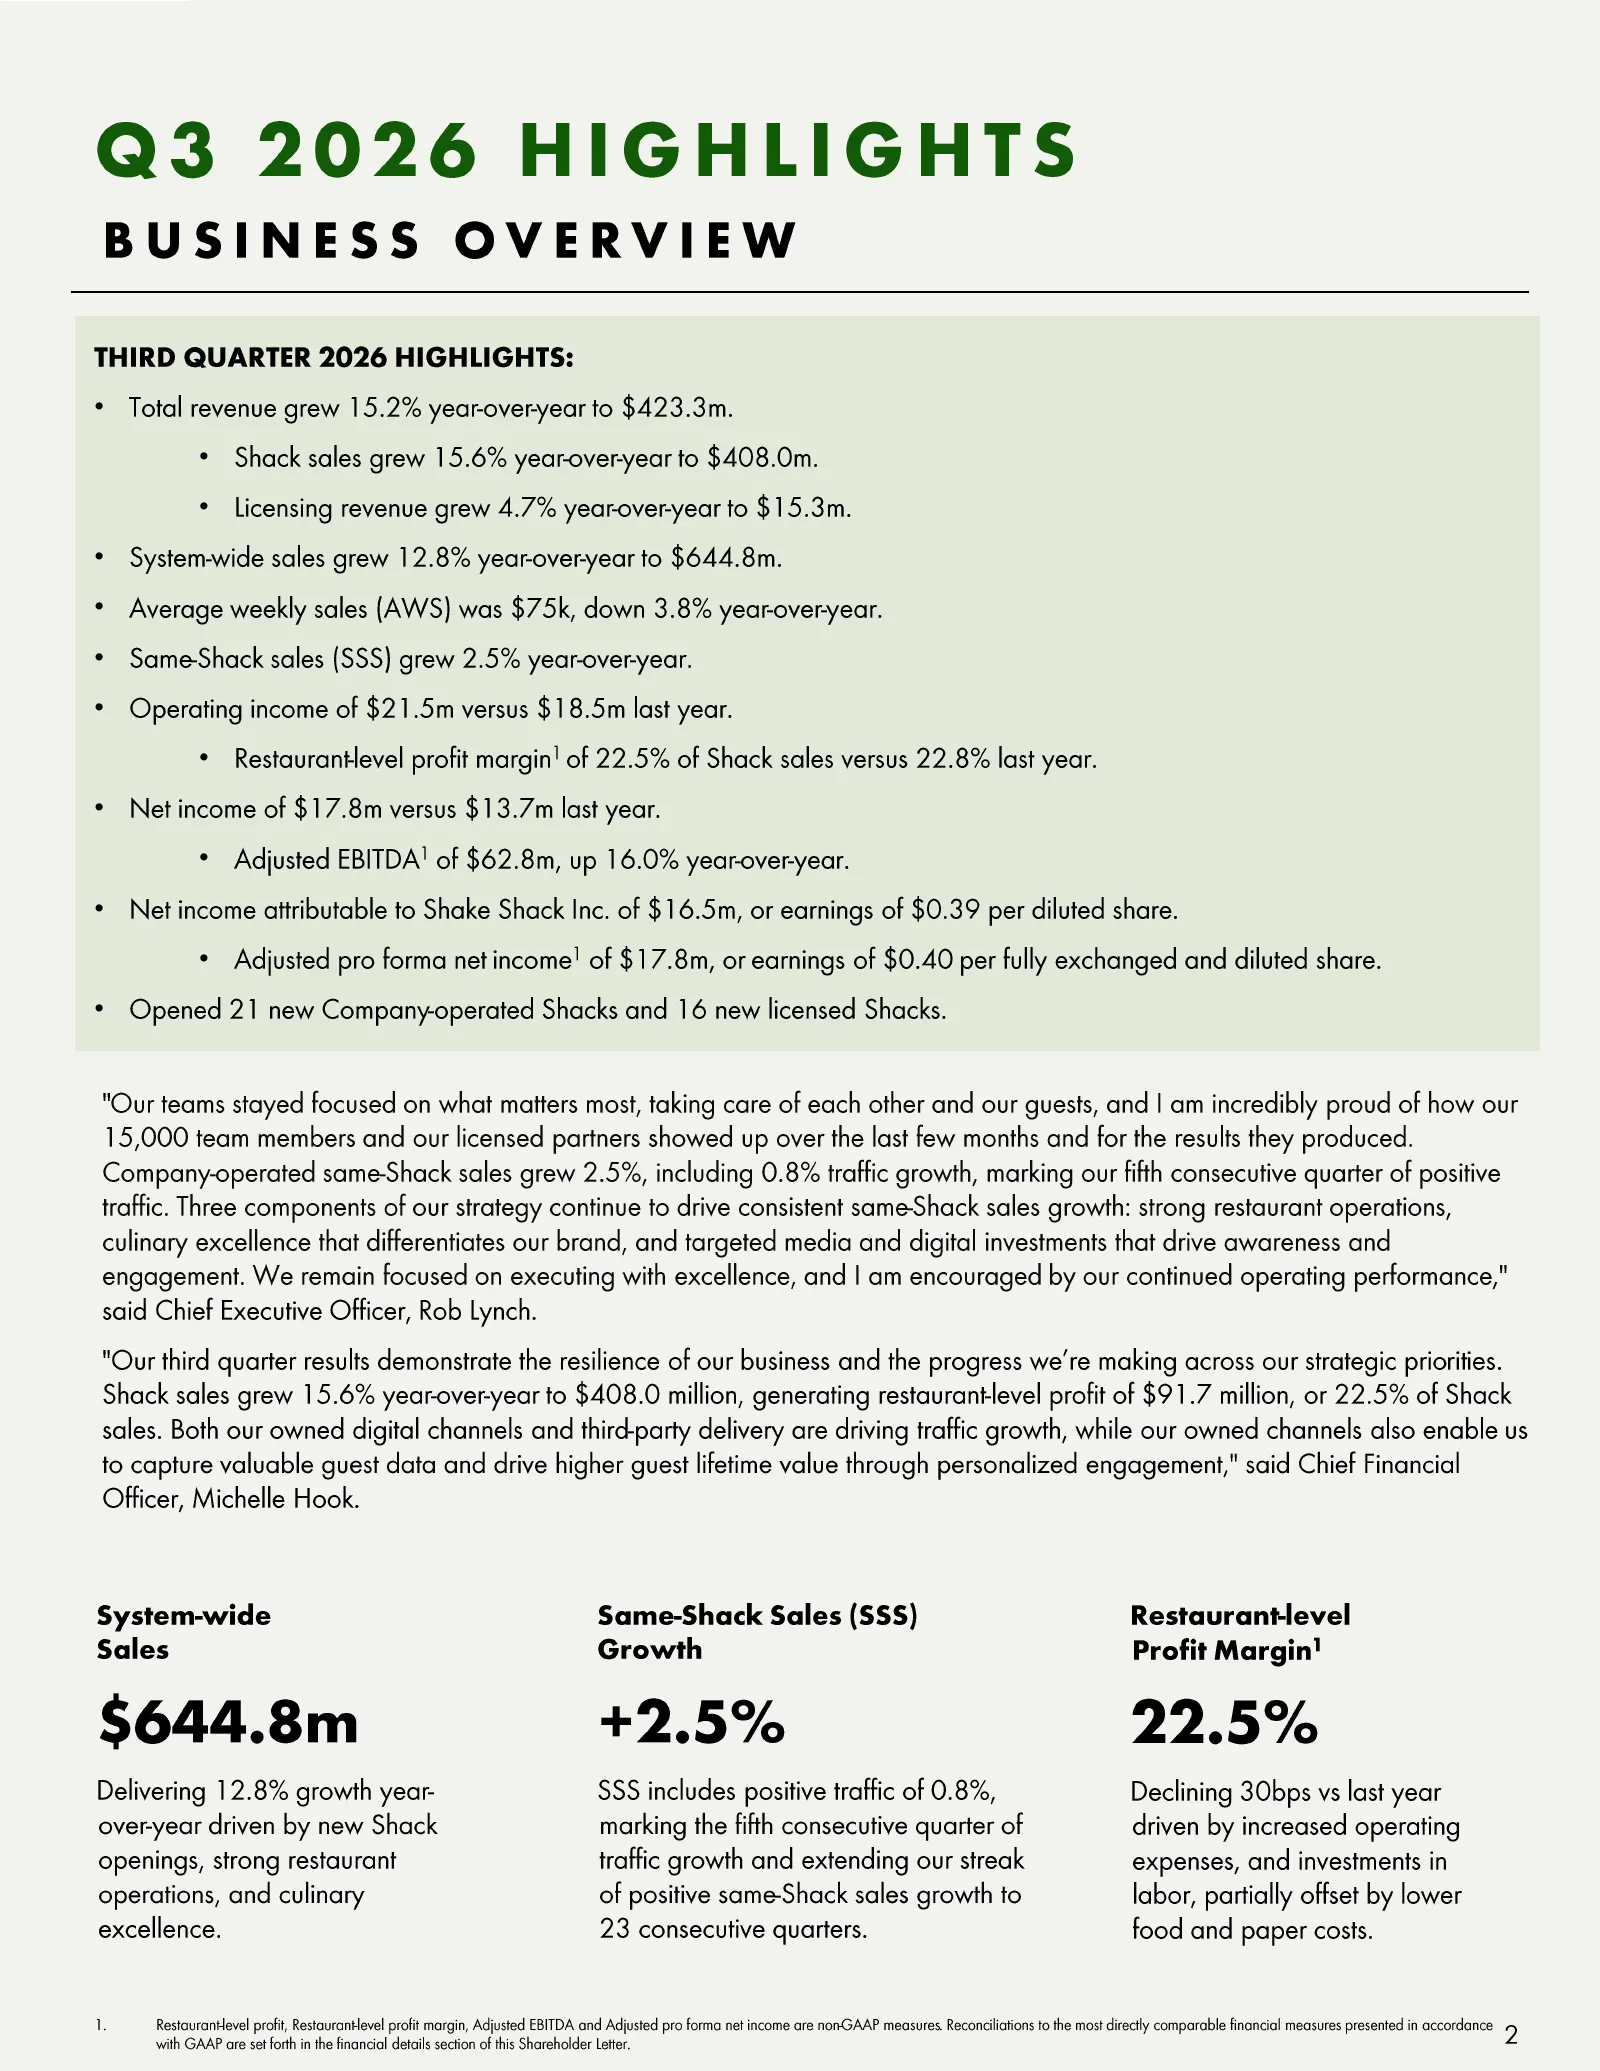
Slide 2: Q3 2026 Highlights
Q3 2026 HIGHLIGHTS BUSINESS OVERVIEW THIRD QUARTER 2026 HIGHLIGHTS: • Total revenue grew 15.2% year -over-year to $423.3m. • Shack sales grew 15.6% year-over-year to $408.0m. • Licensing revenue grew 4.7% year -over-year to $15.3m. • System-wide sales grew 12.8% year-over-year to $644.8m. • Average
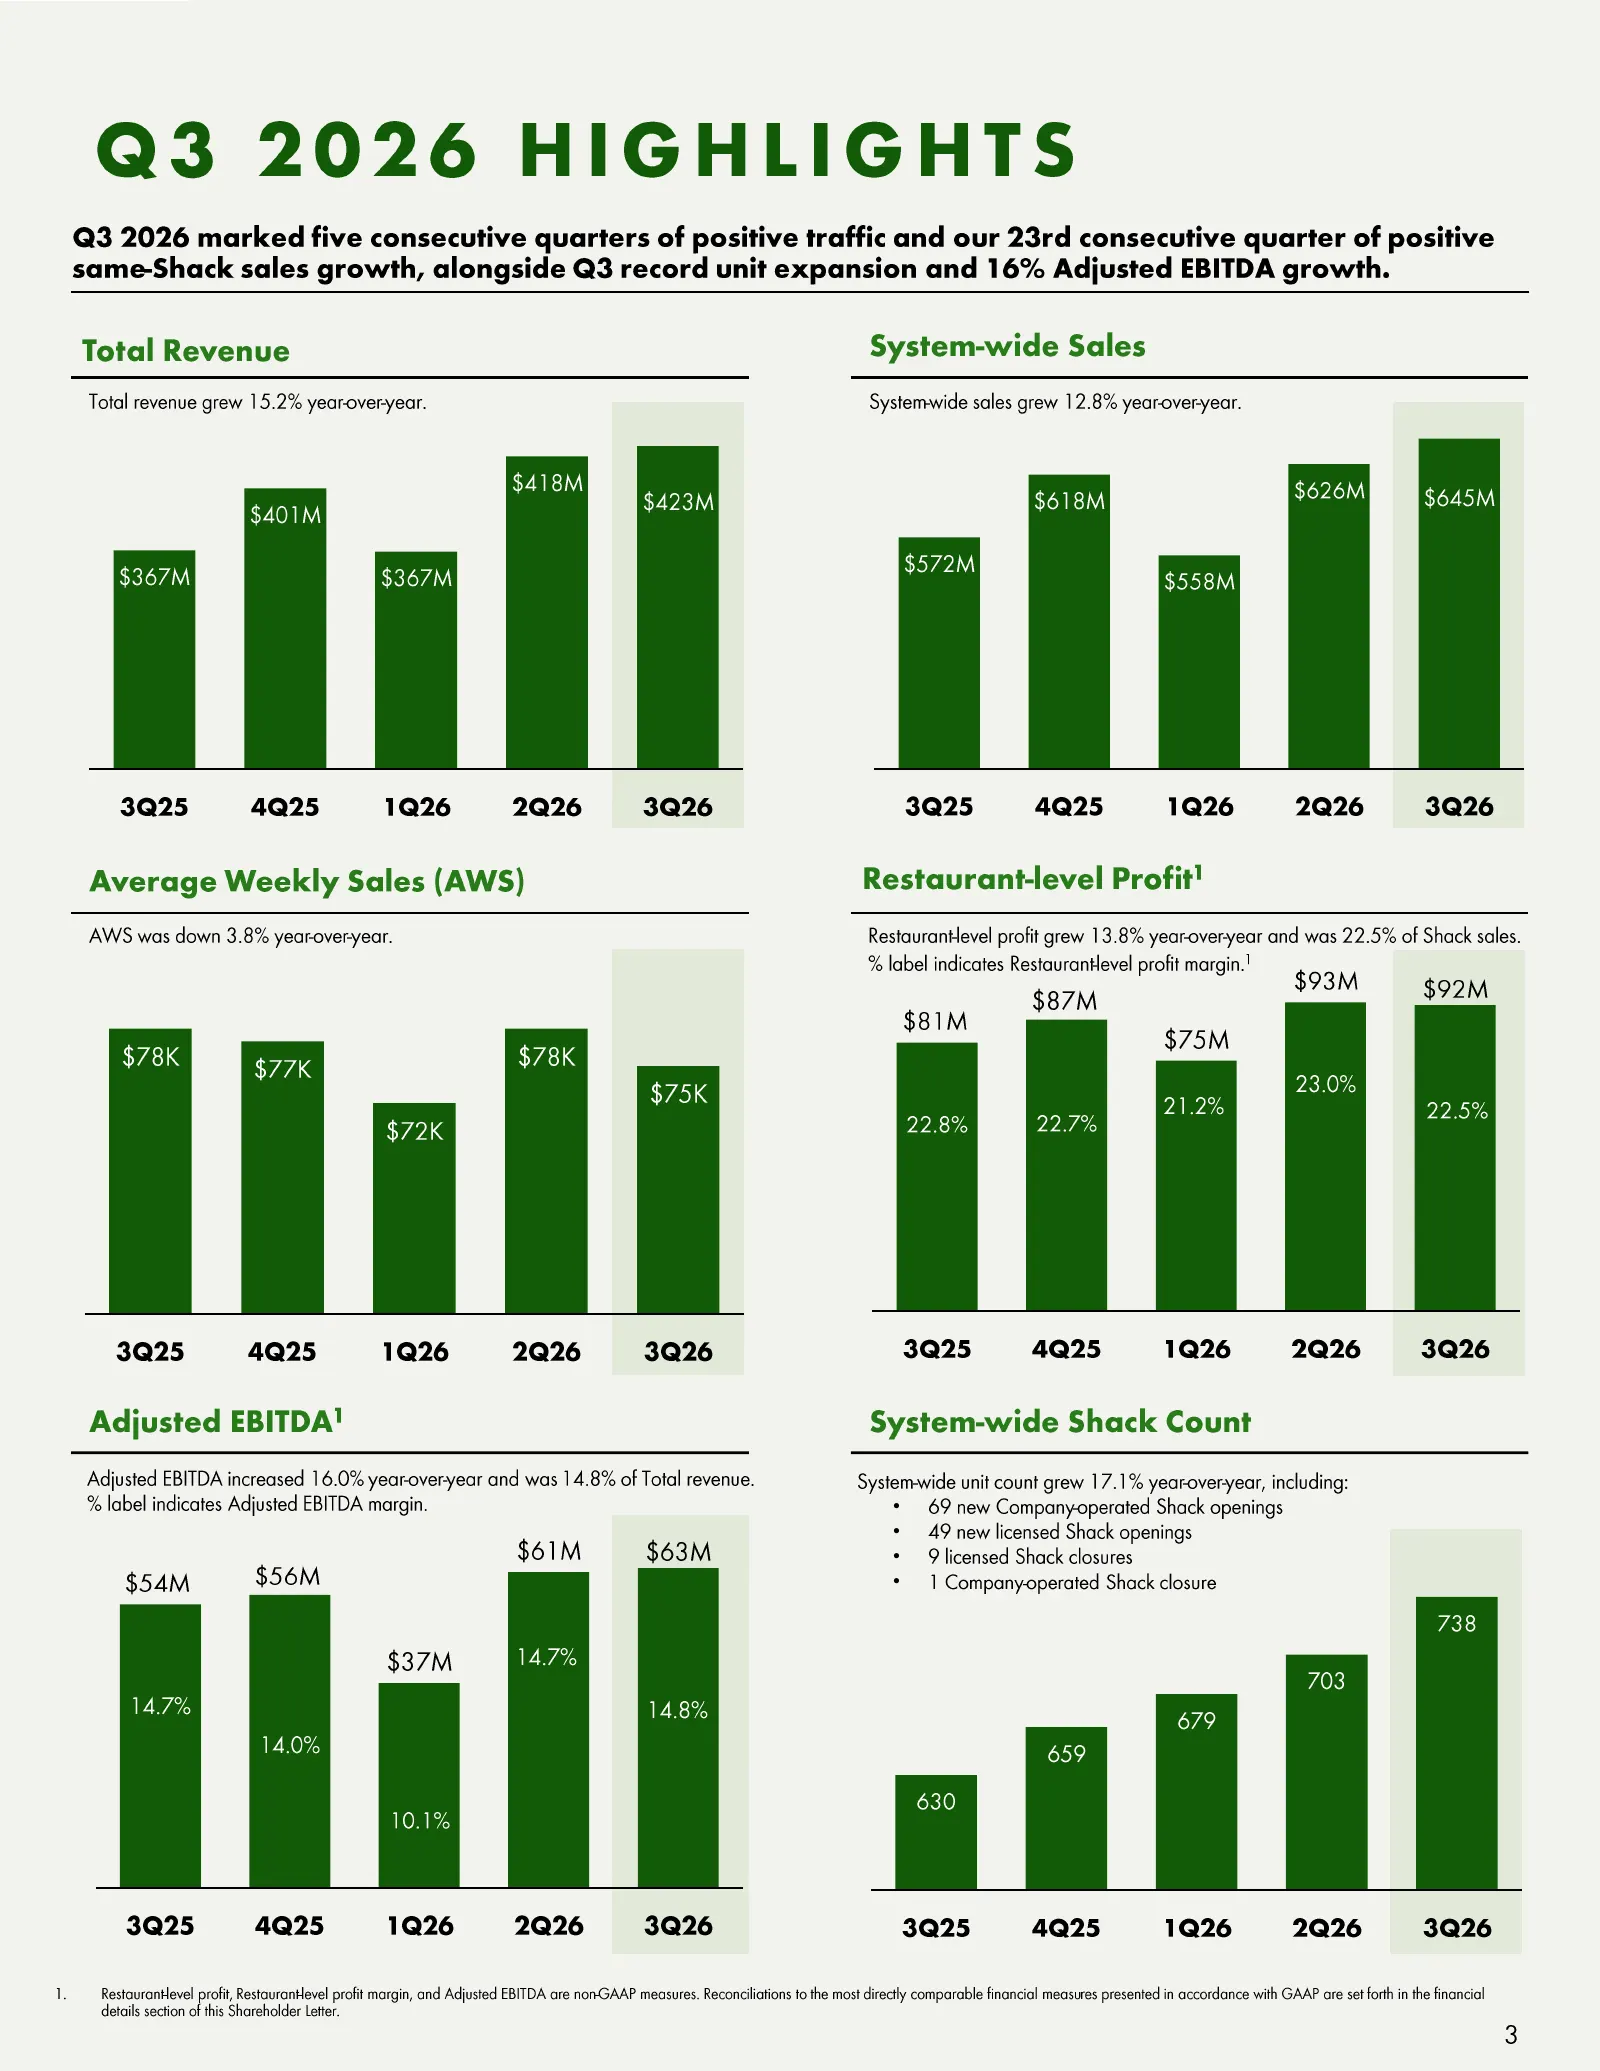
Slide 3: Q3 2026 Highlights
Q3 2026 HIGHLIGHTS Q3 2026 marked five consecutive quarters of positive traffic and our 23rd consecutive quarter of positive same -Shack sales growth, alongside Q3 record unit expansion and 16% Adjusted EBITDA growth. Total Revenue System -wide Sales Total revenue grew 15.2% year -over-year. System-
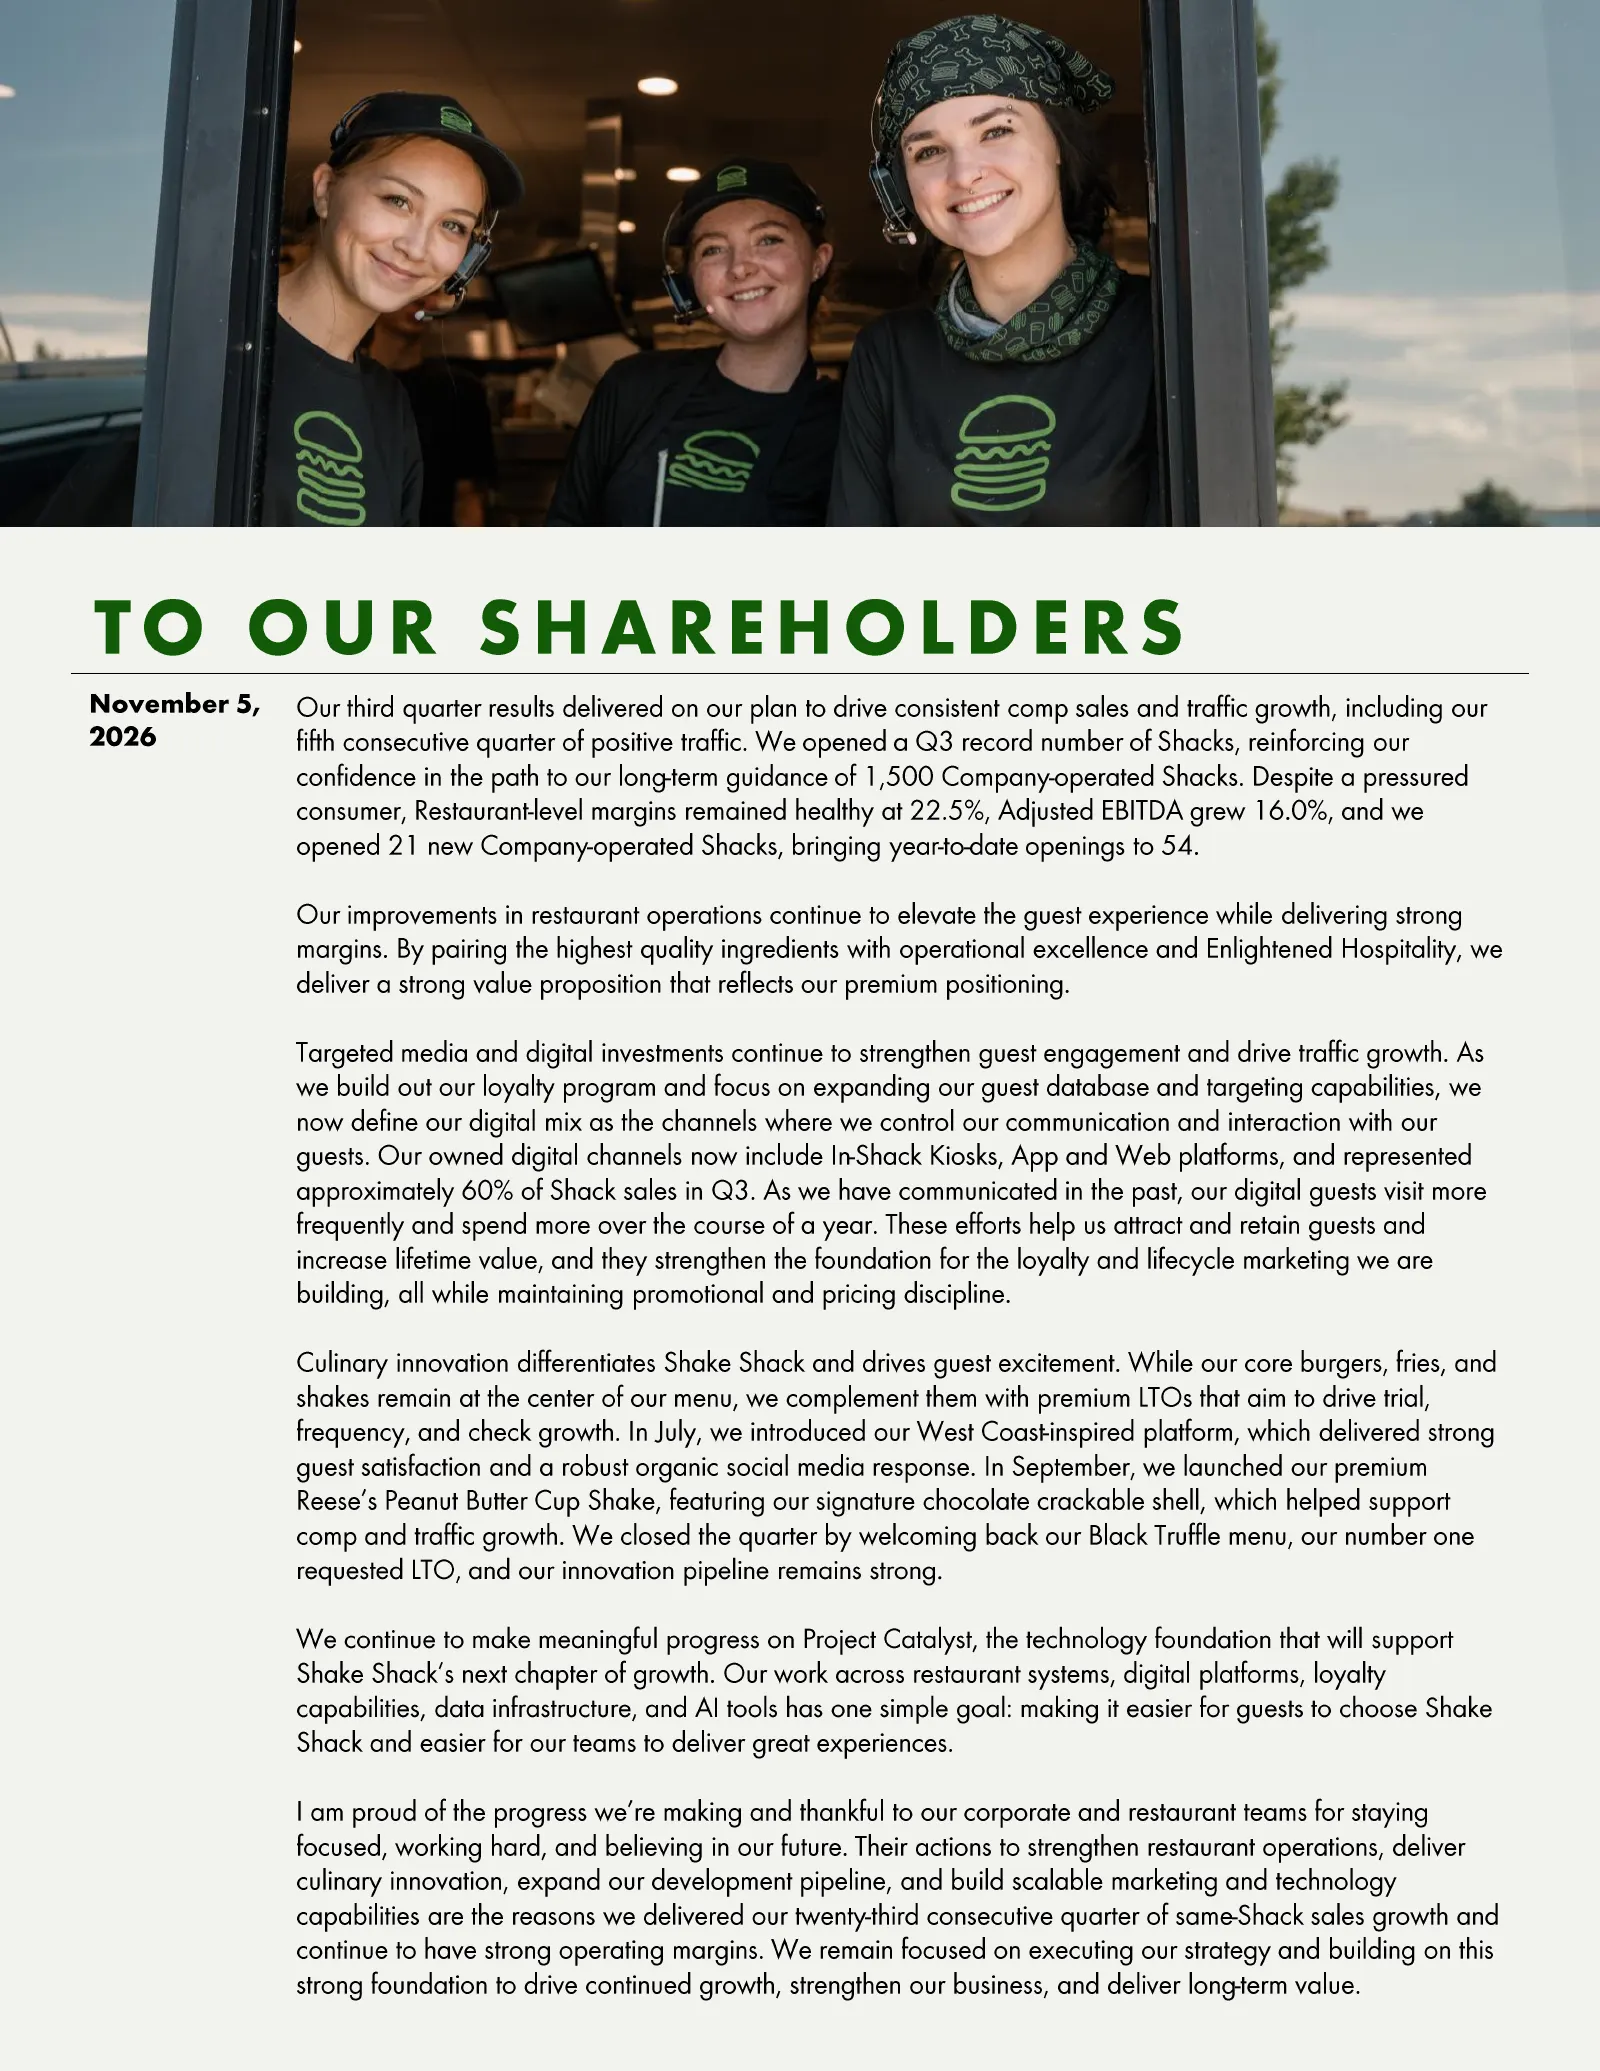
Slide 4: To Our Shareholders
TO OUR SHAREHOLDERS November 5, Our third quarter results delivered on our plan to drive consistent comp sales and traffic growth, including our 2026 fifth consecutive quarter of positive traffic. opened We a Q3 record numberof Shacks, reinforcing our confidence in the path to our long -term guidanc
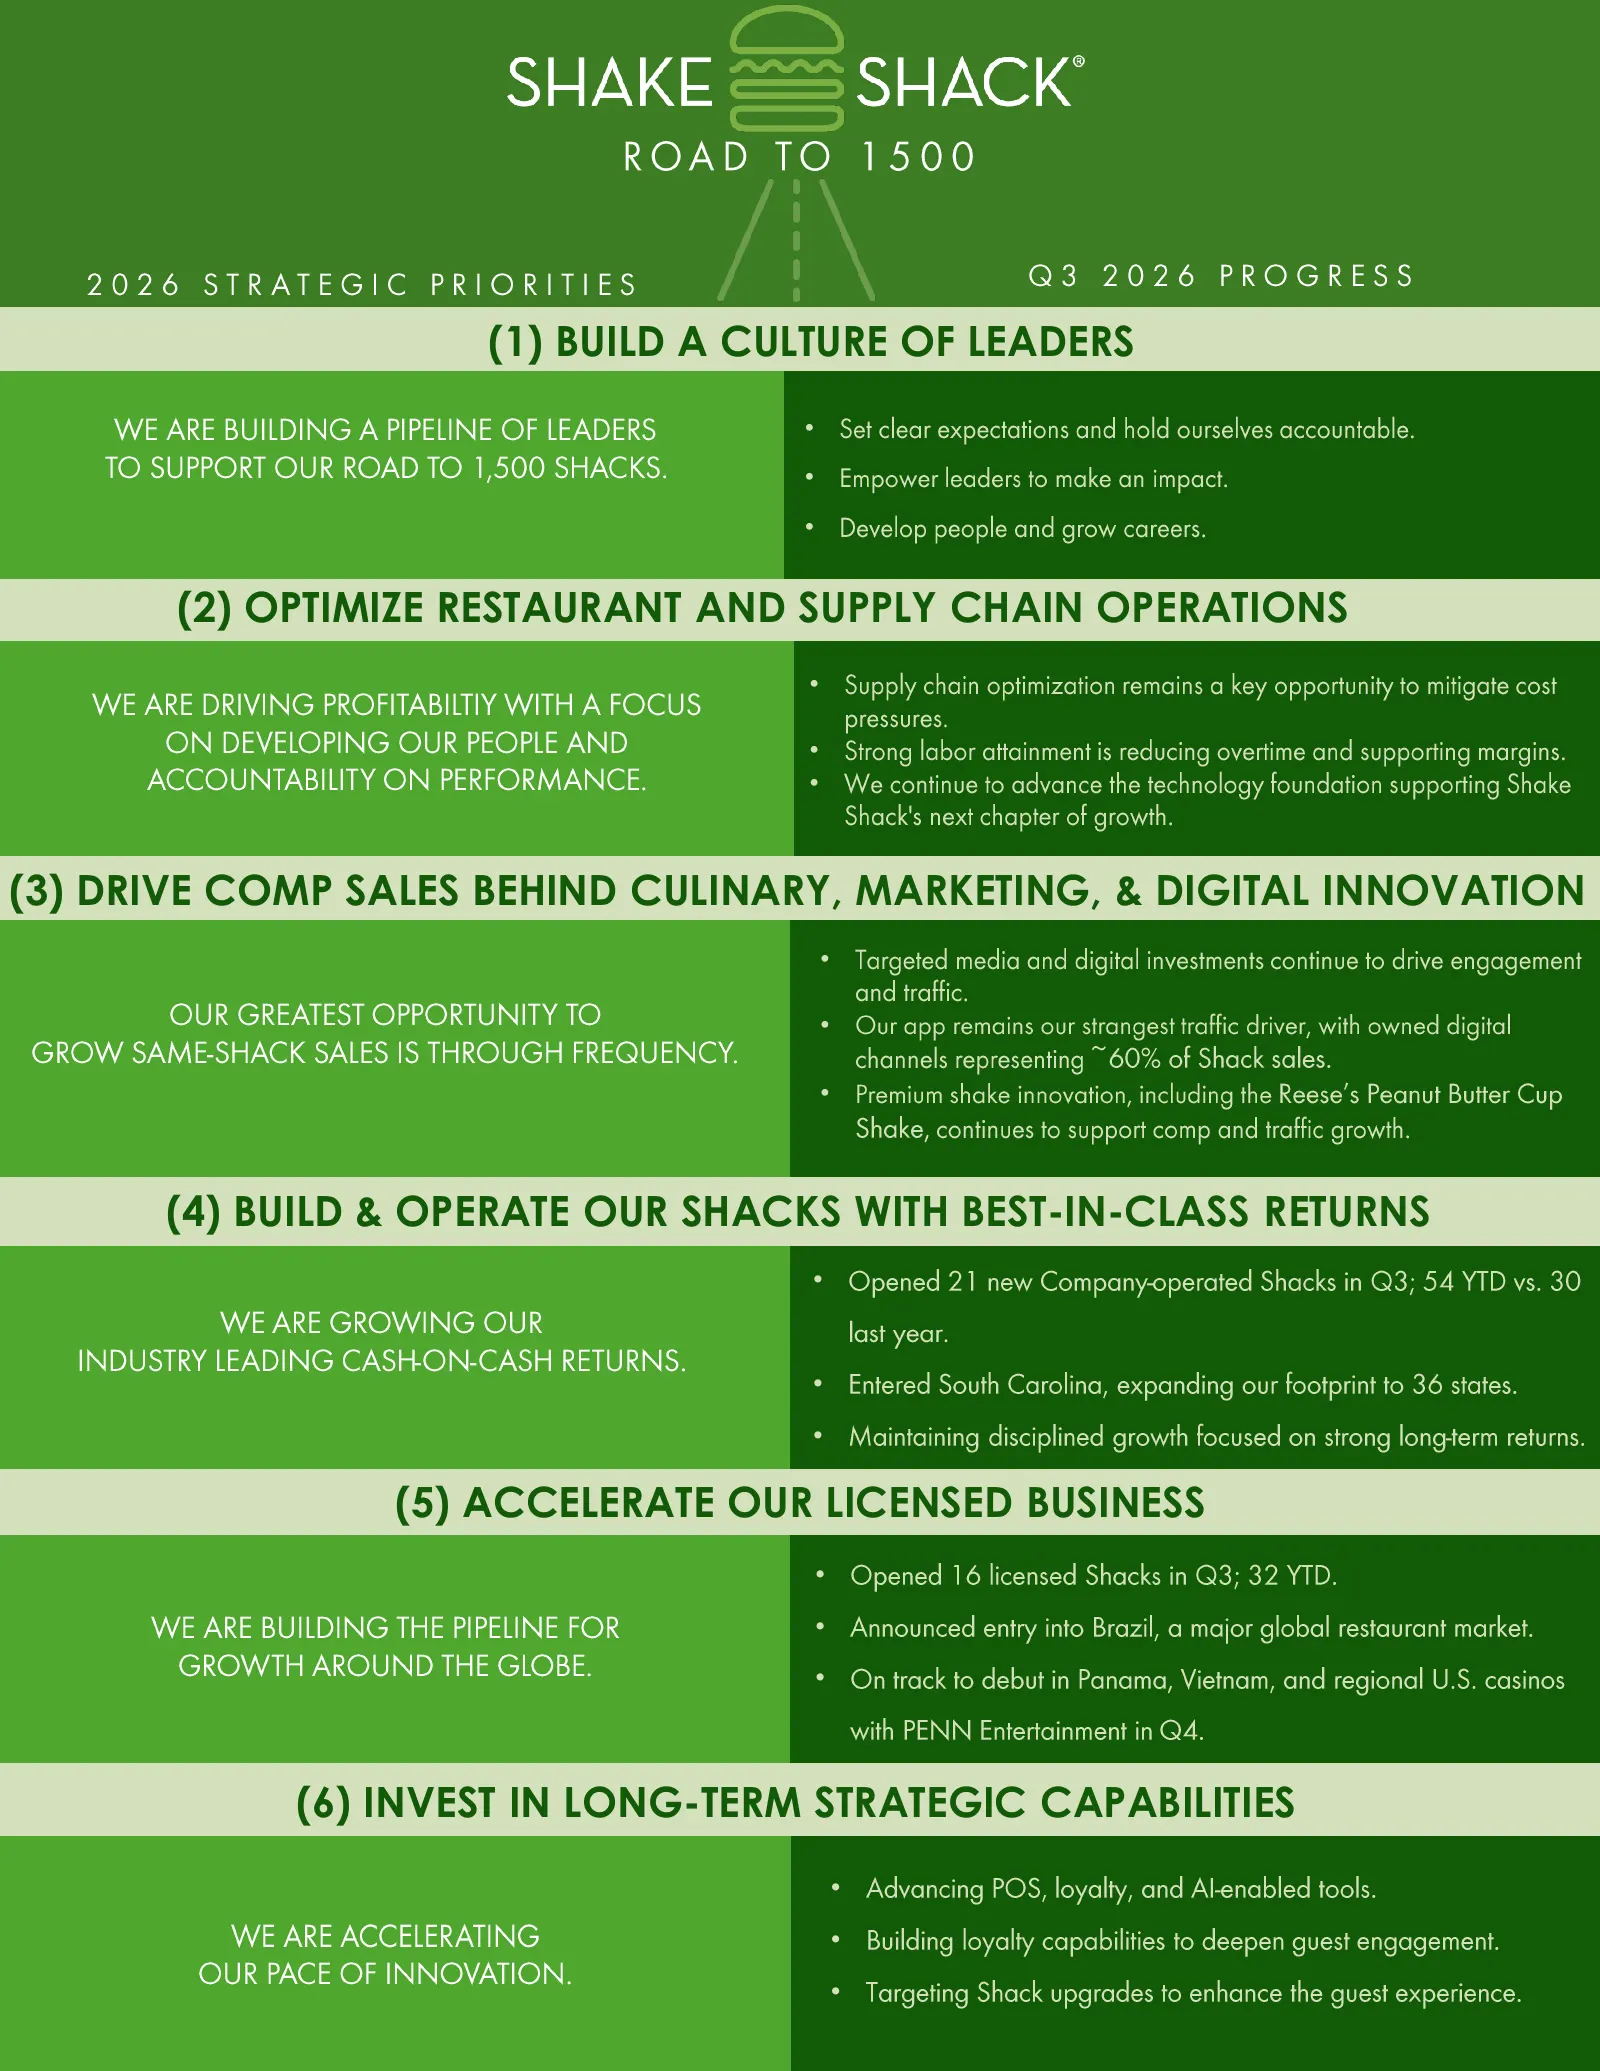
Slide 5: 2026 Strategic Priorities and Q3 Progress
ROAD TO 1500 2026 STRATEGIC PRIORITIES Q3 2026 PROGRESS (1) BUILD A CULTURE OF LEADERS WE ARE BUILDING A PIPELINE OF LEADERS • Set clear expectations and hold ourselves accountable. TO SUPPORT OUR ROAD TO 1,500 SHACKS. • Empower leaders to make an impact. • Develop people and grow careers. (2) OPTIM
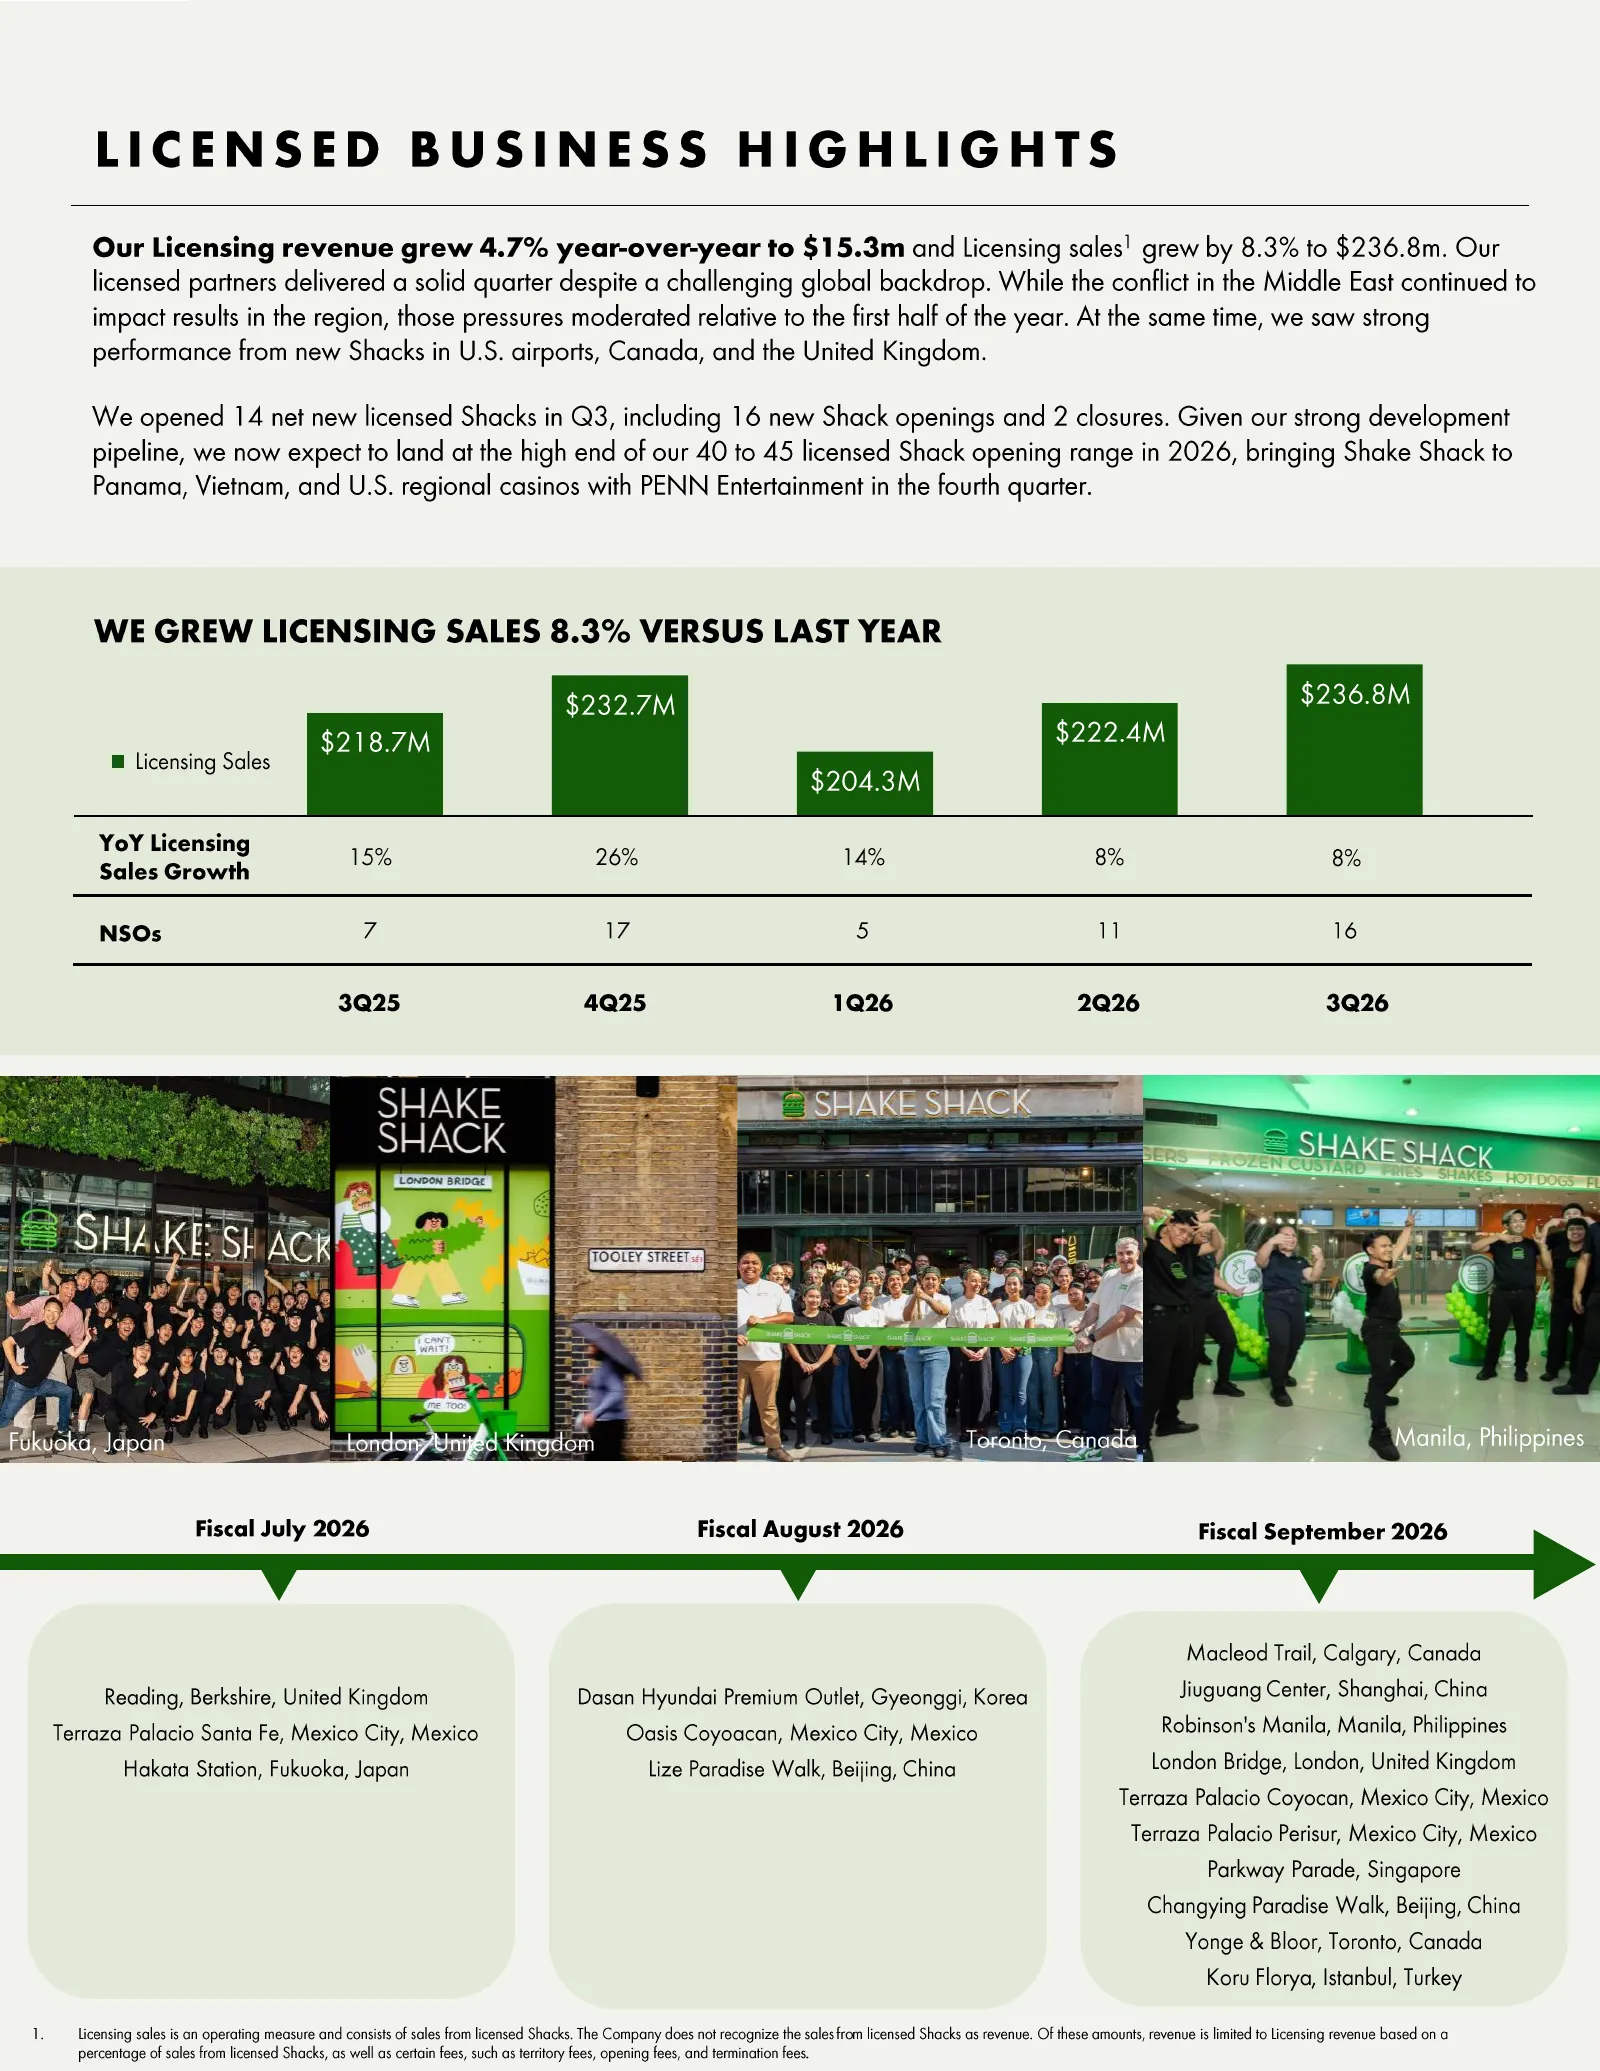
Slide 6: Licensed Business Highlights
LICENSED BUSINESS HIGHLIGHTS Our Licensing revenue grew 4.7% year -over -year to $15.3m and Licensing sales1 grew by 8.3% to $236.8m. Our licensed partners delivered a solid quarter despite a challenging global backdrop. While the conflict in the Middle East inued cont to impact results in the regio
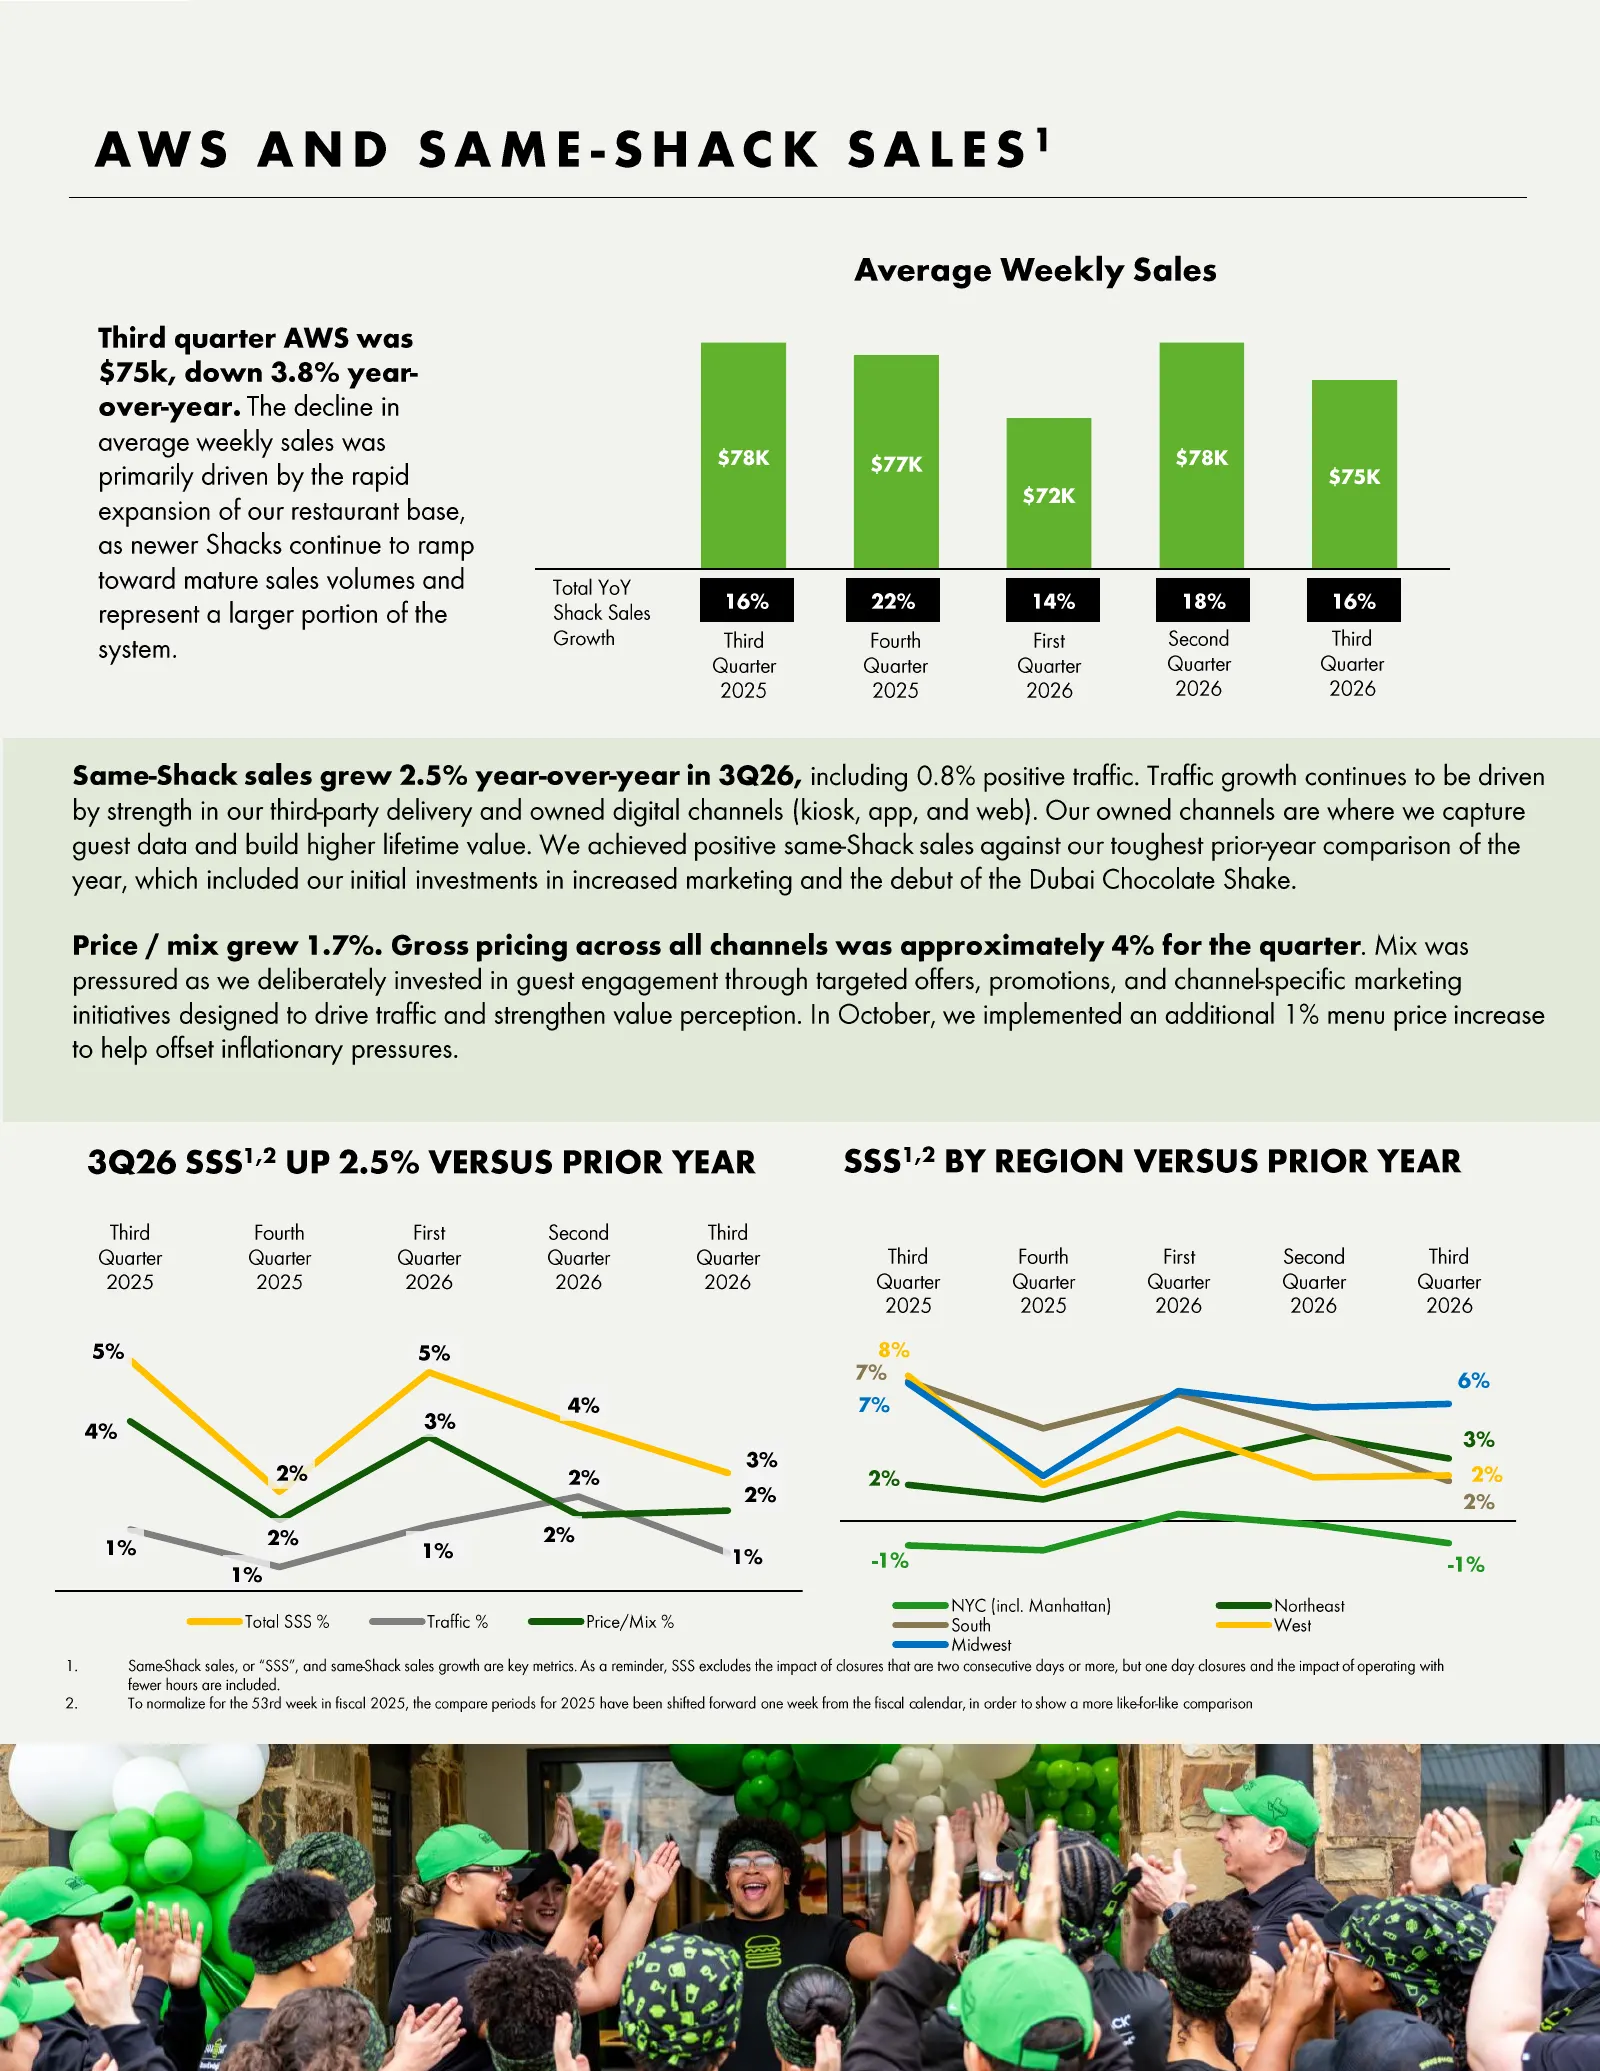
Slide 7: AWS and Same-Shack Sales
AWS AND SAME - SHACK SALES 1 Average Weekly Sales Third quarter AWS was $75k, down 3.8% year - over -year. The decline in average weekly sales was $78K $77K $78K primarily driven by the rapid $75K $72K expansion of our restaurant base, as newer Shacks continue to ramp toward mature sales volumes and
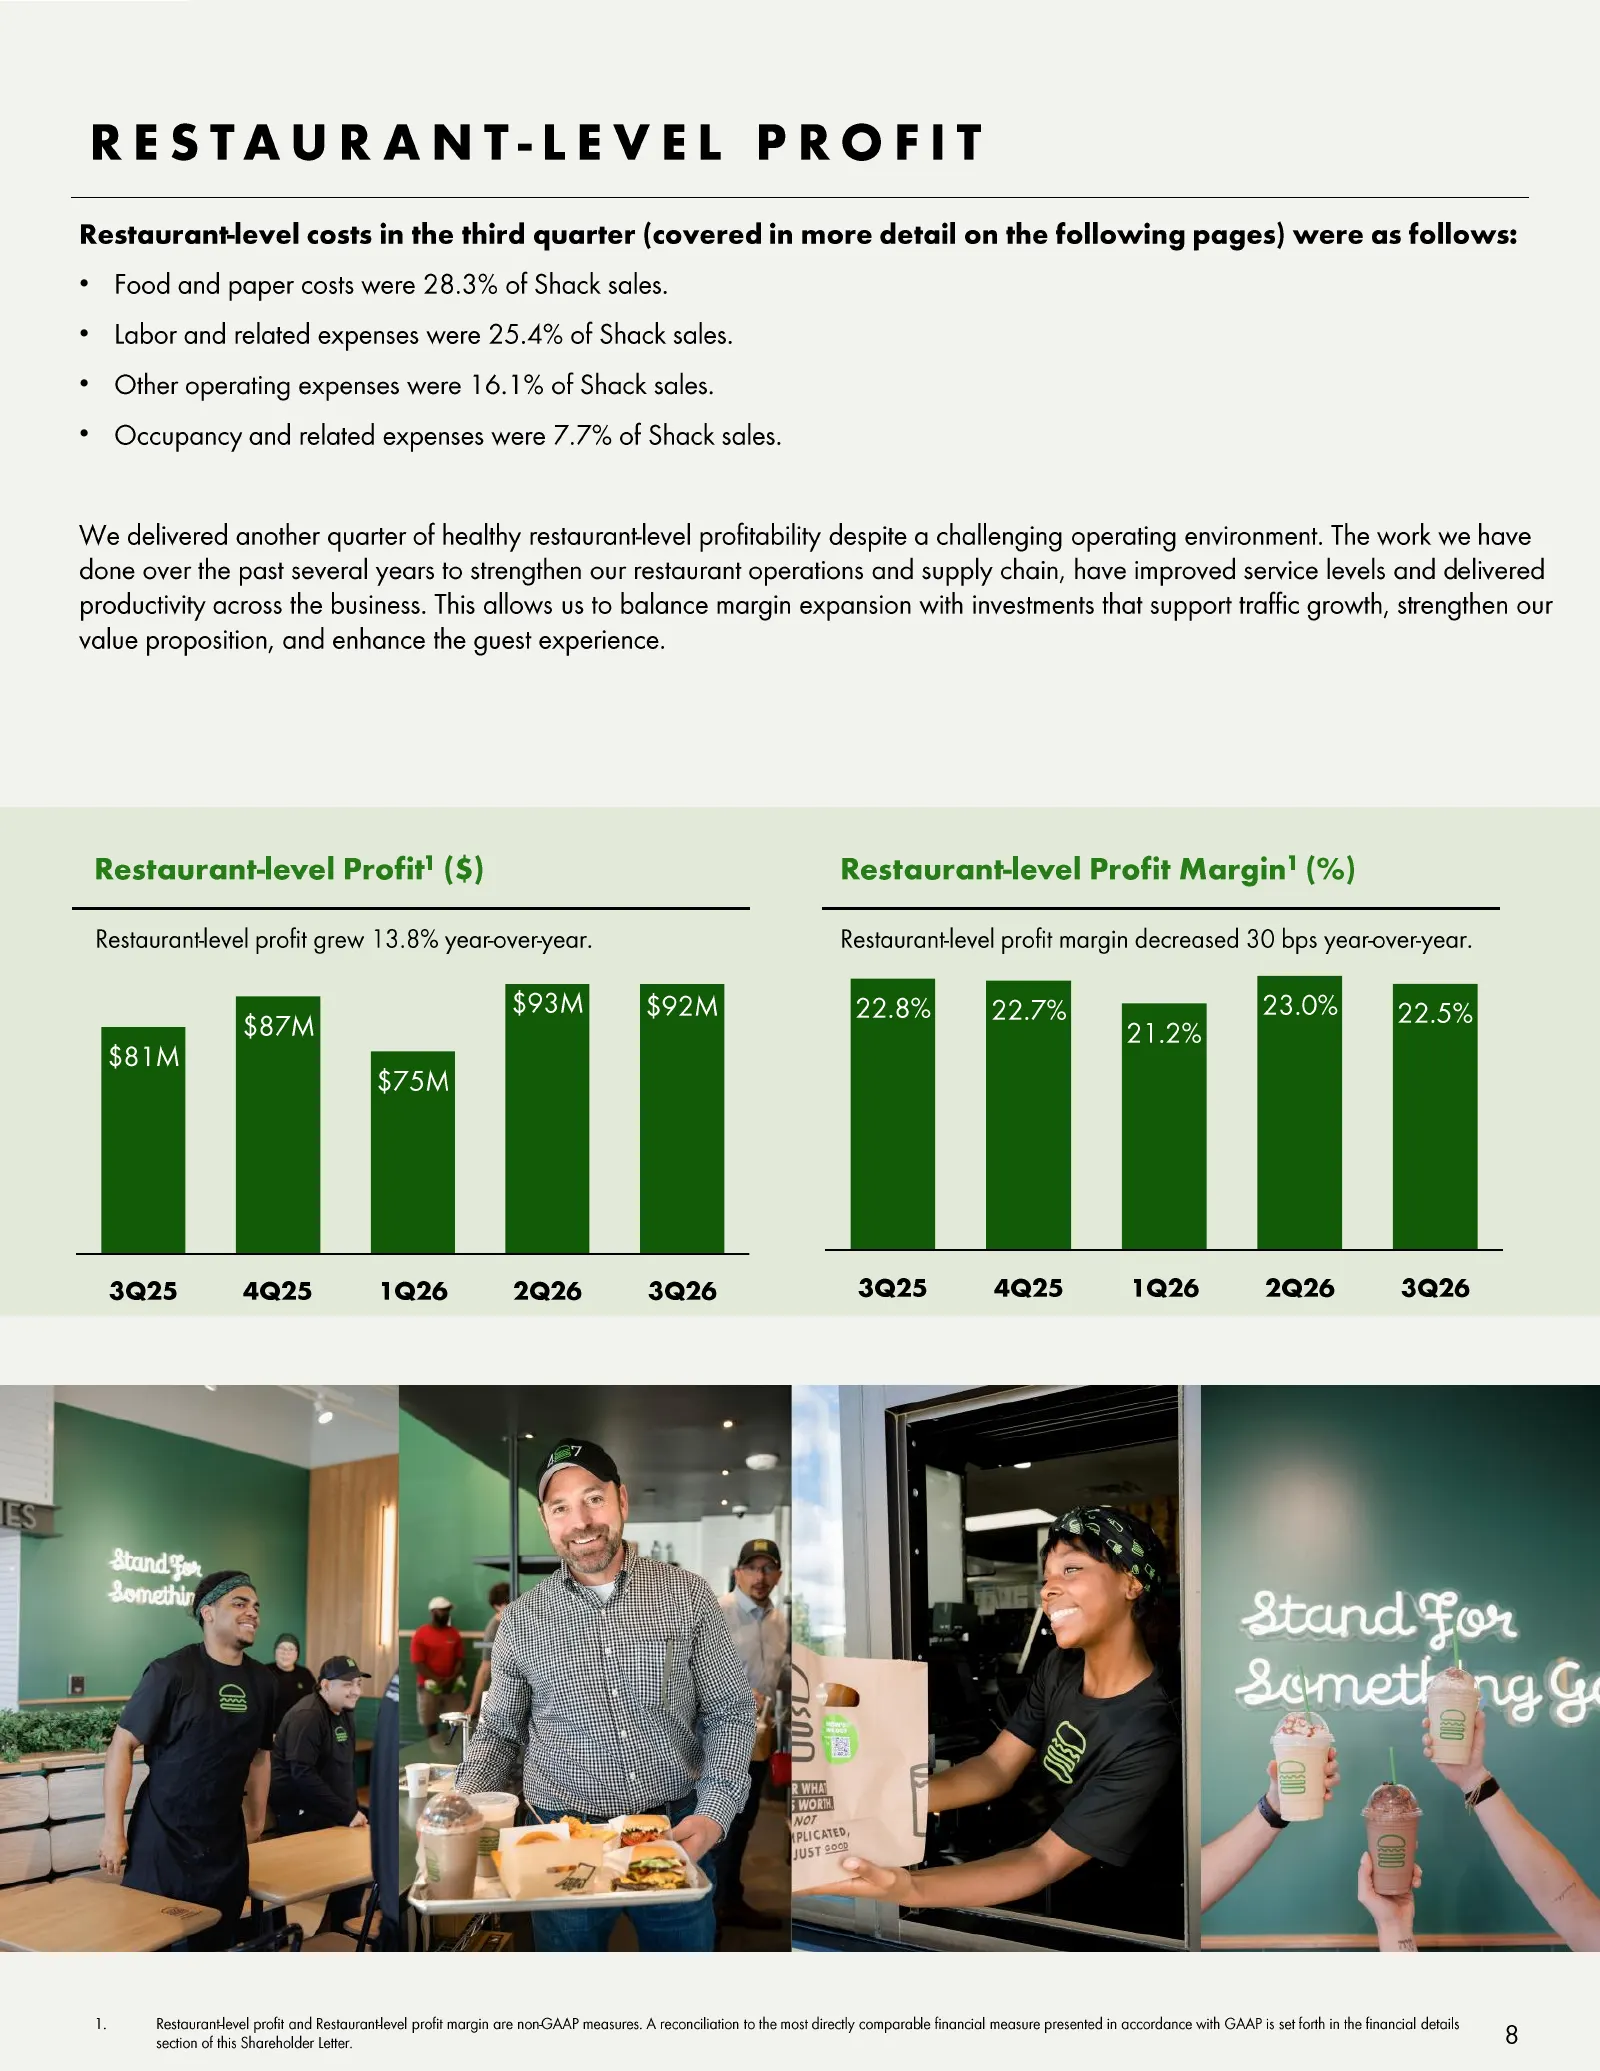
Slide 8: Restaurant-Level Profit
RESTAURANT - LEVEL PROFIT Restaurant -level costs in the third quarter (covered in more detail on the following pages) were as follows: • Food and paper costs were 28.3% of Shack sales. • Labor and related expenses were 25.4% of Shack sales. • Other operating expenses were 16.1% of Shack sales. • Oc
Slide 9: Restaurant-Level Profit: Food & Paper Costs
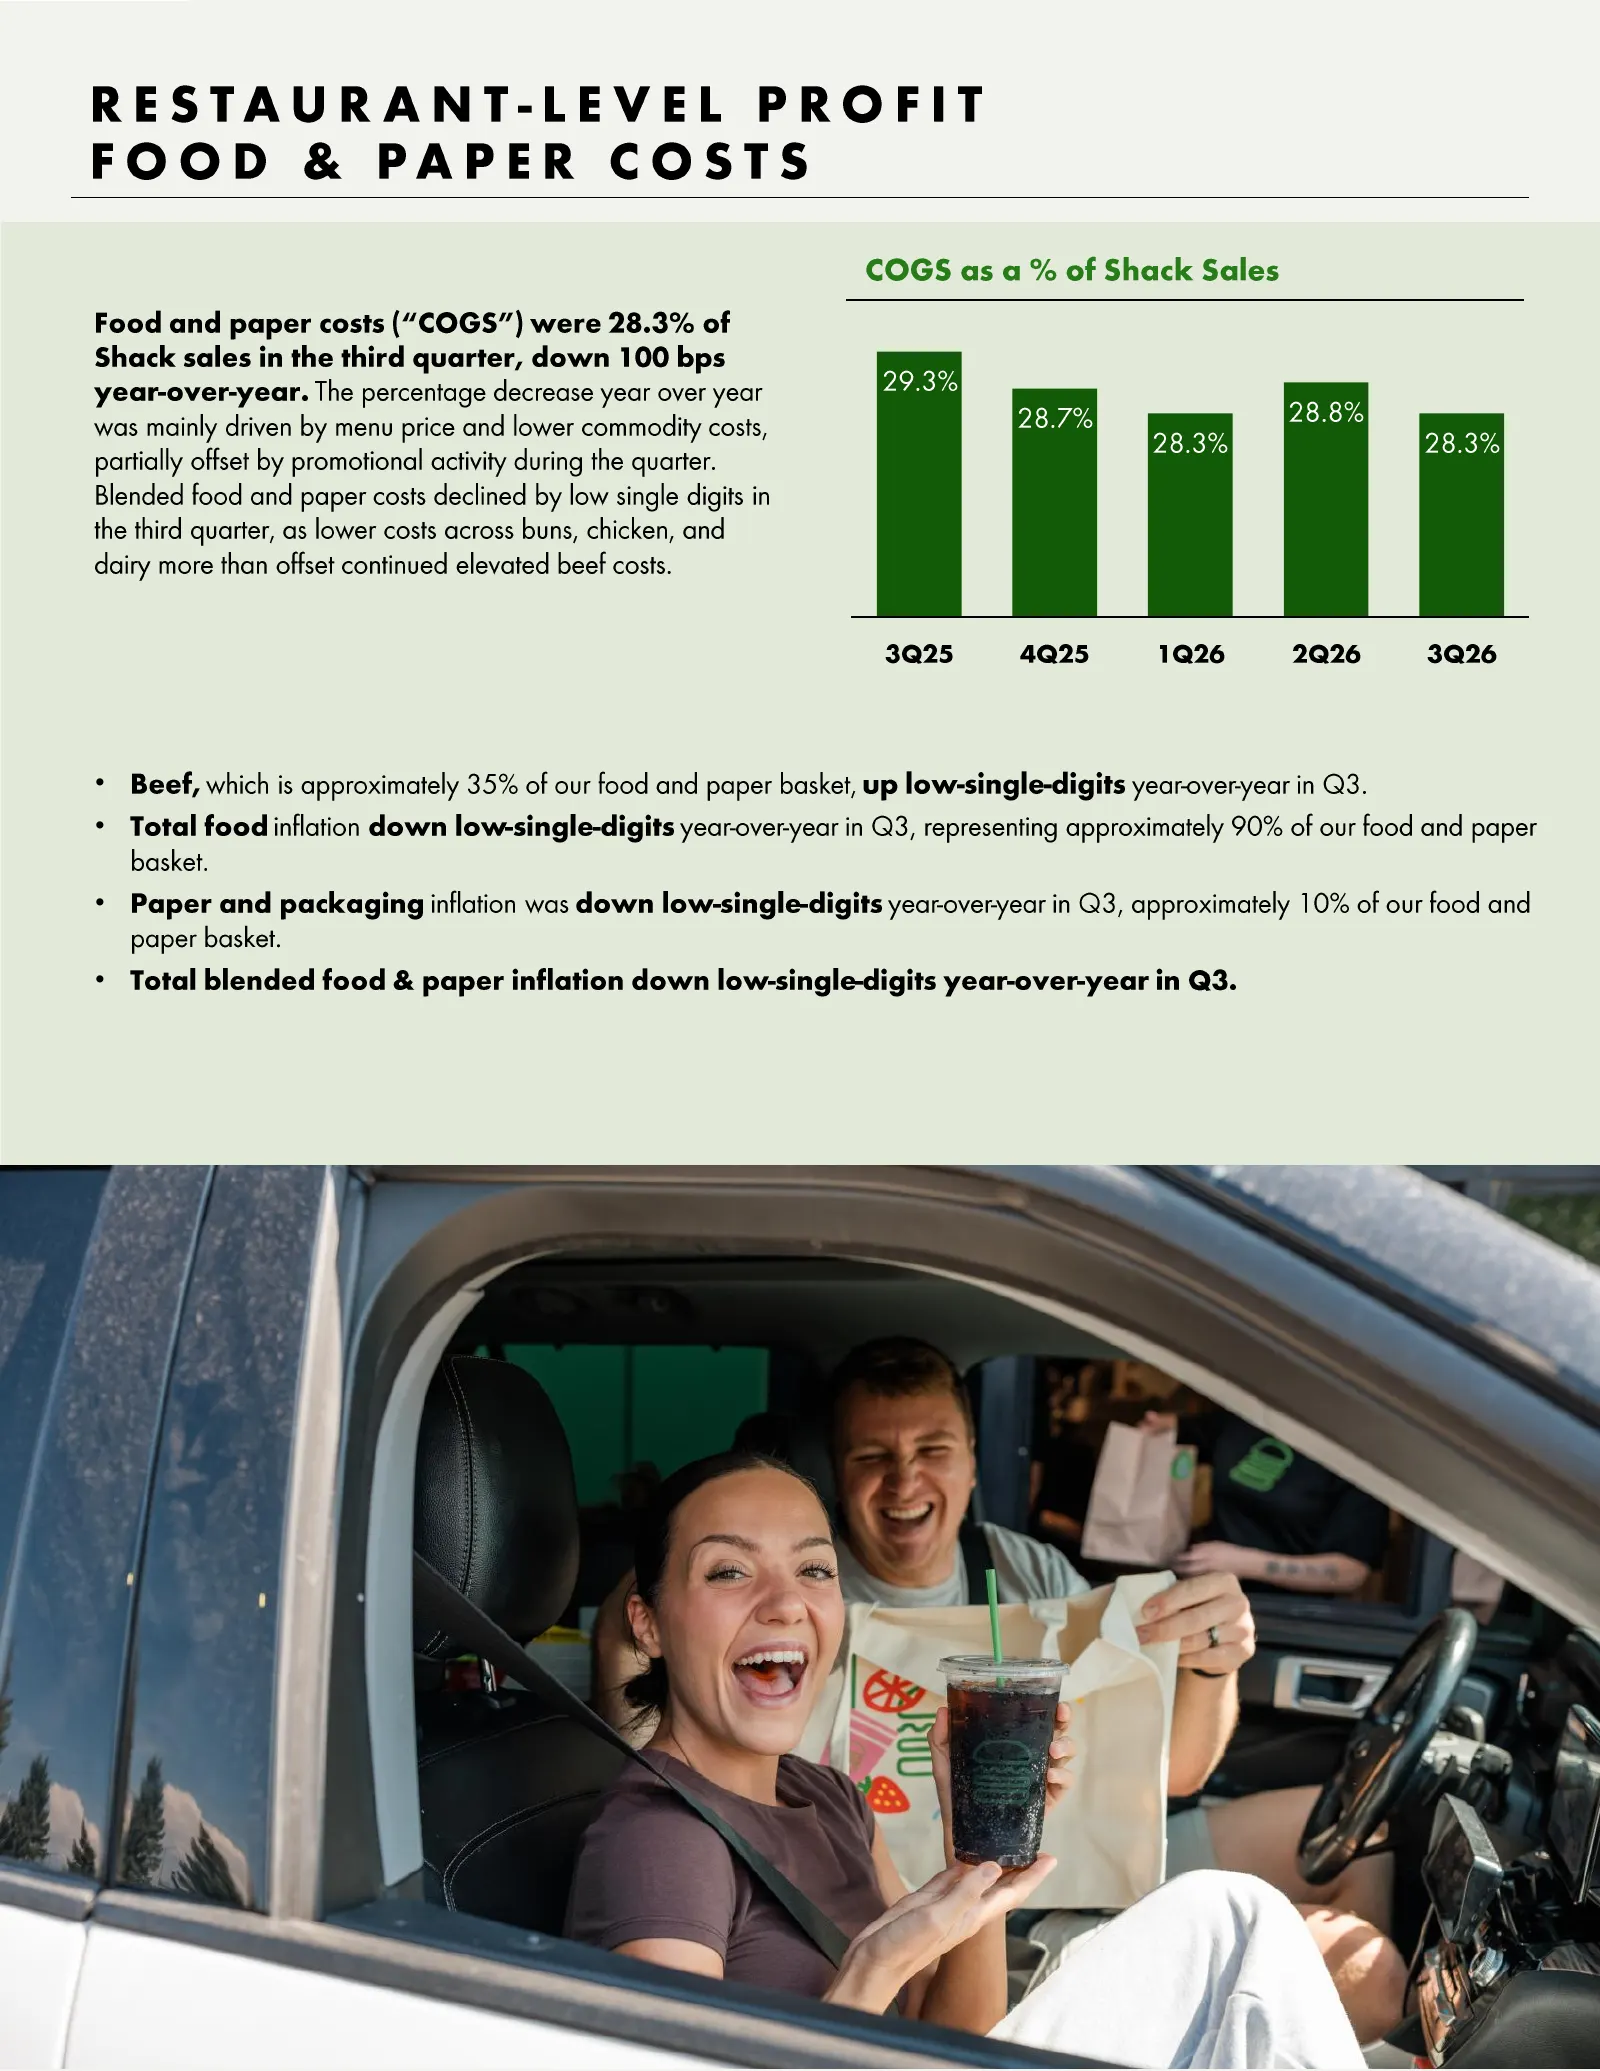
RESTAURANT - LEVEL PROFIT FOOD & PAPER COSTS COGS as a % of Shack Sales Food and paper costs (“COGS”) were 28.3% of Shack sales in the third quarter, down 100 bps year -over -year. The percentage decrease year over year 29.3% was mainly driven by menu price and lower commodity costs, 28.7% 28.8% 28.
Slide 10: Restaurant-Level Profit: Labor, Other Opex & Occupancy
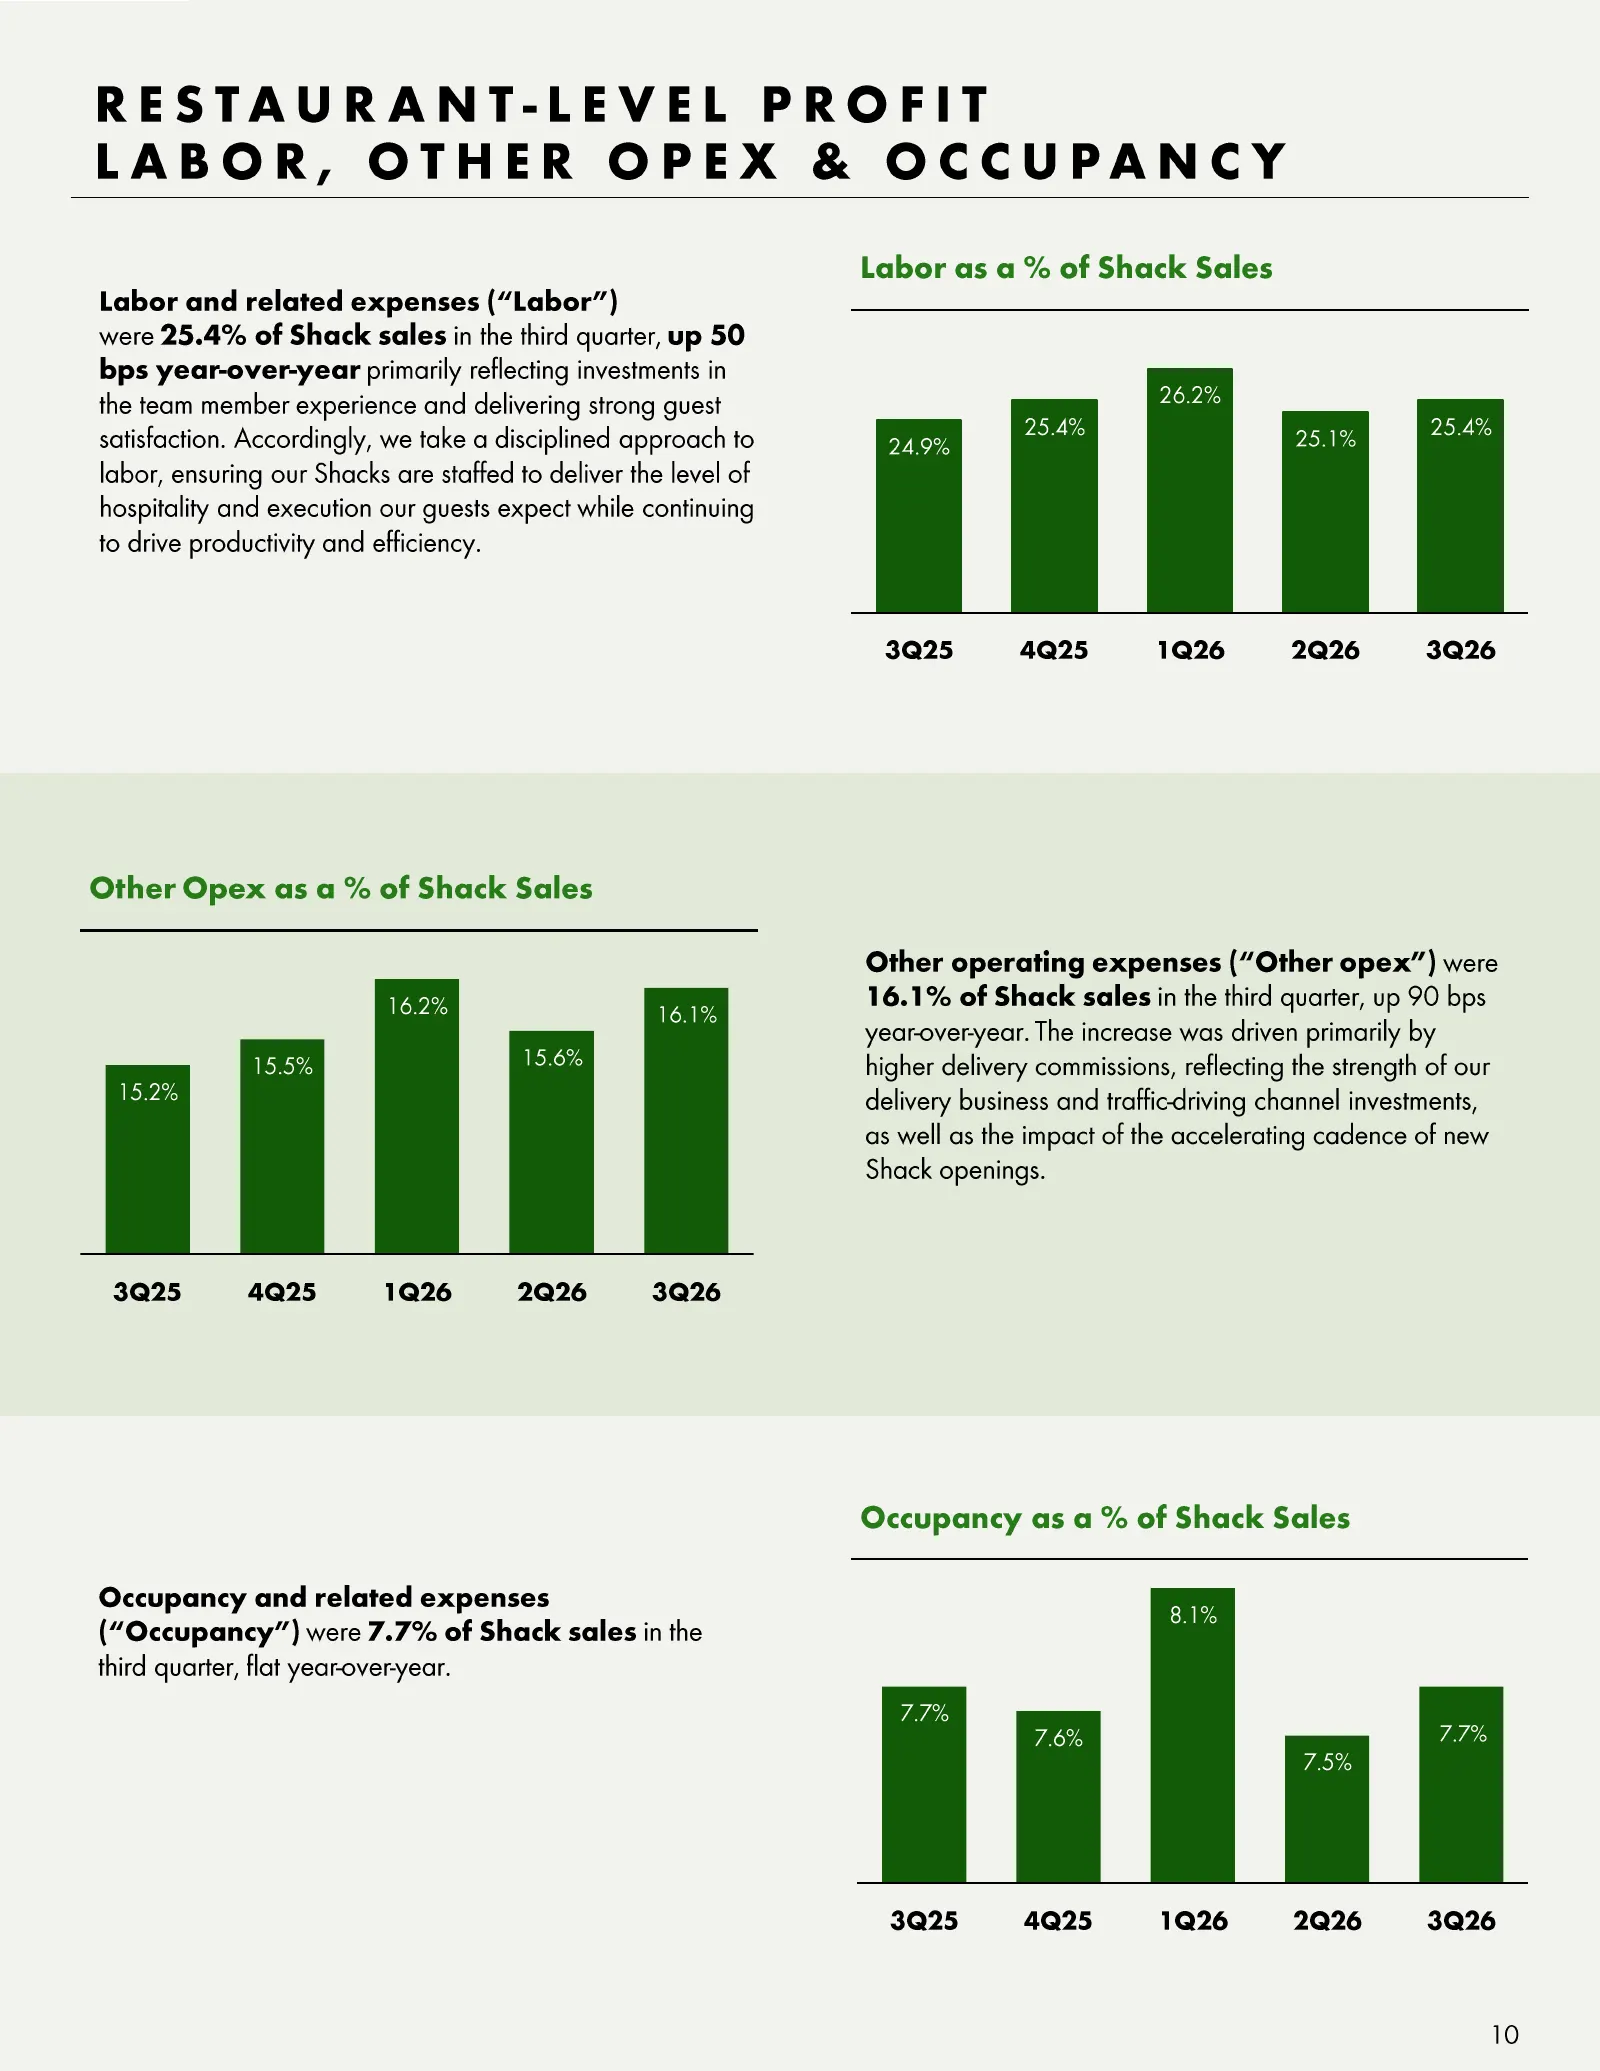
RESTAURANT - LEVEL PROFIT LABOR, OTHER OPEX & OCCUPANCY Labor as a % of Shack Sales Labor and related expenses (“Labor”) were25.4% of Shack sales in the third quarter, up 50 bps year -over -year primarily reflecting investments in the team member experience and delivering strong guest 26.2% 25.4% 25
Slide 11: Additional Expenses & Adjusted EBITDA
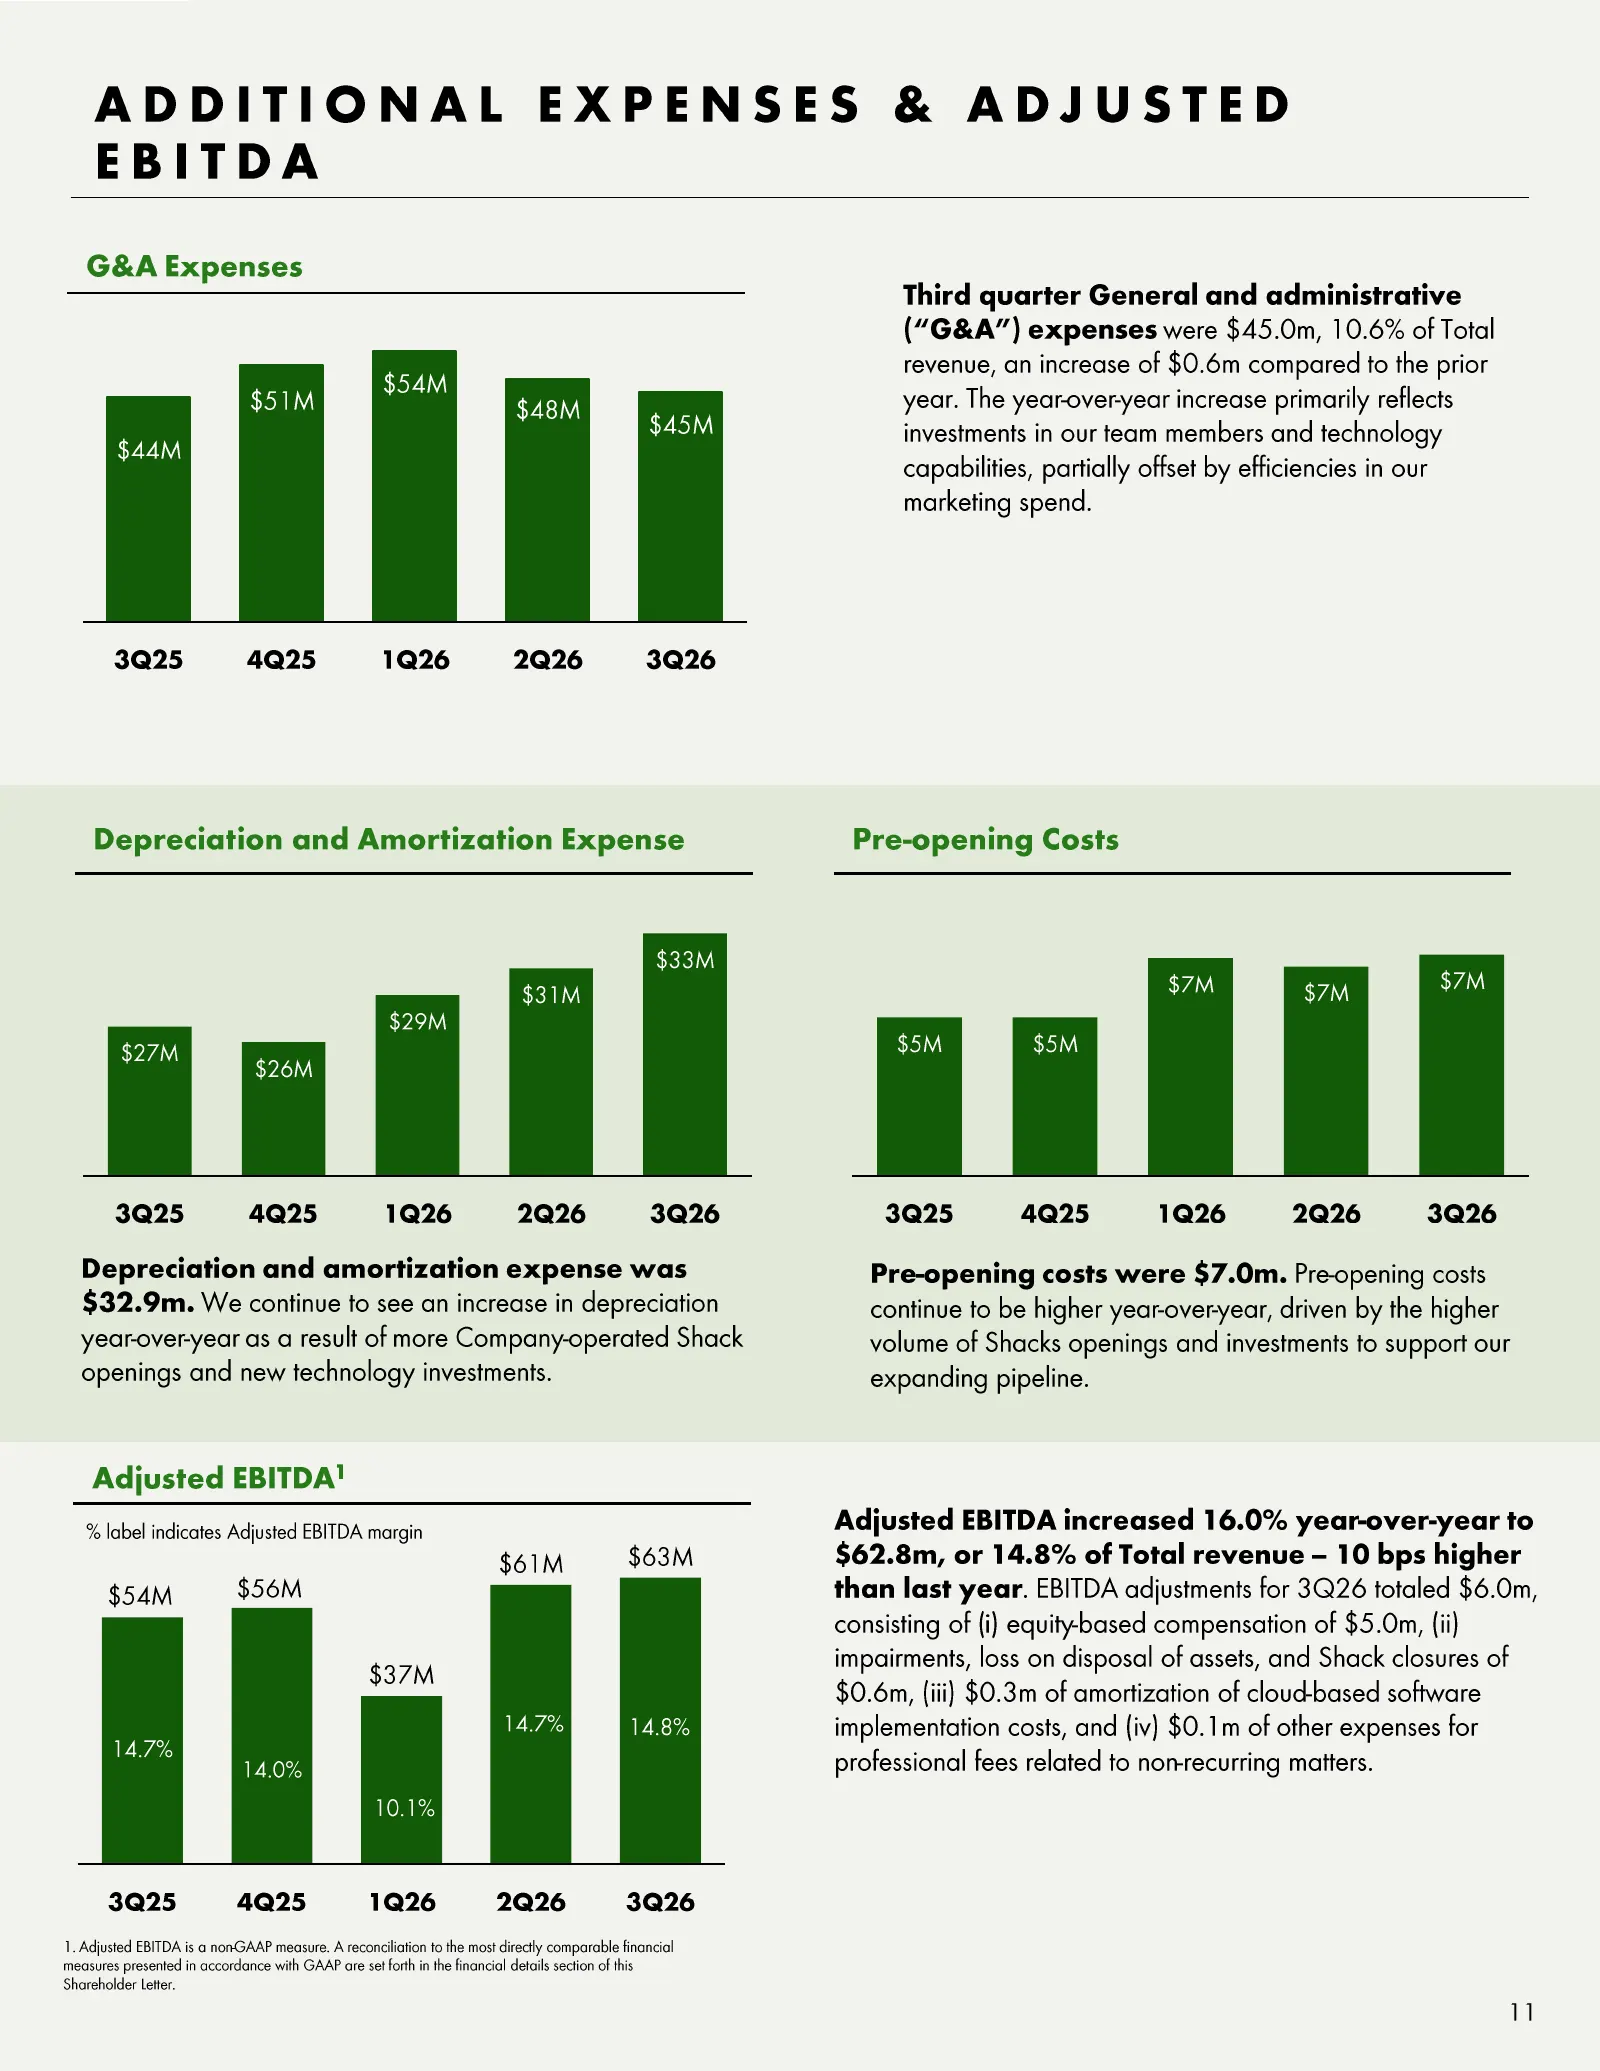
ADDITIONAL EXPENSES & ADJUSTED EBITDA G&A Expenses Third quarter General and administrative (“G&A”) expenses were $45.0m, 10.6% of Total revenue, an increase of $0.6m compared to the prior $54M $51M $48M year. The year-over-year increase primarily reflects $45M investments in our team members and te
Slide 12: Our 2026 Priorities and Mission
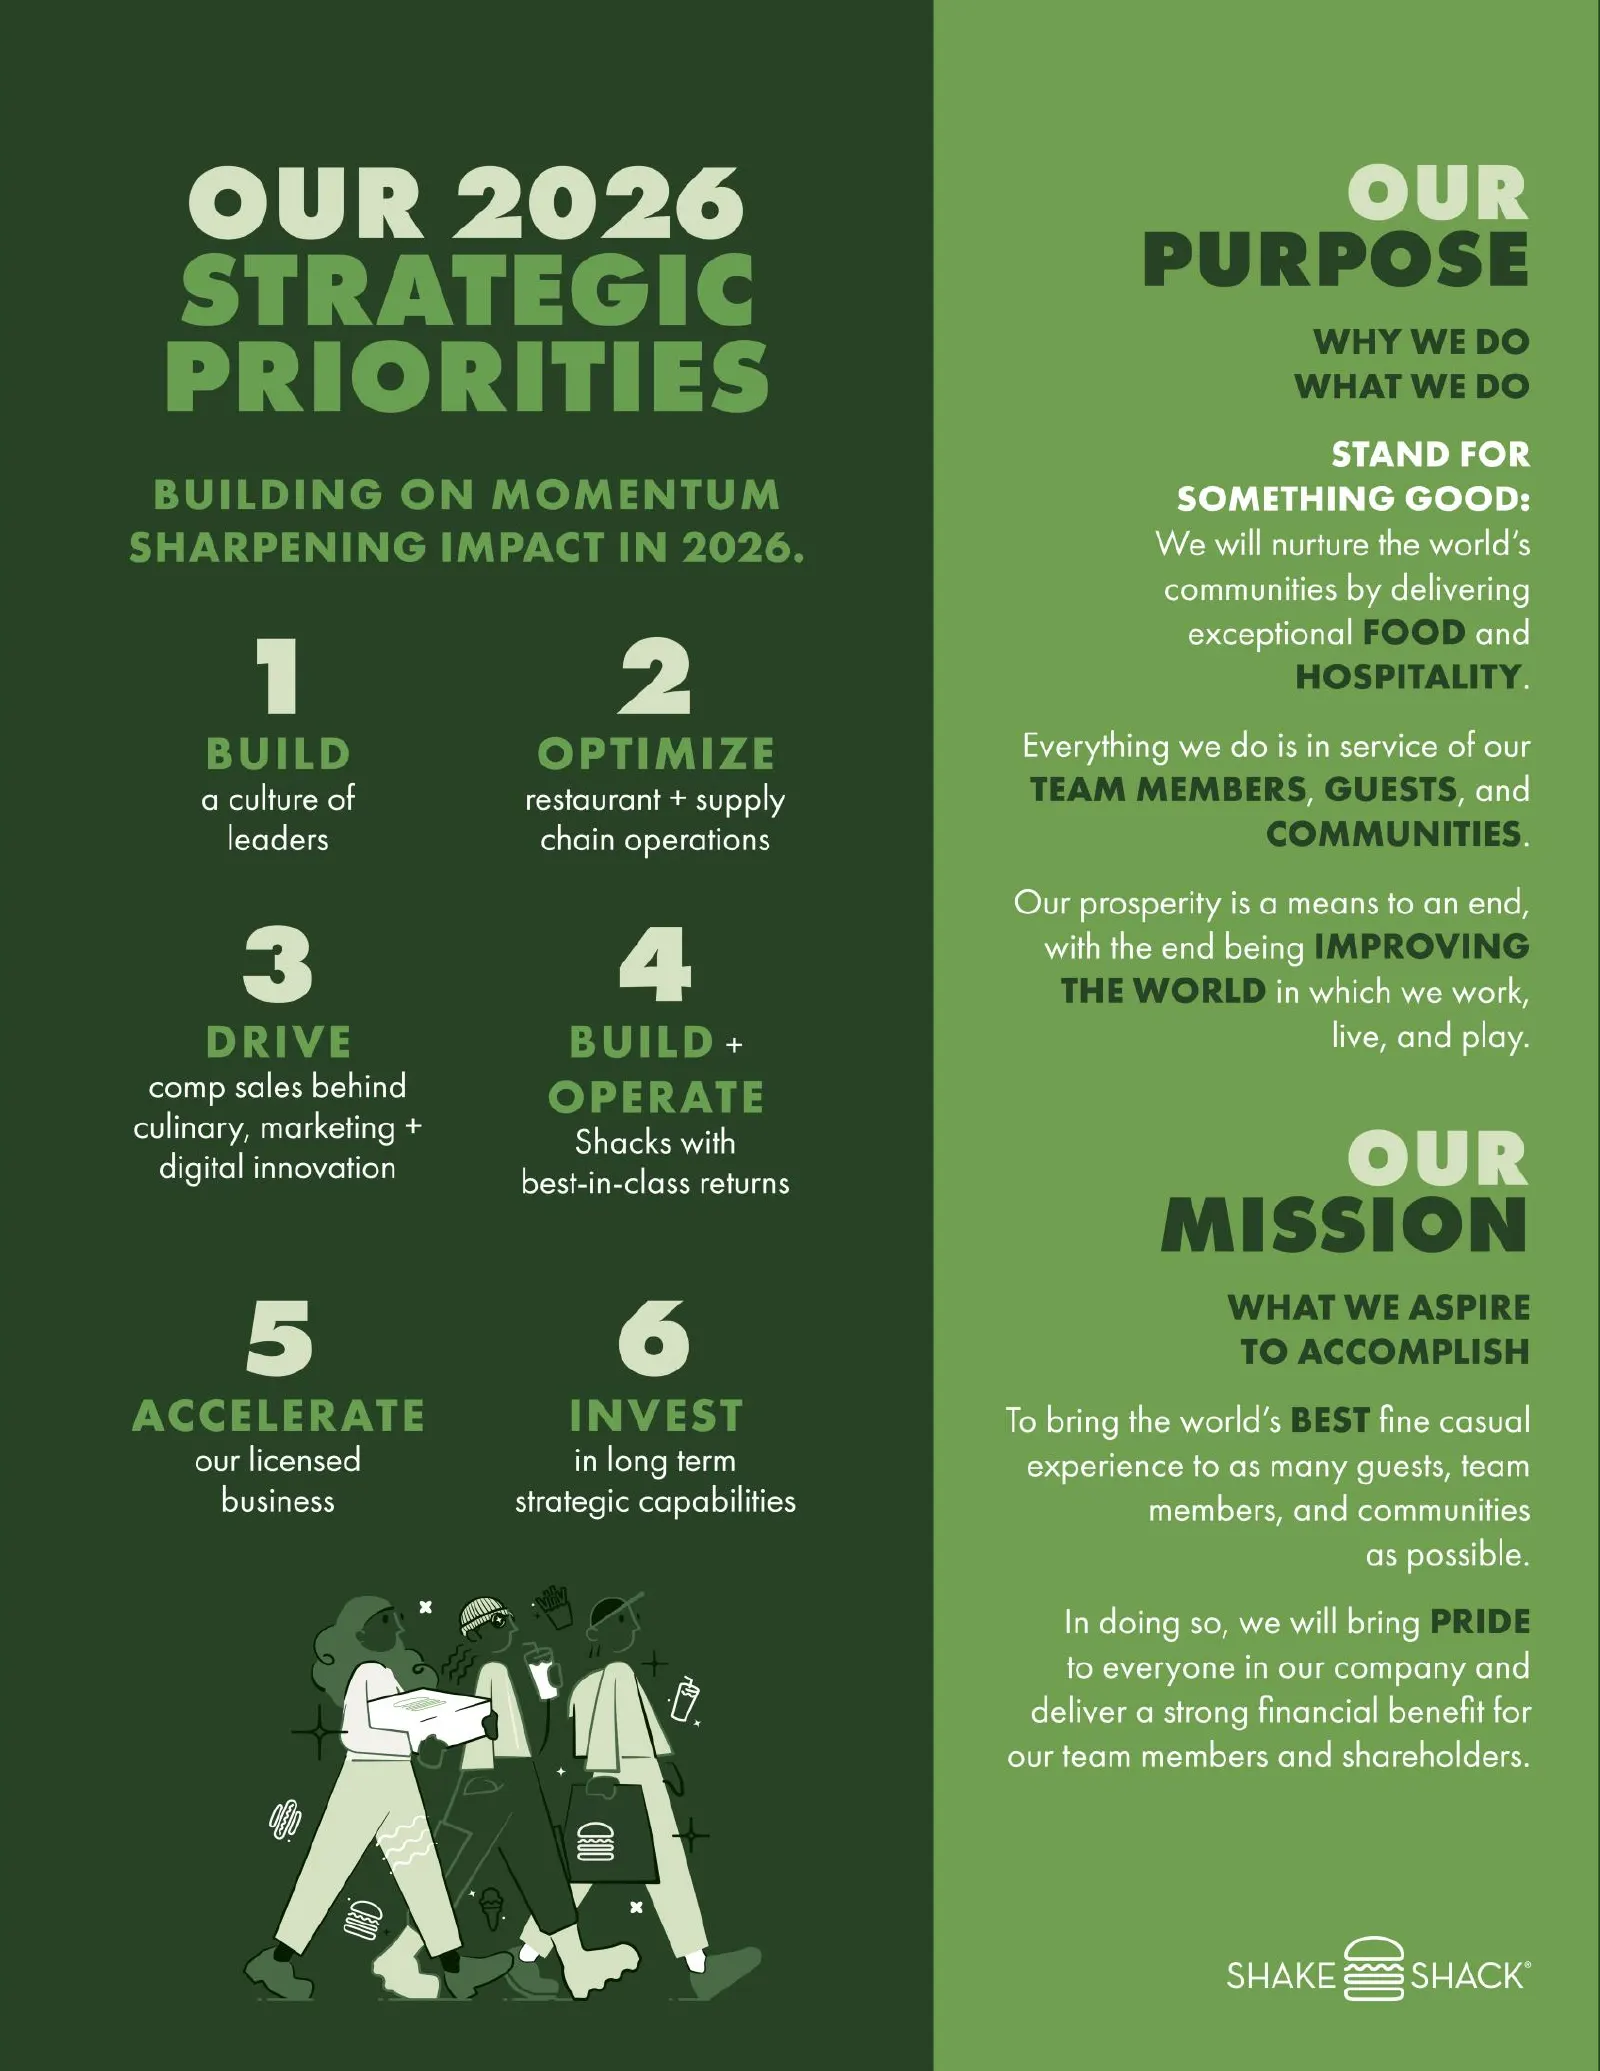
OUR 2026 a culture of leaders 3 comp sales behind culinary, marketing + digital innovation our licensed business 2 restaurant + supply chain operations és Shacks with best-in-class returns @ in long term strategic capabilities STAND FOR SOMETHING GOOD: We will nurture the world’s communities by deli
Slide 13: Financial Outlook
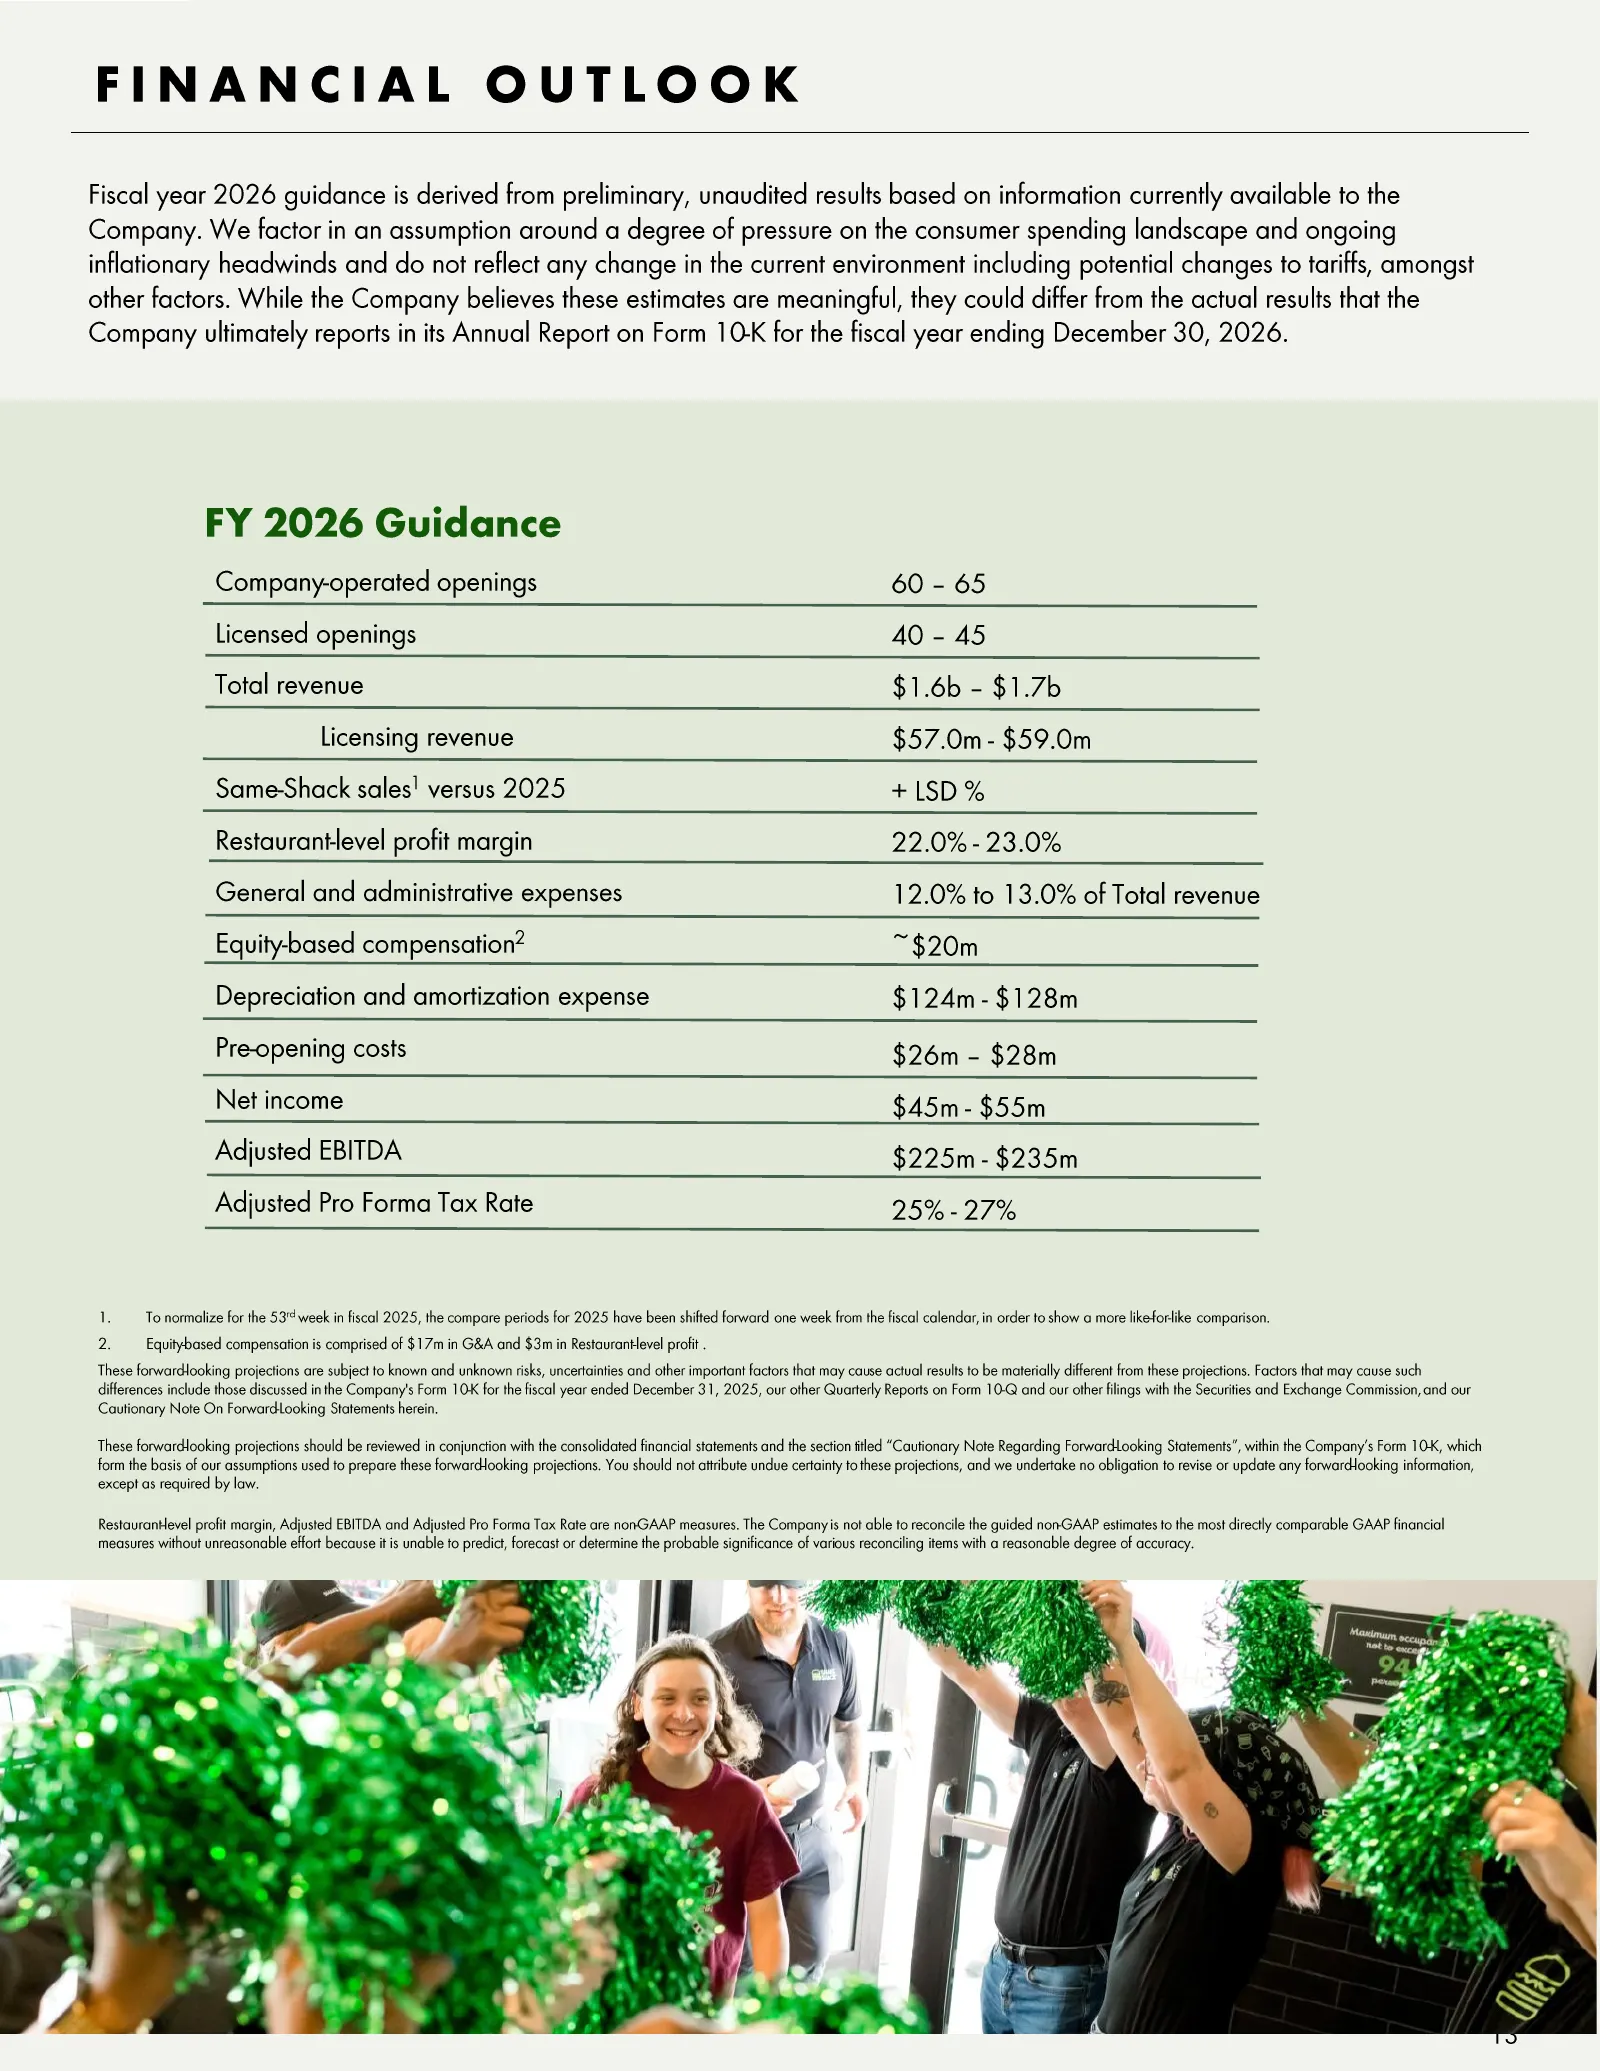
FINANCIAL OUTLOOK Fiscal year 2026 guidance is derived from preliminary, unaudited results based on information currently available to the Company. We factor in an assumption around a degree of pressure on the consumer spending landscape and ongoing inflationary headwinds and do not reflect any chan
Slide 14: Financial Details & Definitions
Financial Details & Definitions
Slide 15: Cautionary Note on Forward-Looking Statements
CAUTIONARY NOTE ON FORWARD -LOOKING STATEMENTS This presentation contains forward -looking statements, within the meaning of the Private Securities Litigation Reform Act of 1995, which are subject to known and unknown risks, uncertainties and other important factors that may cause actual results to
Slide 16: Definitions
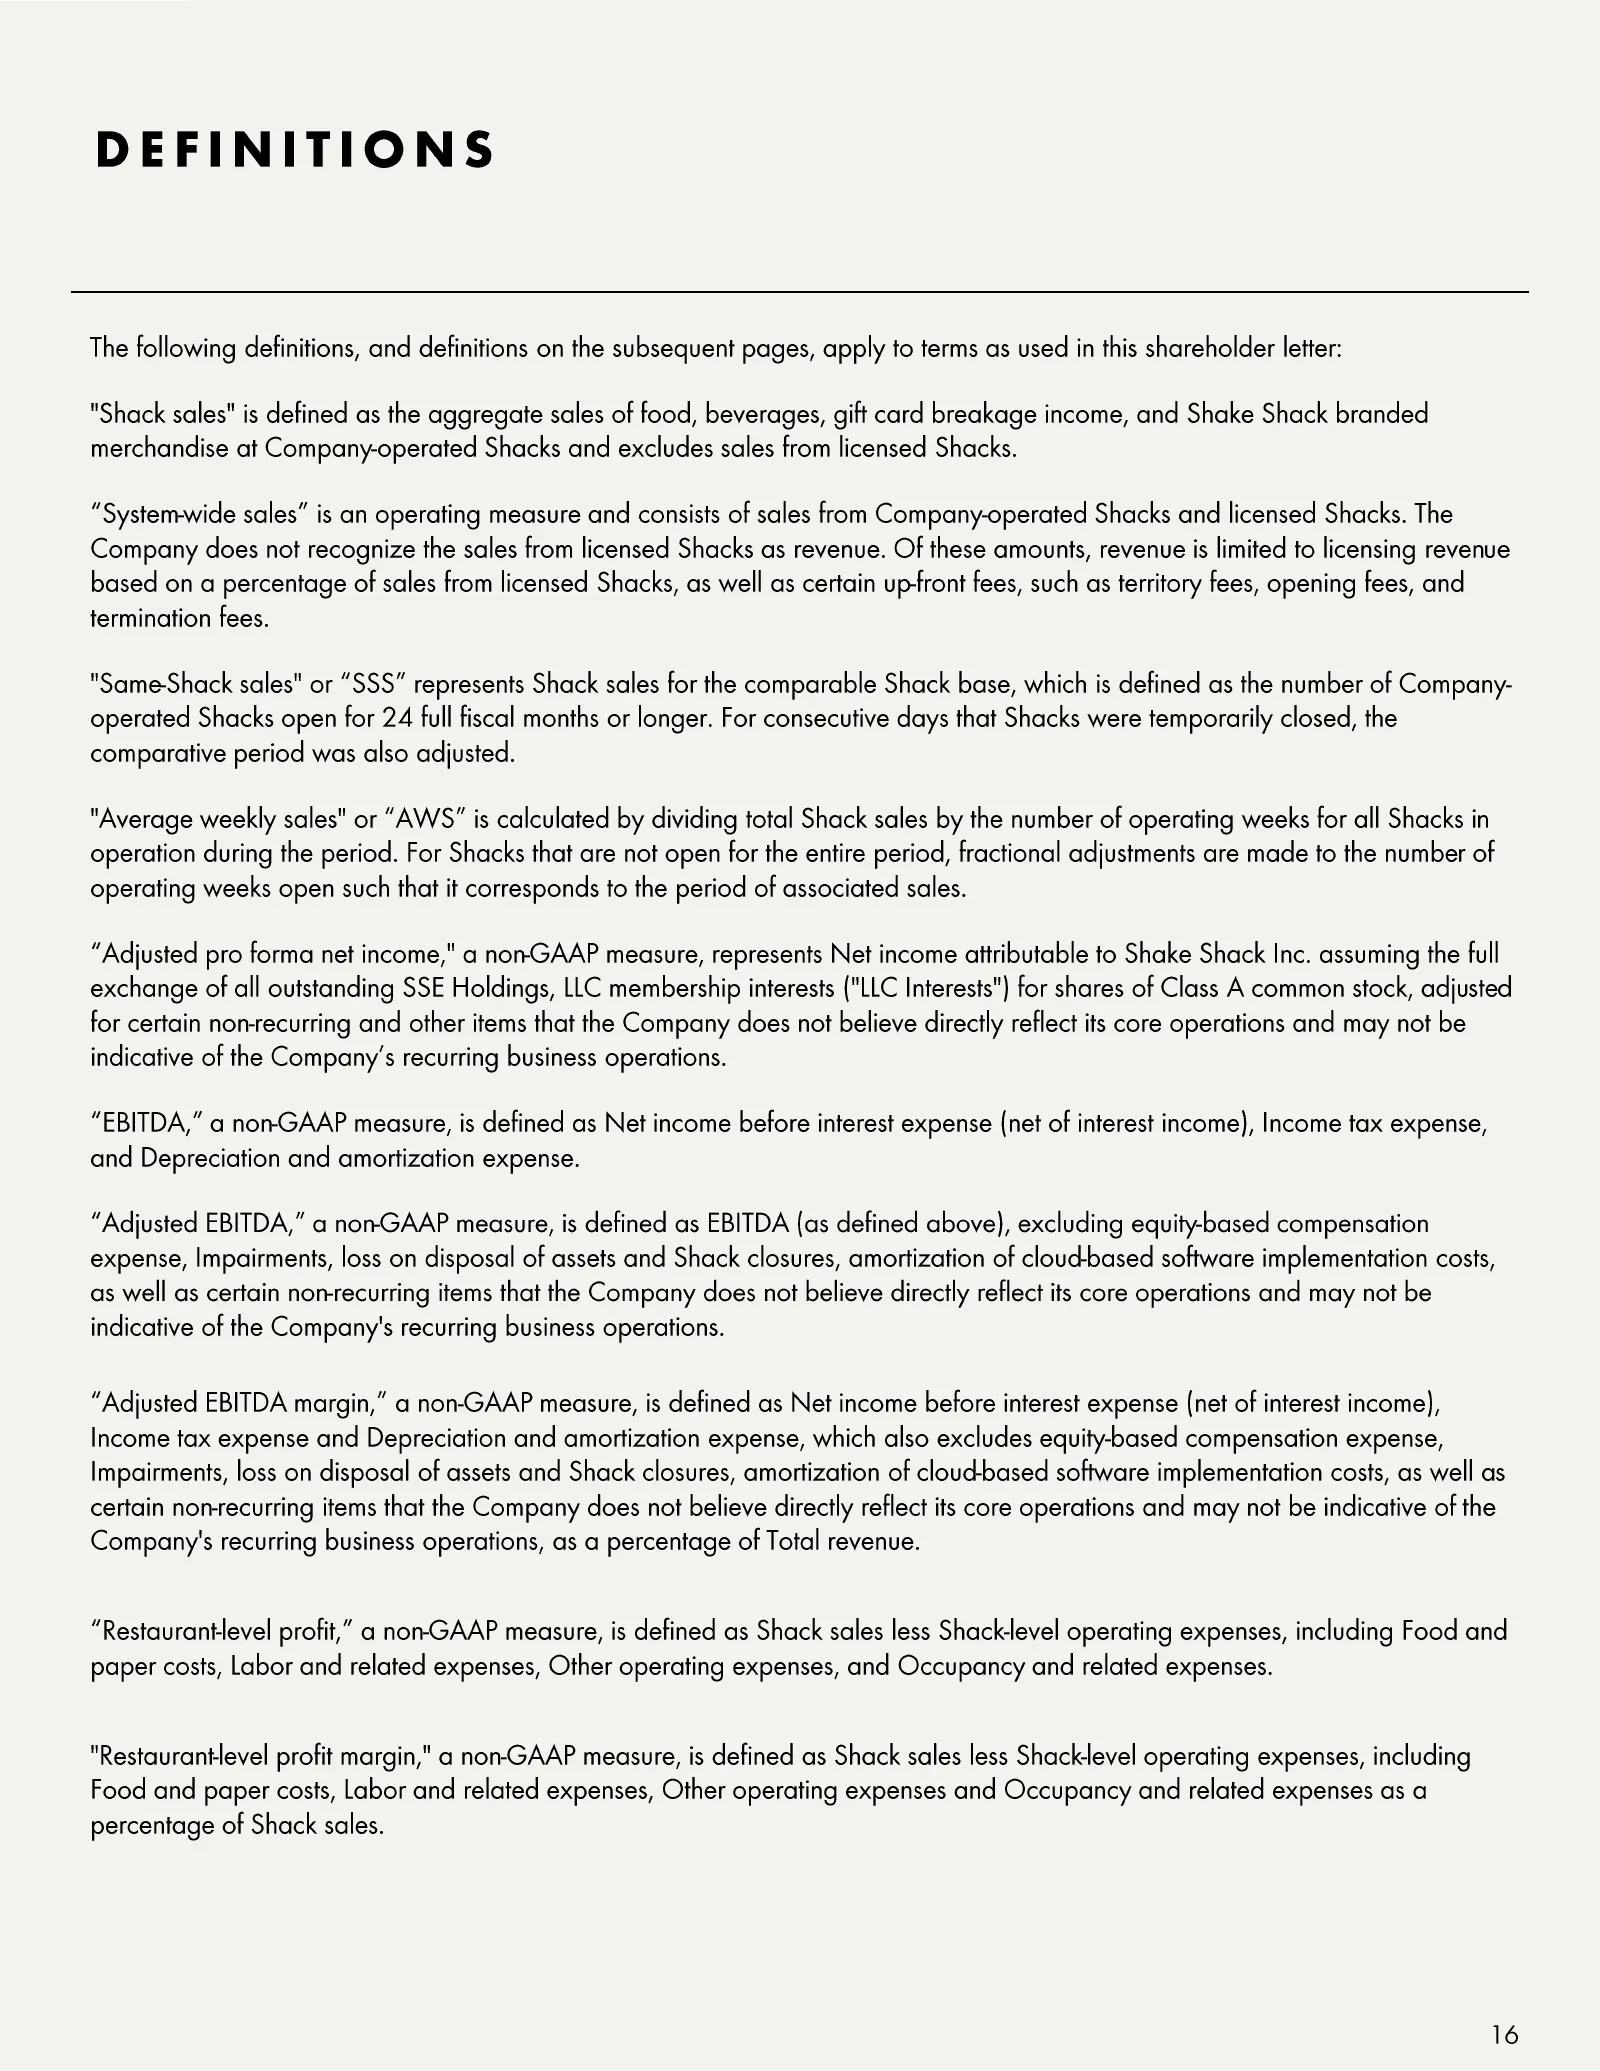
DEFINITIONS The following definitions, and definitions on the subsequent pages, apply to terms as used in this shareholder letter: "Shack sales" is defined as the aggregate sales of food, beverages, gift card breakage income, and Shake Shack branded merchandise at Company -operated Shacks and exclud
Slide 17: Definitions: Percentage Ranges
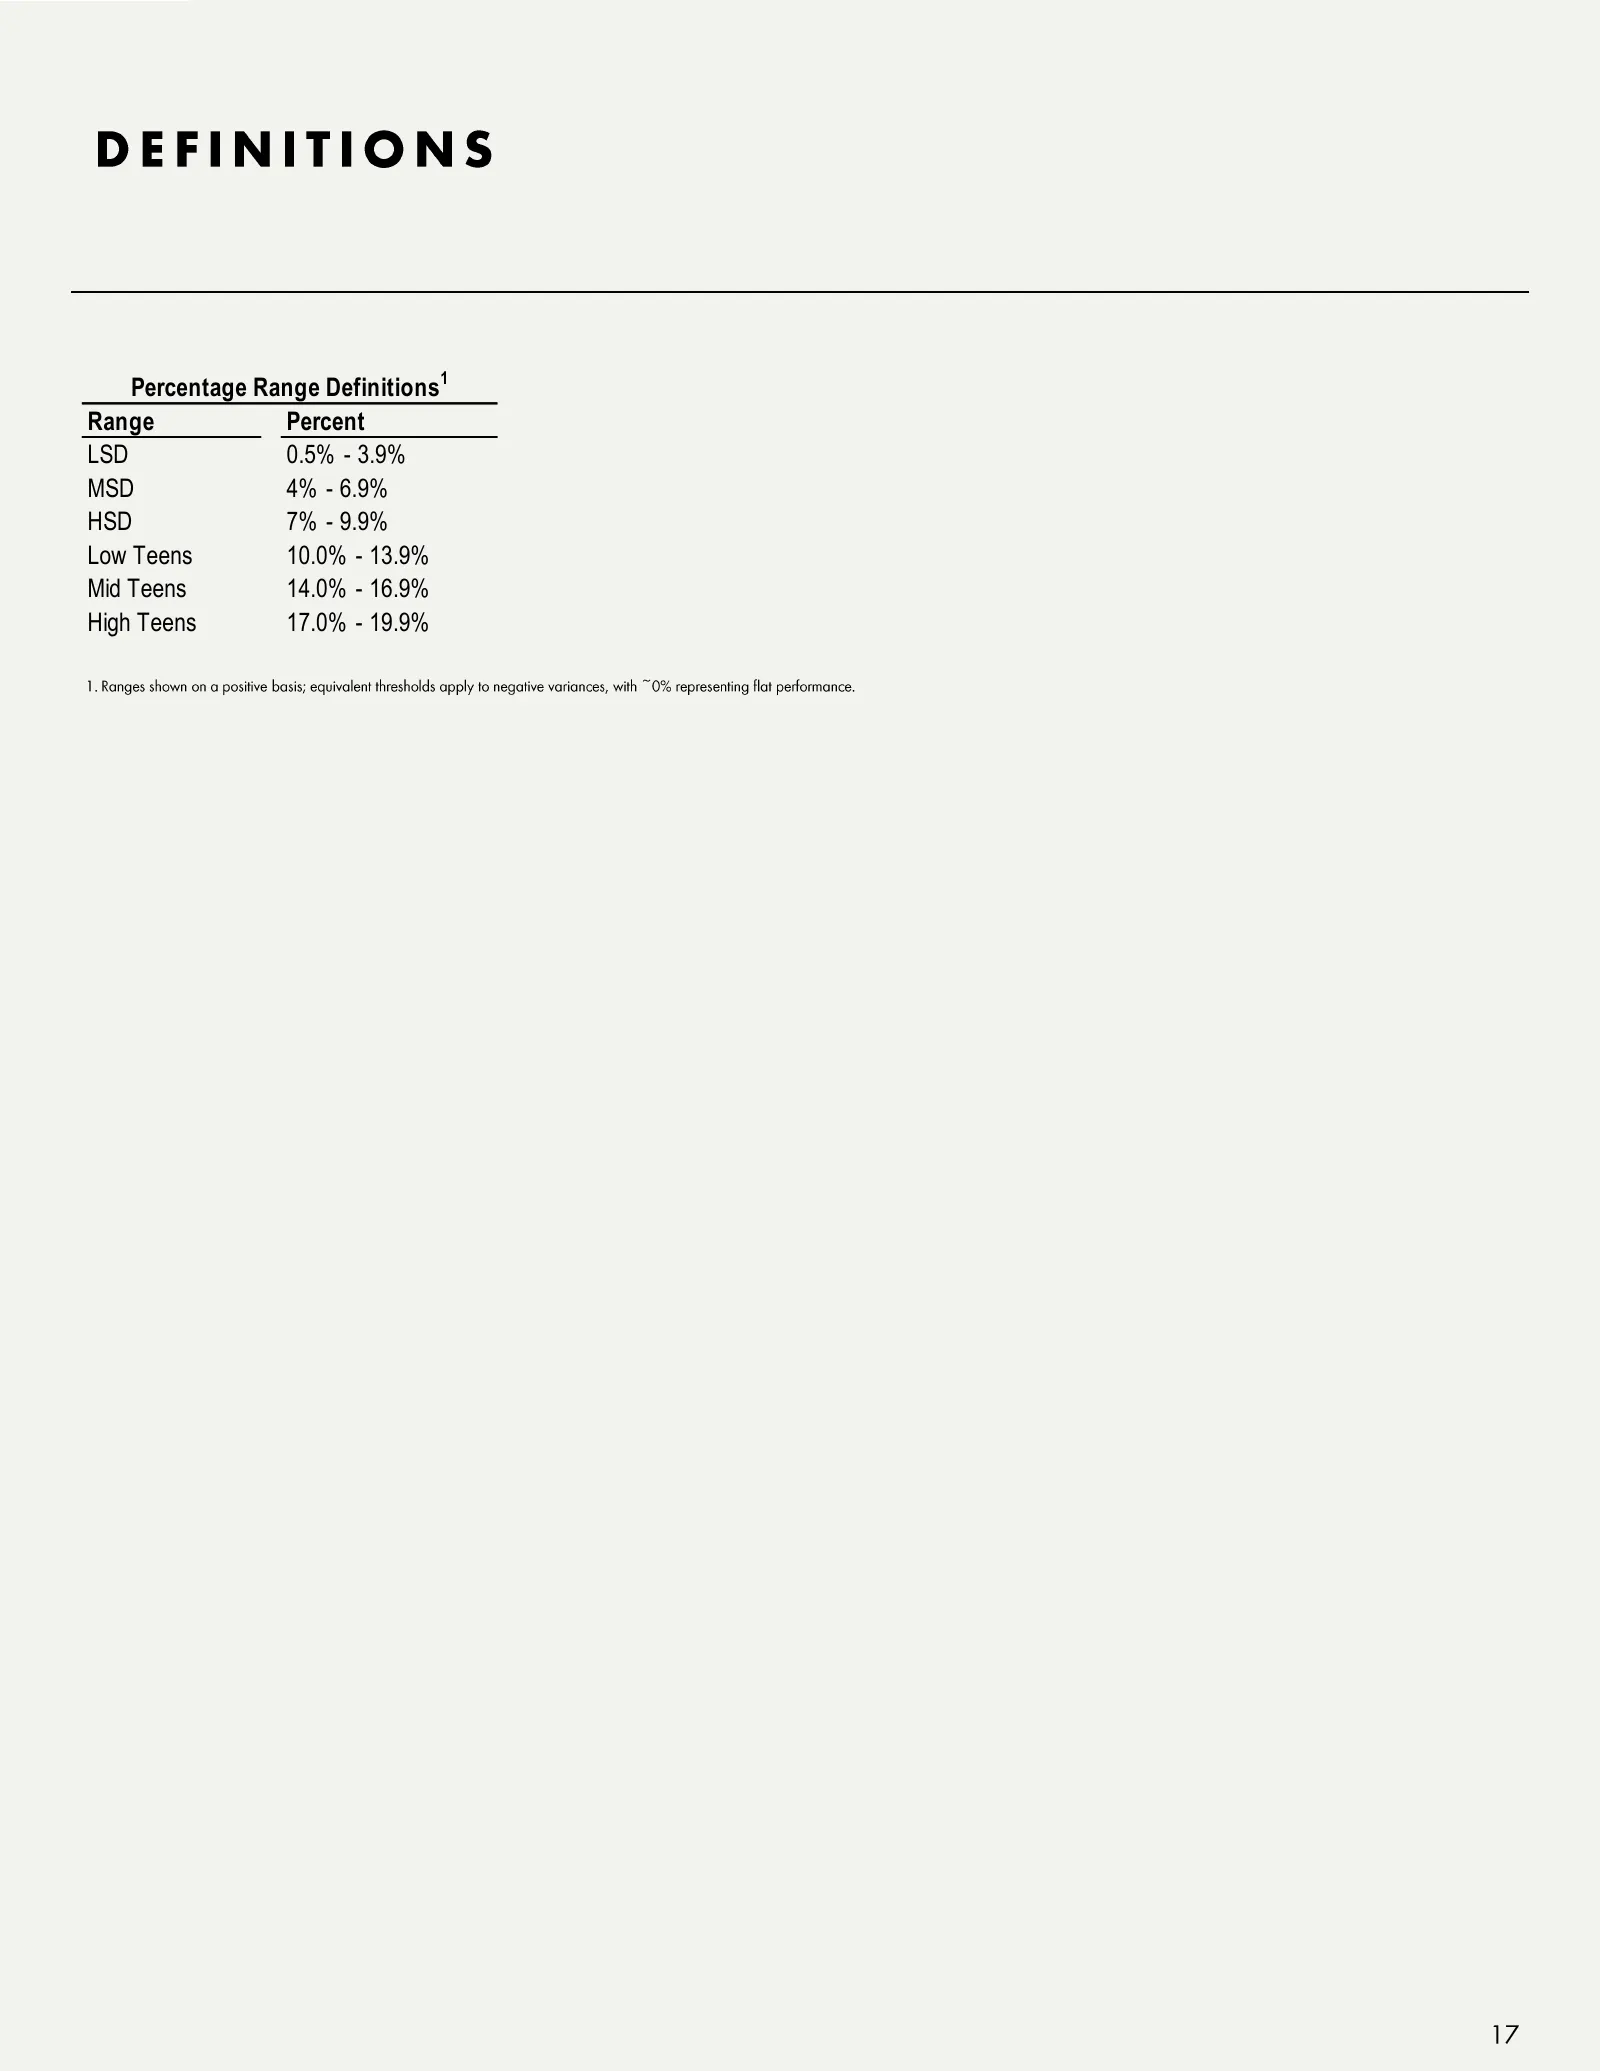
DEFINITIONS Percentage Range Definitions1 Range Percent LSD 0.5% - 3.9% MSD 4% - 6.9% HSD 7% - 9.9% Low Teens 10.0% - 13.9% Mid Teens 14.0% - 16.9% High Teens 17.0% - 19.9% 1. Ranges shown on a positive basis; equivalent thresholds apply to negative variances, with ~0% representing flat performance.
Slide 18: Development Highlights
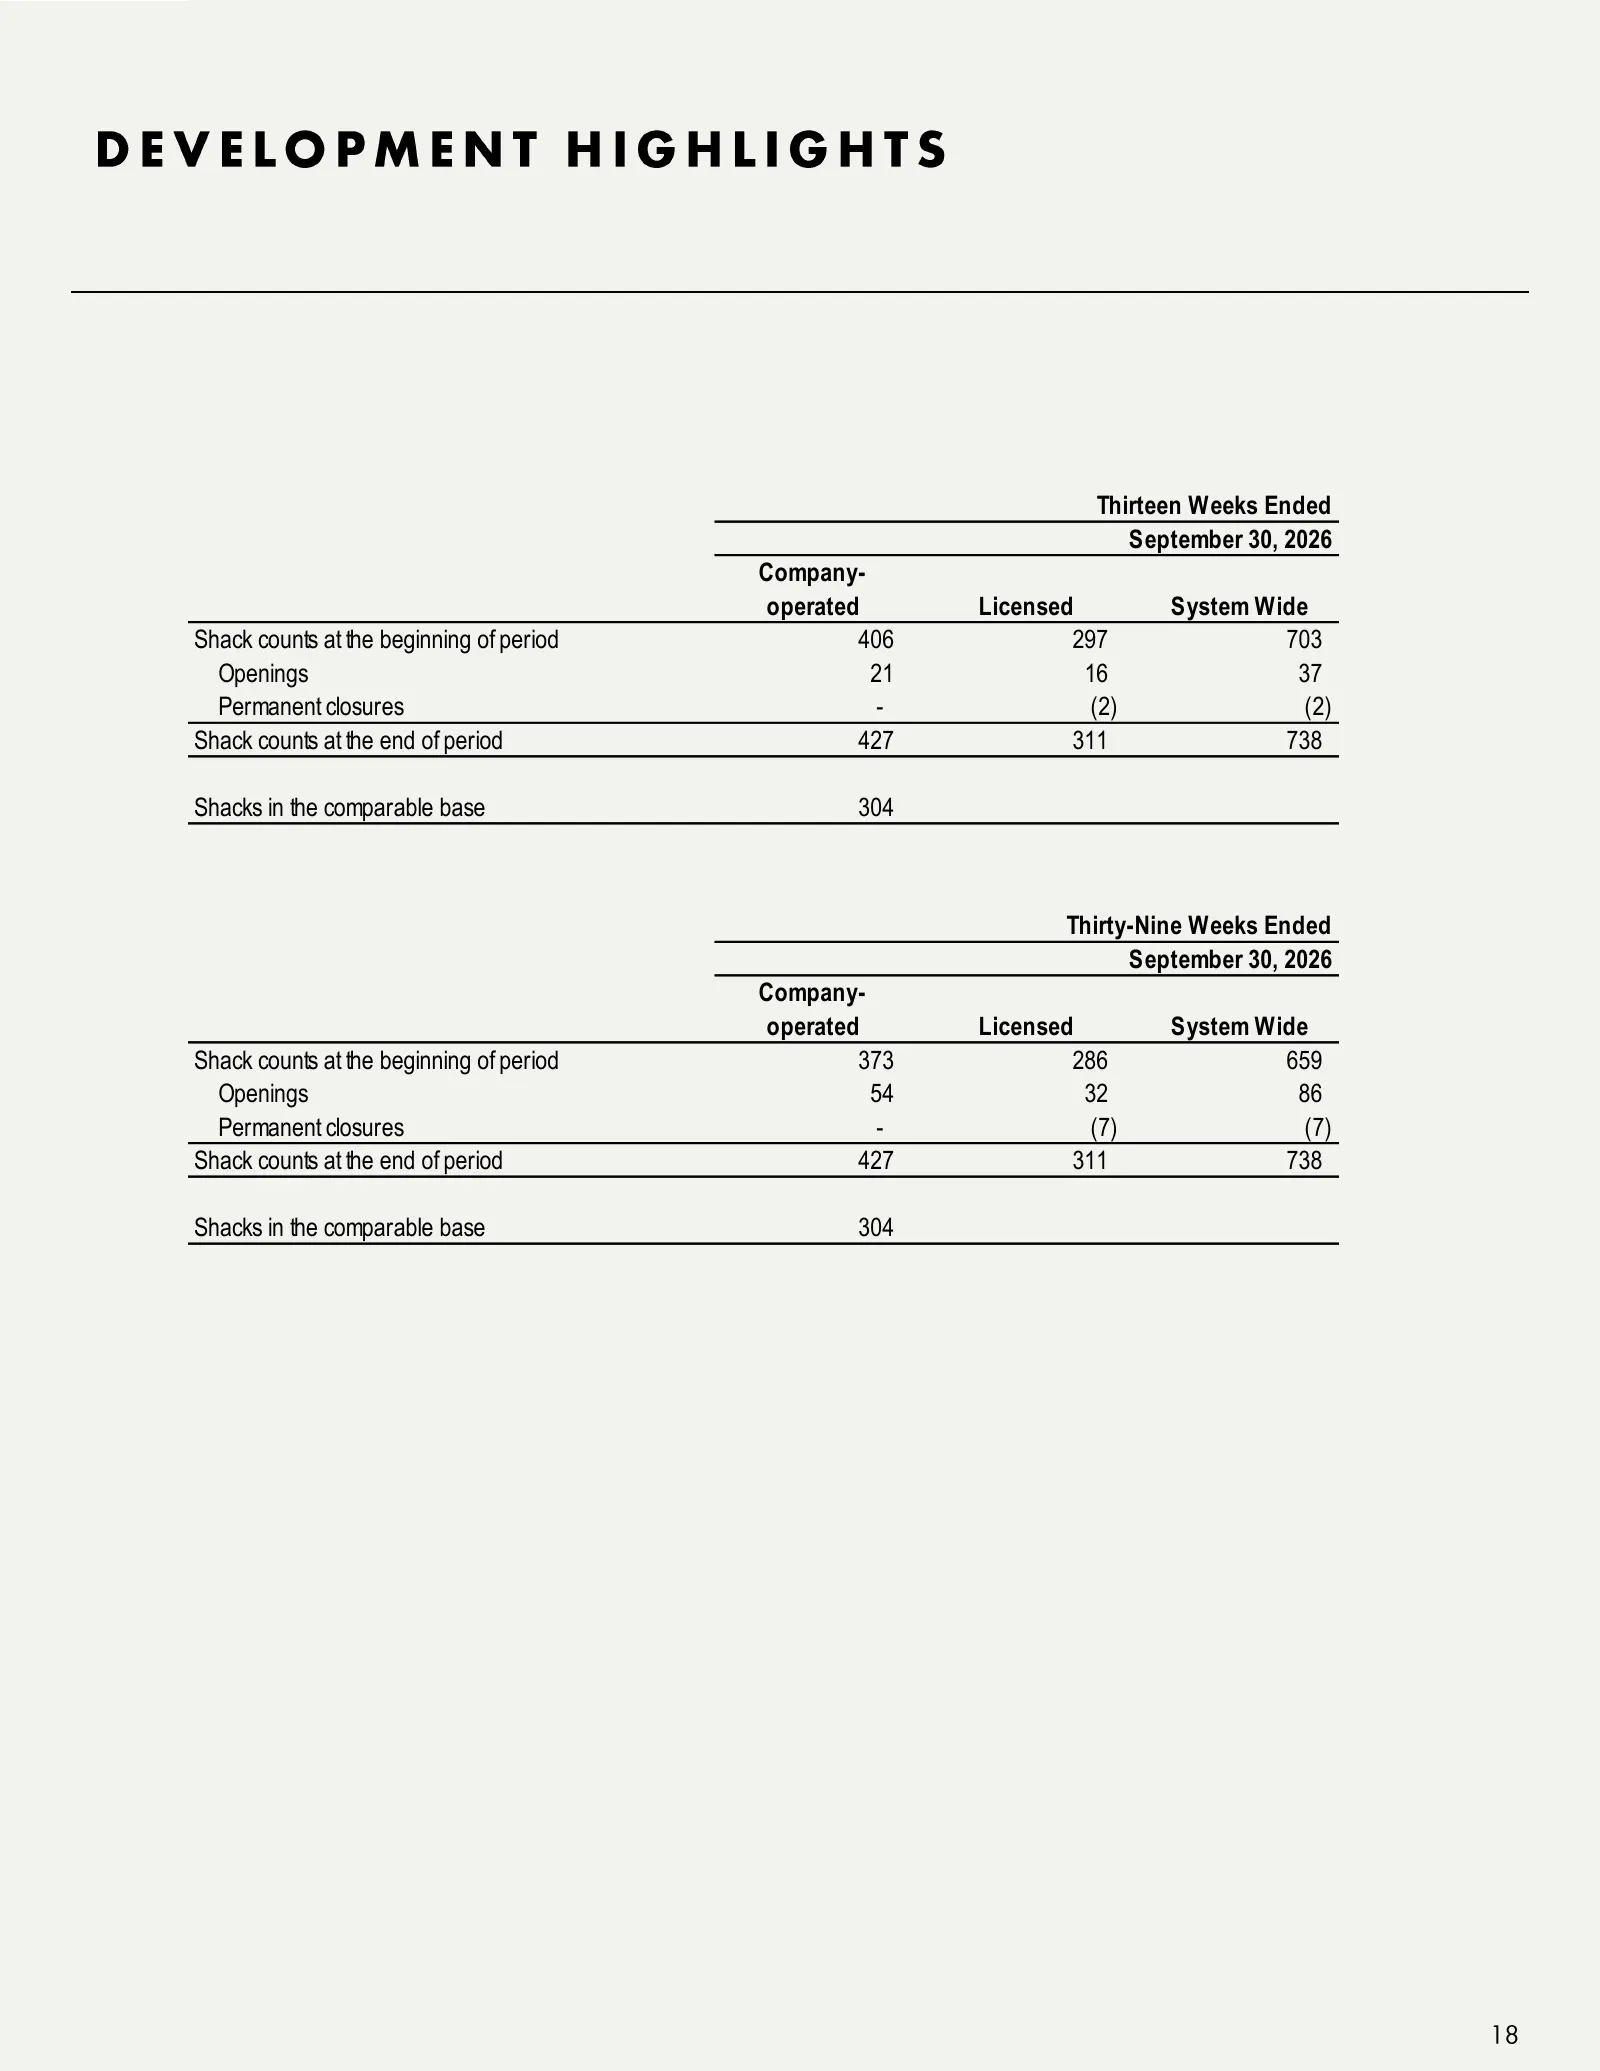
DEVELOPMENT HIGHLIGHTS Thirteen Weeks Ended September 30, 2026 Company- operated Licensed System Wide Shack counts at the beginning of period 406 297 703 Openings 21 16 37 Permanent closures - (2) (2) Shack counts at the end of period 427 311 738 Shacks in the comparable base 304 Thirty-Nine Weeks E
Slide 19: Balance Sheets
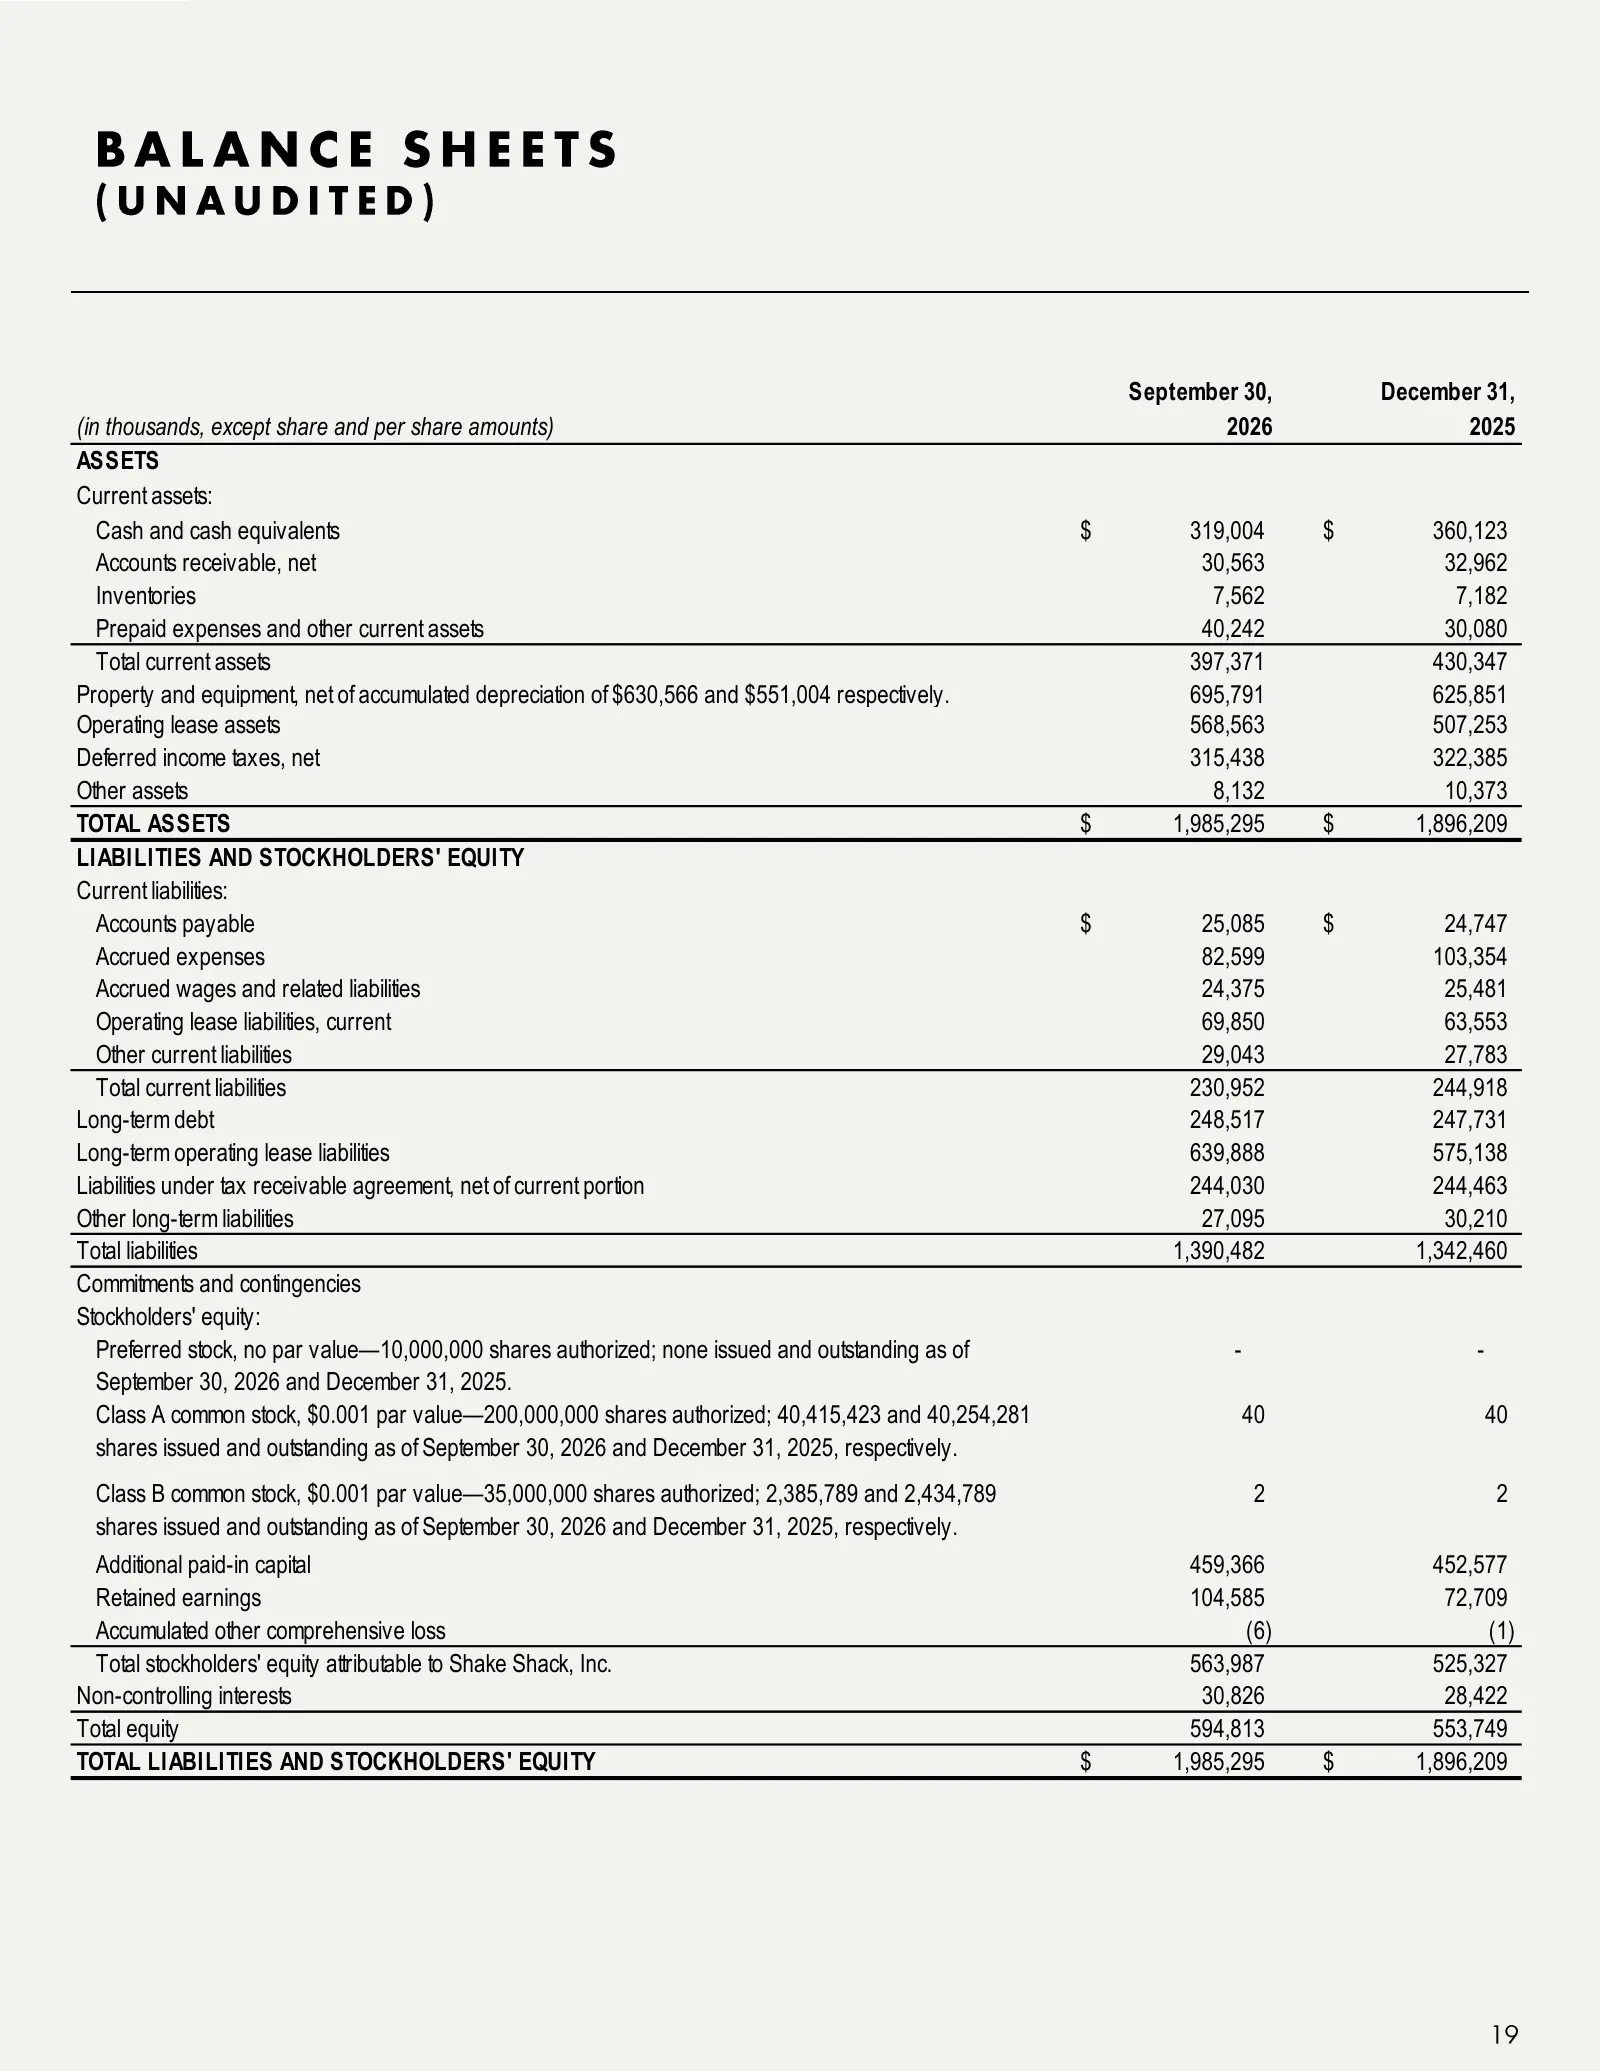
BALANCE SHEETS (UNAUDITED) September 30, December 31, (in thousands, except share and per share amounts) 2026 2025 ASSETS Current assets: Cash and cash equivalents $ 319,004 $ 360,123 Accounts receivable, net 30,563 32,962 Inventories 7,562 7,182 Prepaid expenses and other current assets 40,242 30,0
Slide 20: Statements of Income
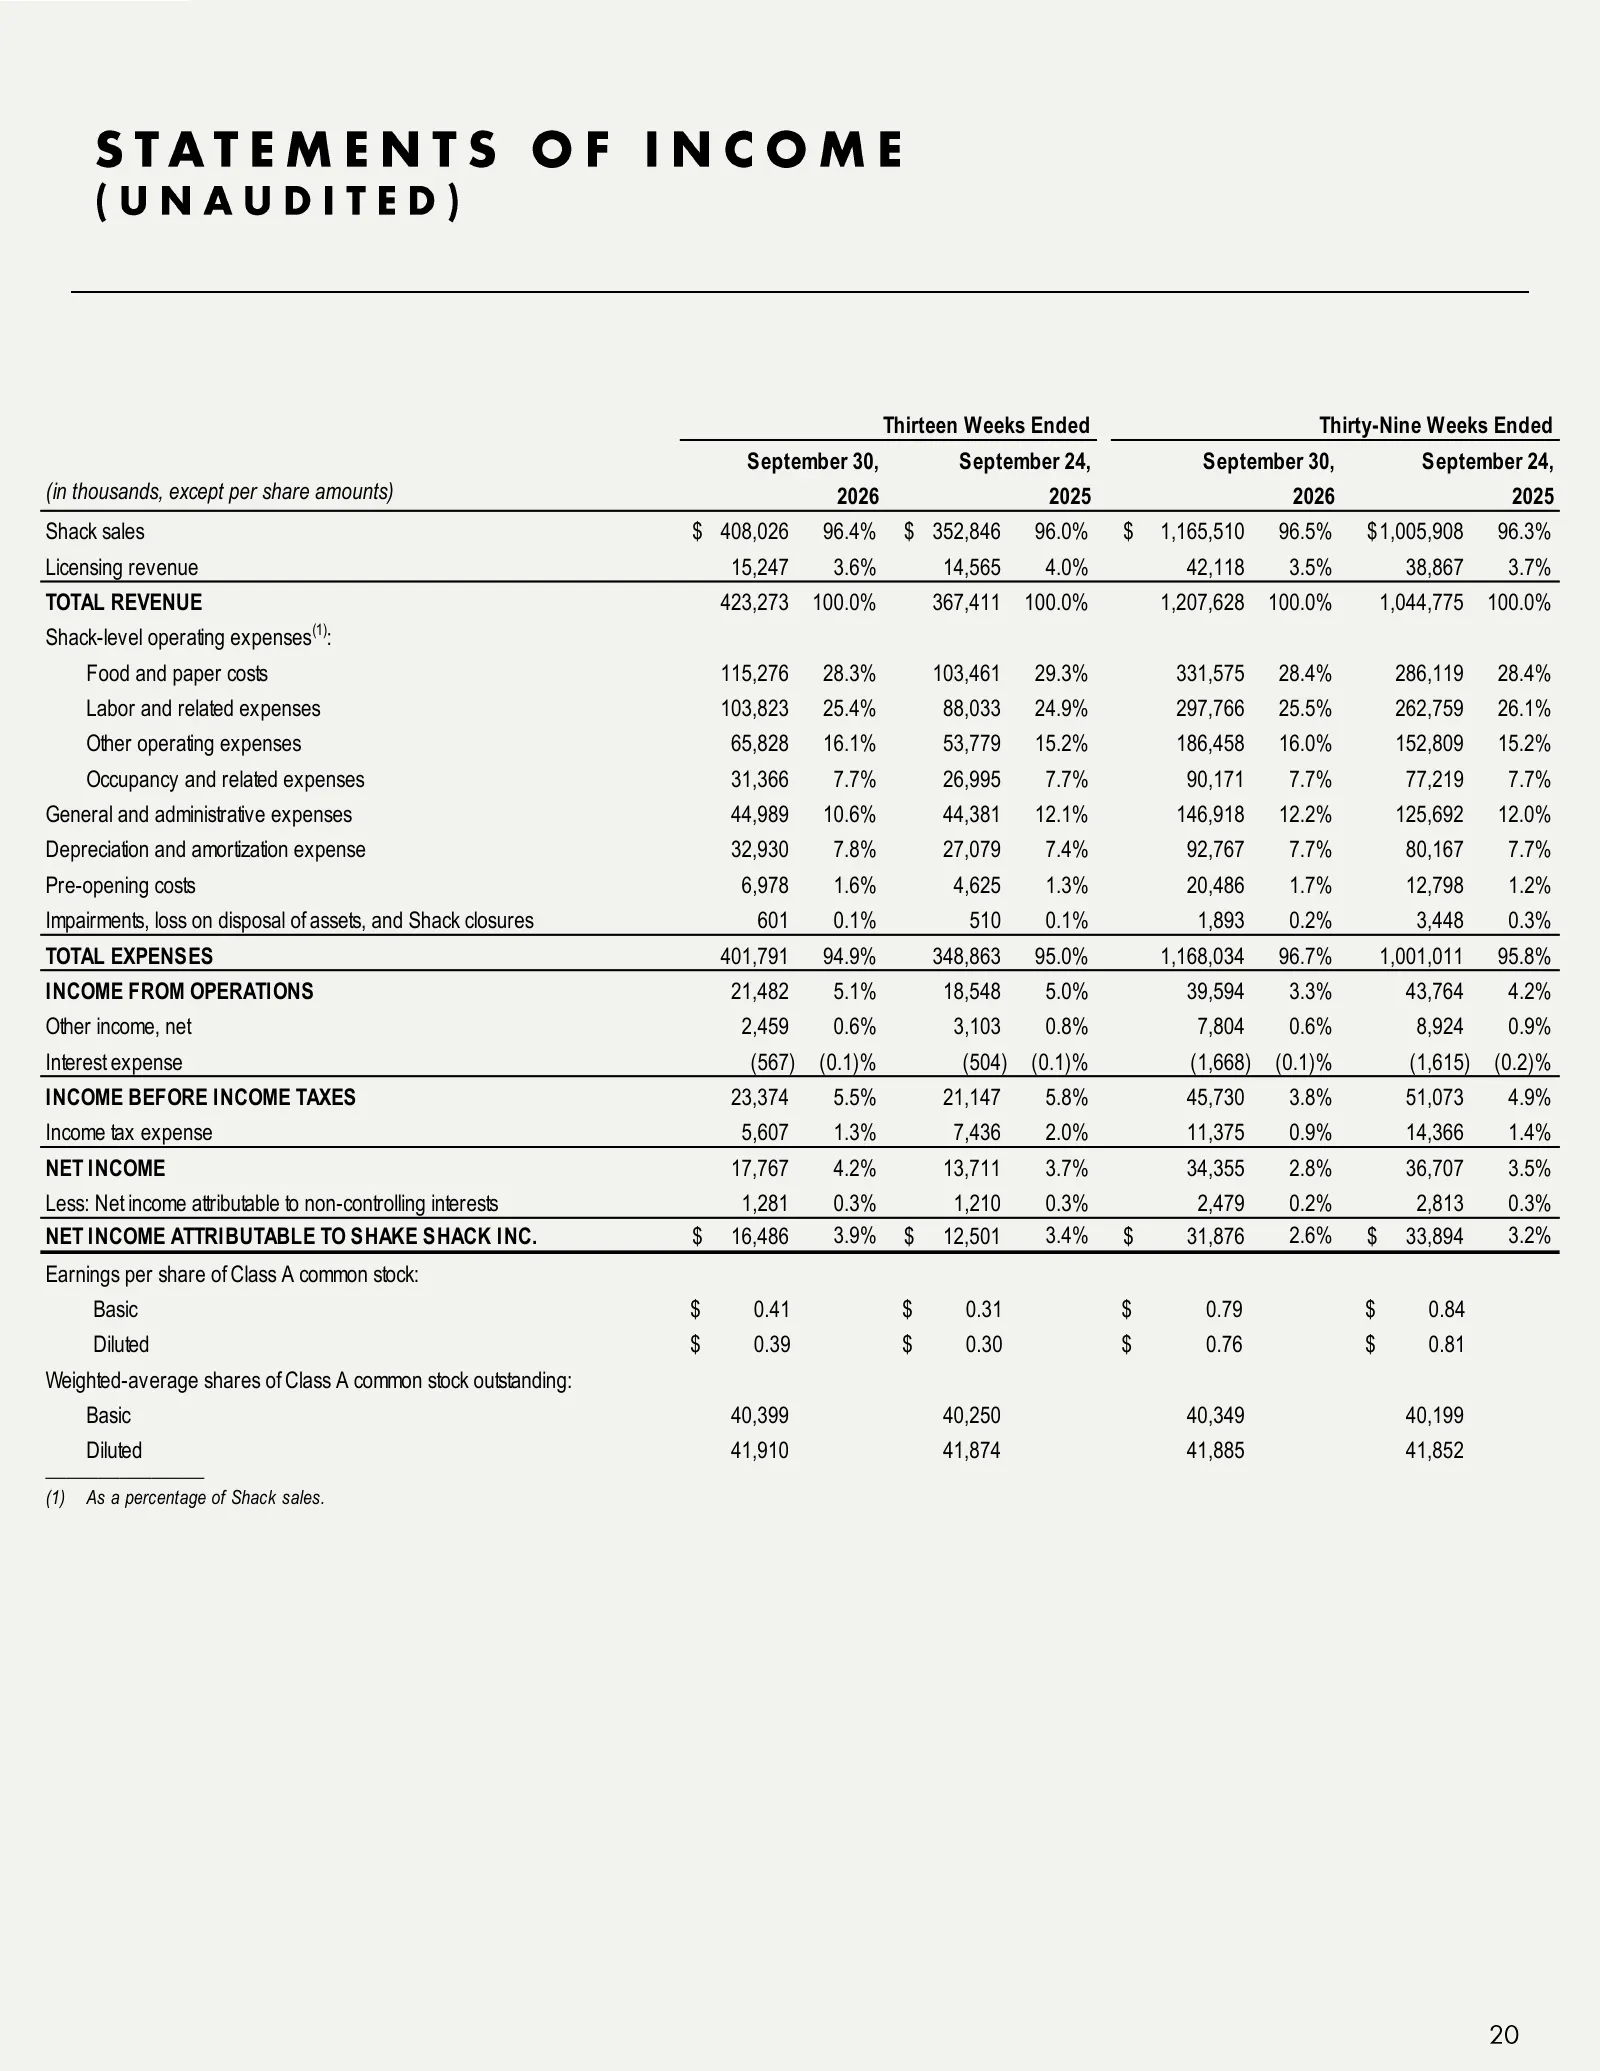
STATEMENTS OF INCOME (UNAUDITED) Thirteen Weeks Ended Thirty-Nine Weeks Ended September 30, September 24, September 30, September 24, (in thousands, except per share amounts) 2026 2025 2026 2025 Shack sales $ 408,026 96.4% $ 352,846 96.0% $ 1,165,510 96.5% $ 1,005,908 96.3% Licensing revenue 15,247
Slide 21: Cash Flow Statements
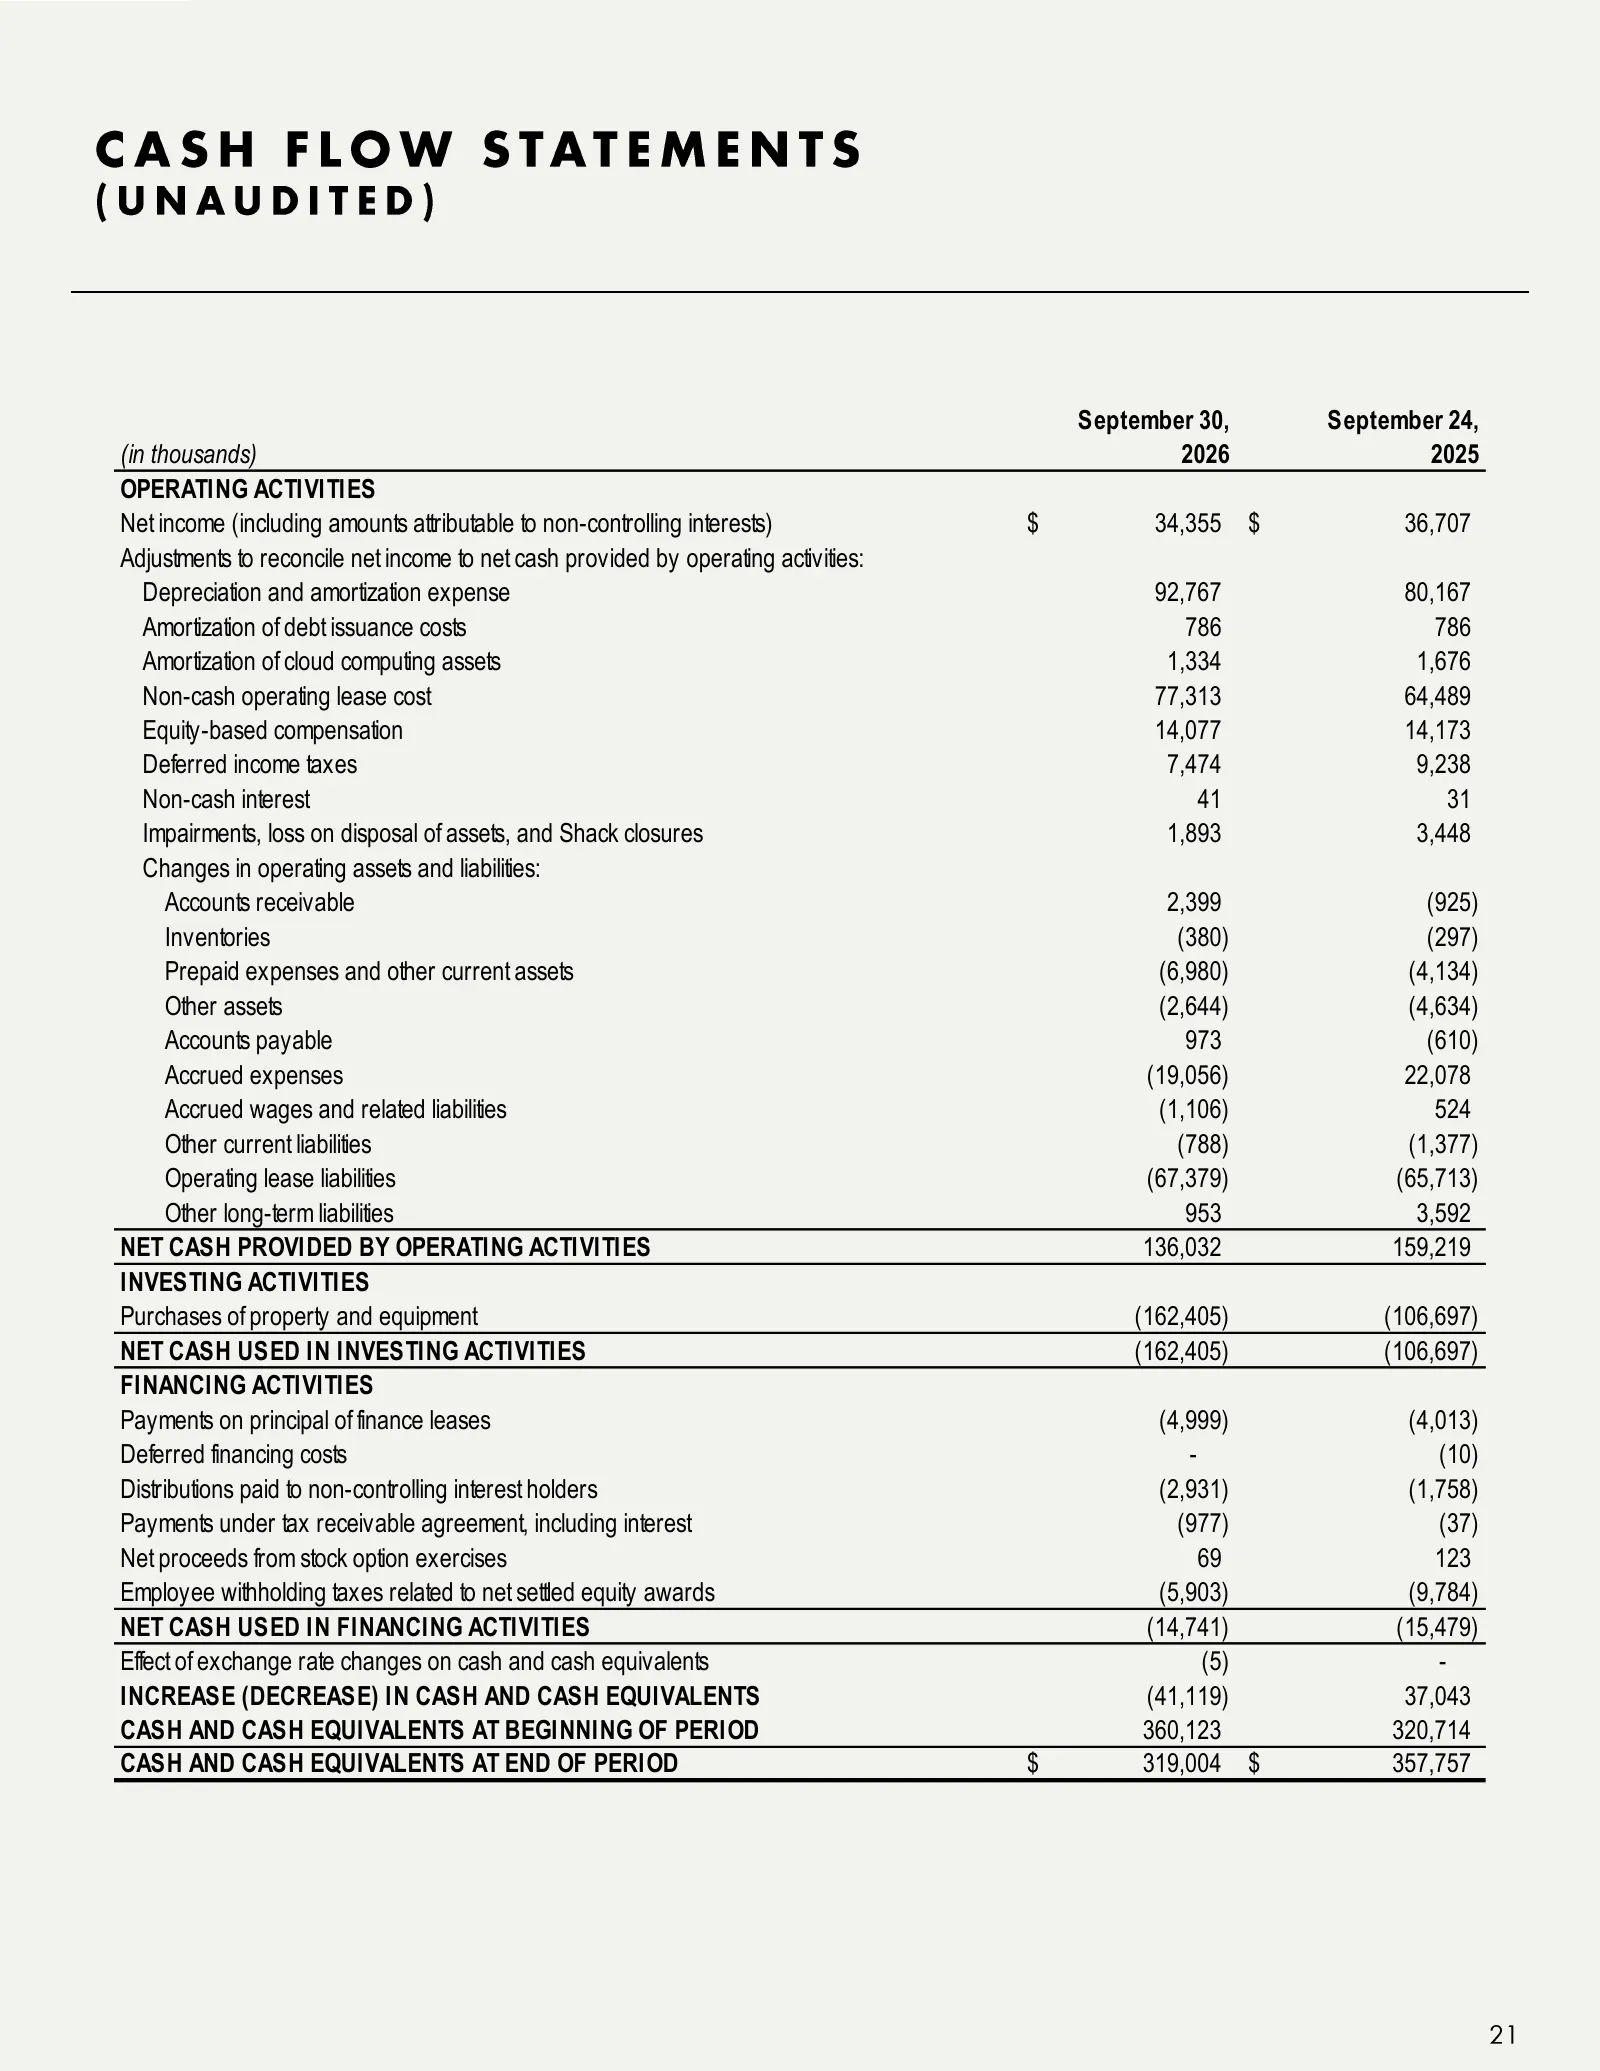
CASH FLOW STATEMENTS (UNAUDITED) September 30, September 24, (in thousands) 2026 2025 OPERATING ACTIVITIES Net income (including amounts attributable to non-controlling interests) $ 34,355 $ 36,707 Adjustments to reconcile net income to net cash provided by operating activities: Depreciation and amo
Slide 22: Restaurant-Level Profit Definitions
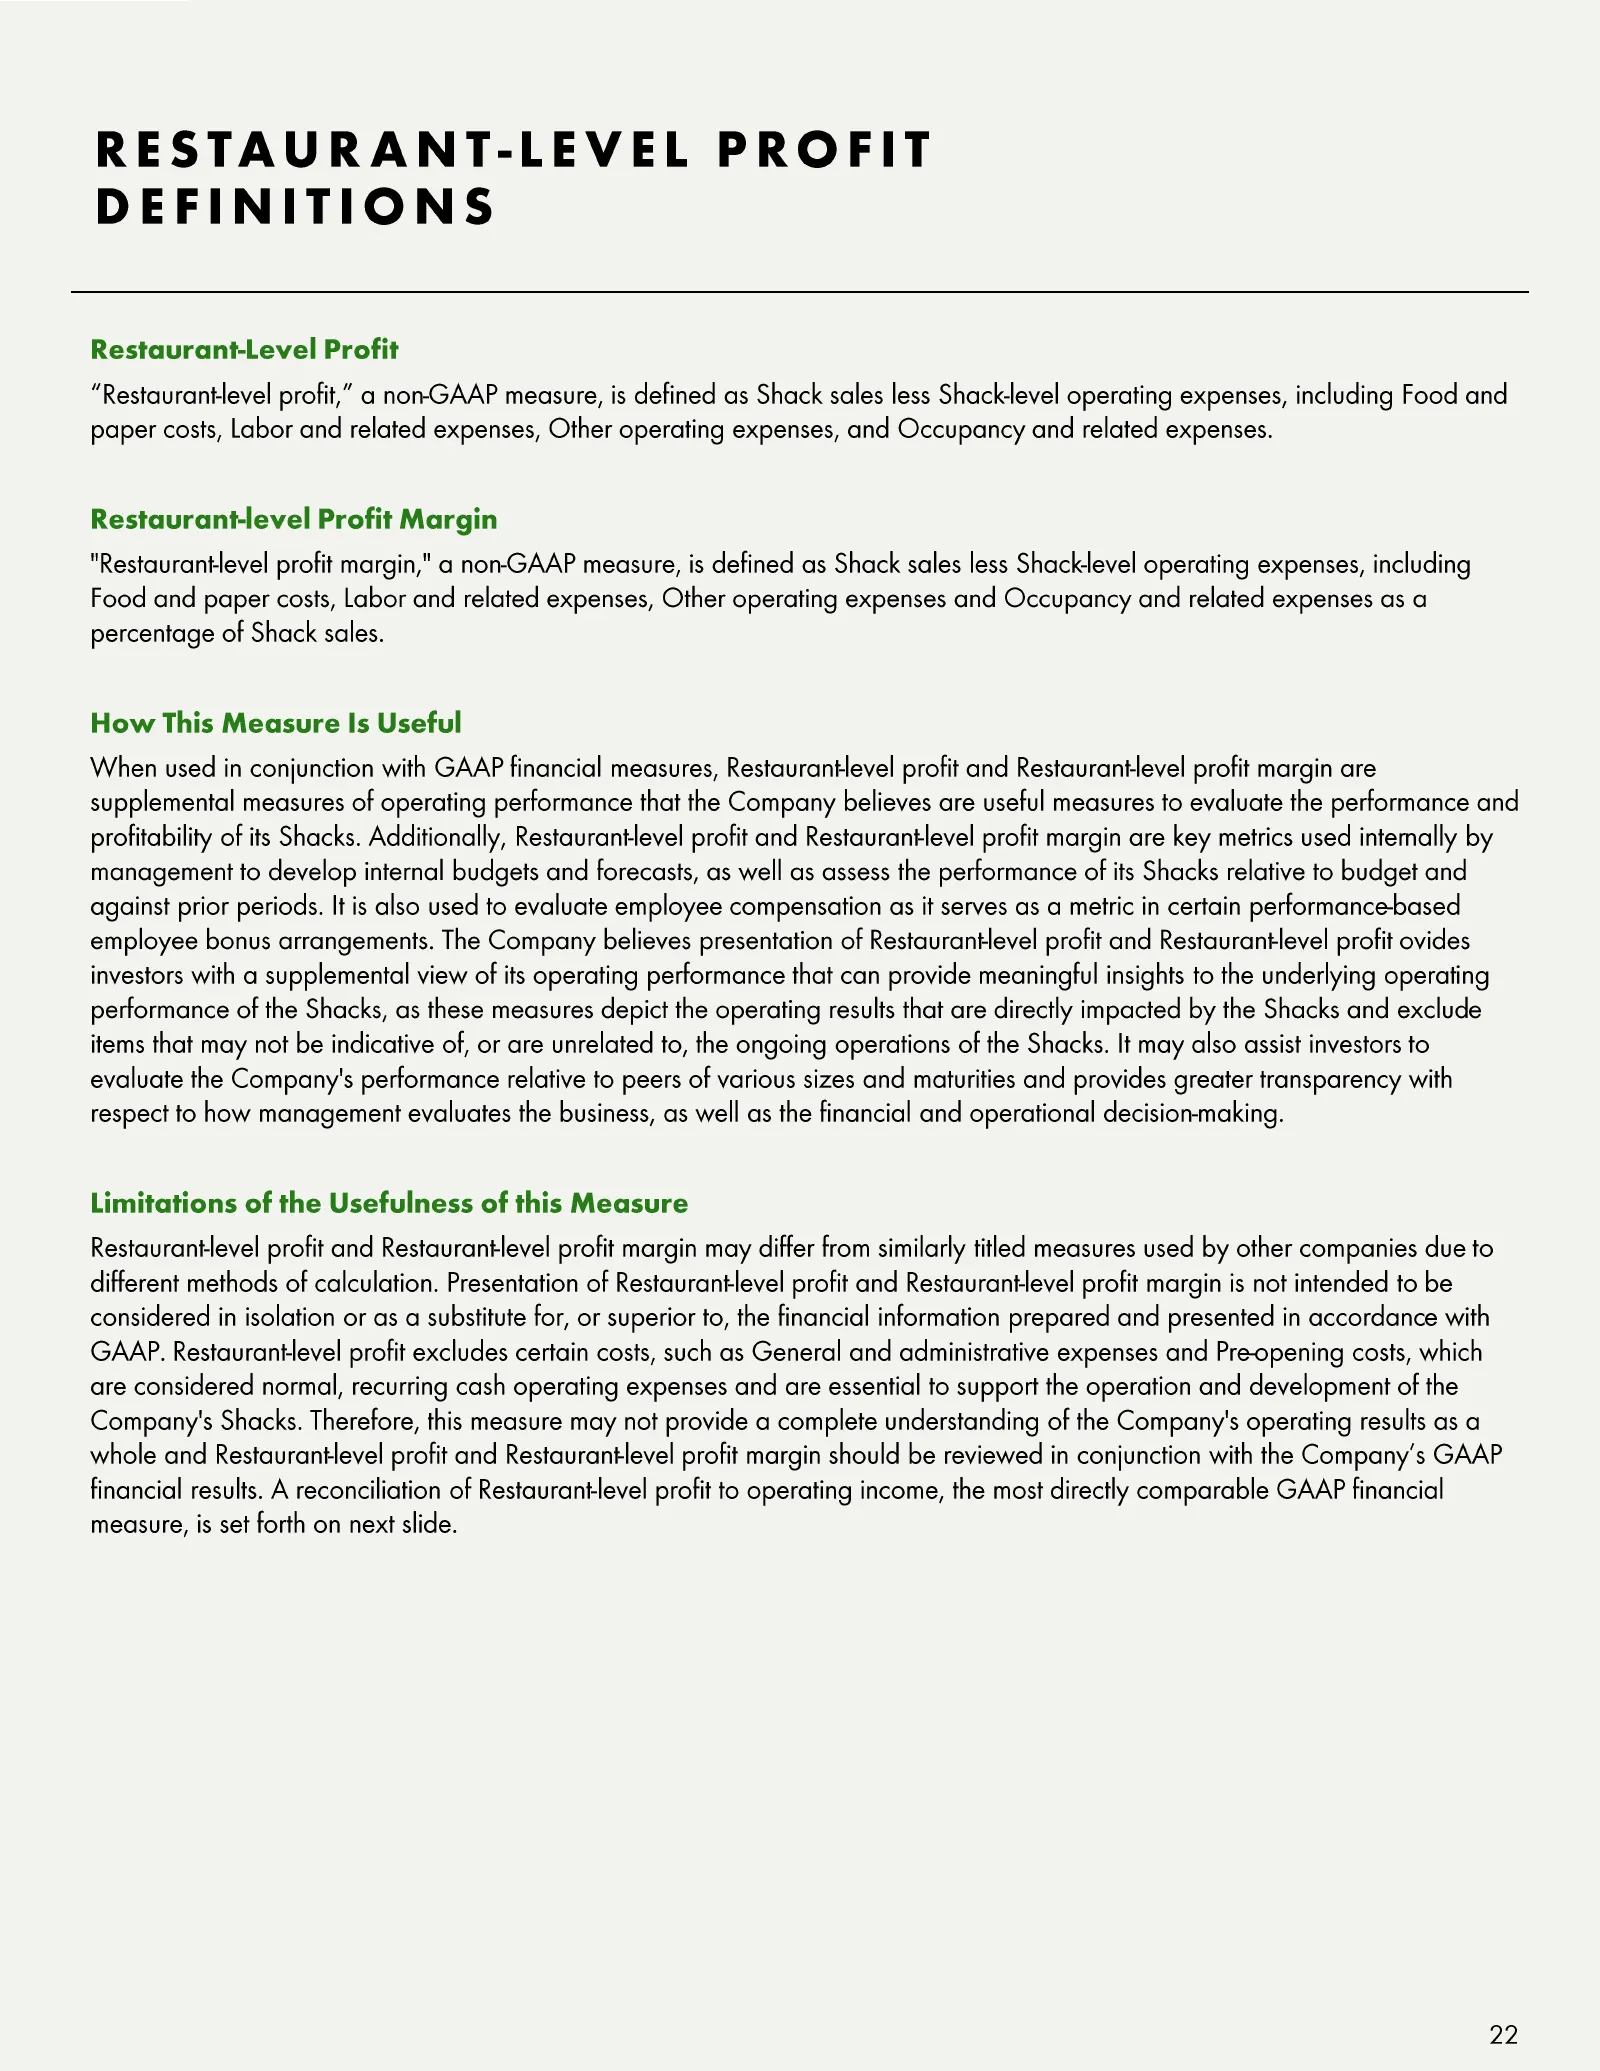
RESTAURANT -LEVEL PROFIT DEFINITIONS Restaurant -Level Profit “Restaurant -level profit,” a non -GAAP measure, is defined as Shack sales less Shack -level operating expenses, including Food and paper costs, Labor and related expenses, Other operating expenses, and Occupancy and related expenses. Res
Slide 23: Restaurant-Level Profit
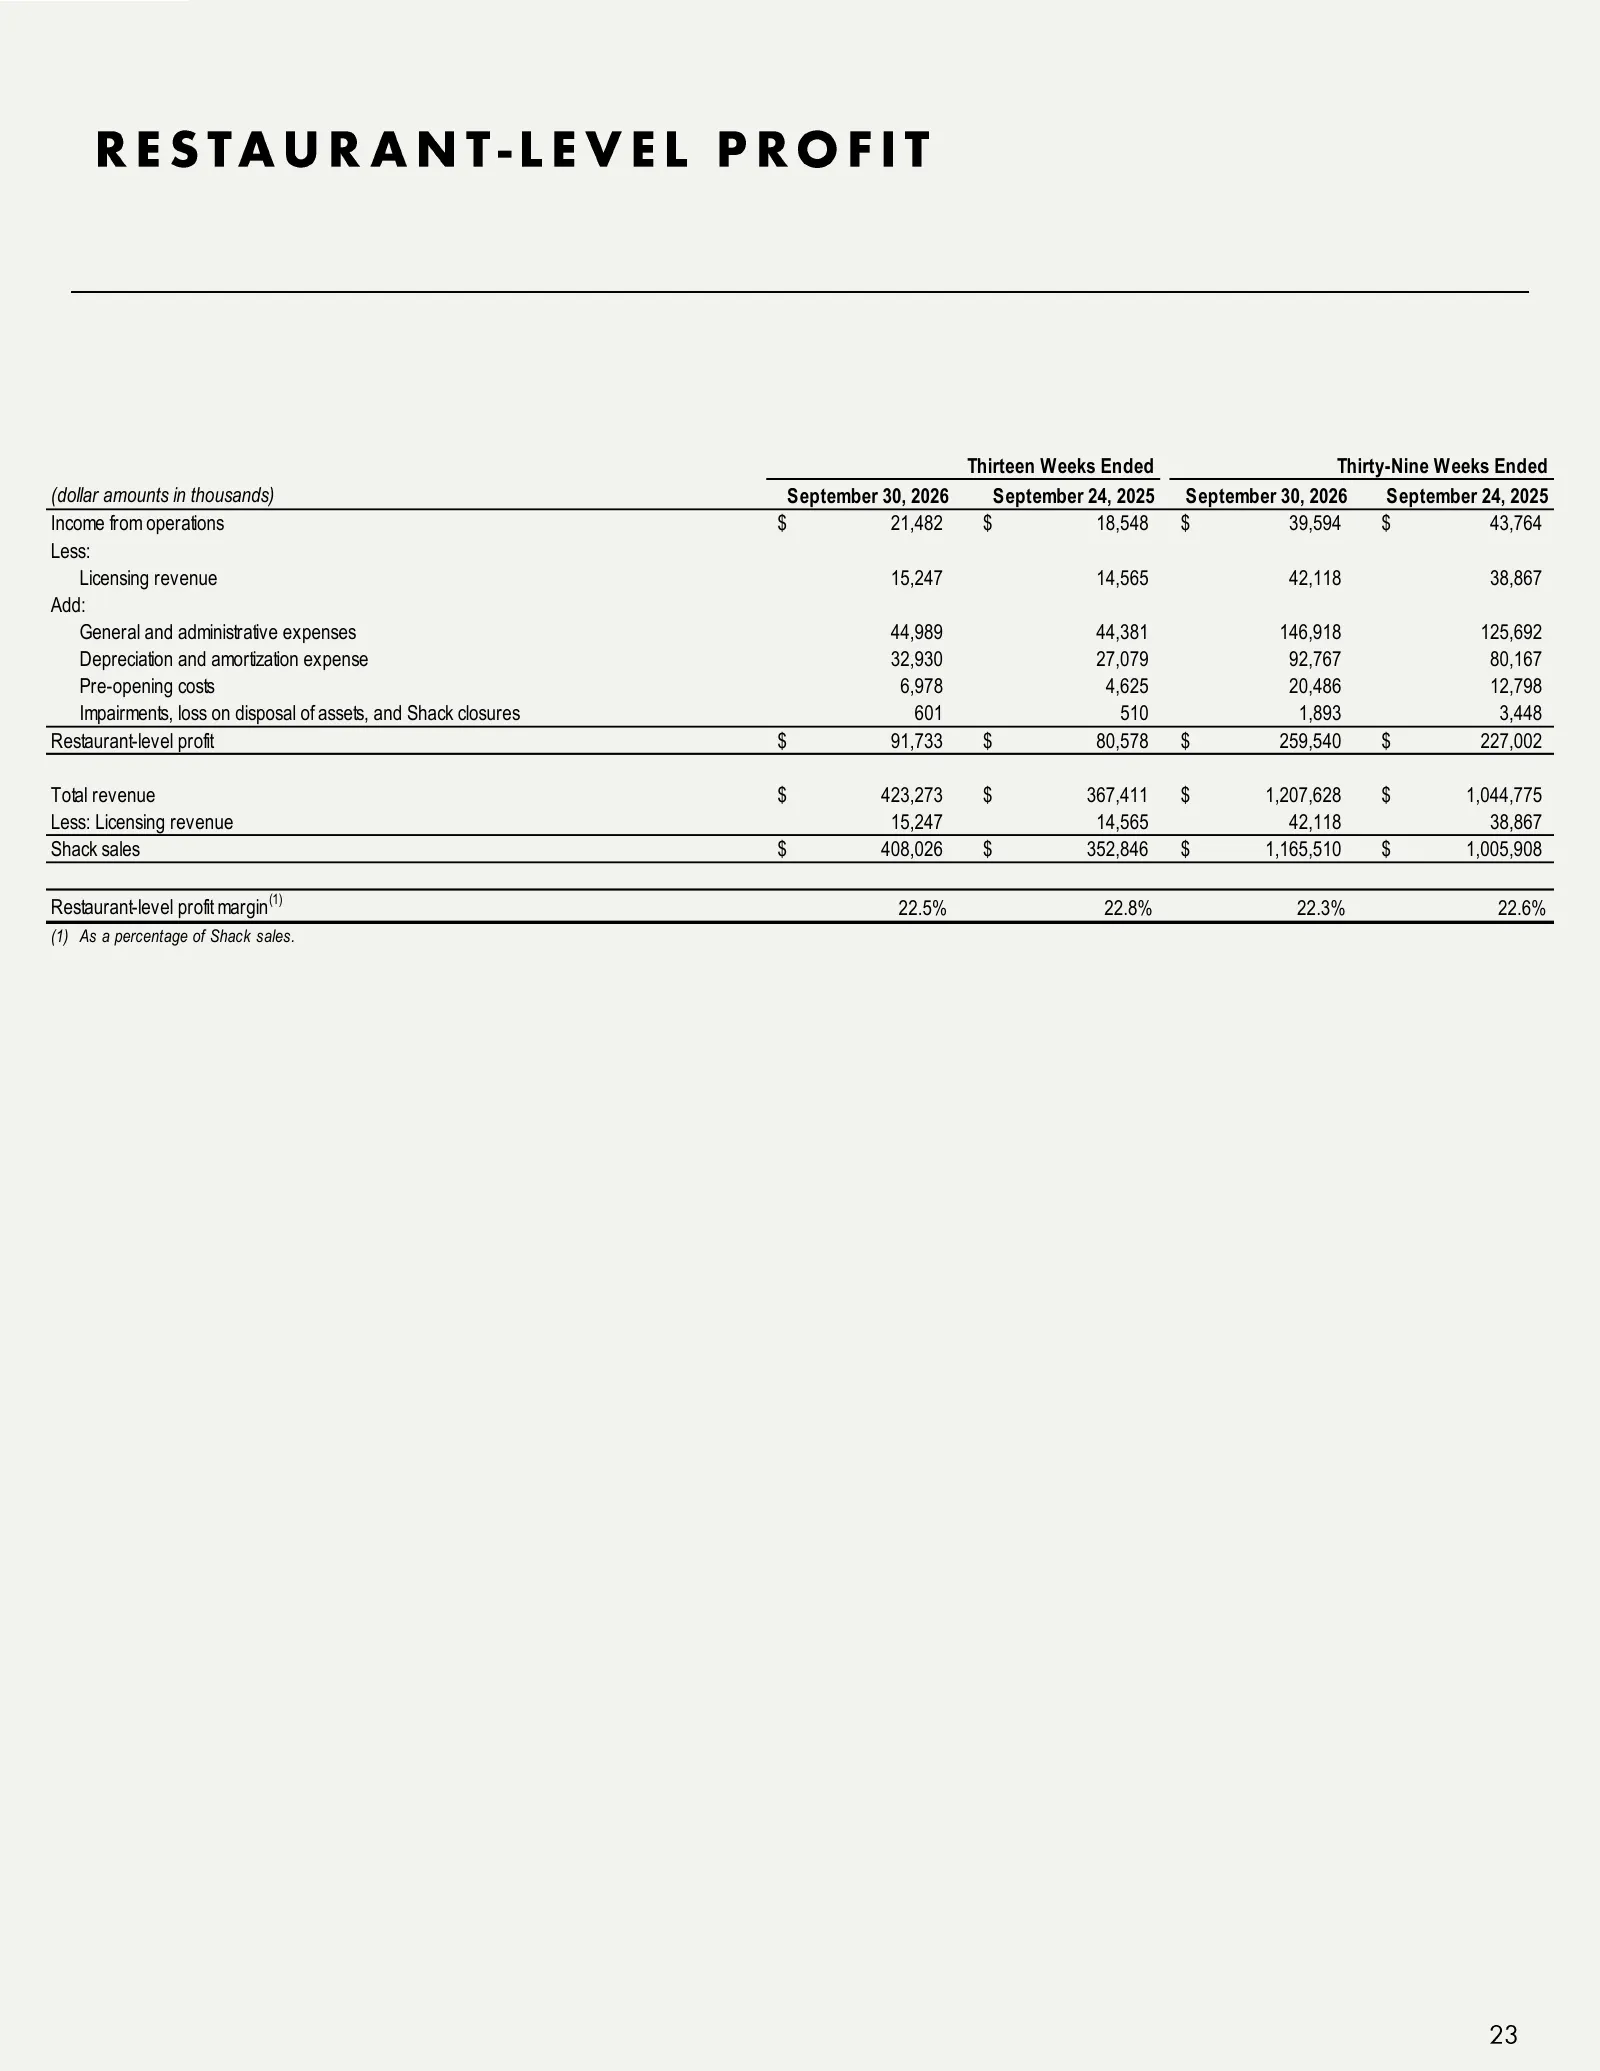
RESTAURANT -LEVEL PROFIT Thirteen Weeks Ended Thirty-Nine Weeks Ended (dollar amounts in thousands) September 30, 2026 September 24, 2025 September 30, 2026 September 24, 2025 Income from operations $ 21,482 $ 18,548 $ 39,594 $ 43,764 Less: Licensing revenue 15,247 14,565 42,118 38,867 Add: General
Slide 24: Adjusted EBITDA Definitions
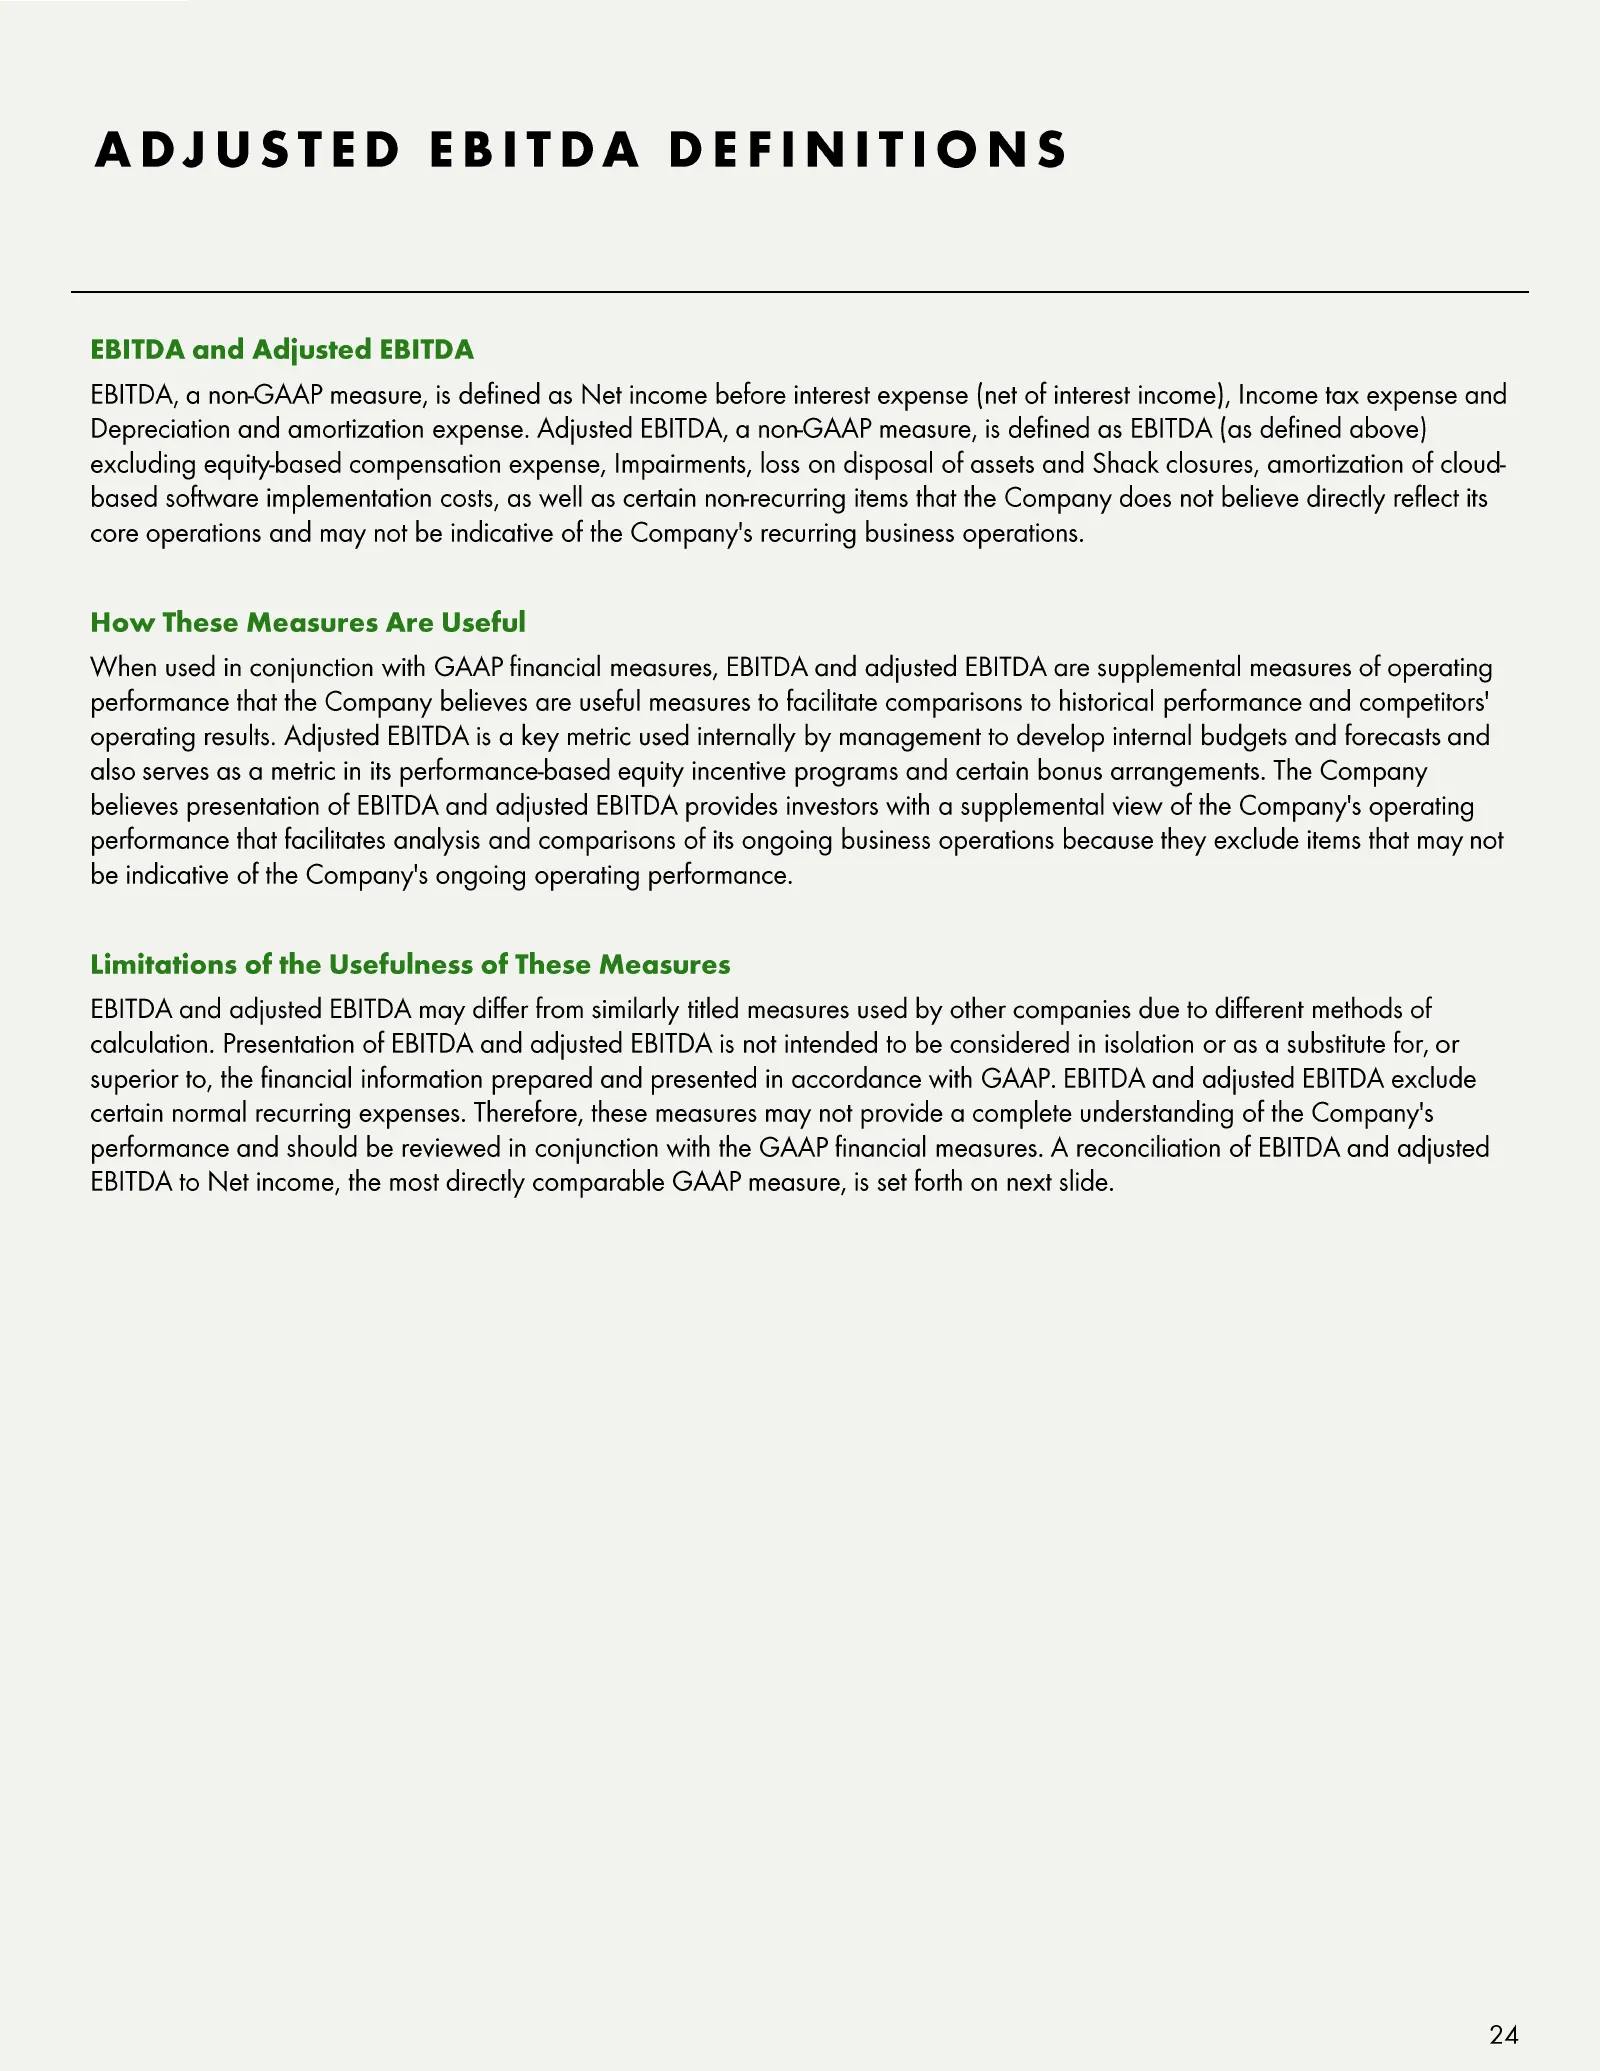
ADJUSTED EBITDA DEFINITIONS EBITDA and Adjusted EBITDA EBITDA, a non-GAAP measure, is defined as Net income before interest expense (net of interest income), Income tax expense and Depreciation and amortization expense. Adjusted EBITDA, a non -GAAP measure, is defined as EBITDA (as defined above) ex
Slide 25: Adjusted EBITDA
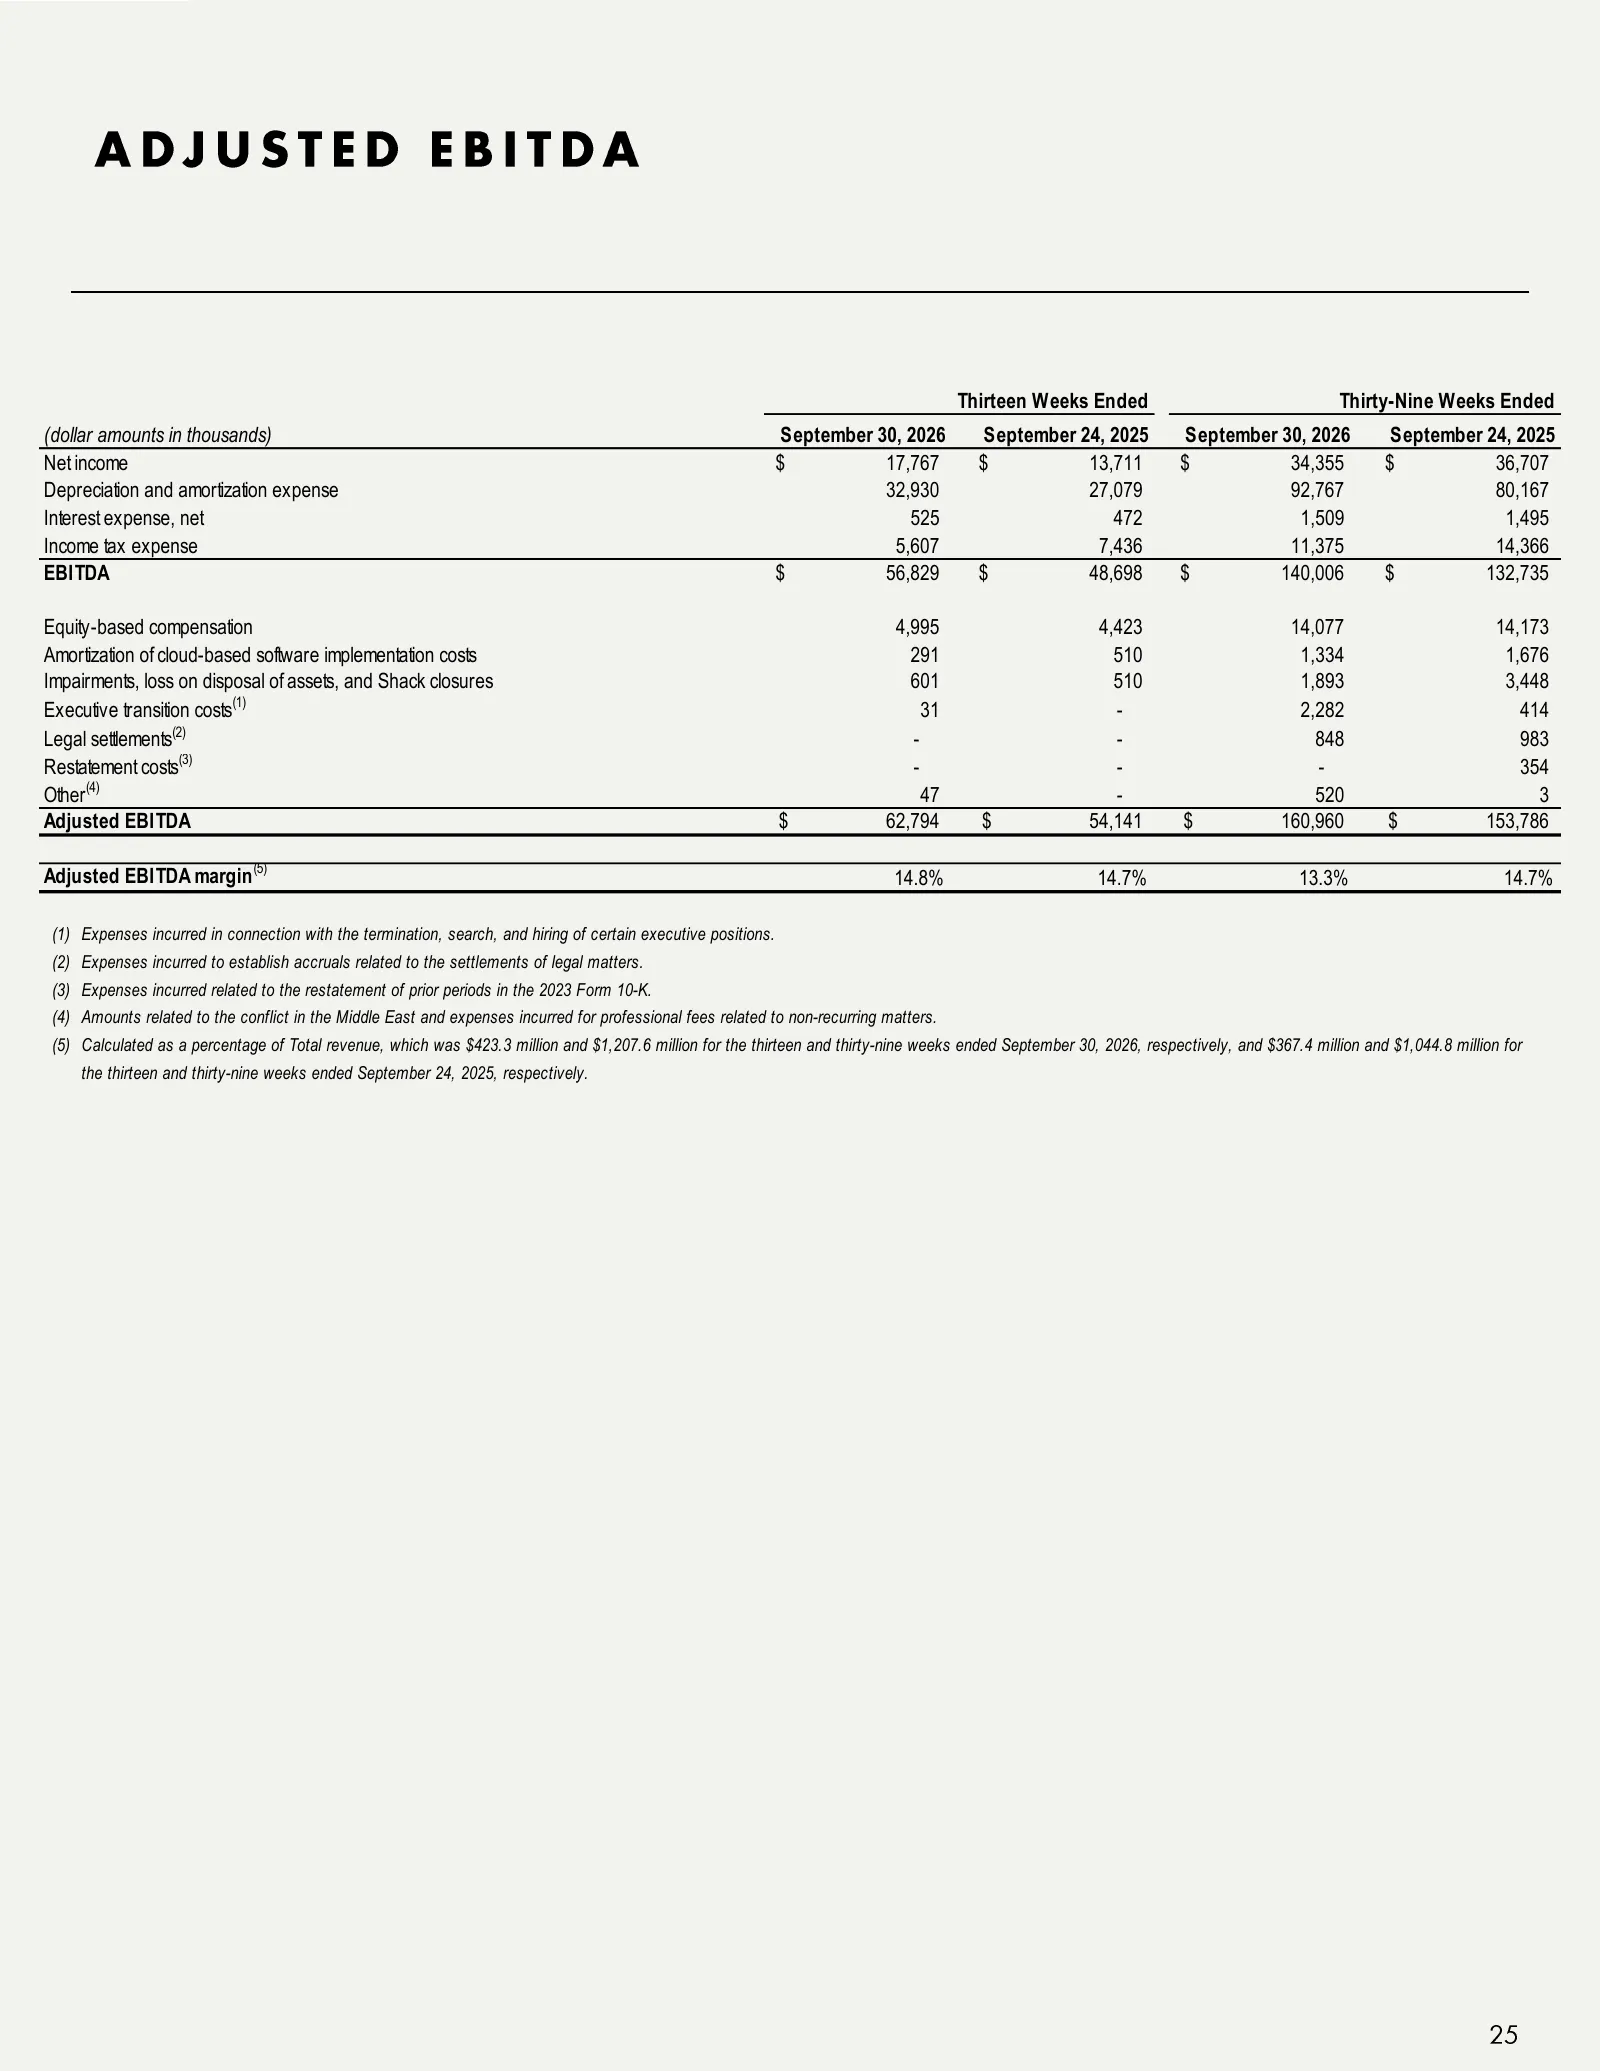
ADJUSTED EBITDA Thirteen Weeks Ended Thirty-Nine Weeks Ended (dollar amounts in thousands) September 30, 2026 September 24, 2025 September 30, 2026 September 24, 2025 Net income $ 17,767 $ 13,711 $ 34,355 $ 36,707 Depreciation and amortization expense 32,930 27,079 92,767 80,167 Interest expense, ne
Slide 26: Adjusted Pro Forma Net Income and EPS Definitions
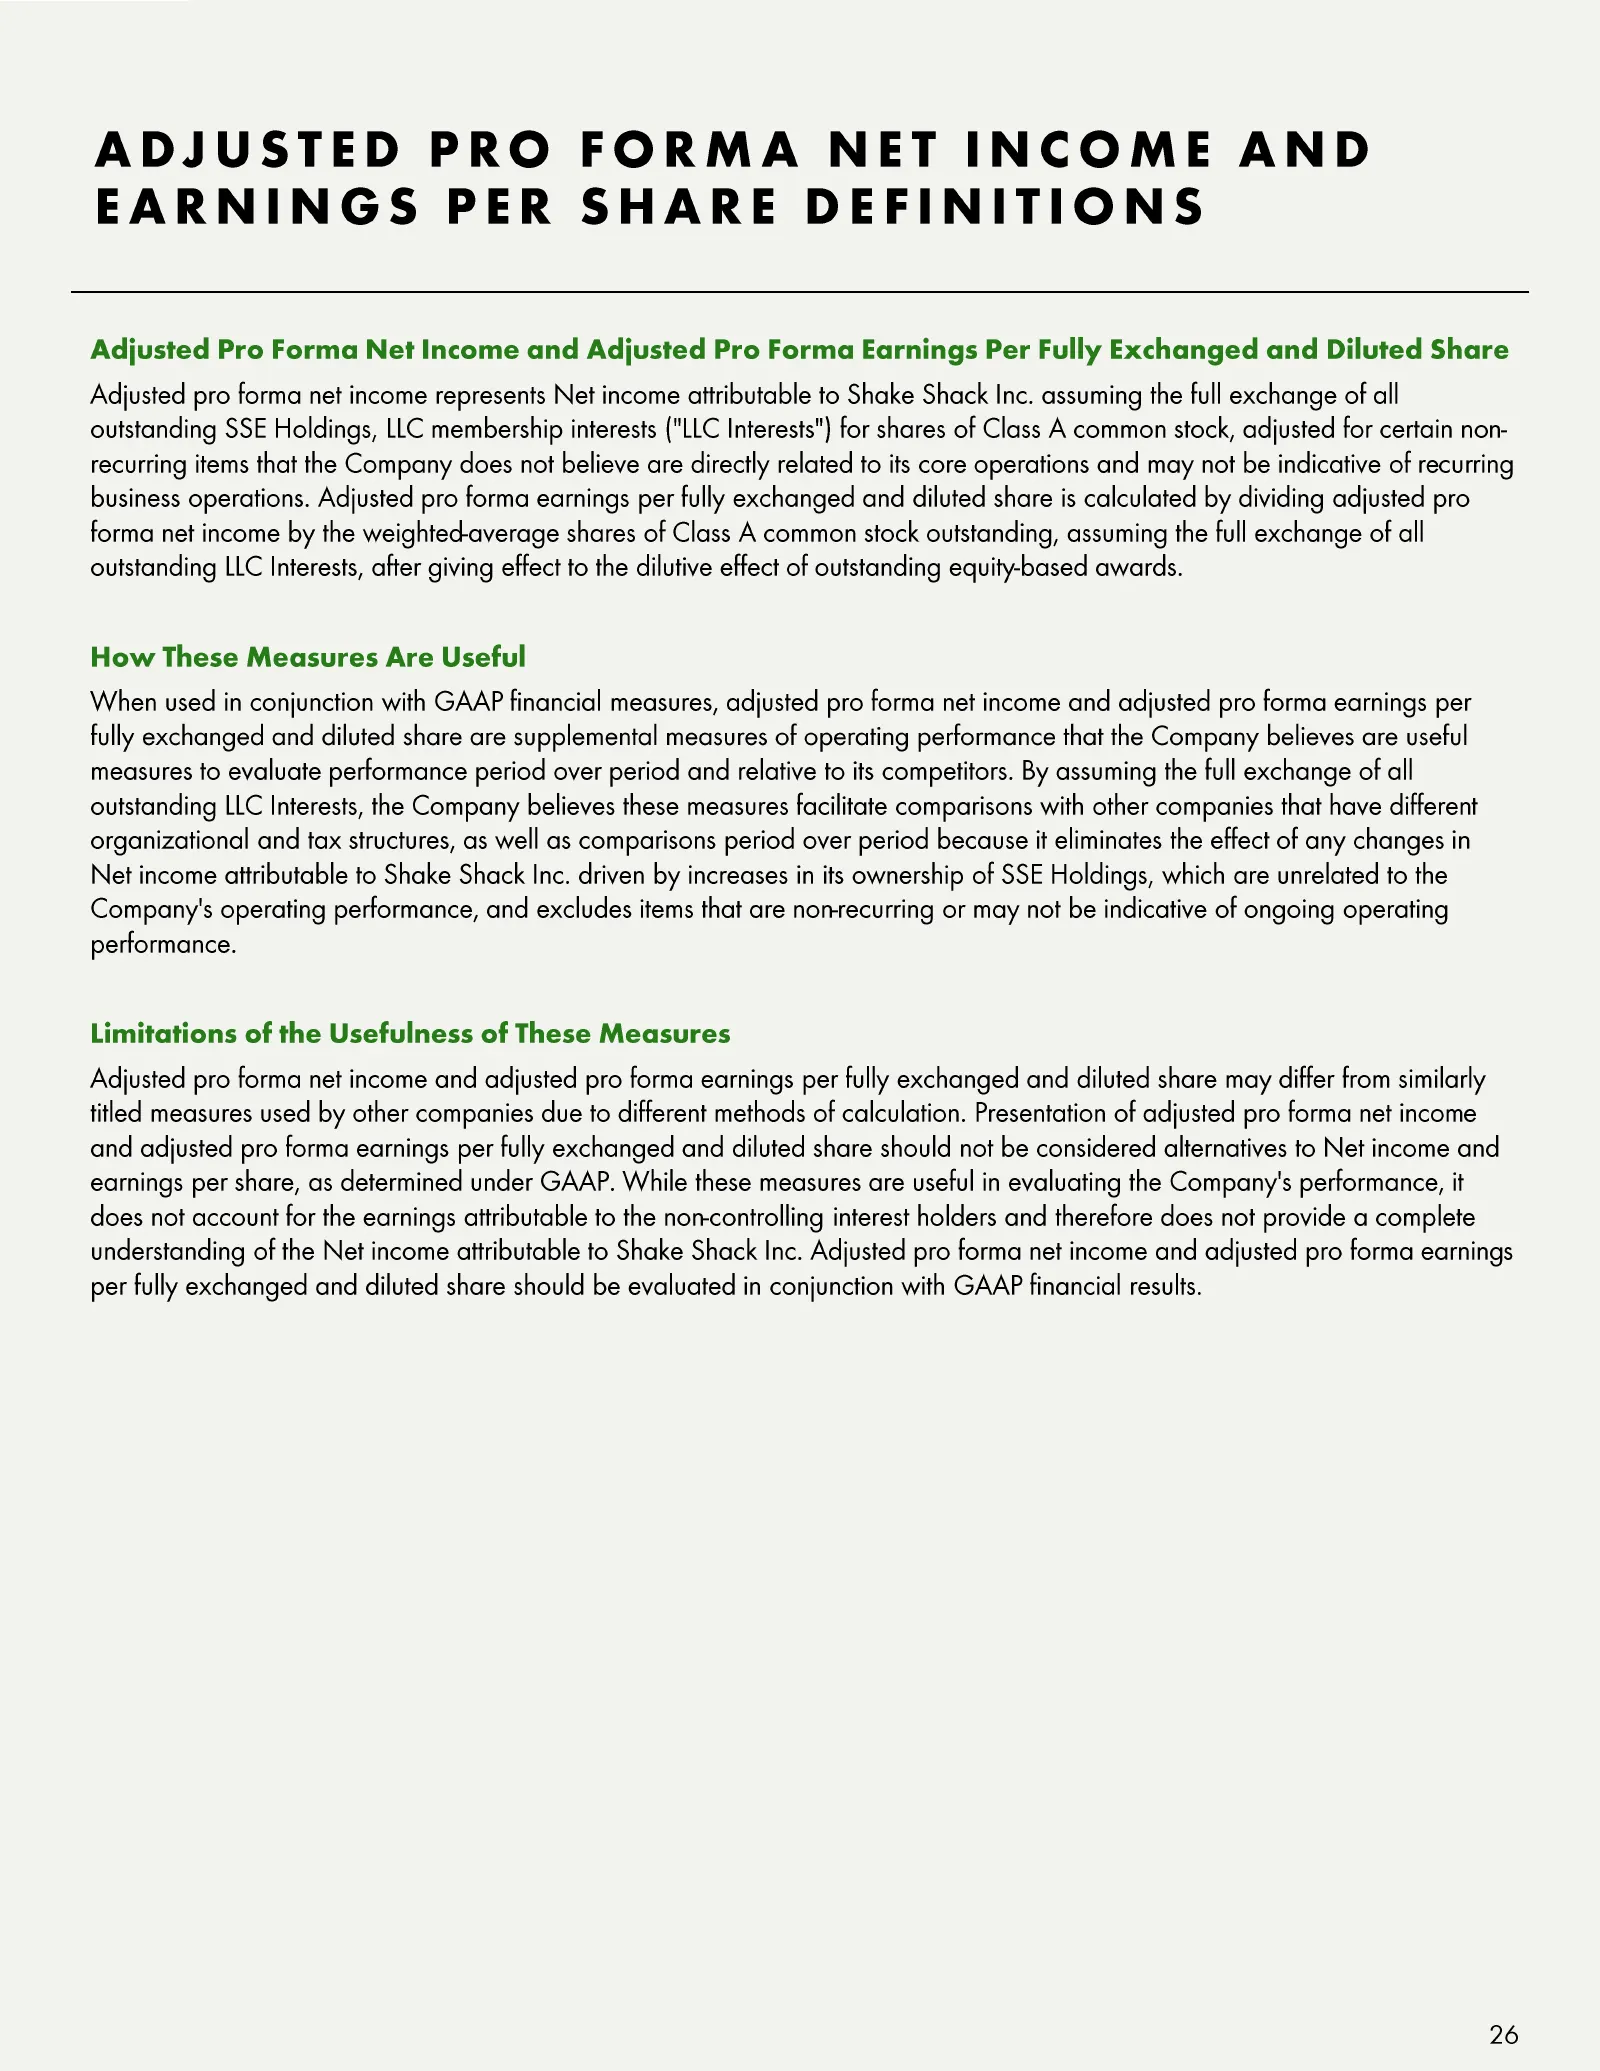
ADJUSTED PRO FORMA NET INCOME AND EARNINGS PER SHARE DEFINITIONS Adjusted Pro Forma Net Income and Adjusted Pro Forma Earnings Per Fully Exchanged and Diluted Share Adjusted pro forma net income represents Net income attributable to Shake Shack Inc. assuming the full exchange of all outstanding SSE
Slide 27: Adjusted Pro Forma Net Income and Earnings Per Share
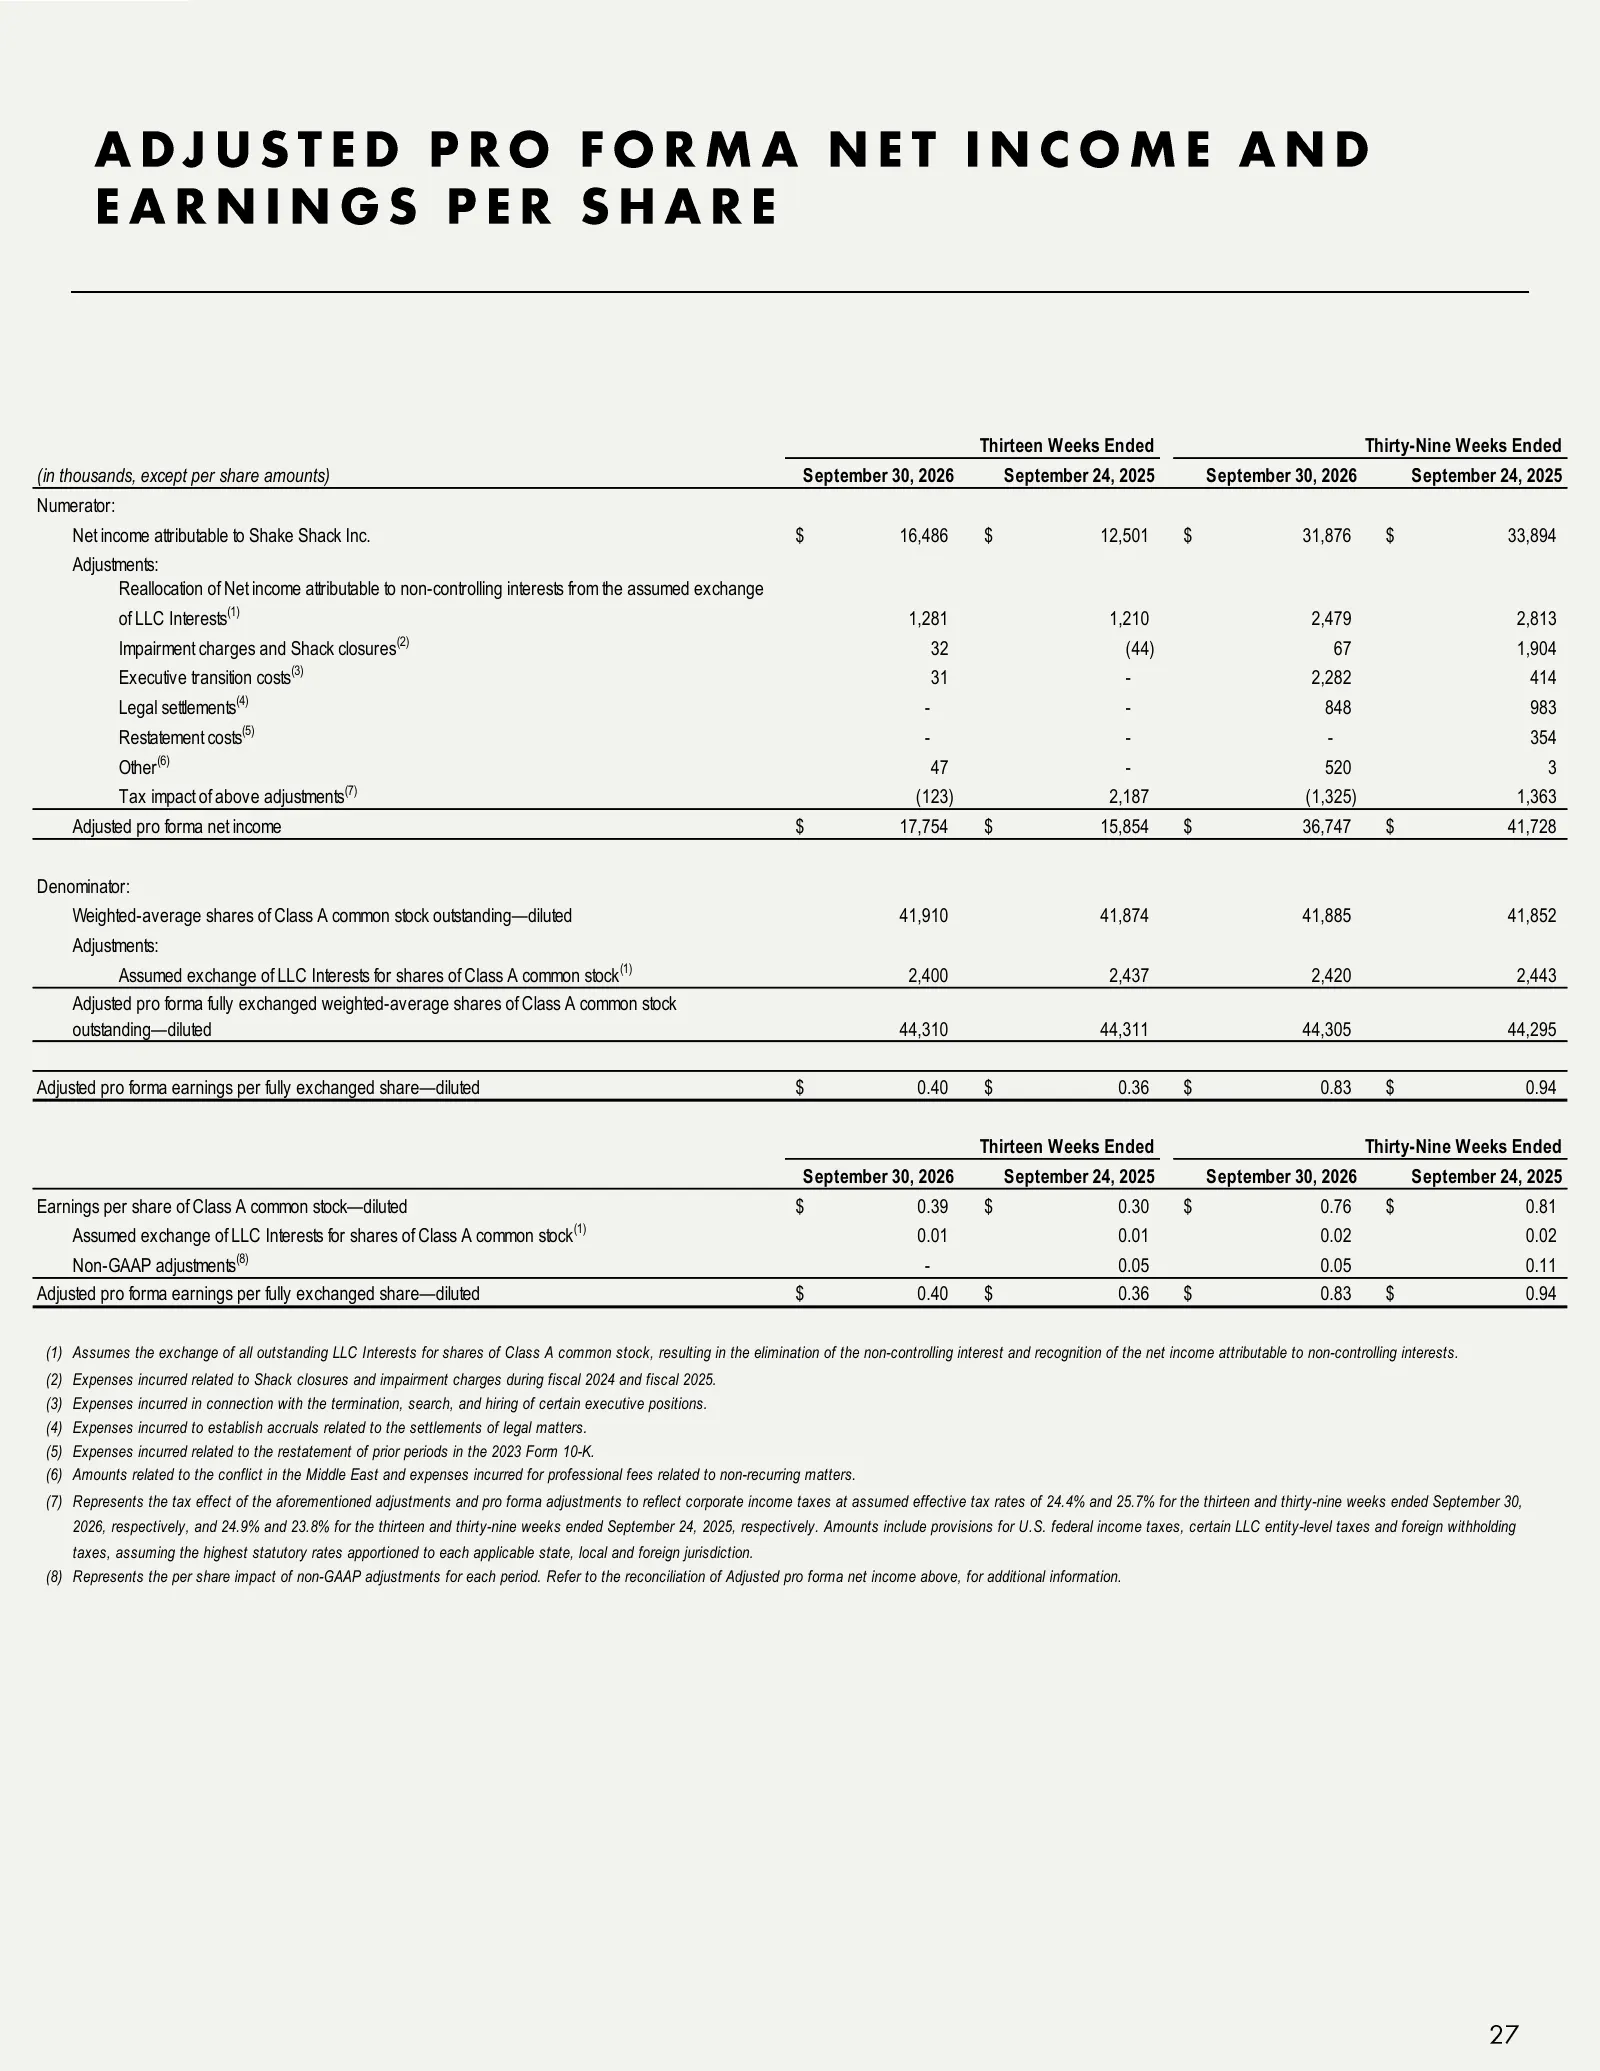
ADJUSTED PRO FORMA NET INCOME AND EARNINGS PER SHARE Thirteen Weeks Ended Thirty-Nine Weeks Ended (in thousands, except per share amounts) September 30, 2026 September 24, 2025 September 30, 2026 September 24, 2025 Numerator: Net income attributable to Shake Shack Inc. $ 16,486 $ 12,501 $ 31,876 $ 3
Slide 28: Adjusted Pro Forma Effective Tax Rate Definitions
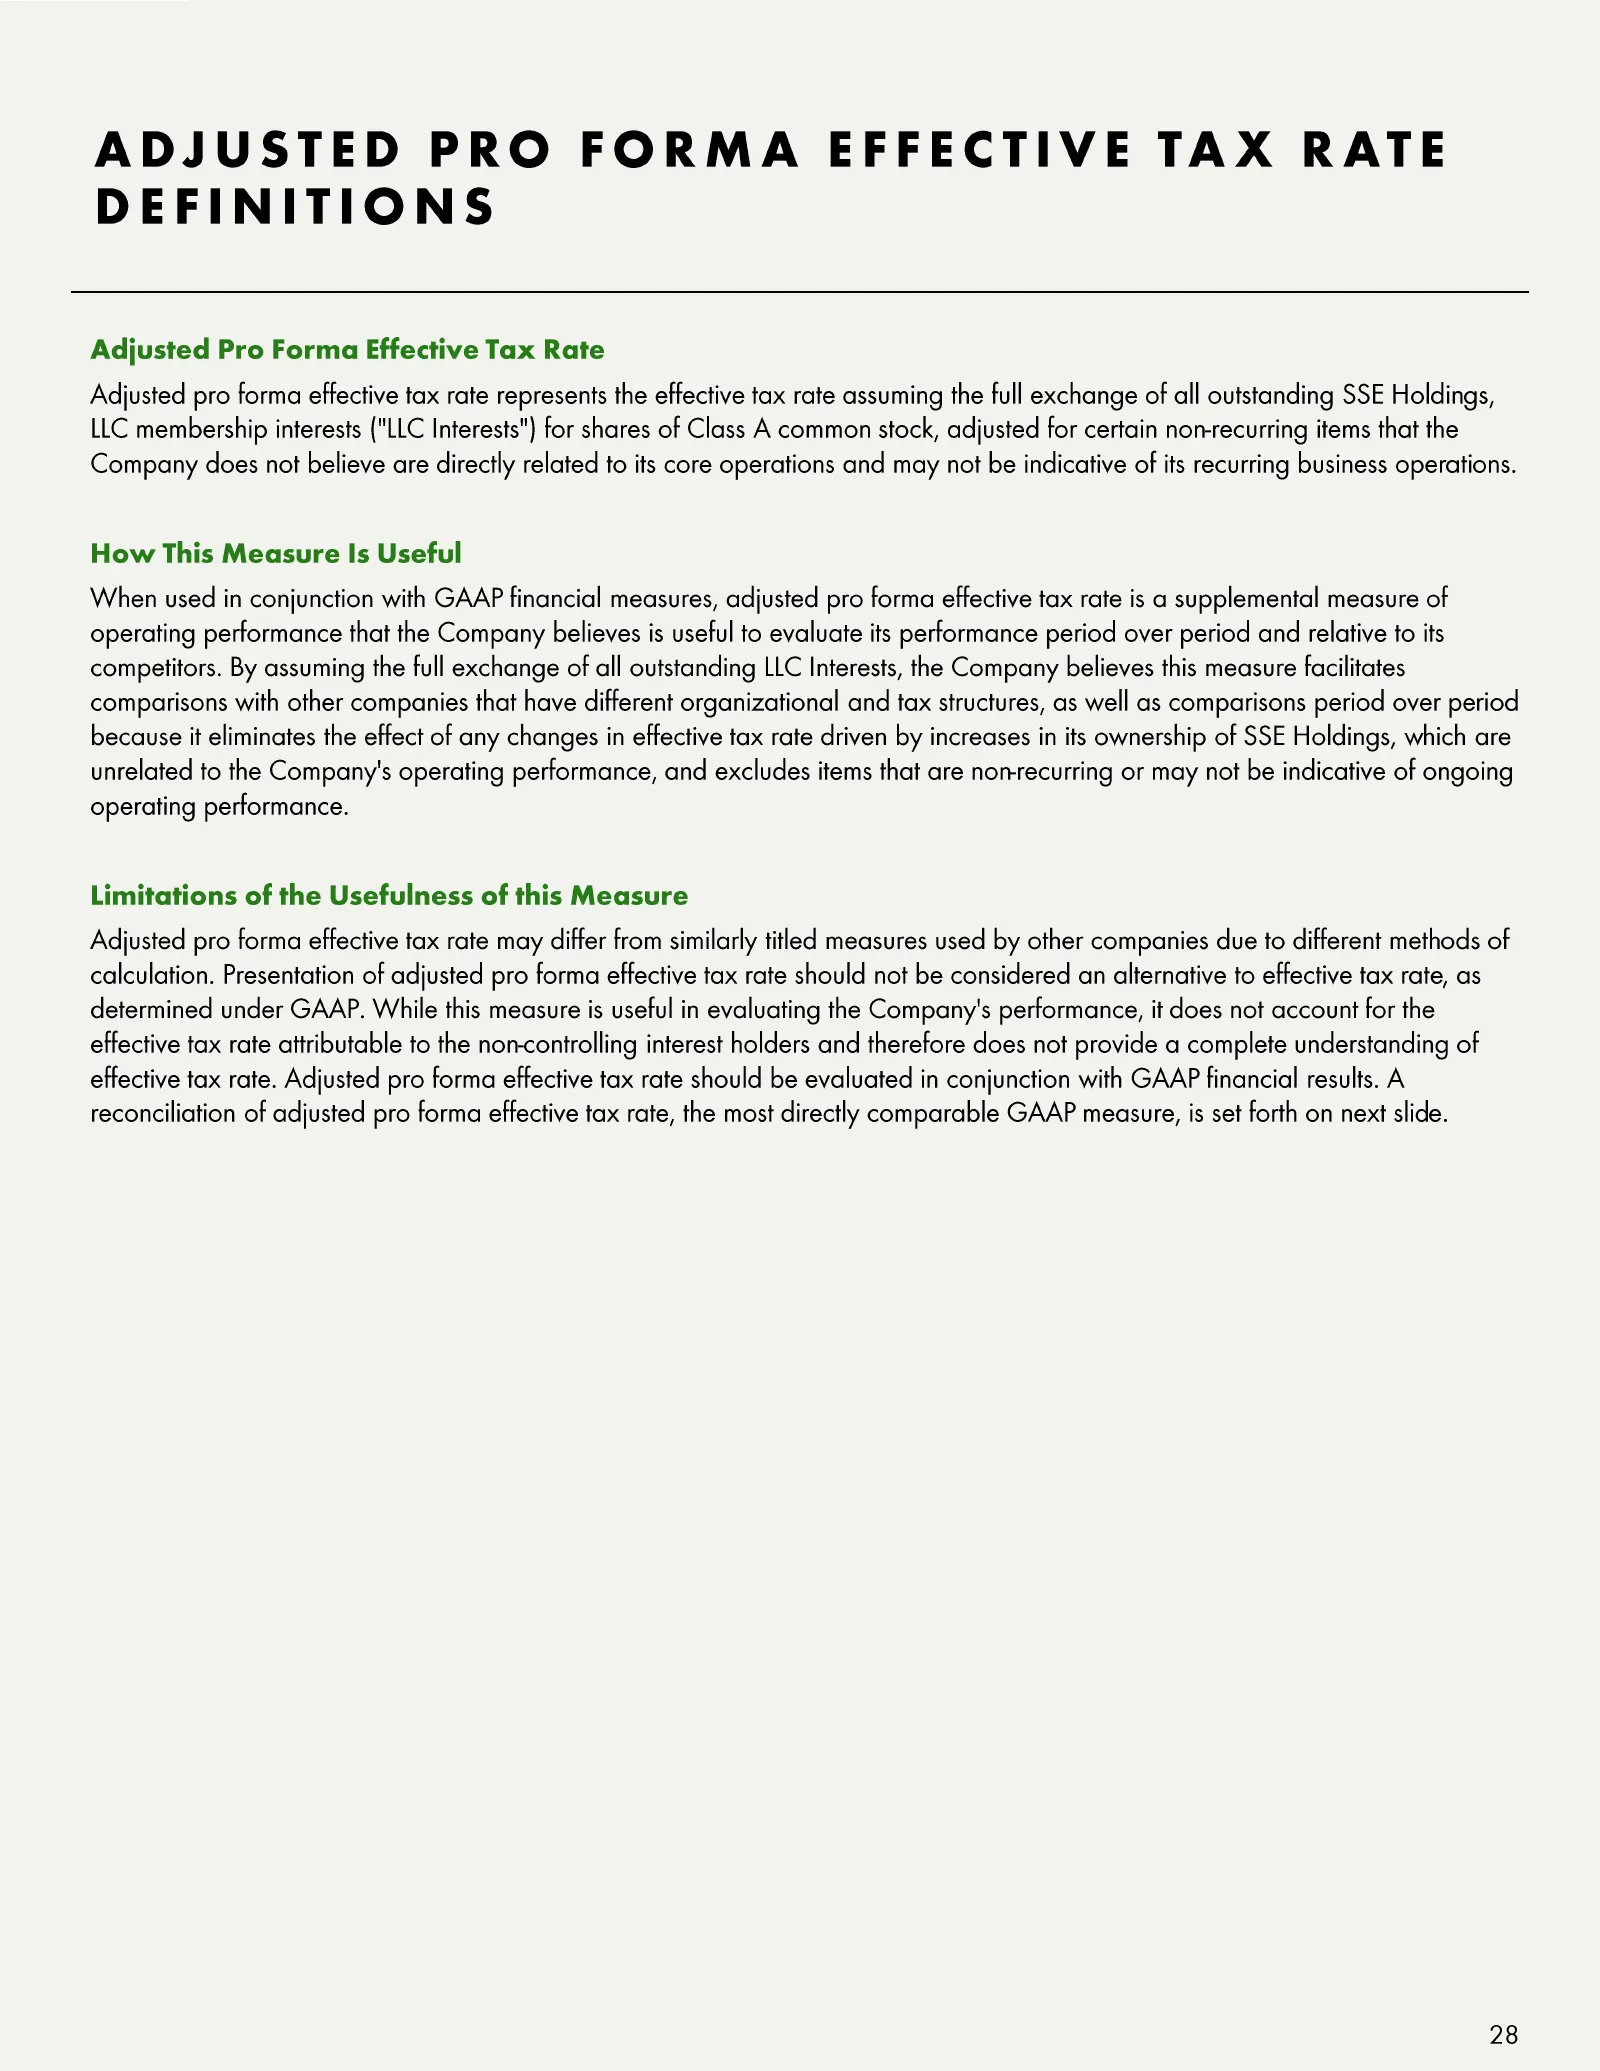
ADJUSTED PRO FORMA EFFECTIVE TAX RATE DEFINITIONS Adjusted Pro Forma Effective Tax Rate Adjusted pro forma effective tax rate represents the effective tax rate assuming the full exchange of all outstandingdings, SSE Hol LLC membership interests ("LLC Interests") for shares of Class A common stock, a
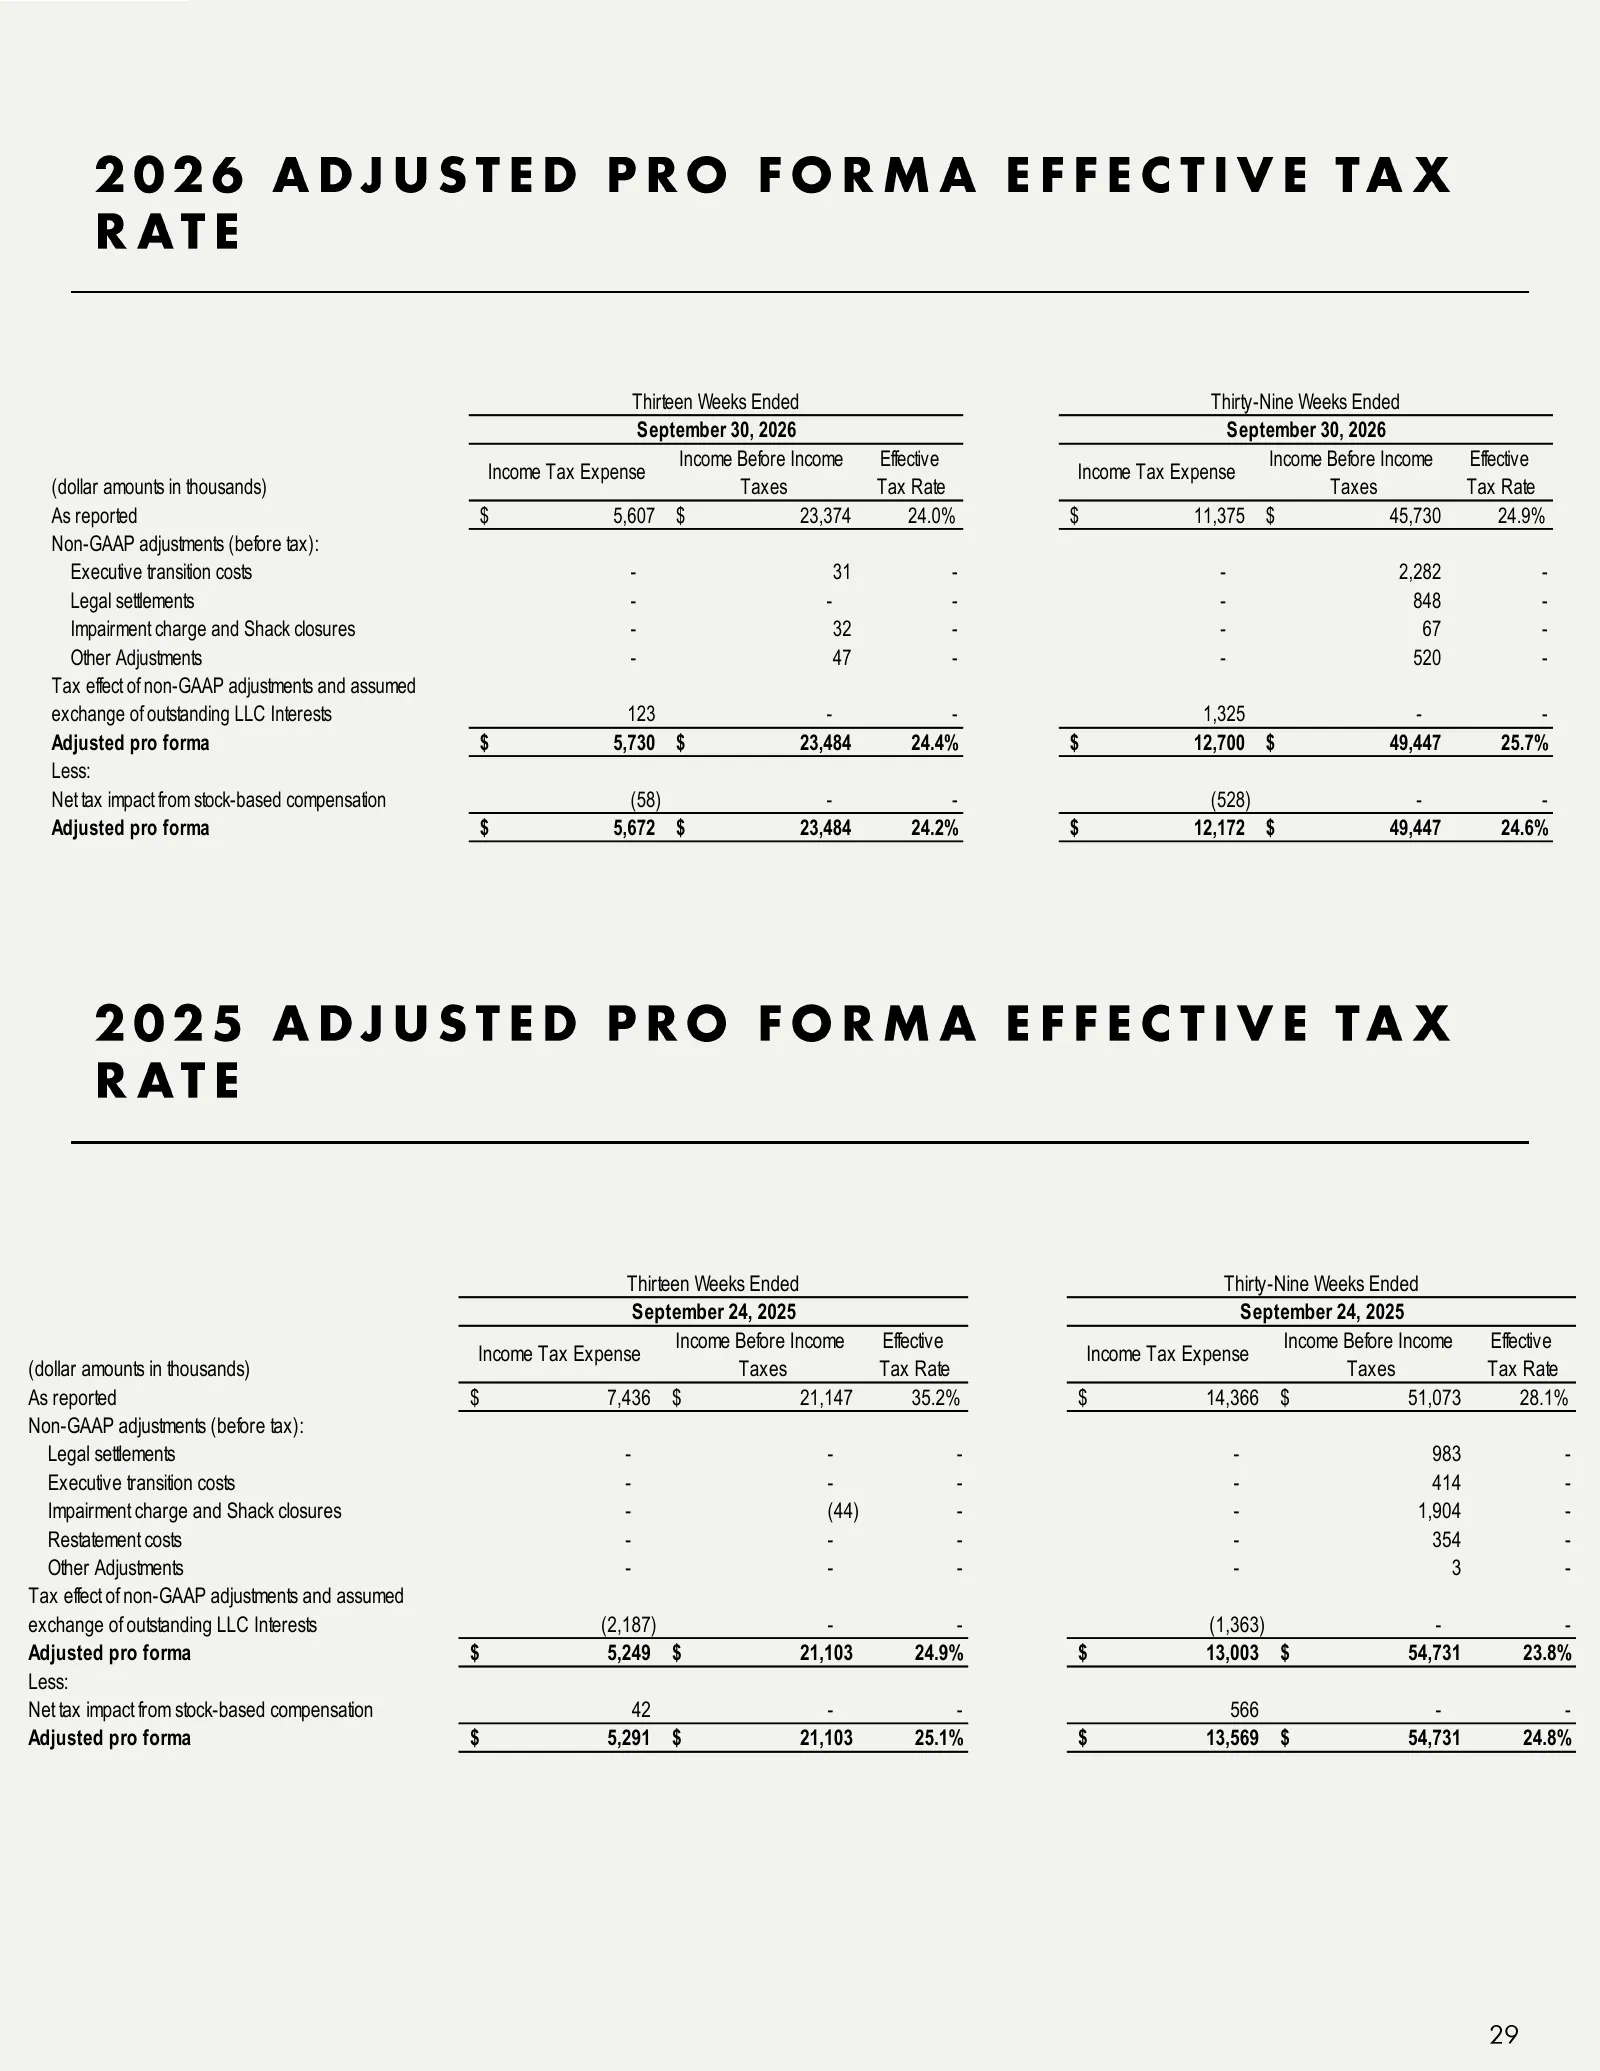
Slide 29: Adjusted Pro Forma Effective Tax Rate
2026 ADJUSTED PRO FORMA EFFECTIVE TAX RATE Thirteen Weeks Ended Thirty-Nine Weeks Ended September 30, 2026 September 30, 2026 Income Before Income Effective Income Before Income Effective Income Tax Expense Income Tax Expense (dollar amounts in thousands) Taxes Tax Rate Taxes Tax Rate As reported $

Slide 30: Contact Information
CONTACT INFORMATION INVESTOR CONTACT Alison Sternberg, Shake Shack Head of Investor Relations (844) Shack -04 (844 -742 -2504) investor@shakeshack.com MEDIA CONTACT Corey Gee, Shake Shack cblumenthal@shakeshack.com
Source: 6ix earnings call