OUTFRONT Media Inc. · NYSE:OUT
OUTFRONT Media — CBS Outdoor Americas — Q3 2014 Earnings Presentation
24 slides from OUTFRONT Media's earnings presentation, Nov 4, 2014

Slide 1: 2014 Third Quarter
OL HS) 2014 Third Quarter ‘eolenmpeeize November 4, 2014
Slide 2: Safe Harbor Disclaimer
Safe Harbor Disclaimer Forward-Looking Statements We have made statements in this presentation that are forwardtlooking statements within the meaning of the federal securities laws, including the Private Securities Litigation Reform Act of 1995. You can identify forwarcHlooking statements by the use

Slide 3: Jeremy Male, CEO
Jeremy Male CEO
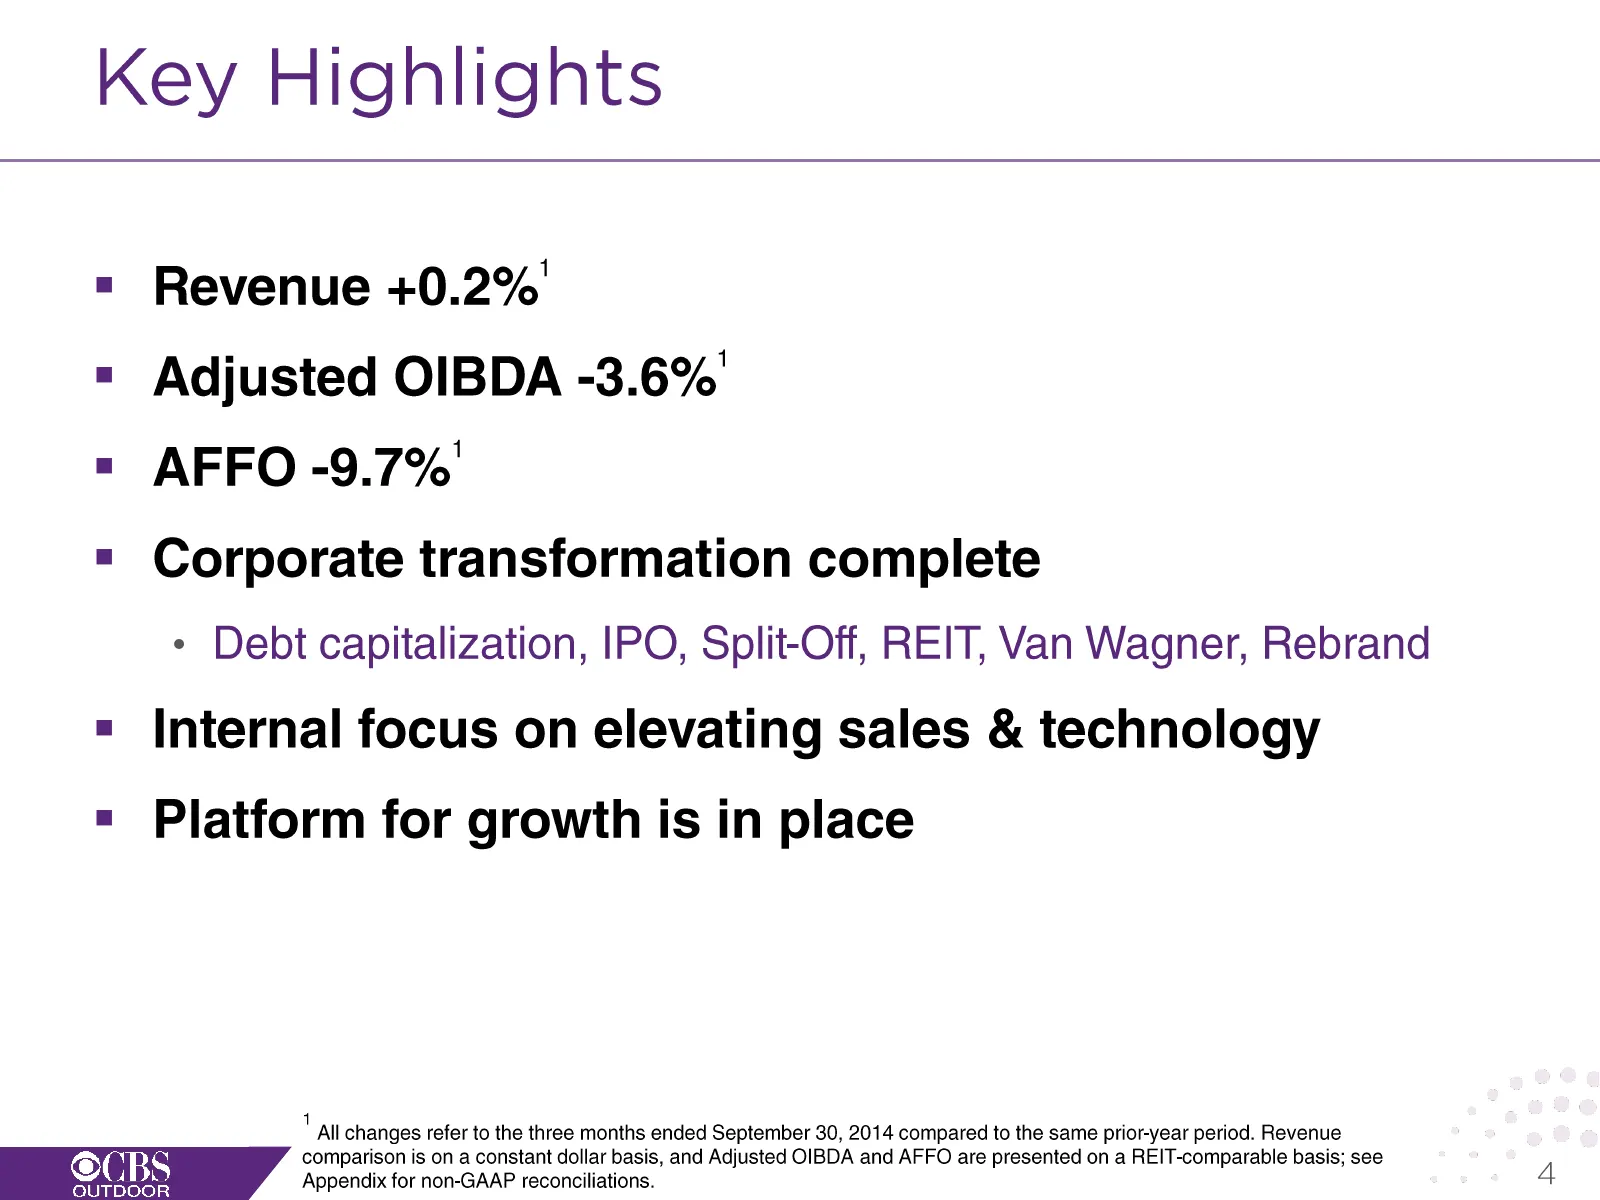
Slide 4: Key Highlights
Key Highlights = Revenue +0.2% = Adjusted OIBDA -3.6%' = AFFO -9.7%' = Corporate transformation complete * Debt capitalization, IPO, Split-Off, REIT, Van Wagner, Rebrand = Internal focus on elevating sales & technology = Platform for growth is in place 1 All changes refer to the three months ended S
Slide 5: Donald Shassian, EVP & CFO
Donald Shassian EVP & CFO
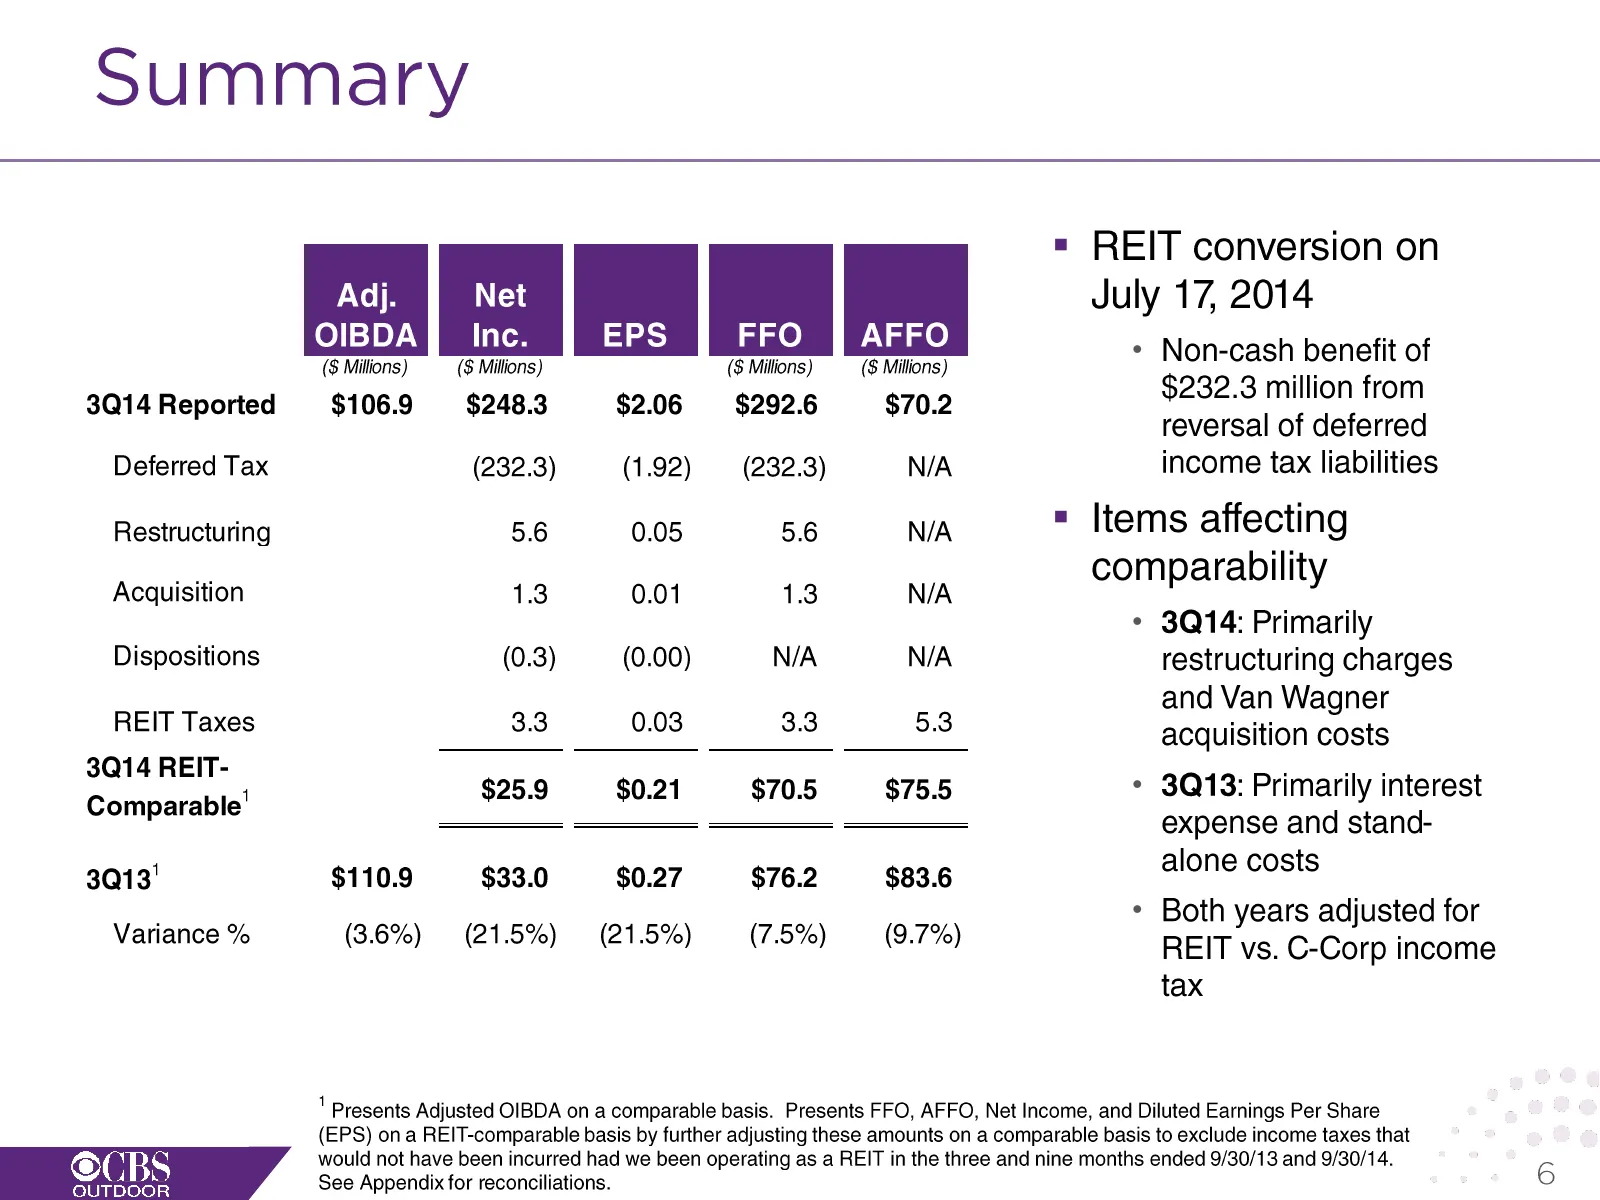
Slide 6: Summary
Summary Adj. = REIT conversion on OIBDA ¢ Non-cash benefit of ($ Millions) ($ Millions) ($ Millions) ($ Millions) 2 2 ill f 3Q14 Reported $106.9 $2483 $2.06 $2926 $702 $232.3 million from reversal of deferred Deferred Tax (232.3) (1.92) (232.3) N/A income tax liabilities Restructuring 56 0.08 56 N/A
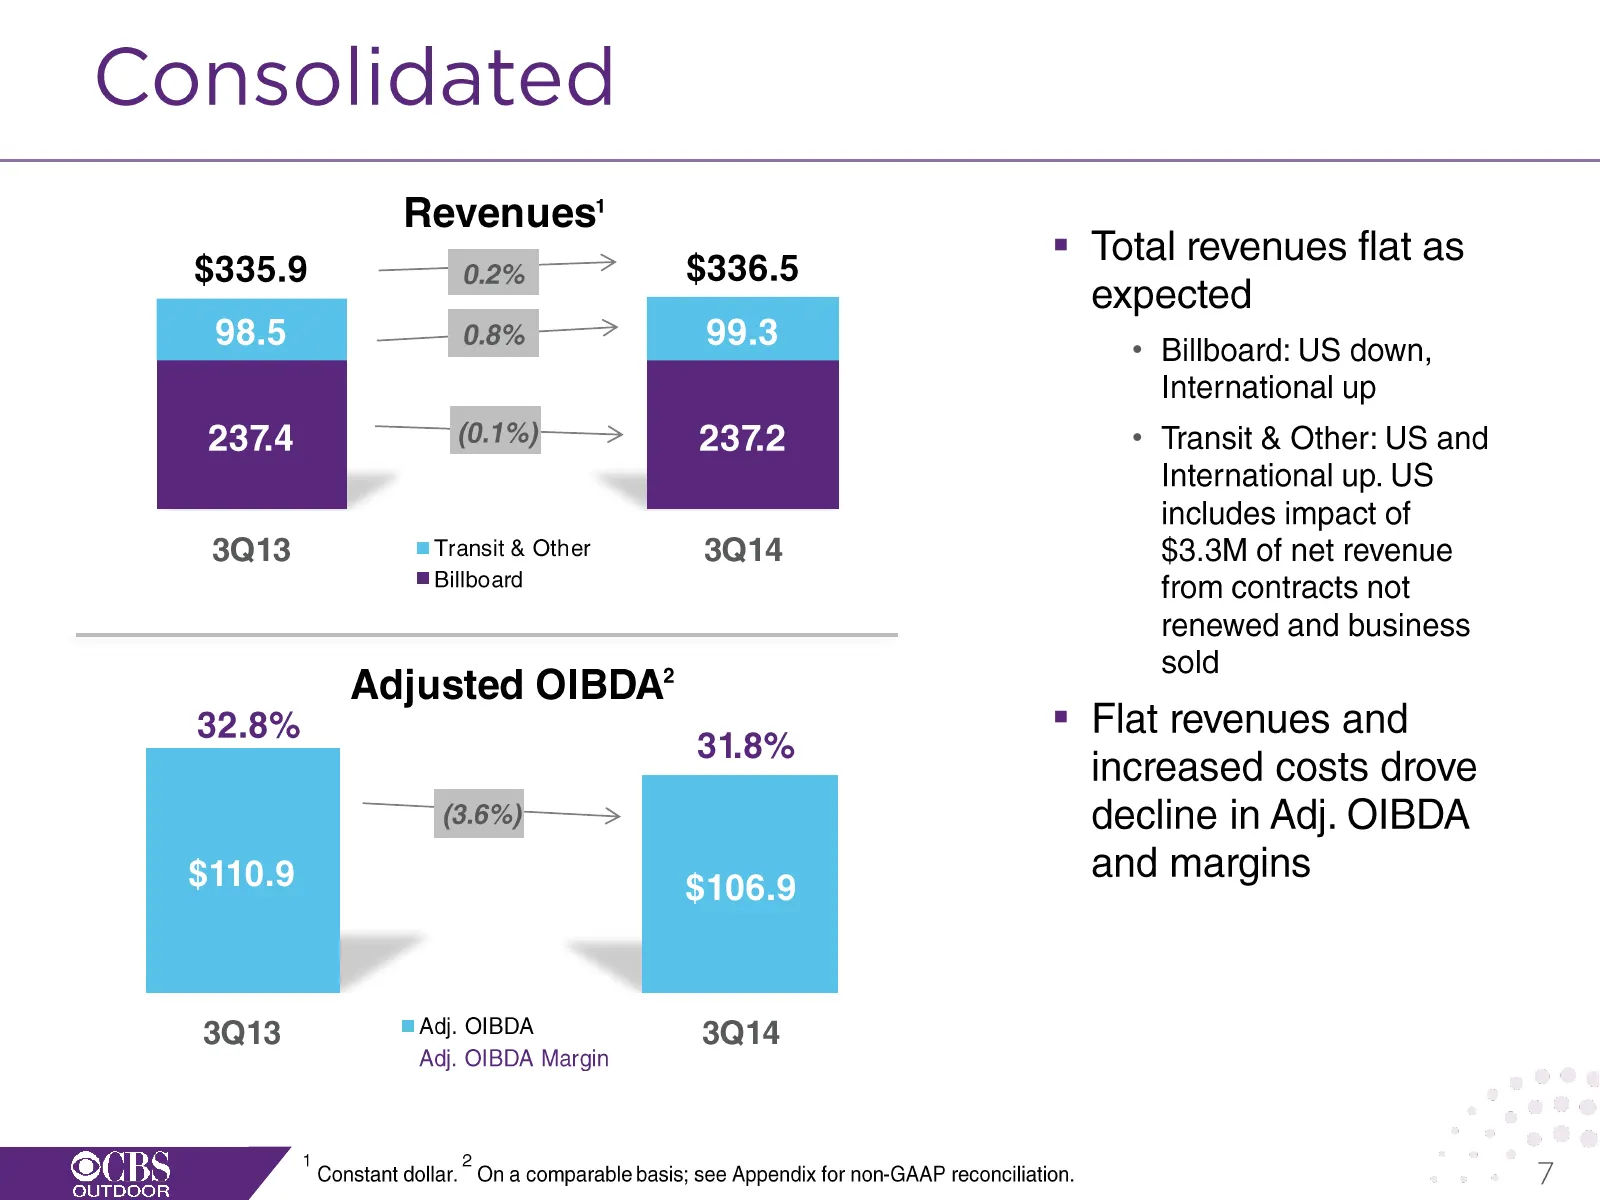
Slide 7: Consolidated
Consolidated Revenues' $335.9 ae . $336.5 = Total revenues flat as : = ' expected TS) 08% > * Billboard: US down, International up 237.4 (0.1%)——> 237.2 * Transit & Other: US and International up. US includes impact of 3013 = Transit & Other 3014 $3.3M of net revenue ™ Billboard from contracts not r
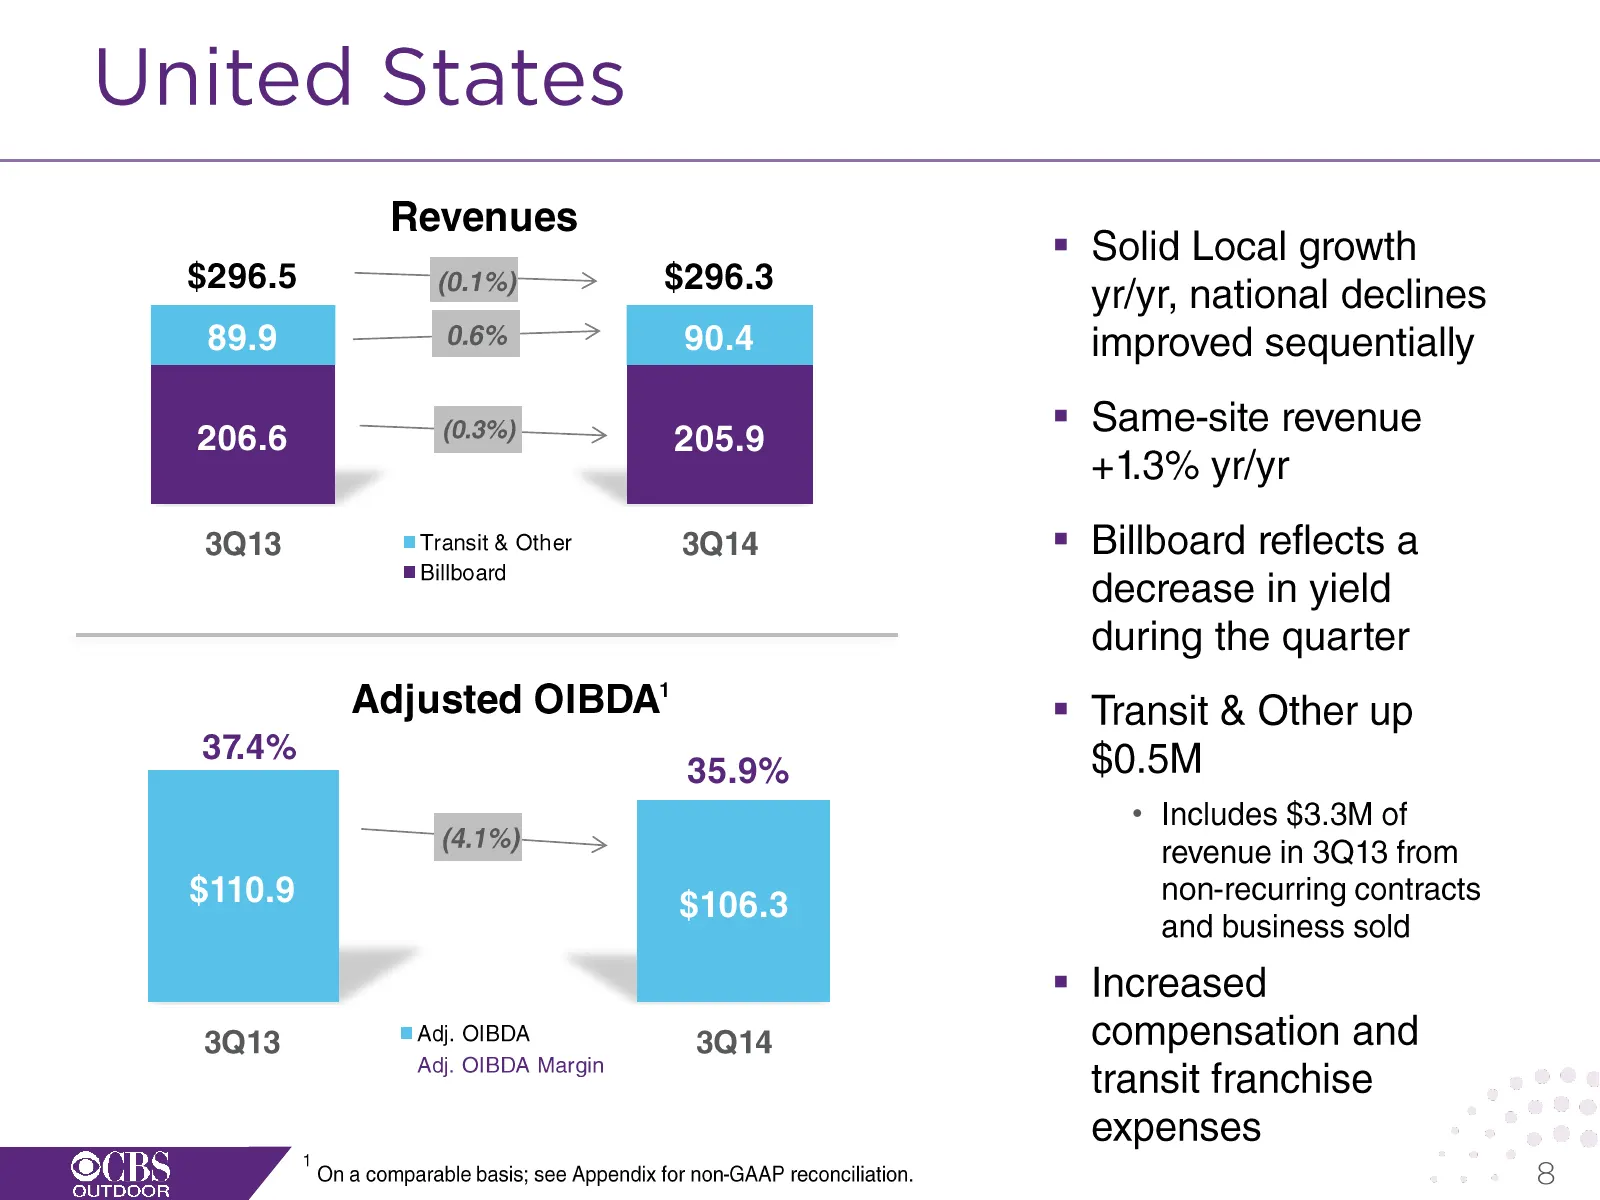
Slide 8: United States
United States Revenues $296.5 ———(Oi%j—=> $296.3 —— 0.6% ——> ——— (0.3%) ——s 3Q13 = Transit & Other 3014 @ Billboard Adjusted OIBDA' eo} 37.4% 35.9% —— (4.1%) ——s $106.3 3013 = Adj. OIBDA 3014 Adj. OIBDA Margin 1 On a comparable basis; see Appendix for non-GAAP reconciliation. Solid Local growth yr/y
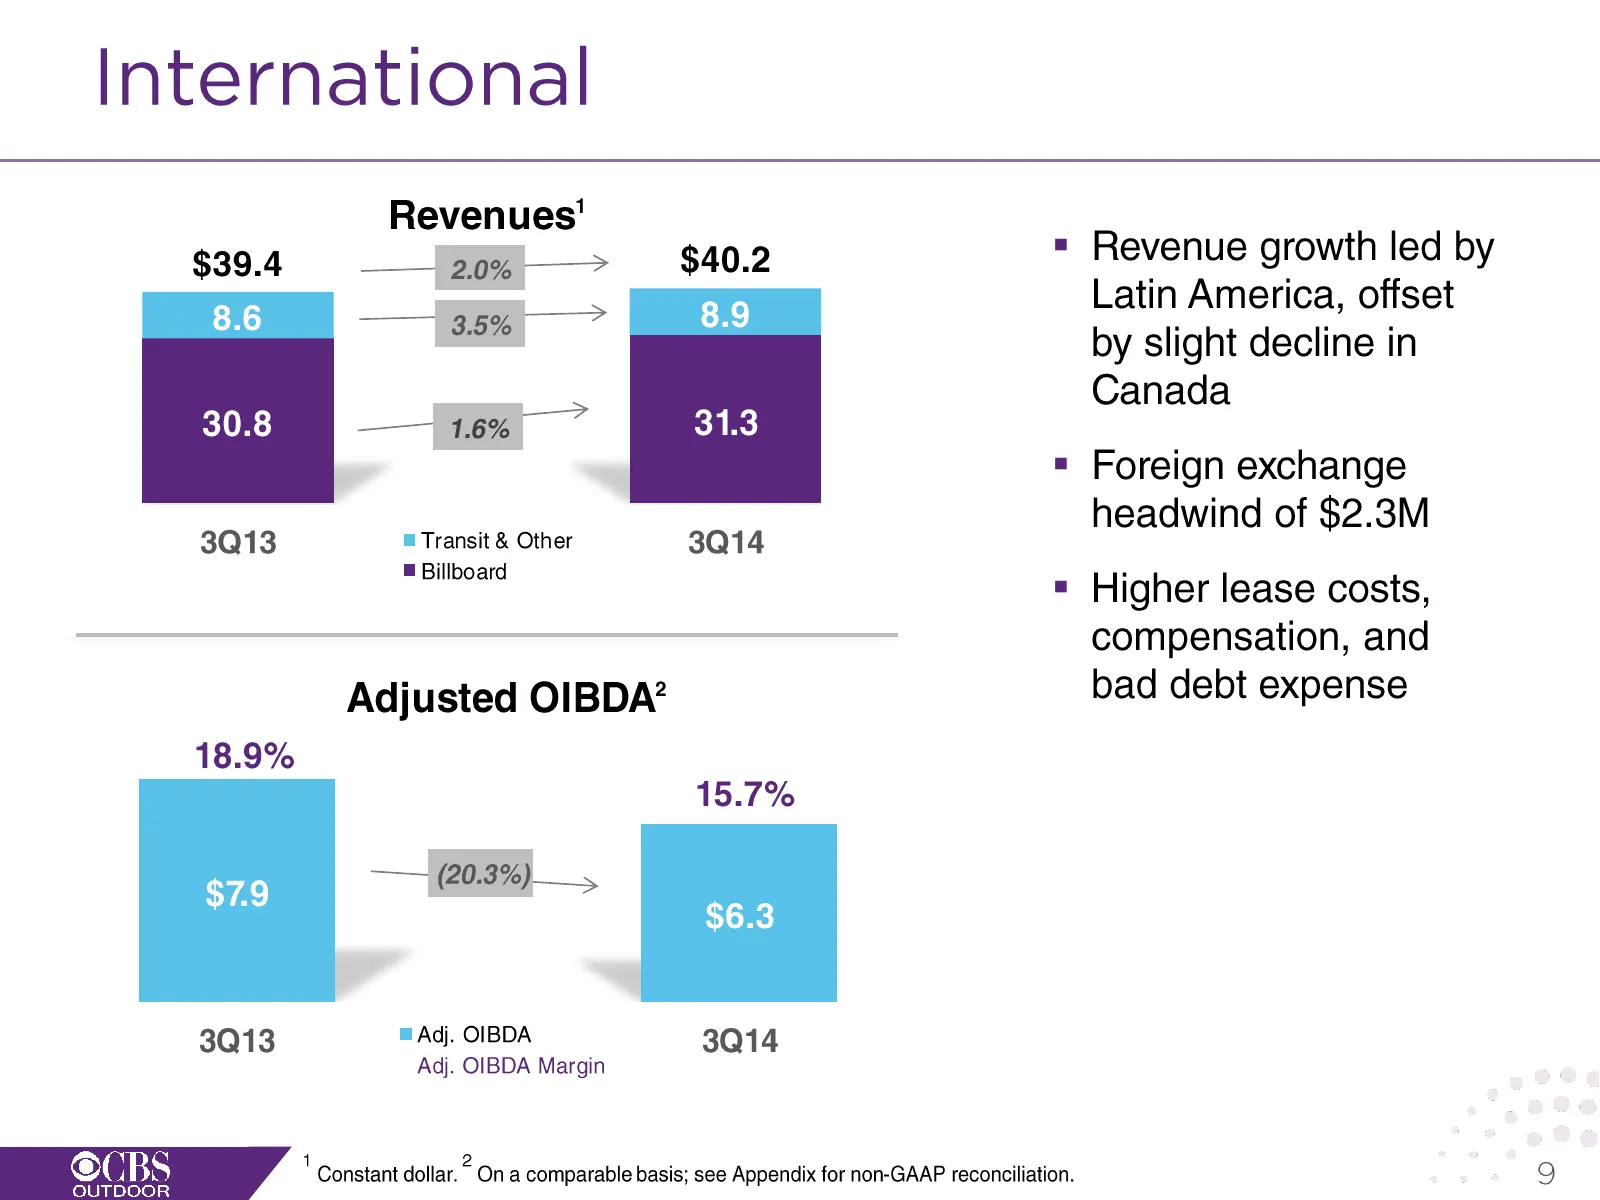
Slide 9: International
International Revenues’ $39.4 —— 2.0% —> » Revenue growth led by Latin America, offset by slight decline in Canada " Foreign exchange headwind of $2.3M 3Q13 = Transit & Other 3Q14 weve " Higher lease costs, compensation, and Adjusted OIBDA? bad debt expense 18.9% 15.7% —- je 3013 = Adj. OIBDA 3014 A
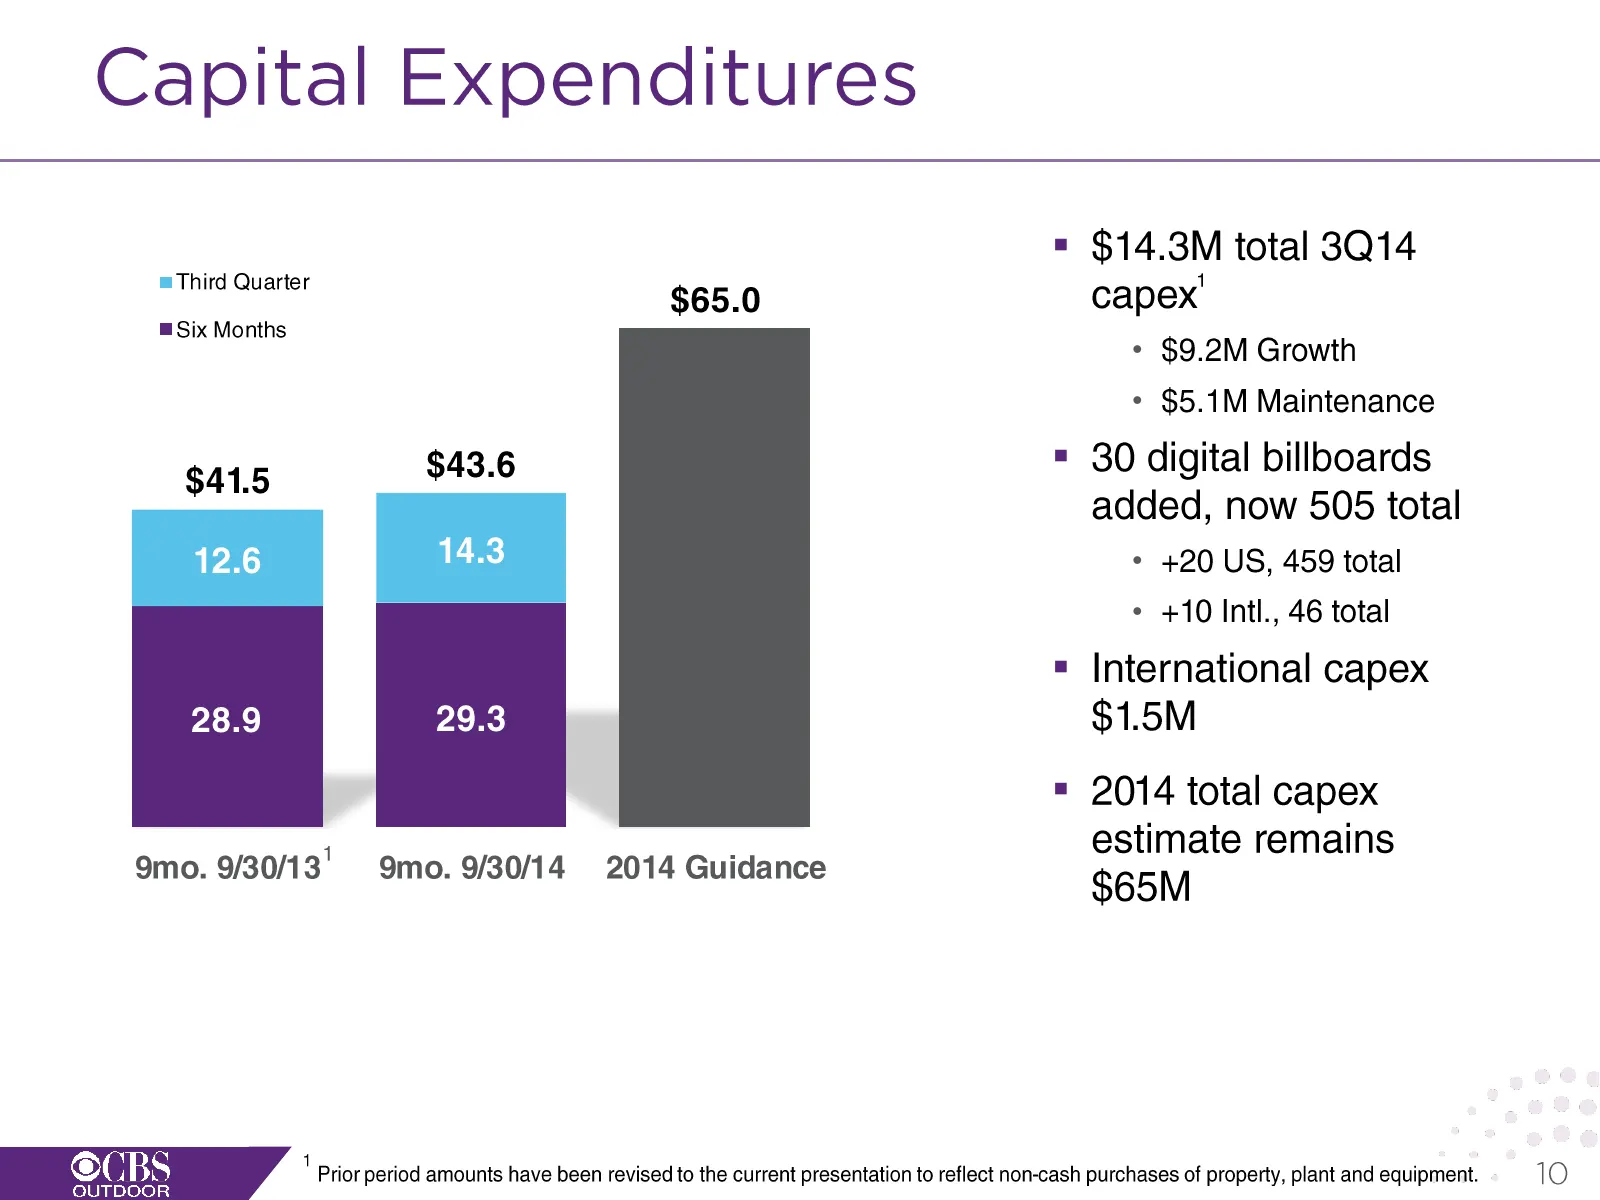
Slide 10: Capital Expenditures
Capital Fxpenditures mThird Quarter ™Six Months $41.5 12.6 9mo. 9/30/13" $65.0 $43.6 9mo. 9/30/14 2014 Guidance $14.3M total 3014 capex’ * $9.2M Growth * $5.1M Maintenance 30 digital billboards added, now 505 total * +20 US, 459 total ¢ +10 Intl., 46 total International capex $1.5M 2014 total capex
Slide 11: Cash Flow
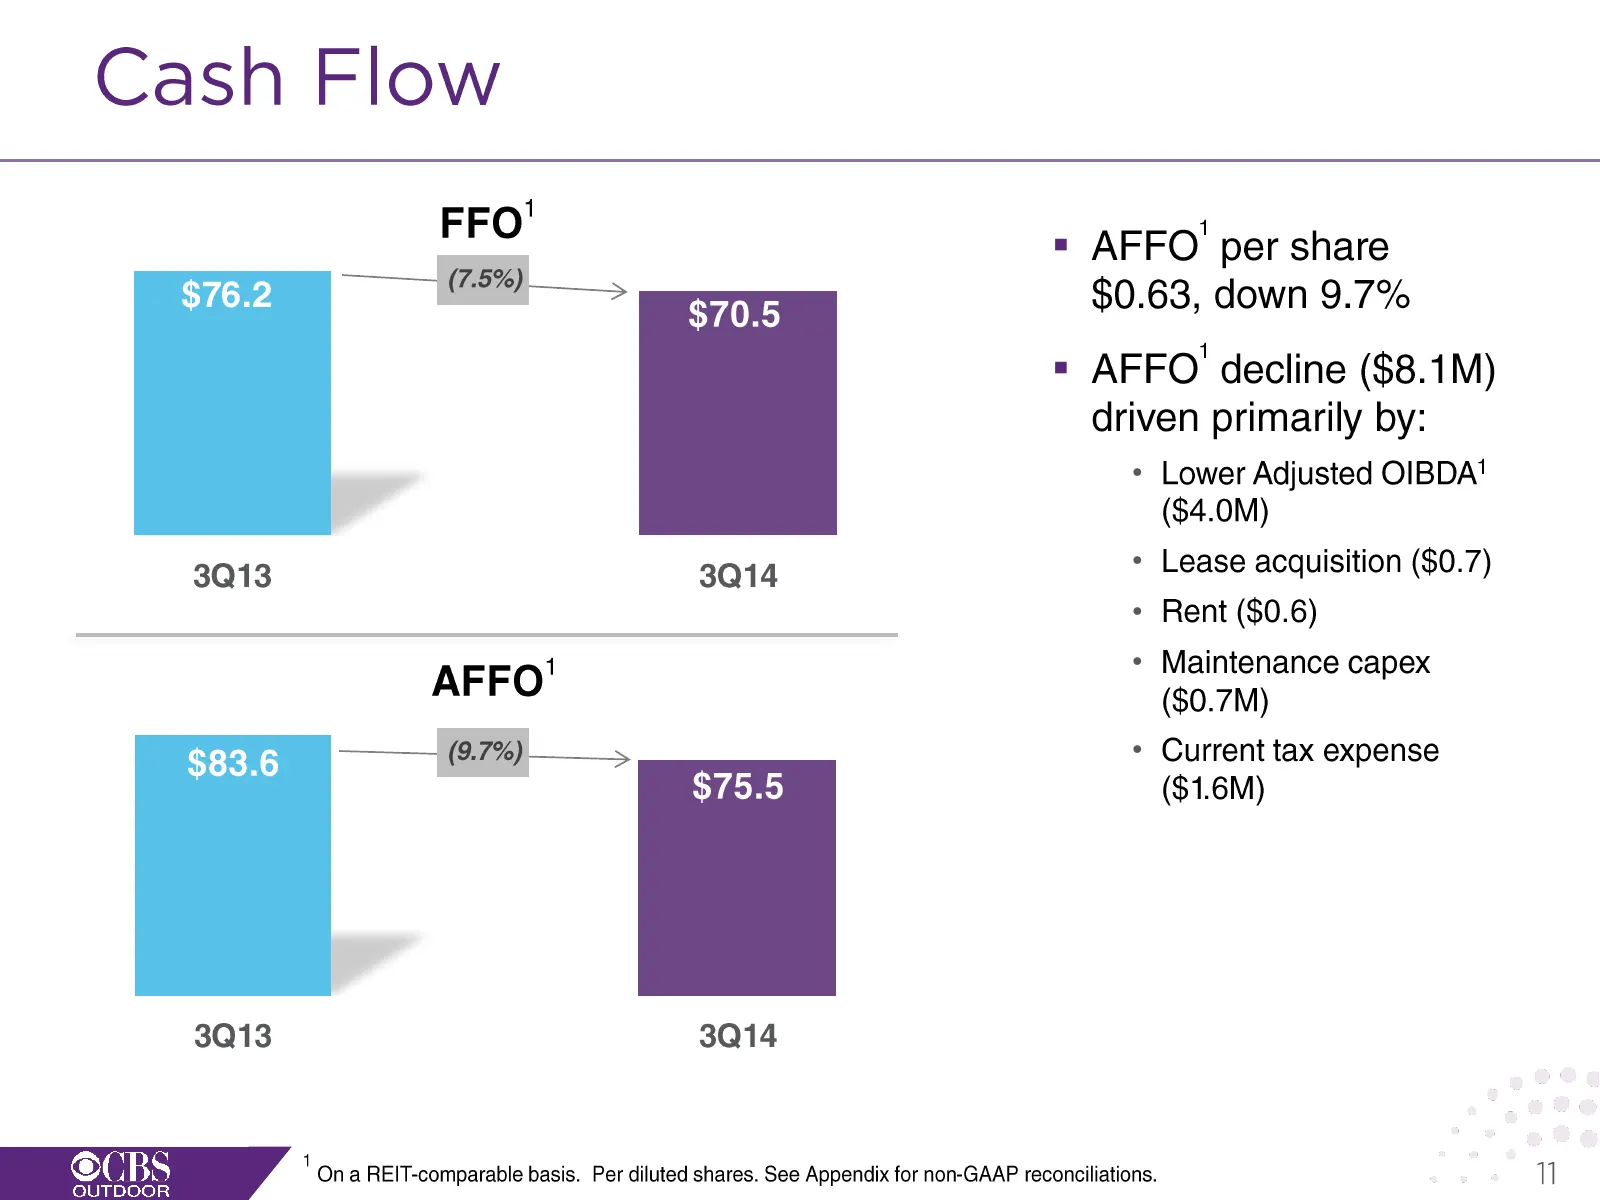
Cash Flow FFO = AFFO' per share (7.5%) __. $0.63, down 9.7% = AFFO' decline ($8.1M) driven primarily by: * Lower Adjusted OIBDA' ($4.0M) 3014 + Lease acquisition ($0.7) * Rent ($0.6) 3Q13 1 * Maintenance capex AFFO ($0.7M) (9.7%) ——__s * Current tax expense ($1.6M) 3Q13 3Q14 ' On a REIT-comparable b
Slide 12: Dividends
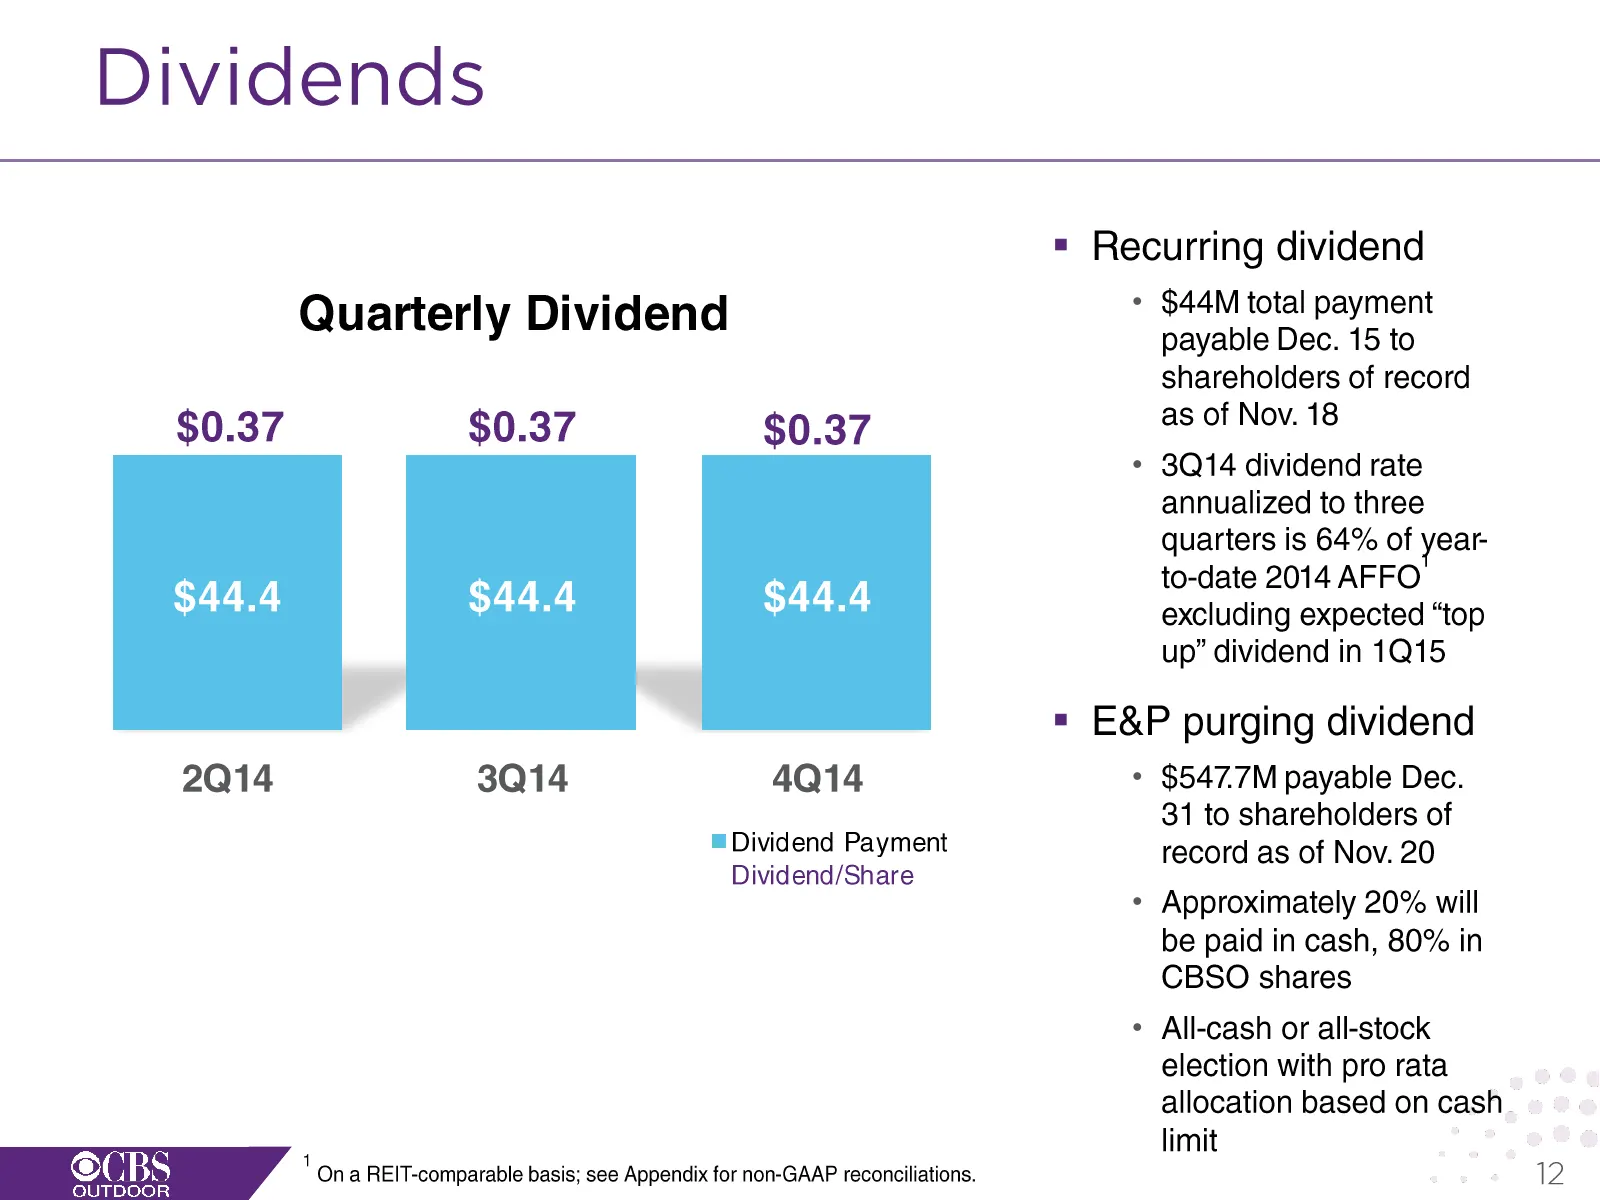
Dividends Quarterly Dividend $0.37 $0.37 $0.37 $44.4 $44.4 $44.4 2Q14 3Q14 4Q14 =Dividend Payment Dividend/Share 1 On a REIT-comparable basis; see Appendix for non-GAAP reconciliations. * Recurring dividend * $44M total payment payable Dec. 15 to shareholders of record as of Nov. 18 * 3Q14 dividend
Slide 13: Balance Sheet
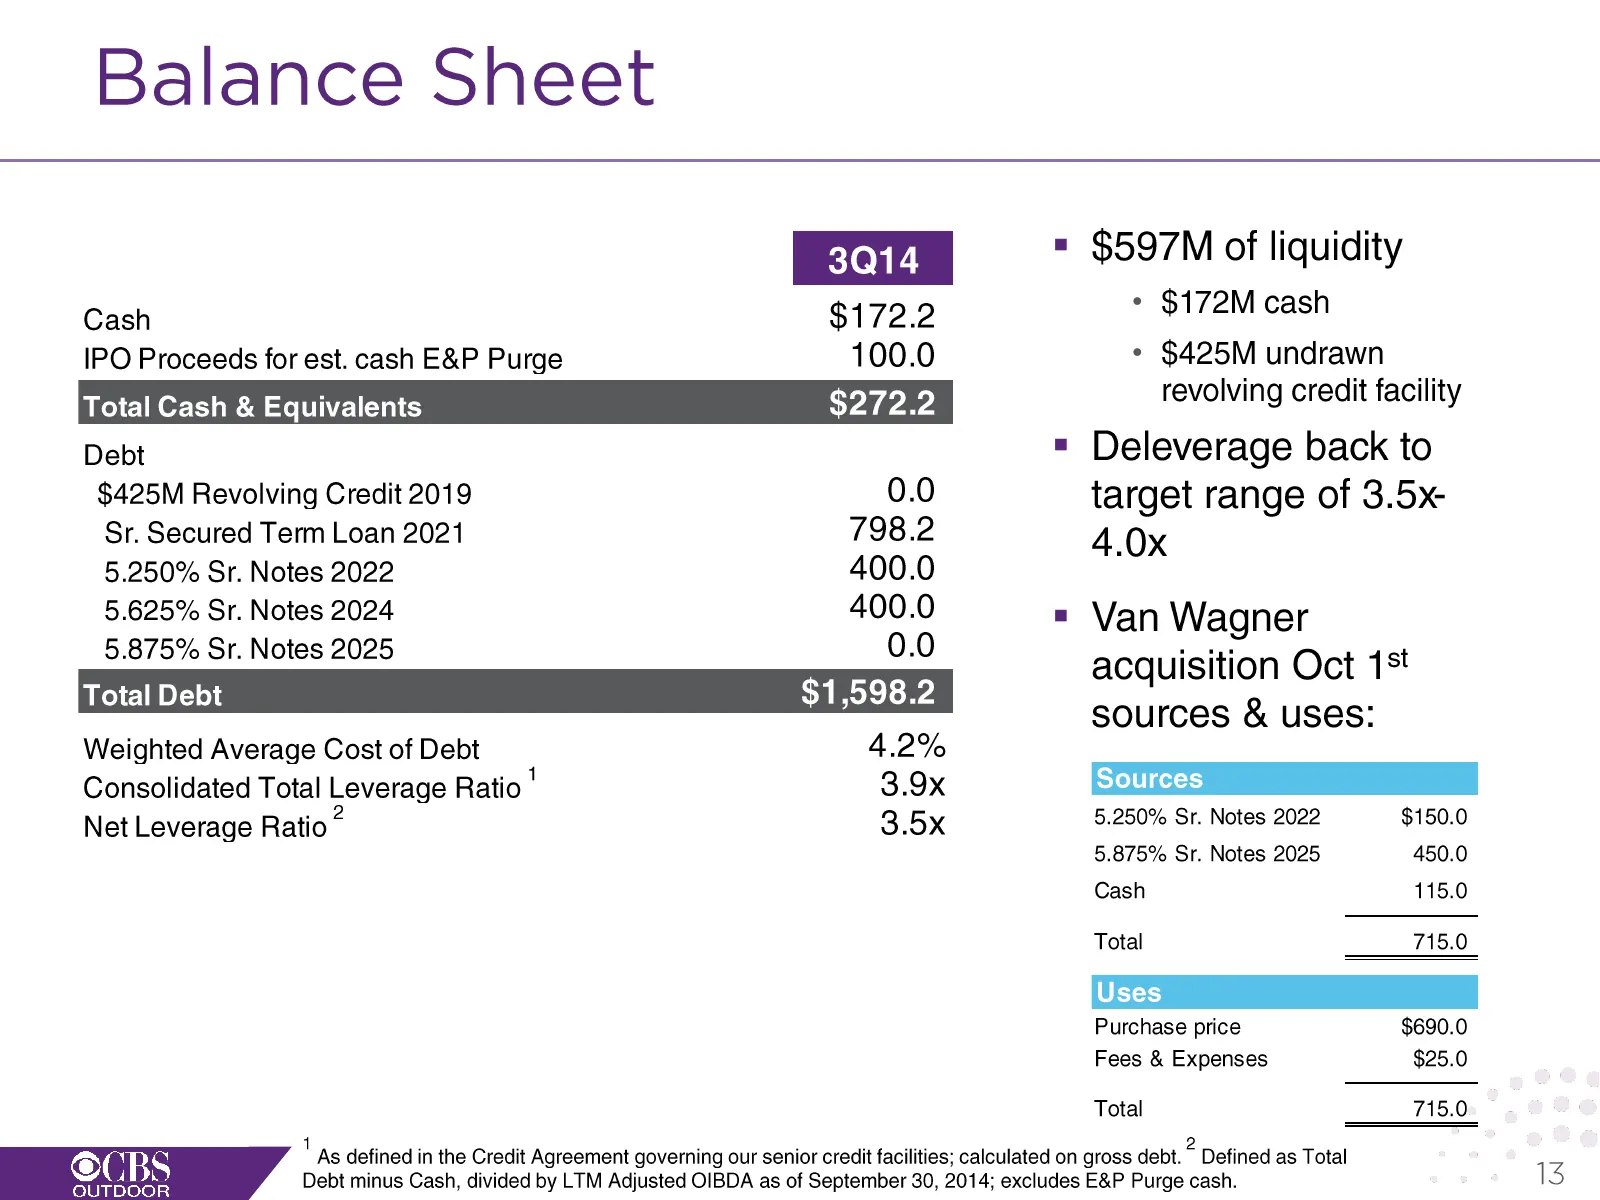
Balance Sheet Cash $172.2 IPO Proceeds for est. cash E&P Purge 100.0 Total Cash & Equivalents $272.2 Debt $425M Revolving Credit 2019 0.0 Sr. Secured Term Loan 2021 798.2 5.250% Sr. Notes 2022 400.0 5.625% Sr. Notes 2024 400.0 5.875% Sr. Notes 2025 0.0 Total Debt $1,598.2 Weighted Average Cost of De

Slide 14: Jeremy Male, CEO
Jeremy Male CEO 14
Slide 15: Outlook & Strategy
Outlook & Strategy Fourth Quarter outlook Taking new brand to market Sales leadership & training Elevating national strategy 15
Slide 16: Appendix
Appendix 16
Slide 17: Non-GAAP Reconciliations
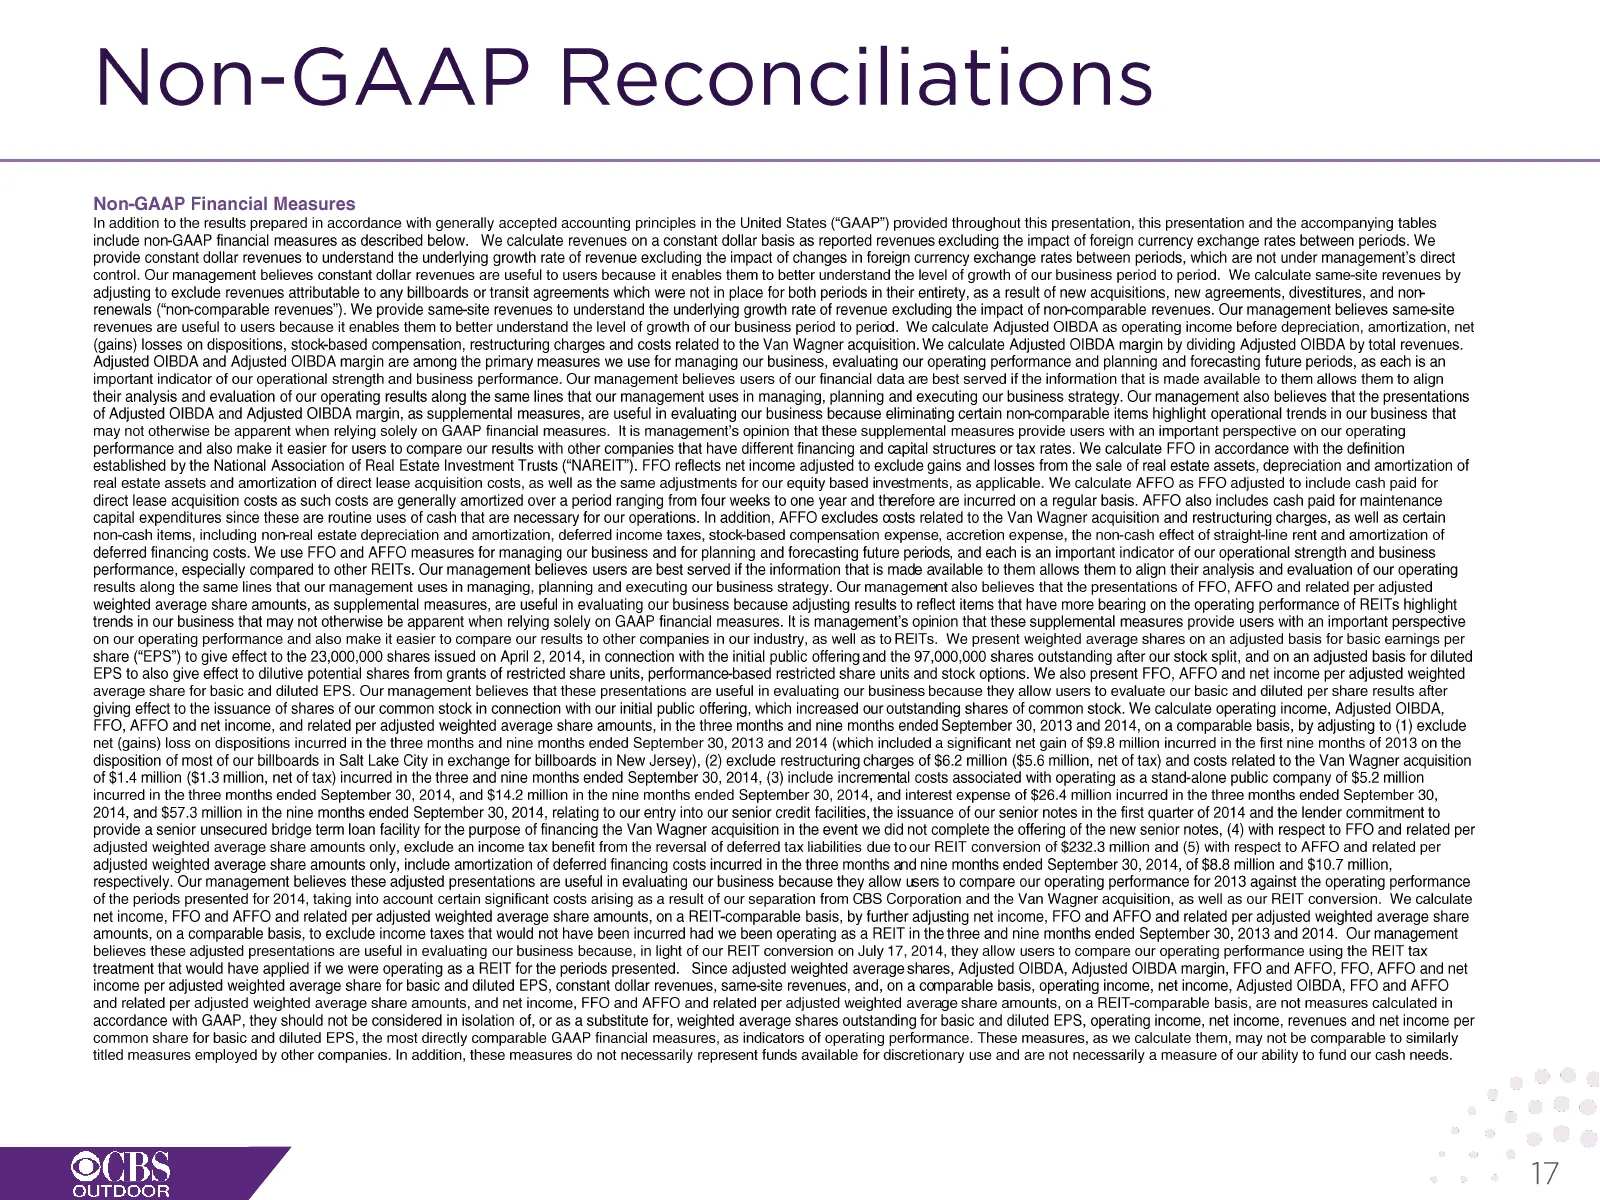
Non-GAAP Reconciliations Non-GAAP Financial Measures In addition to the results prepared in accordance with generally accepted accounting principles in the United States (“GAAP”) provided throughout this presentation, this presentation and the accompanying tables include non-GAAP financial measures
Slide 18: Revenues: Billboard, Transit and Other (2014)
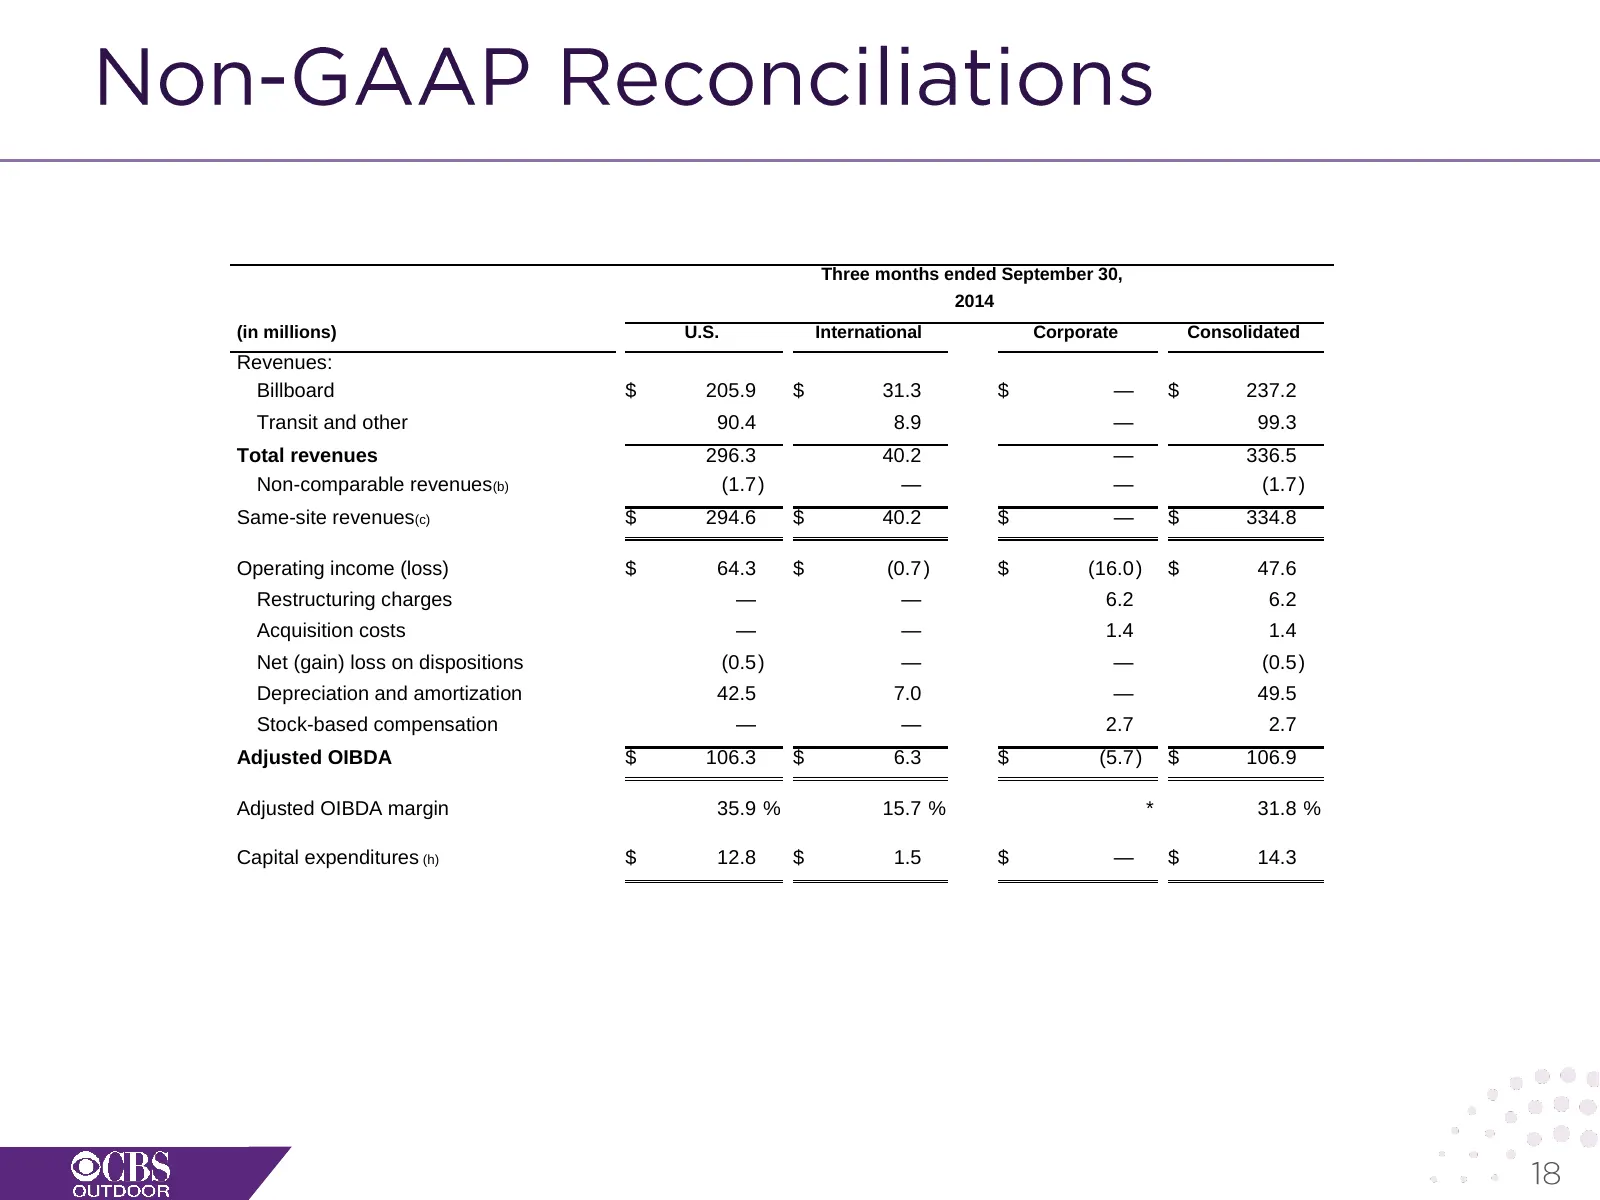
Three months ended September 30, 2014 (in millions) U.S. International Corporate Consolidated Revenues: Billboard $ 205.9 $ 31.3 $ — $ 237.2 Transit and other 90.4 8.9 — 99.3 Total revenues 296.3 40.2 — 336.5 Non-comparable revenues(b) (1.7 ) — — (1.7 ) Same-site revenues(c) $ 294.6 $ 40.2 $ — $ 334
Slide 19: Revenues: Billboard, Transit and Other (2013)
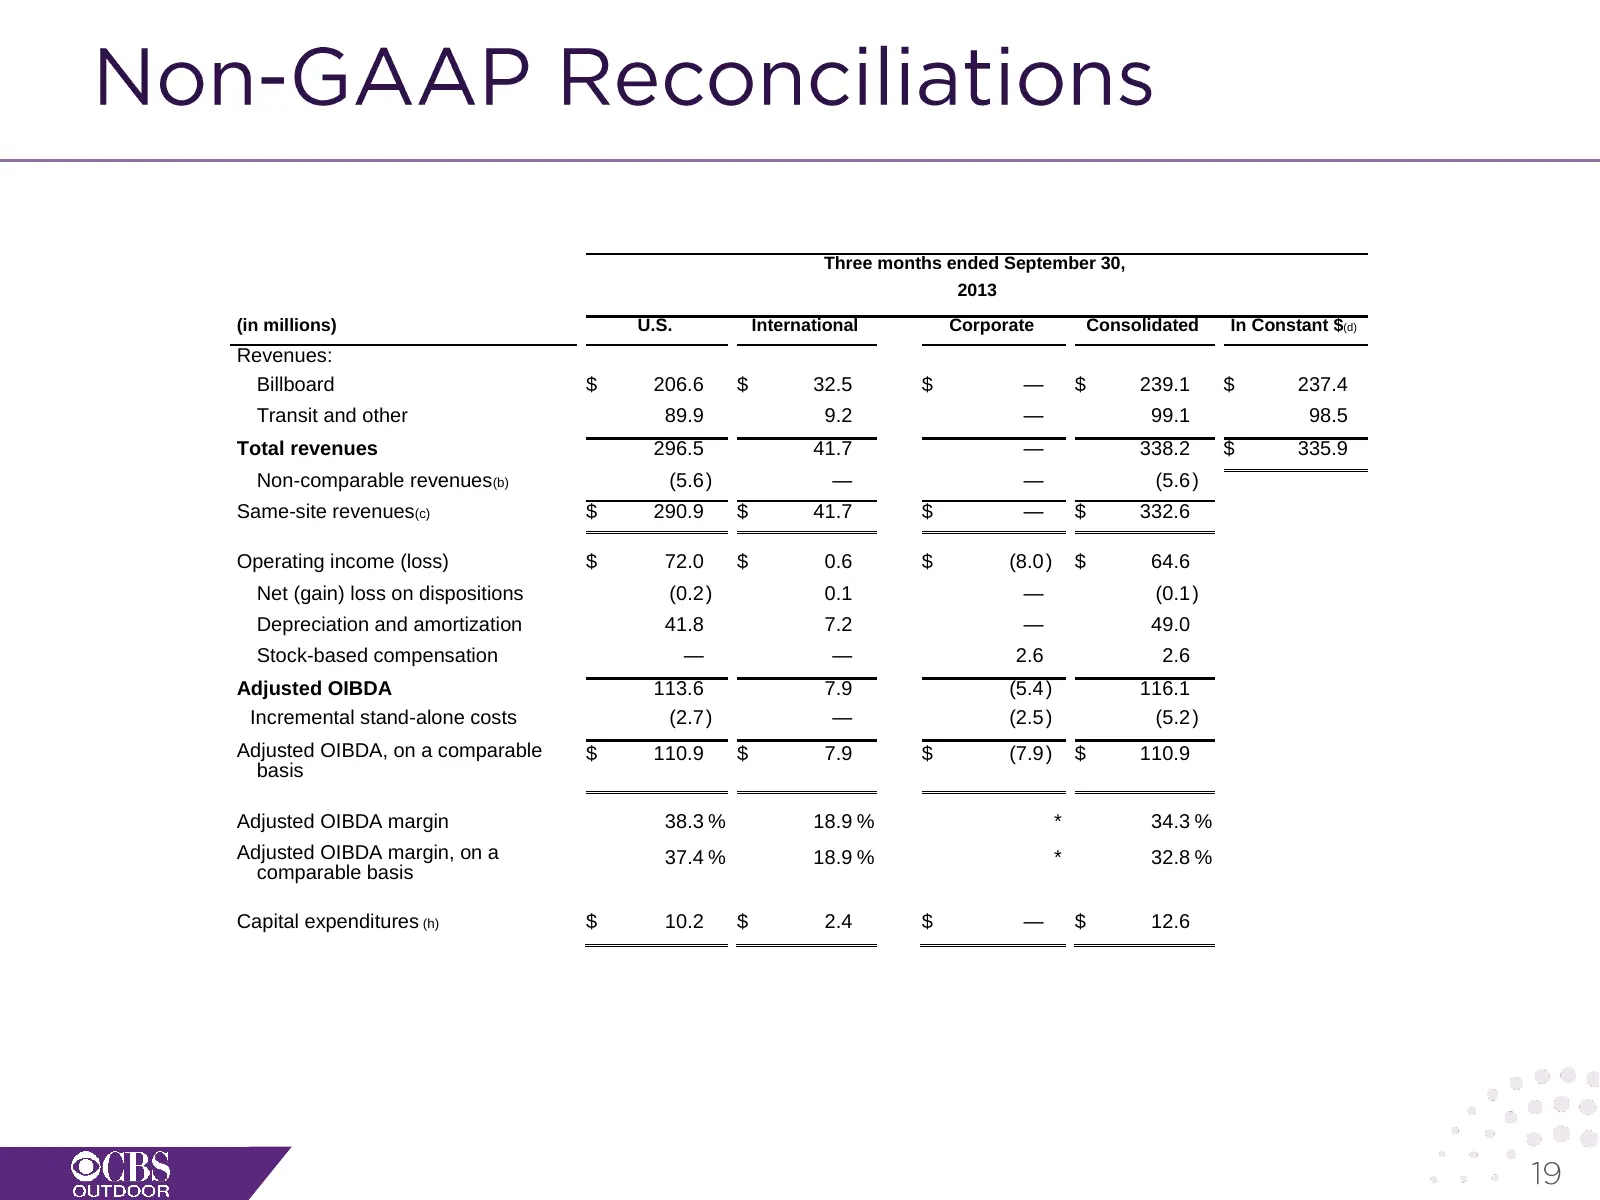
Three months ended September 30, 2013 (in millions) U.S. International Corporate Consolidated In Constant $(d) Revenues: Billboard $ 206.6 $ 32.5 $ — $ 239.1 $ 237.4 Transit and other 89.9 9.2 — 99.1 98.5 Total revenues 296.5 41.7 — 338.2 $ 335.9 Non-comparable revenues(b) (5.6 ) — — (5.6 ) Same-sit
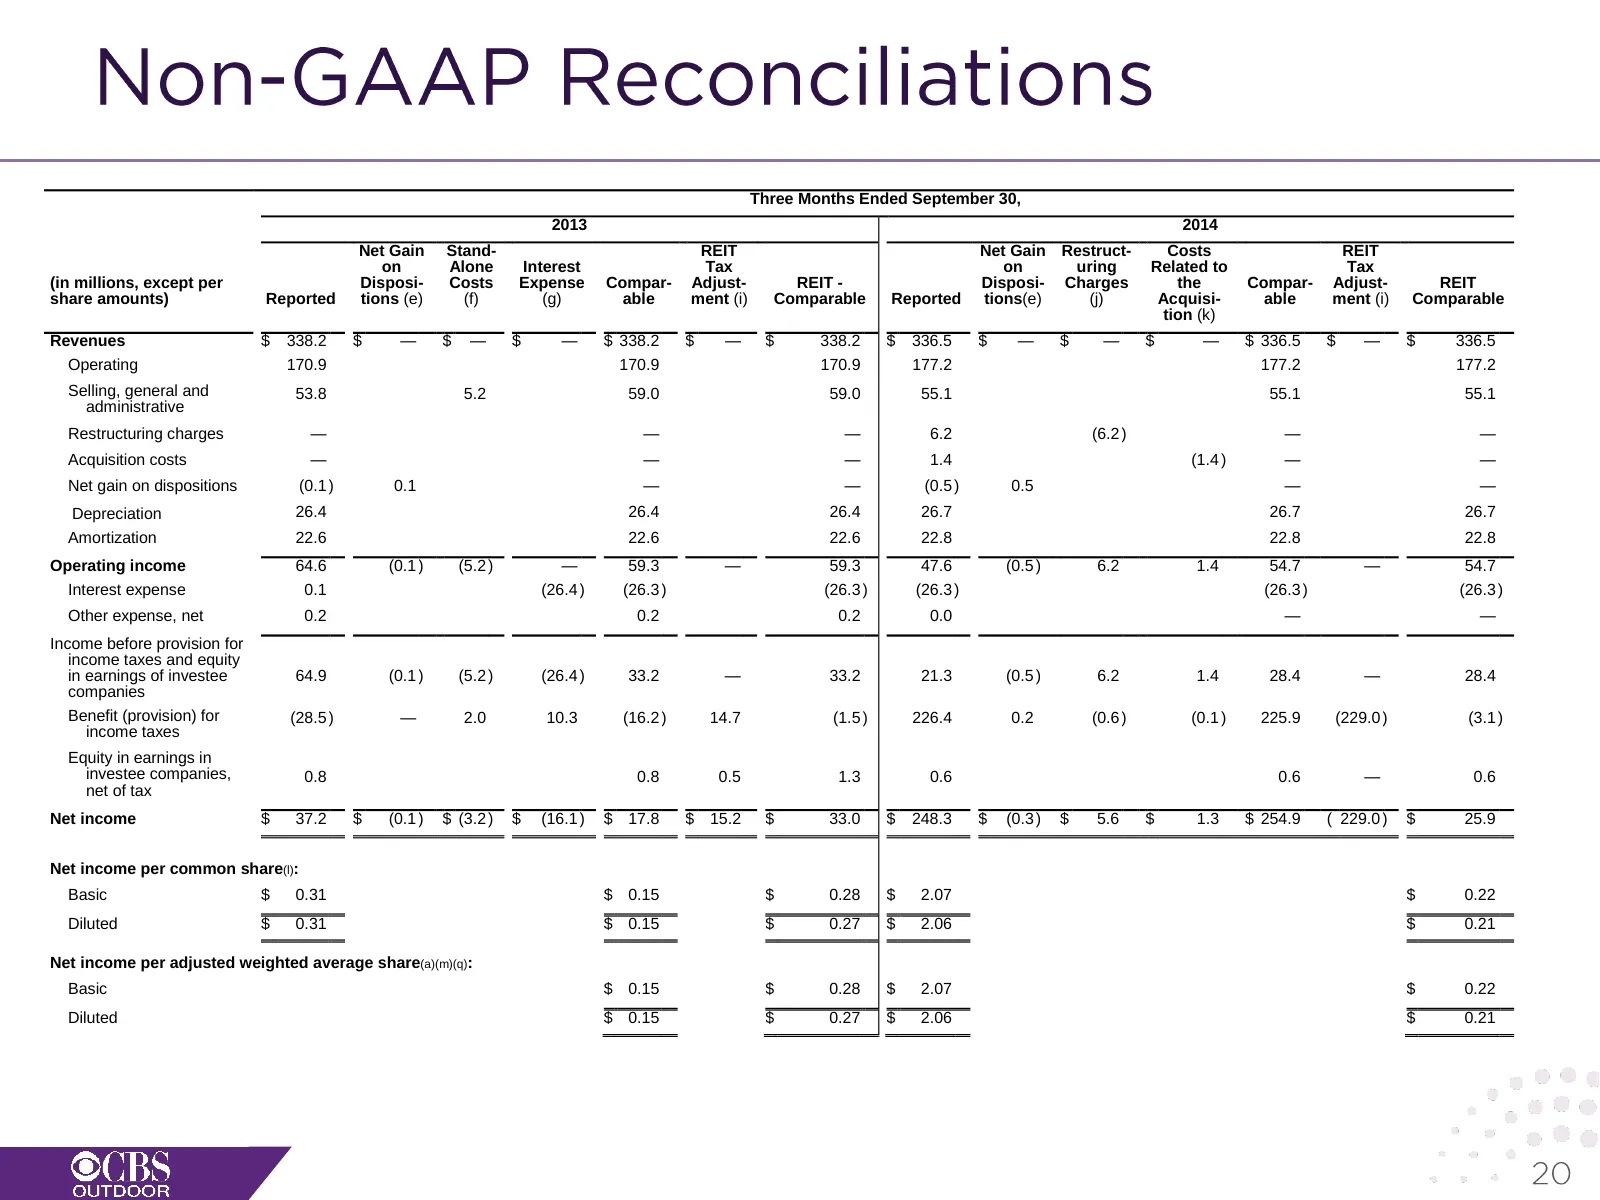
Slide 20: Three Months Ended September 30 Reconciliation
Three Months Ended September 30, 2013 2014 Net Gain Stand- REIT Net Gain Restruct- Costs REIT on Alone Interest Tax on uring Related to Tax (in millions, except per Disposi- Costs Expense Compar- Adjust- REIT - Disposi- Charges the Compar- Adjust- REIT share amounts) Reported tions (e) (f) (g) able
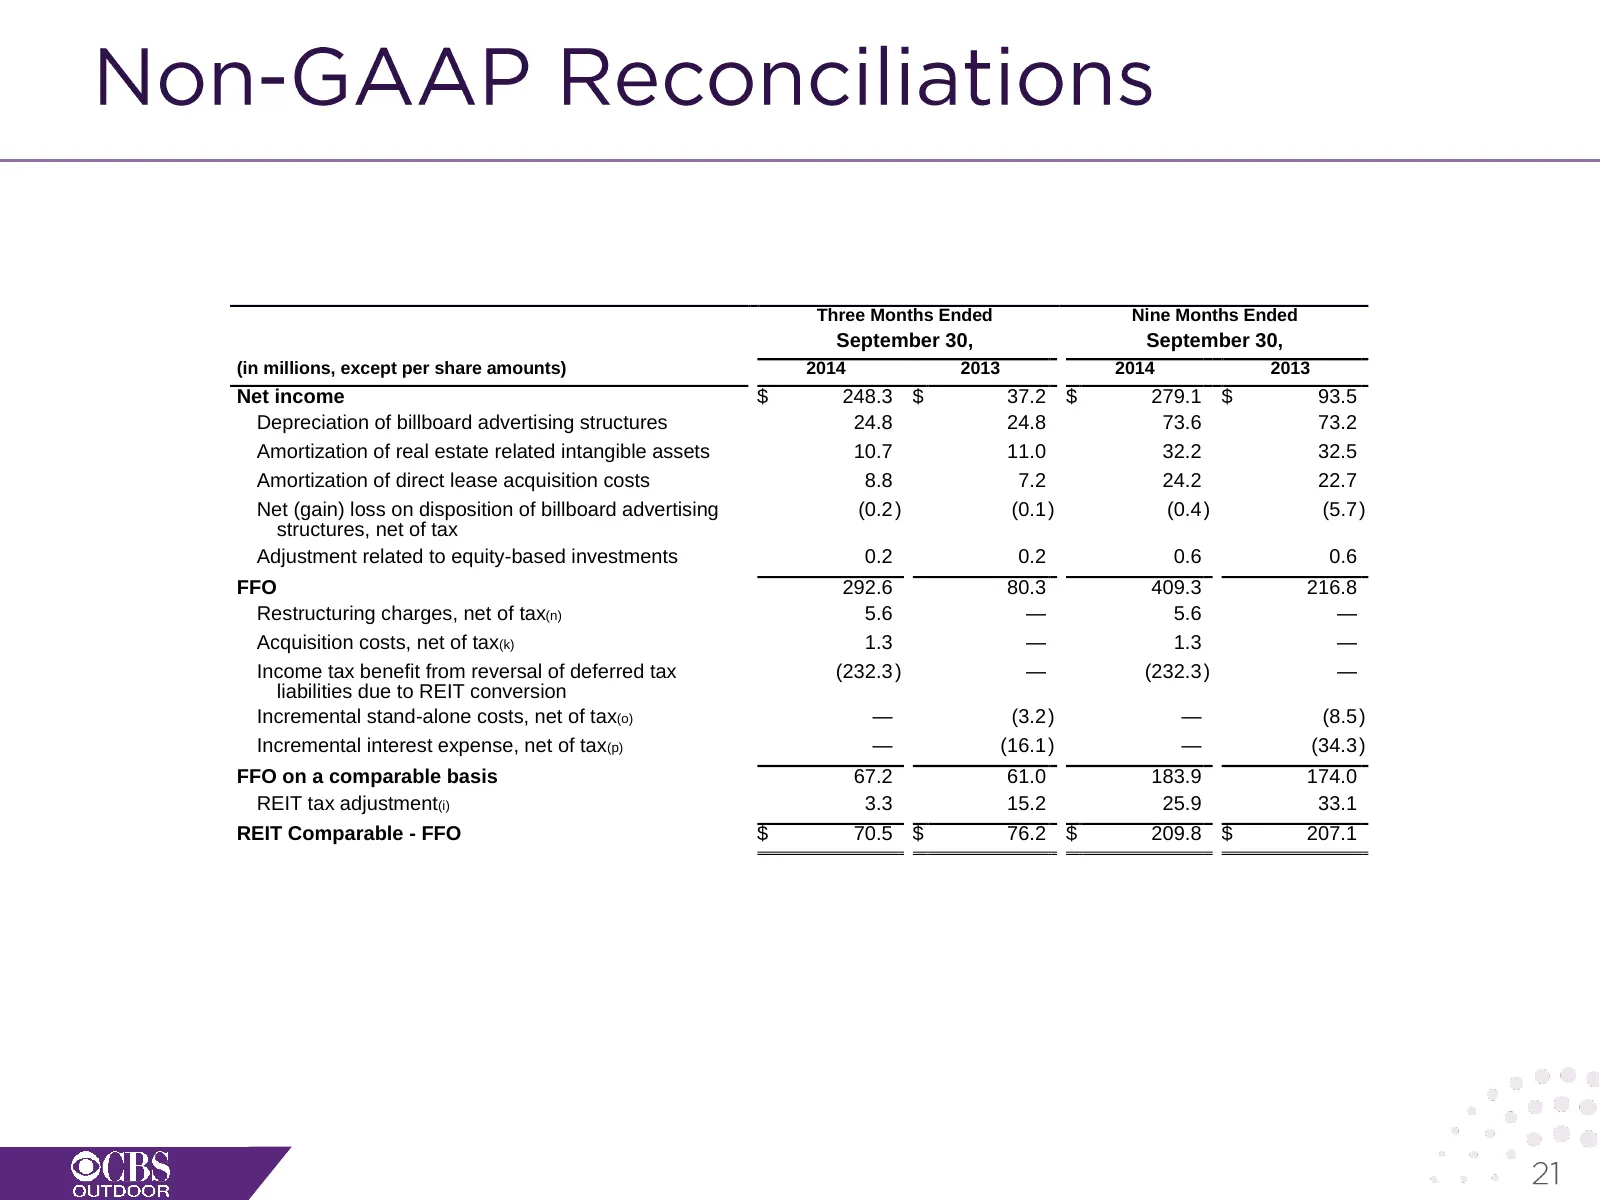
Slide 21: Net Income to FFO Reconciliation
Three Months Ended Nine Months Ended September 30, September 30, (in millions, except per share amounts) 2014 2013 2014 2013 Net income $ 248.3 $ 37.2 $ 279.1 $ 93.5 Depreciation of billboard advertising structures 24.8 24.8 73.6 73.2 Amortization of real estate related intangible assets 10.7 11.0 3
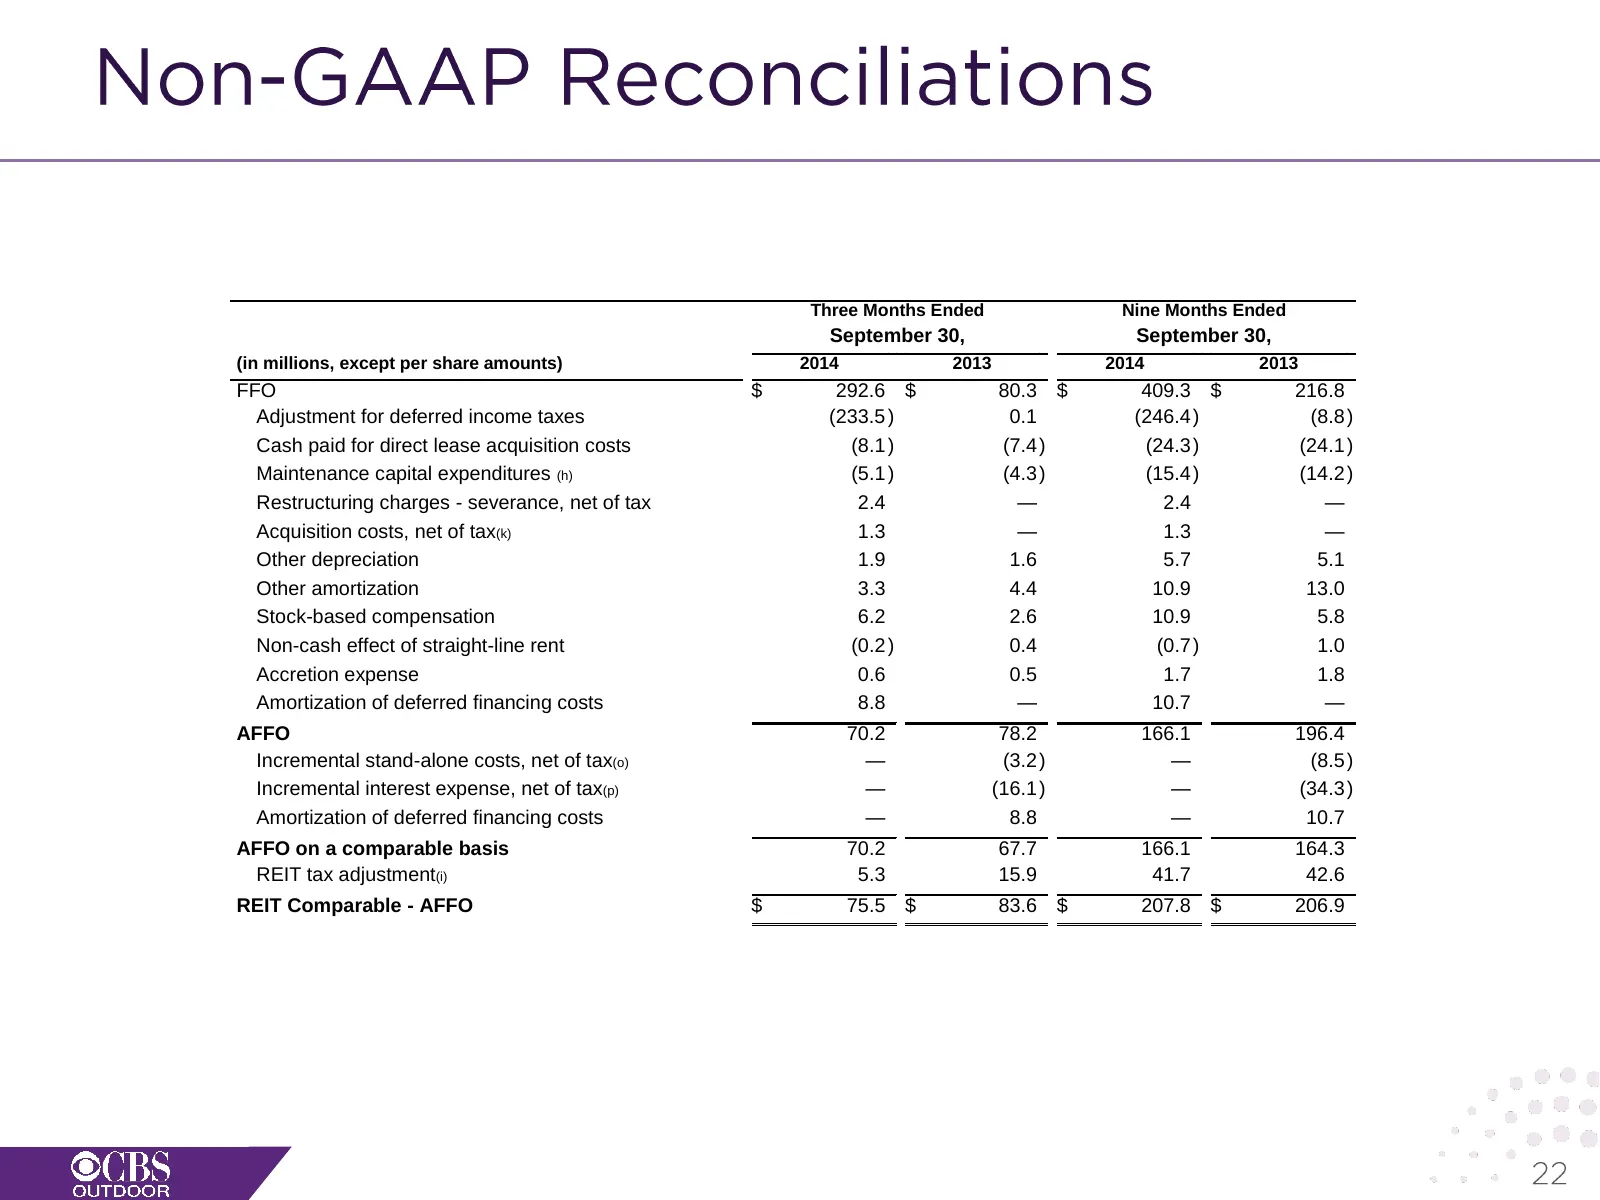
Slide 22: FFO to AFFO Reconciliation
Three Months Ended Nine Months Ended September 30, September 30, (in millions, except per share amounts) 2014 2013 2014 2013 FFO $ 292.6 $ 80.3 $ 409.3 $ 216.8 Adjustment for deferred income taxes (233.5 ) 0.1 (246.4 ) (8.8 ) Cash paid for direct lease acquisition costs (8.1 ) (7.4 ) (24.3 ) (24.1 )
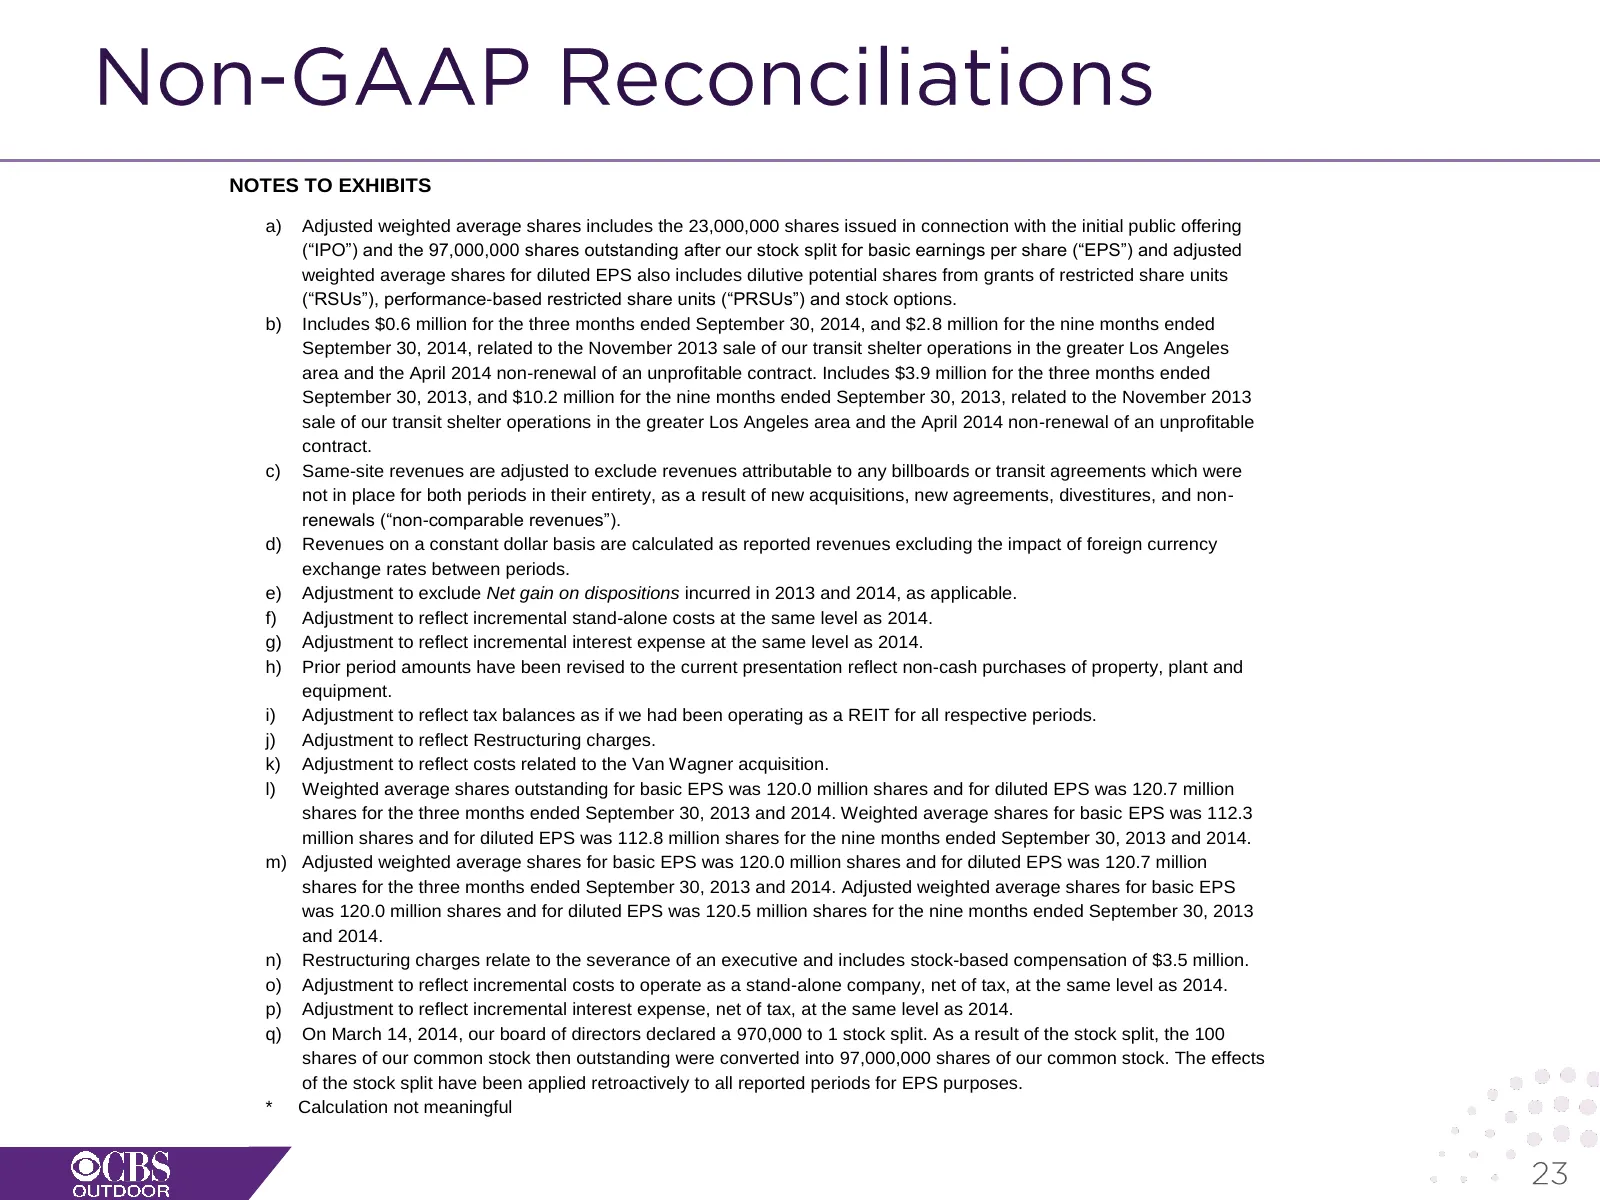
Slide 23: Notes to Exhibits
NOTES TO EXHIBITS a) Adjusted weighted average shares includes the 23,000,000 shares issued in connection with the initial public offering (“IPO”) and the 97,000,000 shares outstanding after our stock split for basic earnings per share (“EPS”) and adjusted weighted average shares for diluted EPS als
Slide 24: About CBS Outdoor Americas Inc.
@CBS OUTDOOR About CBS Outdoor Americas Inc. CBS Outdoor is one of the largest out-of-home media companies in the Americas and has a major presence in top markets throughout the United States, Canada, Mexico and South America. With traditional billboard and transit outdoor advertising properties, an
Source: Internet Archive copy of investor.outfrontmedia.com
More decks from OUTFRONT Media Inc.
 Q3 2026 Earnings Presentation23 slides · Nov 5, 2026
 Q2 2026 Earnings Presentation23 slides · Aug 5, 2026
 Q1 2026 Earnings Presentation23 slides · May 7, 2026
 Q4 2025 Earnings Presentation24 slides · Feb 25, 2026
 Q3 2025 Earnings Presentation24 slides · Nov 6, 2025
 Q2 2025 Earnings Presentation26 slides · Aug 5, 2025