Everi — Global Cash Access Holdings — Merger or Acquisition (October 2014)
35 slides from Everi's merger presentation, Oct 29, 2014
Slide 1: Investor Presentation October 29, 2014
Investor Presentation October 29, 2014 PRIVILEGED AND CONFIDENTIAL Exhibit 99.1
Slide 2: Disclaimer
Disclaimer 2 Forward-Looking Statements; Non-GAAP Financial Measures Throughout this presentation regarding the merger transaction between Global Cash Access Holdings, Inc. (“GCA”) and Multimedia Games Holding Company, Inc. (“Multimedia Games”), we make forward-looking statements within the meaning
Slide 3: Today's Presenters and Agenda
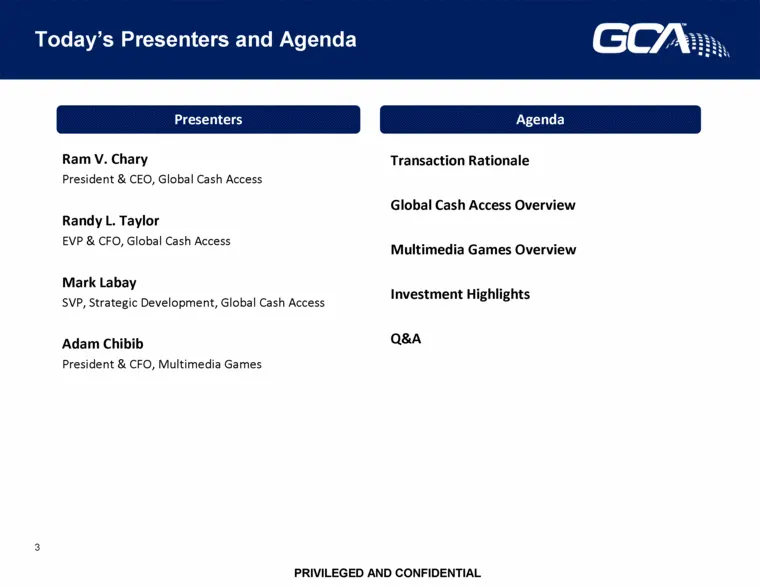
Today’s Presenters and Agenda 3 Transaction Rationale Global Cash Access Overview Multimedia Games Overview Investment Highlights Q&A Ram V. Chary President & CEO, Global Cash Access Randy L. Taylor EVP & CFO, Global Cash Access Mark Labay SVP, Strategic Development, Global Cash Access Adam Chibib P
Slide 4: Transaction Summary
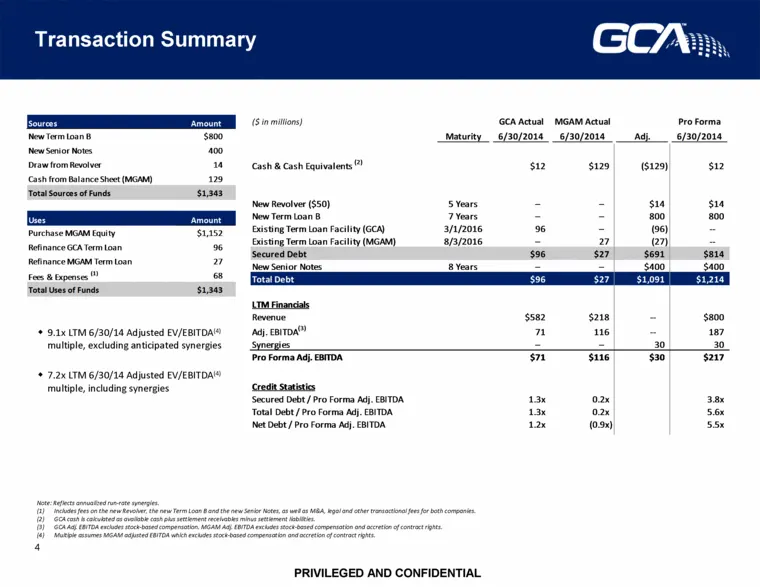
Transaction Summary 4 Note: Reflects annualized run-rate synergies. Includes fees on the new Revolver, the new Term Loan B and the new Senior Notes, as well as M&A, legal and other transactional fees for both companies. GCA cash is calculated as available cash plus settlement receivables minus settl
Slide 5: Transaction Rationale
Transaction Rationale
Slide 6: Compelling Strategic and Financial Rationale
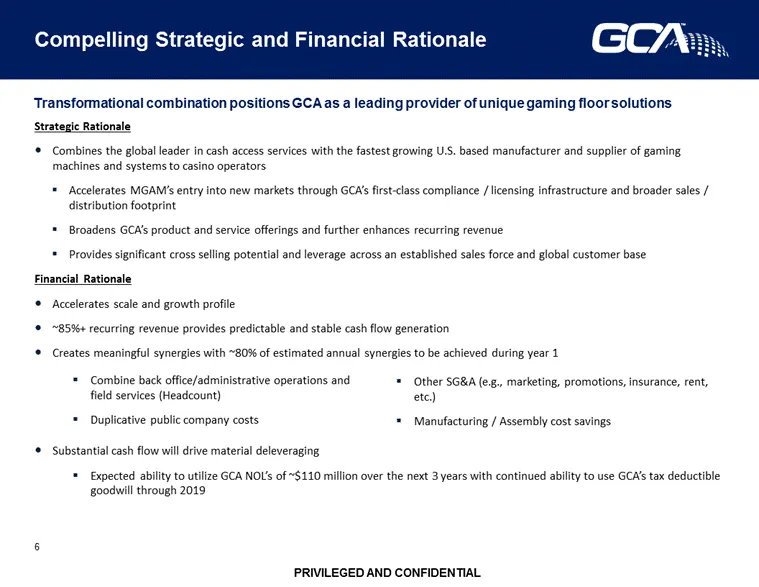
Compelling Strategic and Financial Rationale 6 Strategic Rationale Combines the global leader in cash access services with the fastest growing U.S. based manufacturer and supplier of gaming machines and systems to casino operators Accelerates MGAM’s entry into new markets through GCA’s first-class c
Slide 7: Combined Company Products and Services Overview
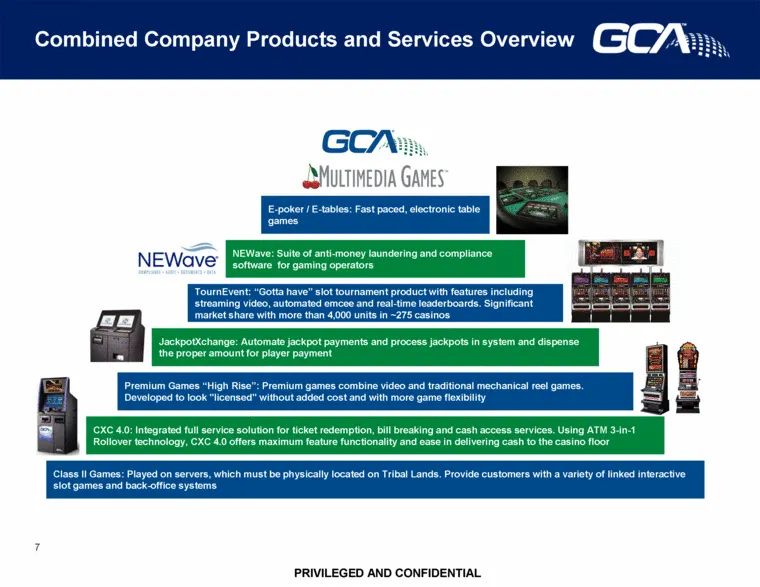
Combined Company Products and Services Overview 7 Class II Games: Played on servers, which must be physically located on Tribal Lands. Provide customers with a variety of linked interactive slot games and back-office systems CXC 4.0: Integrated full service solution for ticket redemption, bill break
Slide 8: Highly Differentiated Products on the Casino Floor
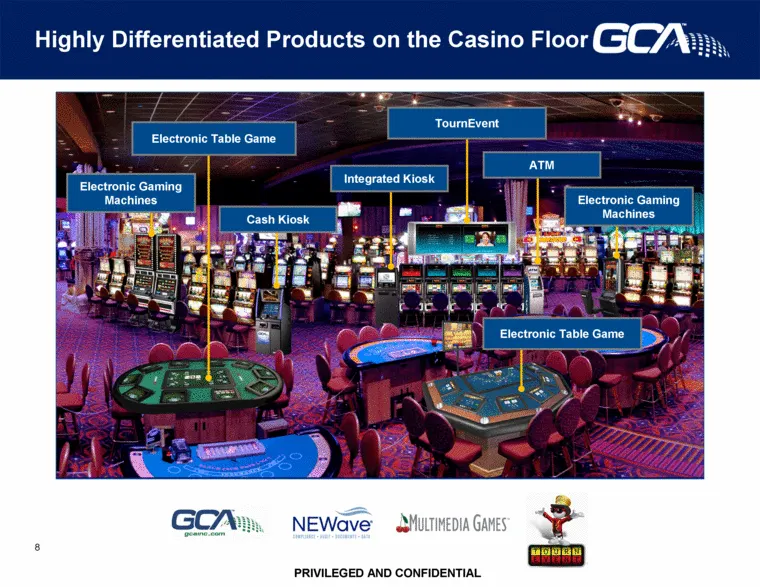
Highly Differentiated Products on the Casino Floor 8 Electronic Table Game Electronic Table Game TournEvent Cash Kiosk Integrated Kiosk ATM Electronic Gaming Machines Electronic Gaming Machines
Slide 9: Increased Diversification and Scale
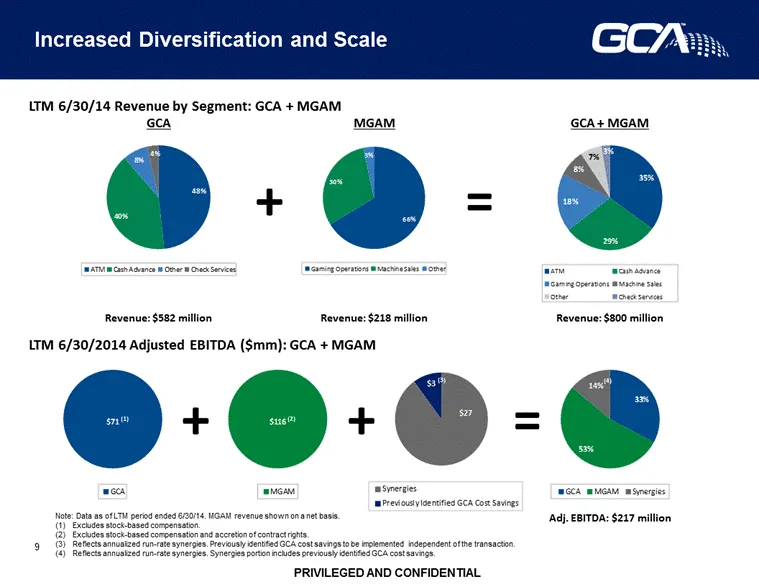
Increased Diversification and Scale GCA + MGAM Revenue: $800 million GCA MGAM Revenue: $582 million Revenue: $218 million + = LTM 6/30/14 Revenue by Segment: GCA + MGAM 9 LTM 6/30/2014 Adjusted EBITDA ($mm): GCA + MGAM + + = Adj. EBITDA: $217 million (1) (2) Note: Data as of LTM period ended 6/30/14
Slide 10: Global Cash Access Overview
Global Cash Access Overview
Slide 11: Global Cash Access Overview
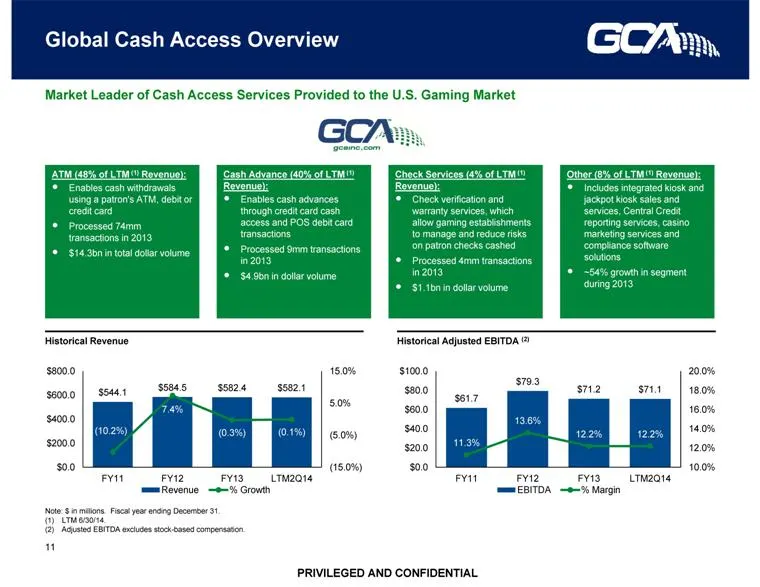
Global Cash Access Overview 11 Note: $ in millions. Fiscal year ending December 31. LTM 6/30/14. Adjusted EBITDA excludes stock-based compensation. Market Leader of Cash Access Services Provided to the U.S. Gaming Market Historical Revenue Historical Adjusted EBITDA (2) ATM (48% of LTM (1) Revenue):
Slide 12: ATM Segment Overview
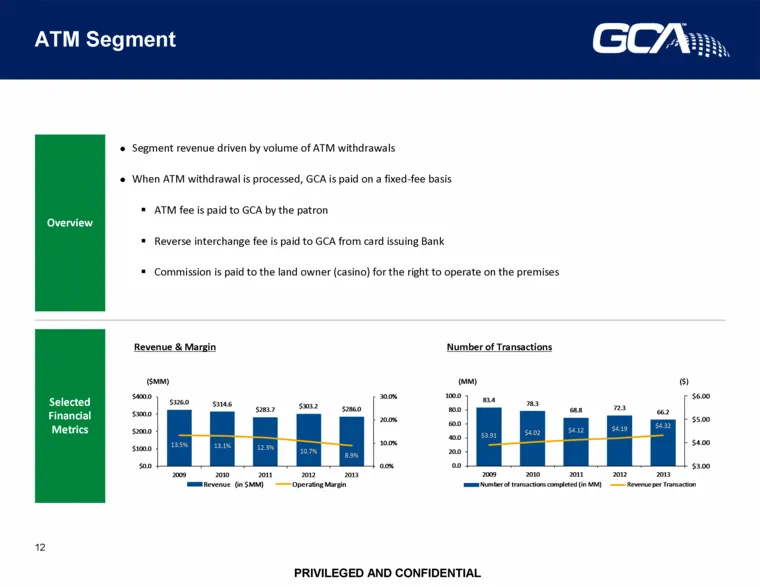
ATM Segment 12 Overview Segment revenue driven by volume of ATM withdrawals When ATM withdrawal is processed, GCA is paid on a fixed-fee basis ATM fee is paid to GCA by the patron Reverse interchange fee is paid to GCA from card issuing Bank Commission is paid to the land owner (casino) for the righ
Slide 13: Cash Advance Segment
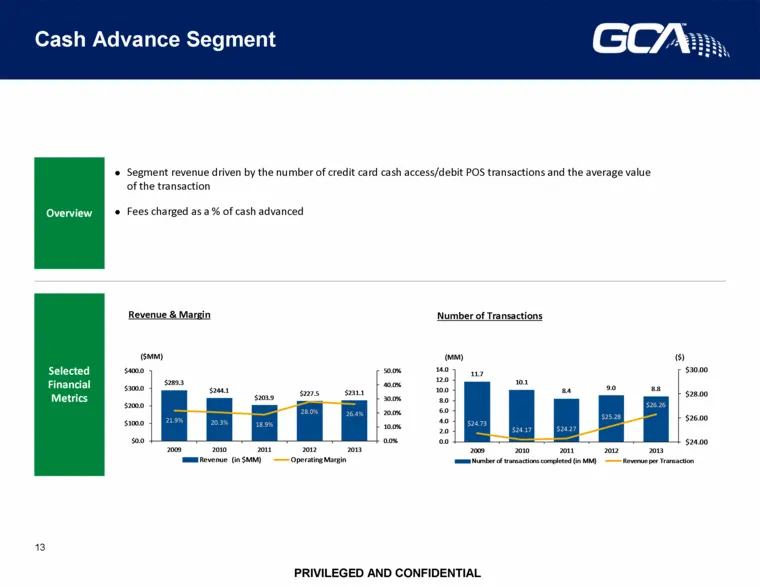
Cash Advance Segment 13 ($MM) (MM) ($) Segment revenue driven by the number of credit card cash access/debit POS transactions and the average value of the transaction Fees charged as a % of cash advanced Overview Selected Financial Metrics Revenue & Margin Number of Transactions $289.3 $244.1 $203.9
Slide 14: Check Services and Other Segments Overview
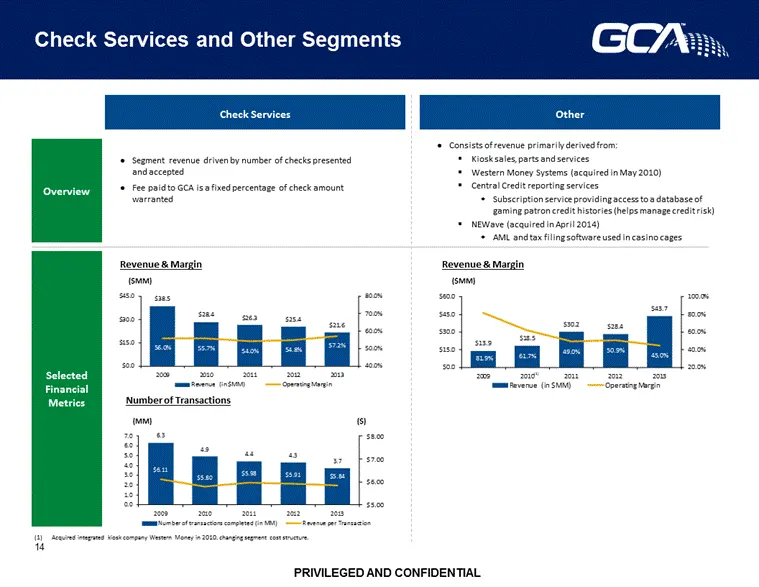
Check Services and Other Segments 14 Overview Check Services Segment revenue driven by number of checks presented and accepted Fee paid to GCA is a fixed percentage of check amount warranted Consists of revenue primarily derived from: Kiosk sales, parts and services Western Money Systems (acquired i
Slide 15: Selected Key Historical Operating Metrics
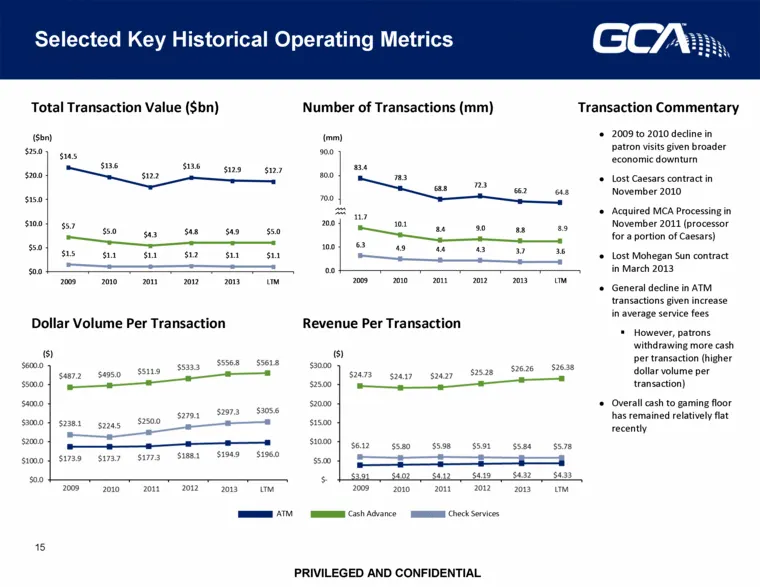
Selected Key Historical Operating Metrics 15 Number of Transactions (mm) Total Transaction Value ($bn) Dollar Volume Per Transaction Revenue Per Transaction ($) (mm) ($bn) 70.0 80.0 90.0 Cash Advance ATM ($) Transaction Commentary 2009 to 2010 decline in patron visits given broader economic downturn
Slide 16: New Solution-Based Sales Strategy
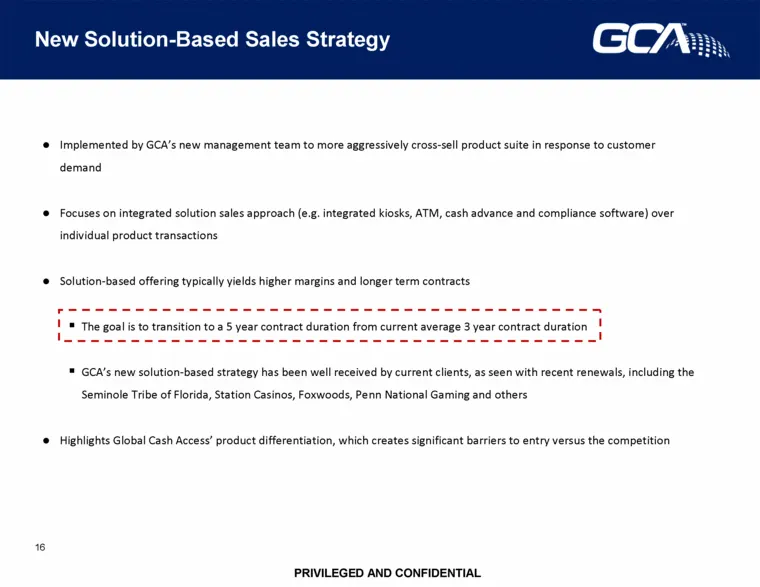
New Solution-Based Sales Strategy 16 Implemented by GCA’s new management team to more aggressively cross-sell product suite in response to customer demand Focuses on integrated solution sales approach (e.g. integrated kiosks, ATM, cash advance and compliance software) over individual product transac
Slide 17: Product and Solutions Overview
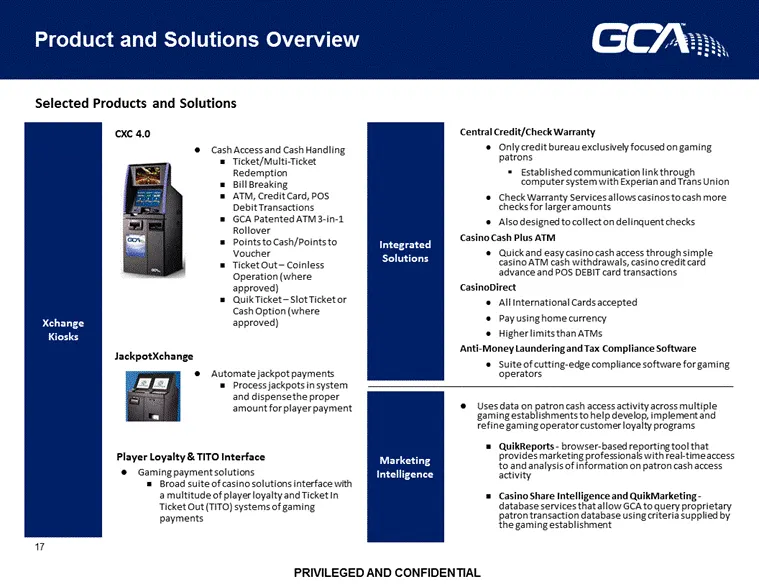
Product and Solutions Overview 17 Xchange Kiosks CXC 4.0 Cash Access and Cash Handling Ticket/Multi-Ticket Redemption Bill Breaking ATM, Credit Card, POS Debit Transactions GCA Patented ATM 3-in-1 Rollover Points to Cash/Points to Voucher Ticket Out – Coinless Operation (where approved) Quik Ticket
Slide 18: Competitive Landscape
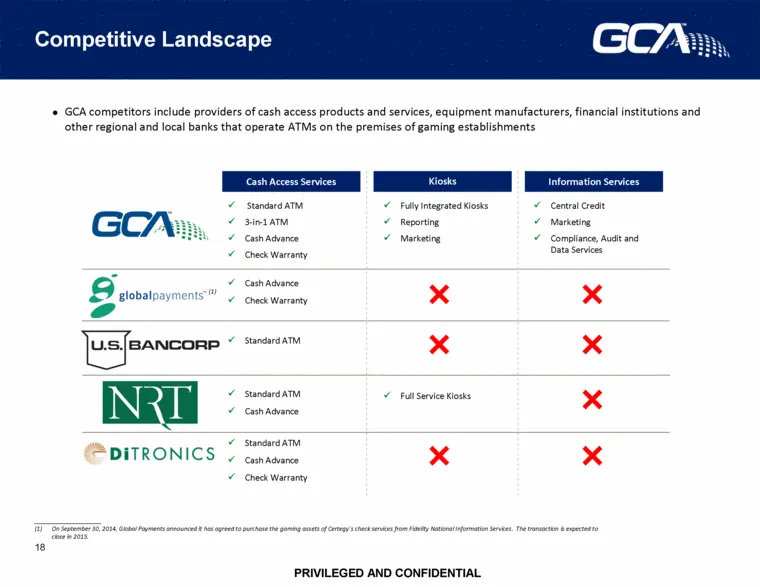
Competitive Landscape 18 GCA competitors include providers of cash access products and services, equipment manufacturers, financial institutions and other regional and local banks that operate ATMs on the premises of gaming establishments Cash Access Services Kiosks Information Services Standard ATM
Slide 19: Multimedia Games Overview
Multimedia Games Overview
Slide 20: Multimedia Games Overview
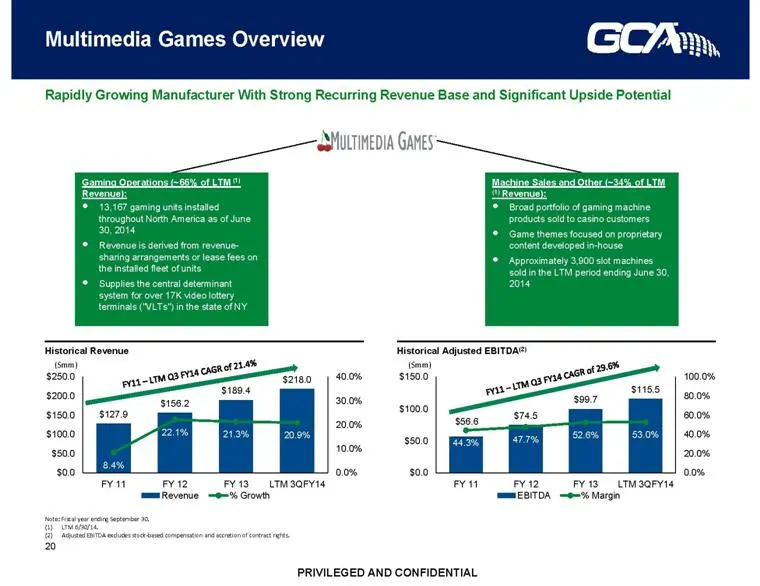
Multimedia Games Overview 20 Note: Fiscal year ending September 30. LTM 6/30/14. Adjusted EBITDA excludes stock-based compensation and accretion of contract rights. Rapidly Growing Manufacturer With Strong Recurring Revenue Base and Significant Upside Potential Historical Revenue Historical Adjusted
Slide 21: Gaming Operations Segment
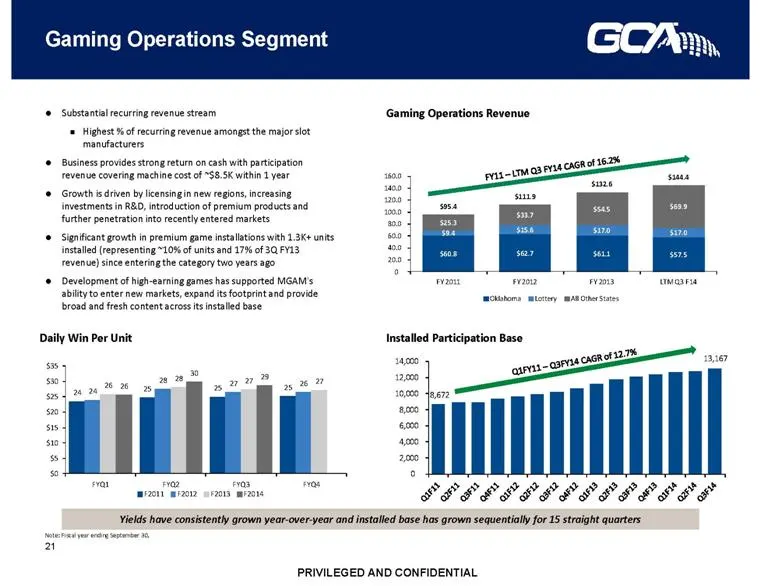
Gaming Operations Segment 21 Substantial recurring revenue stream Highest % of recurring revenue amongst the major slot manufacturers Business provides strong return on cash with participation revenue covering machine cost of ~$8.5K within 1 year Growth is driven by licensing in new regions, increas
Slide 22: Machine Sales and Other Segments
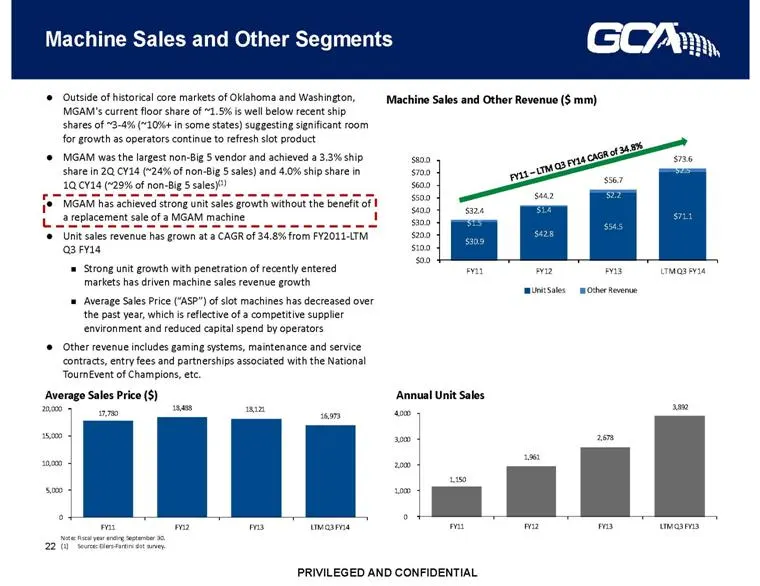
Machine Sales and Other Segments 22 Outside of historical core markets of Oklahoma and Washington, MGAM's current floor share of ~1.5% is well below recent ship shares of ~3-4% (~10%+ in some states) suggesting significant room for growth as operators continue to refresh slot product MGAM was the la
Slide 23: Product Evolution
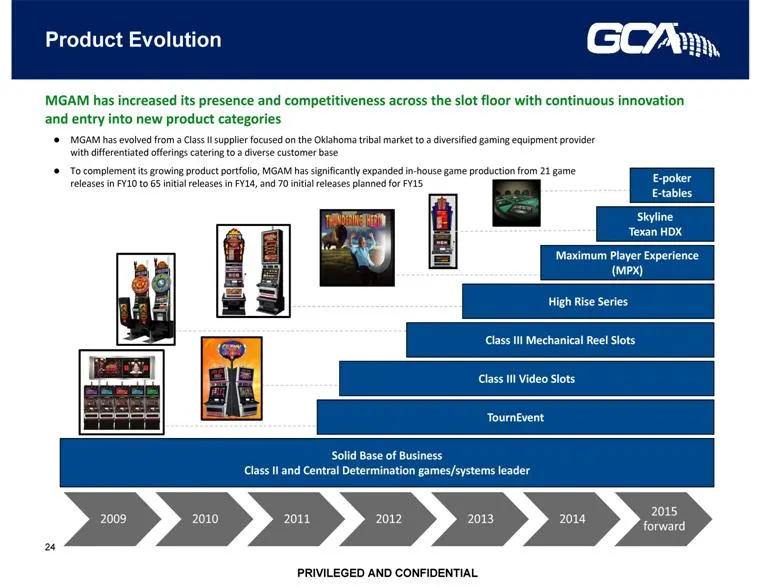
Product Evolution 24 Solid Base of Business Class II and Central Determination games/systems leader MGAM has increased its presence and competitiveness across the slot floor with continuous innovation and entry into new product categories E-poker E-tables MGAM has evolved from a Class II supplier fo
Slide 24: TournEvent Key Features
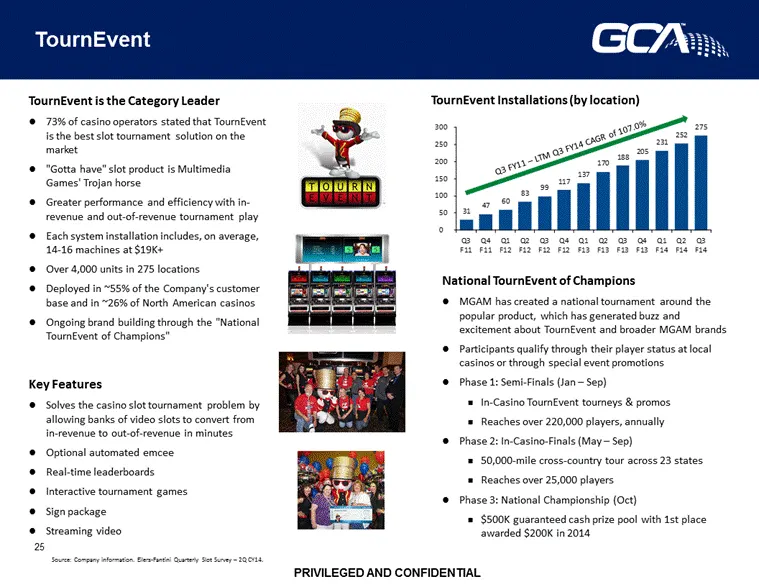
TournEvent 25 Key Features Solves the casino slot tournament problem by allowing banks of video slots to convert from in-revenue to out-of-revenue in minutes Optional automated emcee Real-time leaderboards Interactive tournament games Sign package Streaming video National TournEvent of Champions MGA
Slide 25: Gaming Operations Footprint Evolution
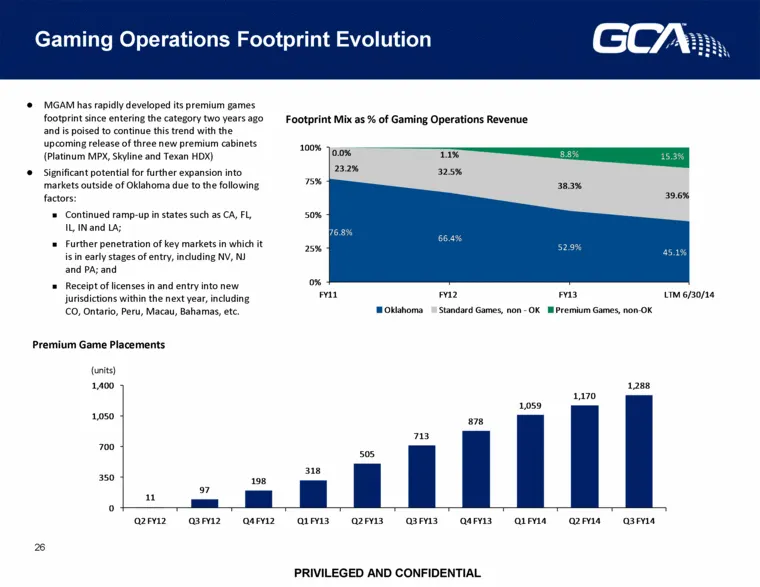
Gaming Operations Footprint Evolution 26 Footprint Mix as % of Gaming Operations Revenue MGAM has rapidly developed its premium games footprint since entering the category two years ago and is poised to continue this trend with the upcoming release of three new premium cabinets (Platinum MPX, Skylin
Slide 26: Market Shares by Market Stage and State
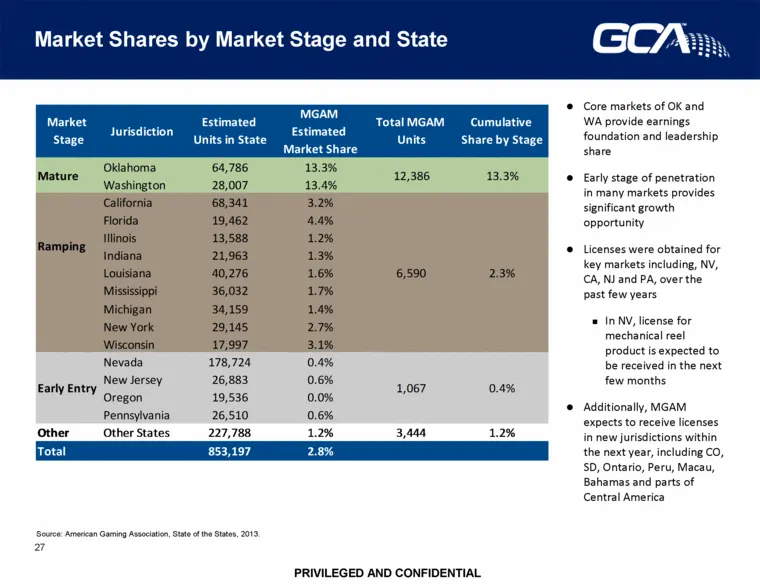
Market Shares by Market Stage and State 27 Core markets of OK and WA provide earnings foundation and leadership share Early stage of penetration in many markets provides significant growth opportunity Licenses were obtained for key markets including, NV, CA, NJ and PA, over the past few years In NV,
Slide 27: Investment Highlights
Investment Highlights
Slide 28: Investment Highlights
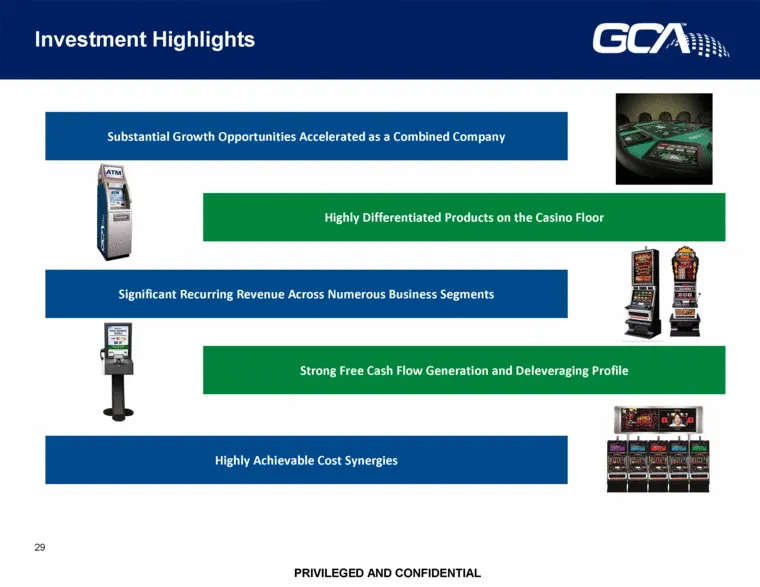
Investment Highlights 29 Significant cross selling opportunity and potential to leverage an established sales force and global customer base Accelerates penetration into key markets and strengthens relationships with gaming operators Highly Differentiated Products on the Casino Floor Significant Rec
Slide 29: Substantial Growth Opportunities Accelerated as a Combined Company
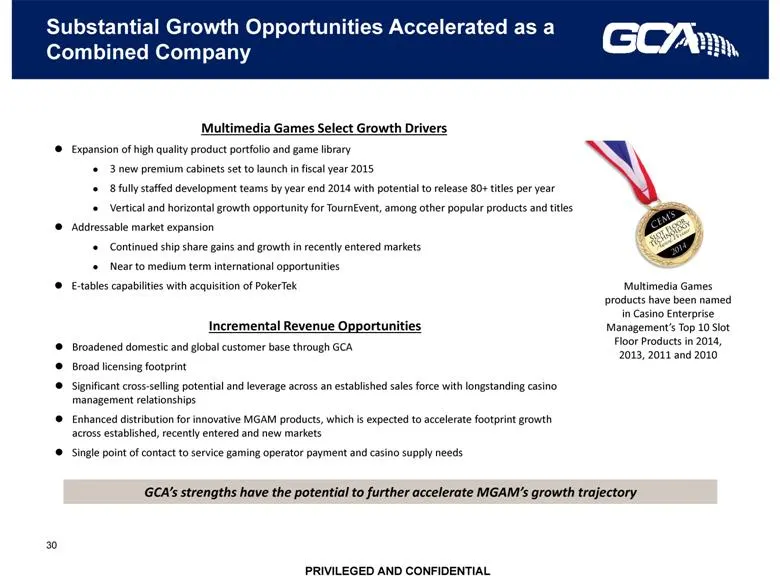
Substantial Growth Opportunities Accelerated as a Combined Company 30 Global Cash Access [ ] Multimedia Games Select Growth Drivers Expansion of high quality product portfolio and game library 3 new premium cabinets set to launch in fiscal year 2015 8 fully staffed development teams by year end 2014
Slide 30: Highly Differentiated Products on the Casino Floor
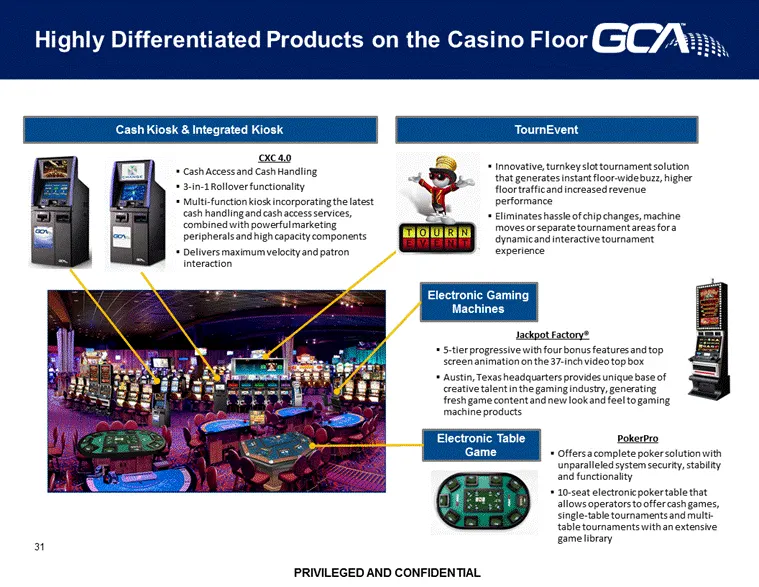
Innovative, turnkey slot tournament solution that generates instant floor-wide buzz, higher floor traffic and increased revenue performance Eliminates hassle of chip changes, machine moves or separate tournament areas for a dynamic and interactive tournament experience Highly Differentiated Products
Slide 31: Significant Recurring Revenue Across Numerous Business Segments
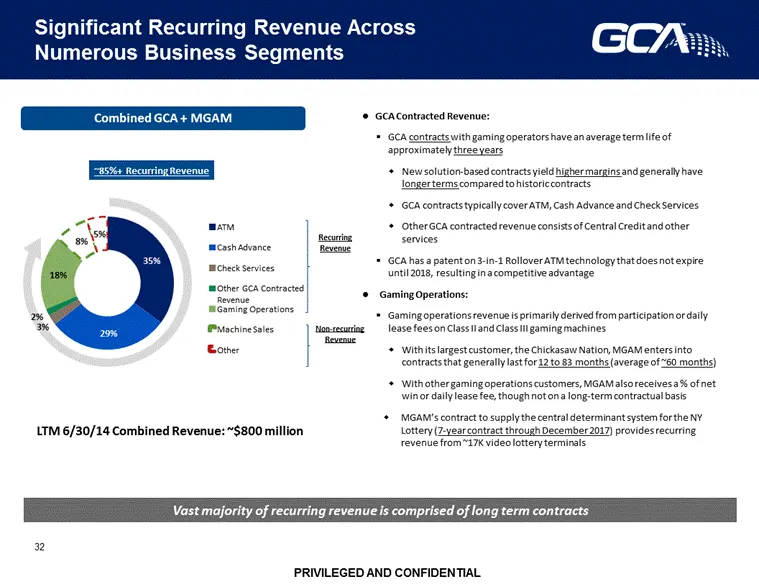
Significant Recurring Revenue Across Numerous Business Segments 32 Combined GCA + MGAM ~85%+ Recurring Revenue Recurring Revenue Non-recurring Revenue LTM 6/30/14 Combined Revenue: ~$800 million GCA Contracted Revenue: GCA contracts with gaming operators have an average term life of approximately th
Slide 32: Strong Free Cash Flow Generation and Deleveraging Profile
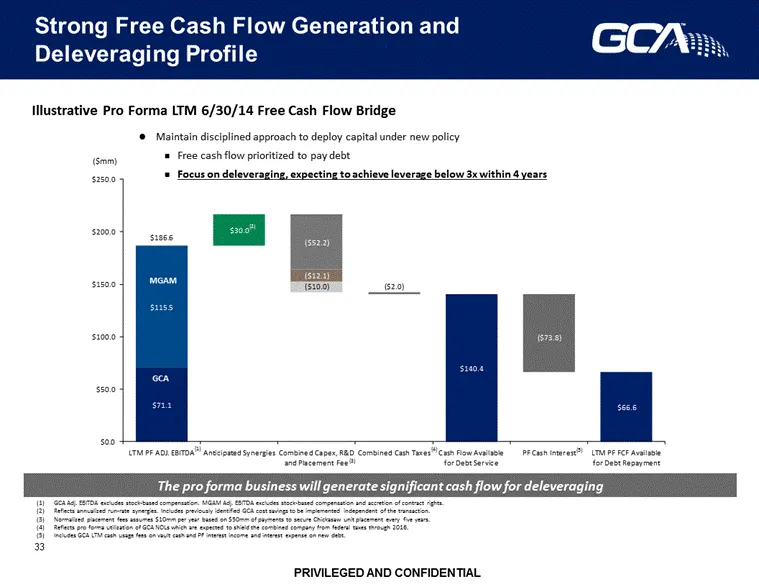
Strong Free Cash Flow Generation and Deleveraging Profile 33 The pro forma business will generate significant cash flow for deleveraging GCA Adj. EBITDA excludes stock-based compensation. MGAM Adj. EBITDA excludes stock-based compensation and accretion of contract rights. Reflects annualized run-rat
Slide 33: Highly Achievable Cost Synergies
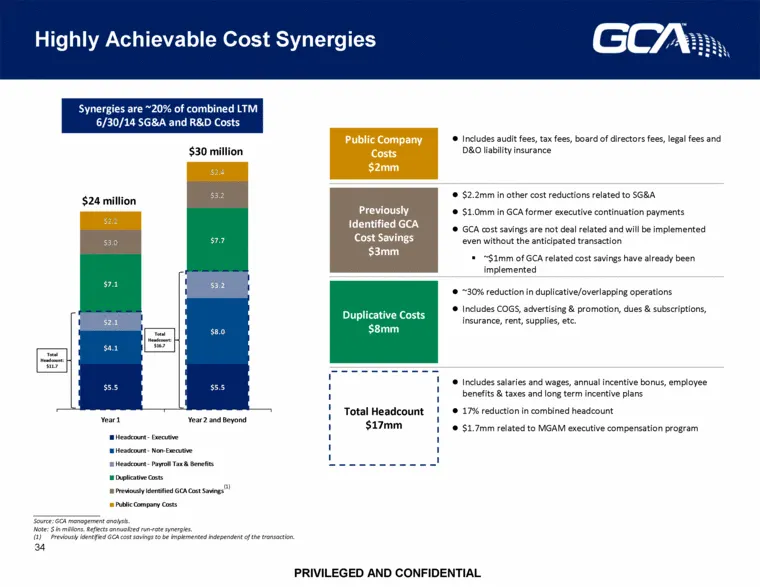
Highly Achievable Cost Synergies 34 Total Headcount $17mm Includes salaries and wages, annual incentive bonus, employee benefits & taxes and long term incentive plans 17% reduction in combined headcount $1.7mm related to MGAM executive compensation program Public Company Costs $2mm Includes audit fe
Slide 34: Highly Achievable Cost Synergies (Cont'd)
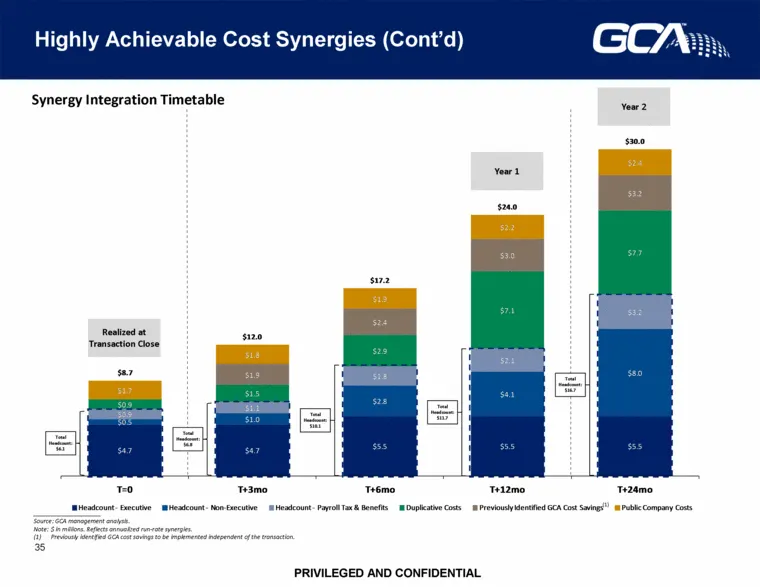
Highly Achievable Cost Synergies (Cont’d) 35 Realized at Transaction Close Year 1 Year 2 Synergy Integration Timetable Total Headcount: $6.1 Total Headcount: $6.8 Total Headcount: $10.1 Total Headcount: $11.7 Total Headcount: $16.7 (1) ____________________ Source: GCA management analysis. Note: $ in

Slide 35: Q&A
Q&A
Source: SEC EDGAR · 8-K filed Oct 29, 2014
More decks from Everi Holdings Inc
 Merger or Acquisition (February 2024)18 slides · Feb 29, 2024
 Debt Investor Presentation (April 2017)33 slides · Apr 12, 2017
 Global Cash Access Holdings — Merger or Acquisition (September 2014)14 slides · Sep 8, 2014
 Global Cash Access Holdings — Shareholder Meeting (April 2009)7 slides · Apr 10, 2009