ENI S.p.A. · MIL:ENI
ENI — Eni Plenitude — Investor Day (November 2021)
59 slides from ENI's investor day presentation, November 2021
Slide 1: Capital Markets Day
en CAPITAL]MARKETS DAY
Slide 2: Disclaimer
DISCLAIMER IMPORTANT: You must read the following before continuing. The following applies to this document, the oral presentation of the information in this document by Eni Gas e Luce S.p.A. società benefit and its affiliates (the “Company”) or any person on behalf of the Company, and any question-

Slide 3: Plenitude Capital Markets Day: CEO Introduction
EN! RETAIL & RENEWABLES CAPITAL MARKETS DAY EN! CEO INTRODUCTION
Slide 4: Eni diversified approach for the energy transition
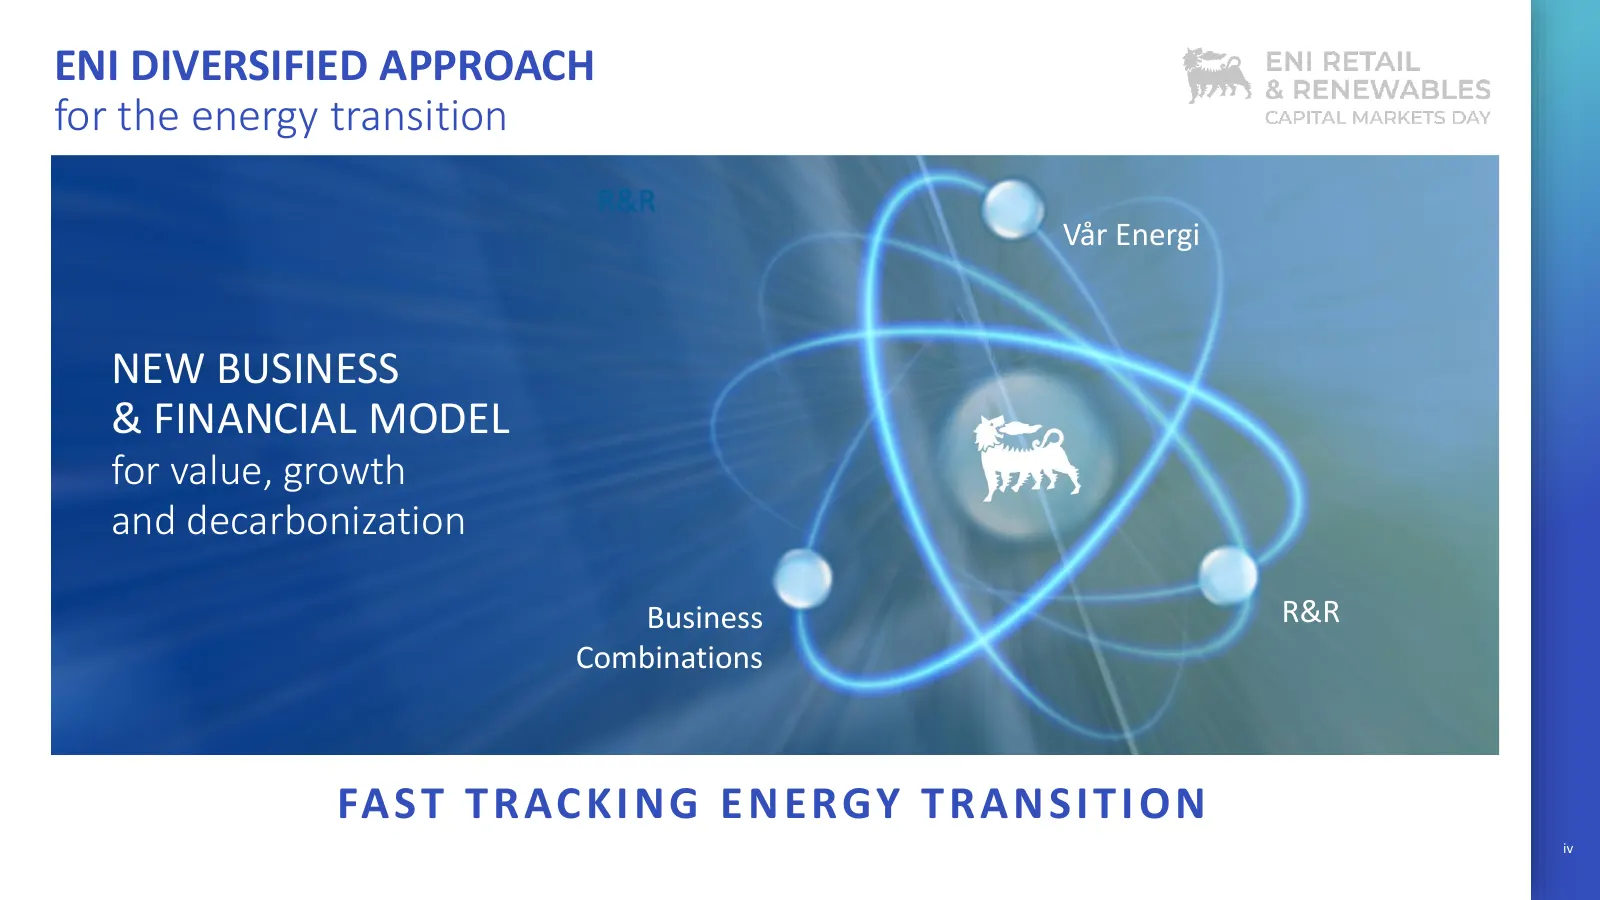
ENI DIVERSIFIED APPROACH for the energy transition Vår Energi NEW BUSINESS & FINANCIAL MODEL for value, growth and decarbonization Business R&R Combinations FA ST T R AC K I N G E N E RGY T R A N S I T I O N iv
Slide 5: Stakeholder value creation through listing
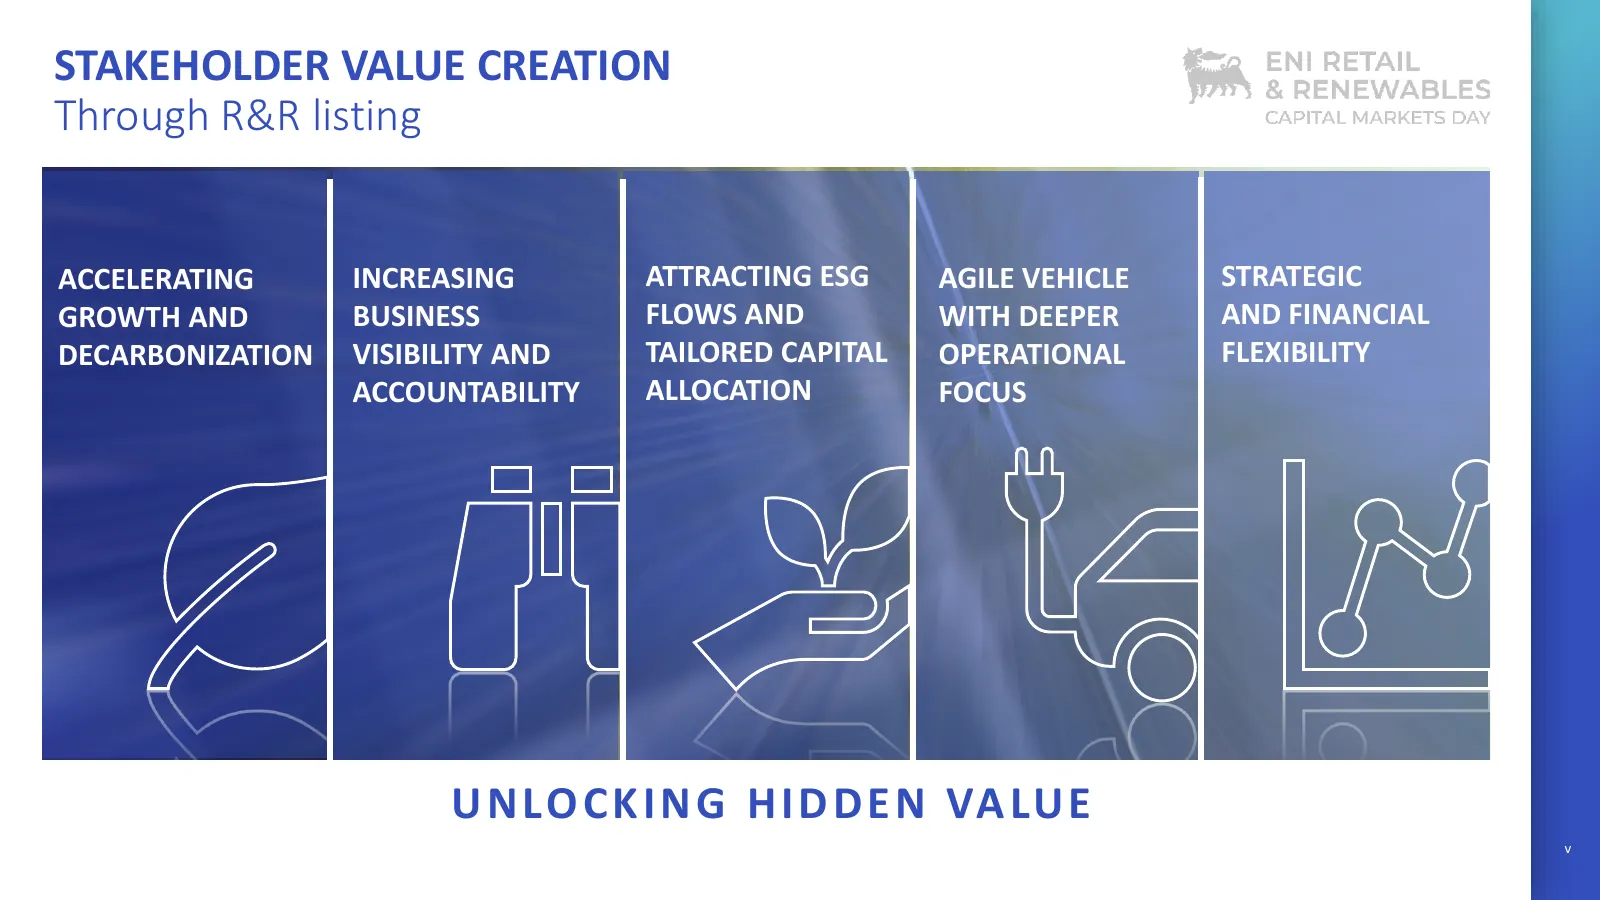
STAKEHOLDER VALUE CREATION Through R&R listing ACCELERATING INCREASING ATTRACTING ESG AGILE VEHICLE STRATEGIC GROWTH AND BUSINESS FLOWS AND WITH DEEPER AND FINANCIAL DECARBONIZATION VISIBILITY AND TAILORED CAPITAL OPERATIONAL FLEXIBILITY ACCOUNTABILITY ALLOCATION FOCUS U N LO C K I N G H I D D E N V
Slide 6: Capital Markets Day
en CAPITAL]MARKETS DAY
Slide 7: Table of contents
TABLE OF CONTENTS PLENITUDE FITS INTO ENI’S STRATEGY AND INDUSTRY BACKDROP A UNIQUE PROPOSITION A STRONG RENEWABLES PIPELINE TO FUEL THE GROWTH A LEADING RETAIL BUSINESS WITH MULTIPLE GROWTH LEVERS AN INTEGRATED E-MOBILITY STRATEGY A SOLID FINANCIAL FRAMEWORK ANNEX 2
Slide 8: Plenitude fits into Eni's strategy and industry backdrop
PLENITUDE FITS INTO ENI’S STRATEGY AND INDUSTRY BACKDROP A UNIQUE PROPOSITION A STRONG RENEWABLES PIPELINE TO FUEL THE GROWTH A LEADING RETAIL BUSINESS WITH MULTIPLE GROWTH LEVERS AN INTEGRATED E-MOBILITY STRATEGY A SOLID FINANCIAL FRAMEWORK ANNEX 3
Slide 9: A supportive industry backdrop
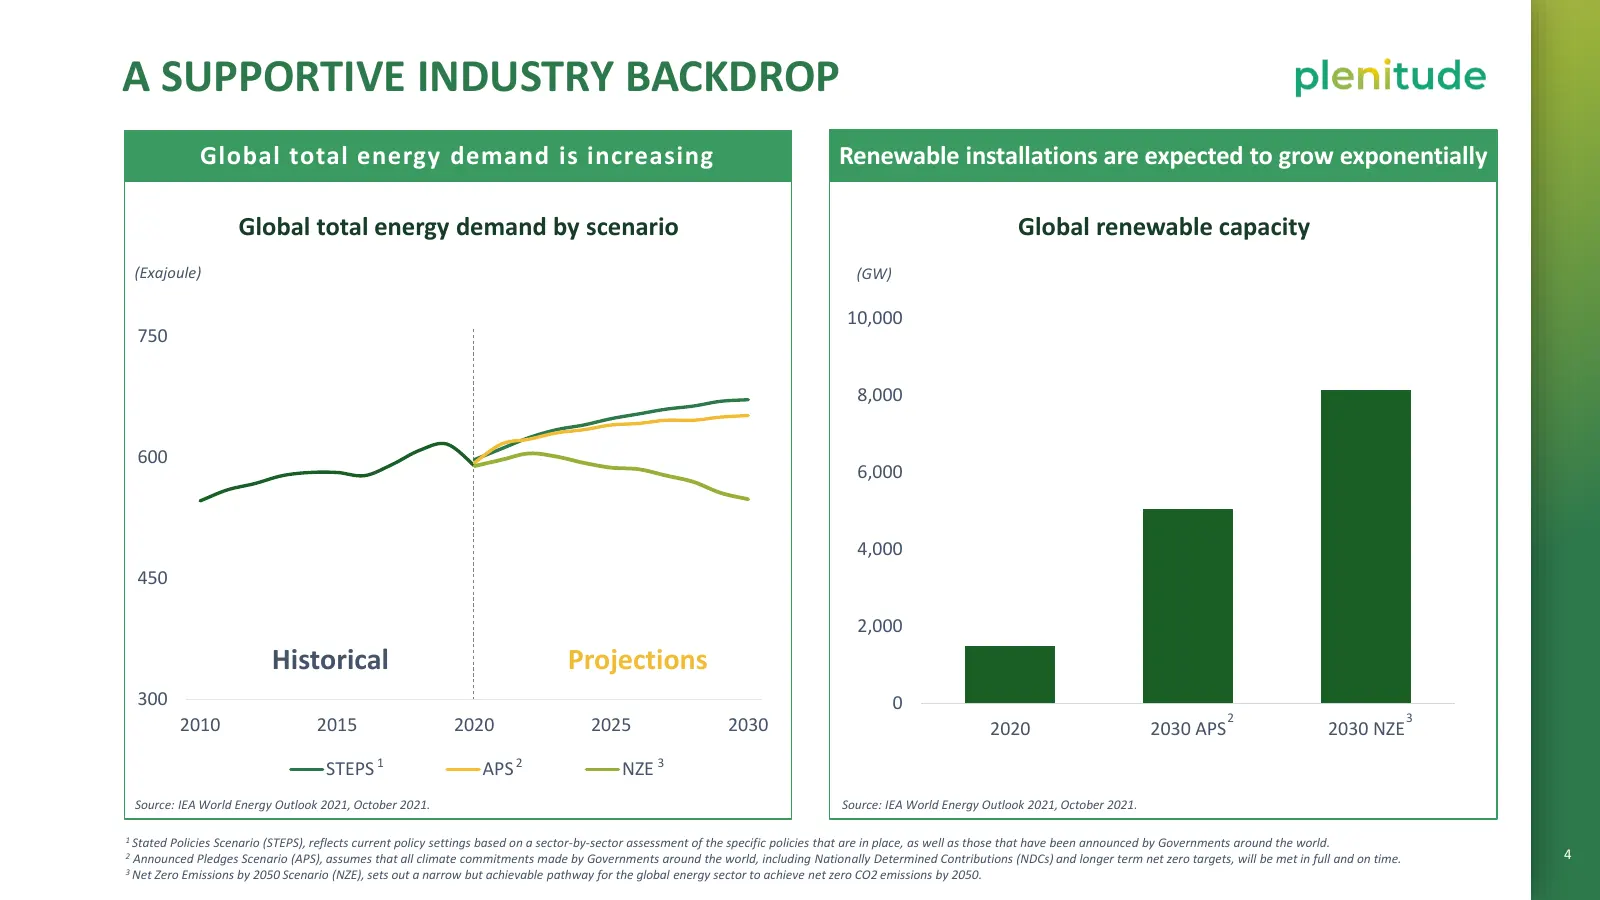
A SUPPORTIVE INDUSTRY BACKDROP Global total energy demand is increasing Renewable installations are expected to grow exponentially Global total energy demand by scenario Global renewable capacity (Exajoule) (GW) 10,000 750 8,000 600 6,000 4,000 450 2,000 Historical Projections 300 ,0 2 3 2010 2015 2
Slide 10: A supportive industry backdrop
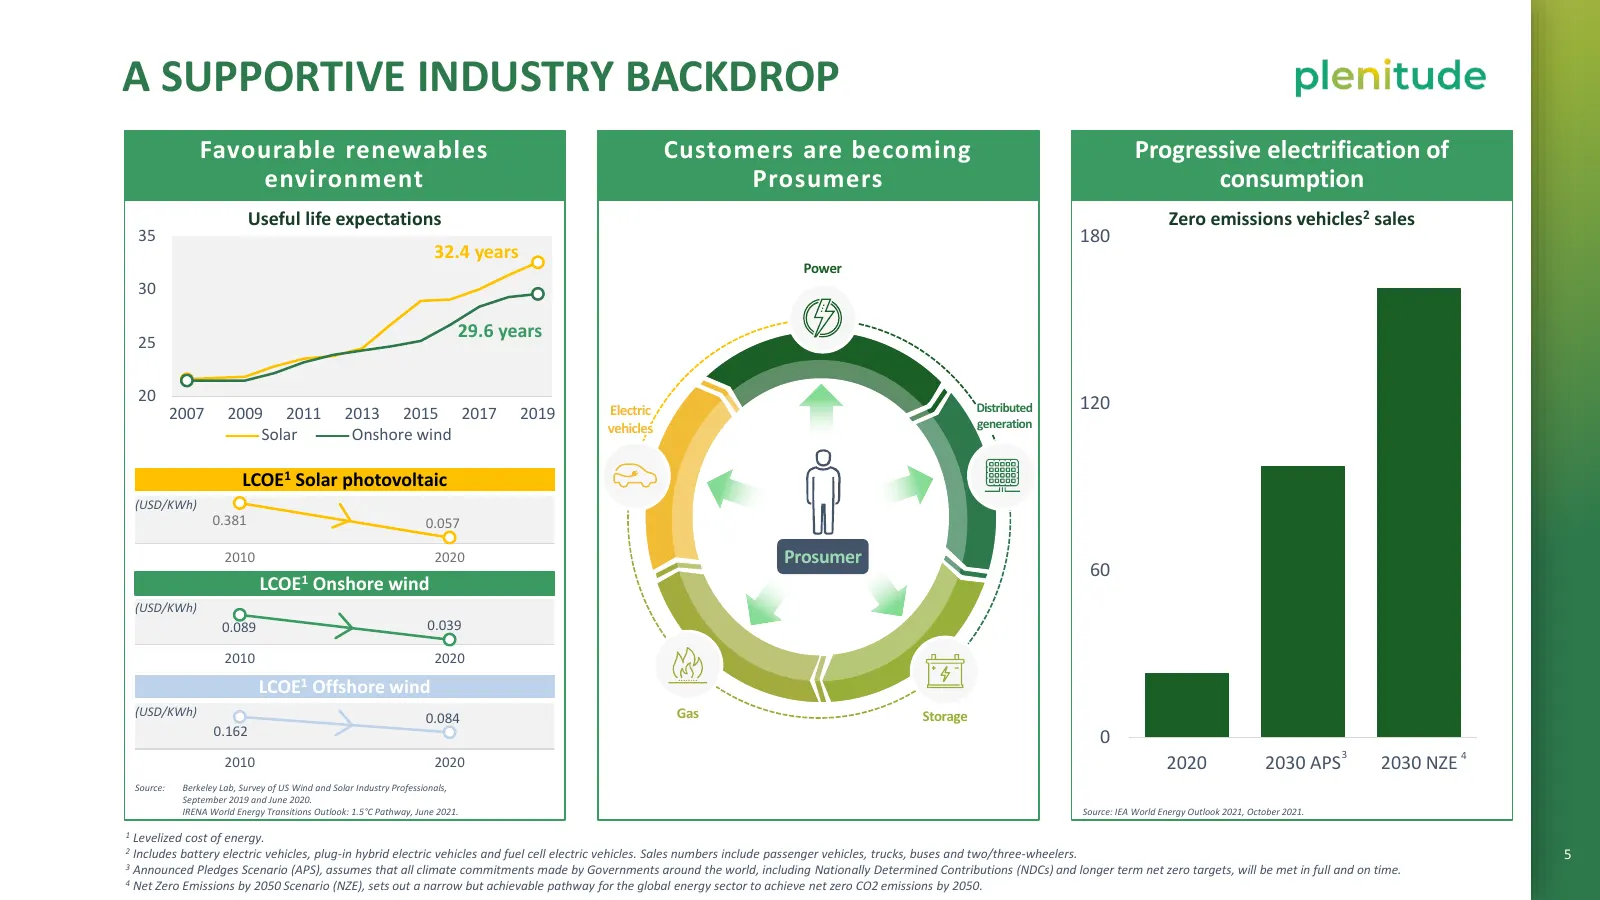
A SUPPORTIVE INDUSTRY BACKDROP Favourable renewables Customers are becoming Progressive electrification of environment Prosumers consumption Useful life expectations Zero emissions vehicles2 sales 35 180 32.4 years Power 30 29.6 years 25 20 120 2007 2009 2011 2013 2015 2017 2019 Electric Distributed
Slide 11: A unique proposition
PLENITUDE FITS INTO ENI’S STRATEGY AND INDUSTRY BACKDROP A UNIQUE PROPOSITION A STRONG RENEWABLES PIPELINE TO FUEL THE GROWTH A LEADING RETAIL BUSINESS WITH MULTIPLE GROWTH LEVERS AN INTEGRATED E-MOBILITY STRATEGY A SOLID FINANCIAL FRAMEWORK ANNEX 6
Slide 12: A unique proposition
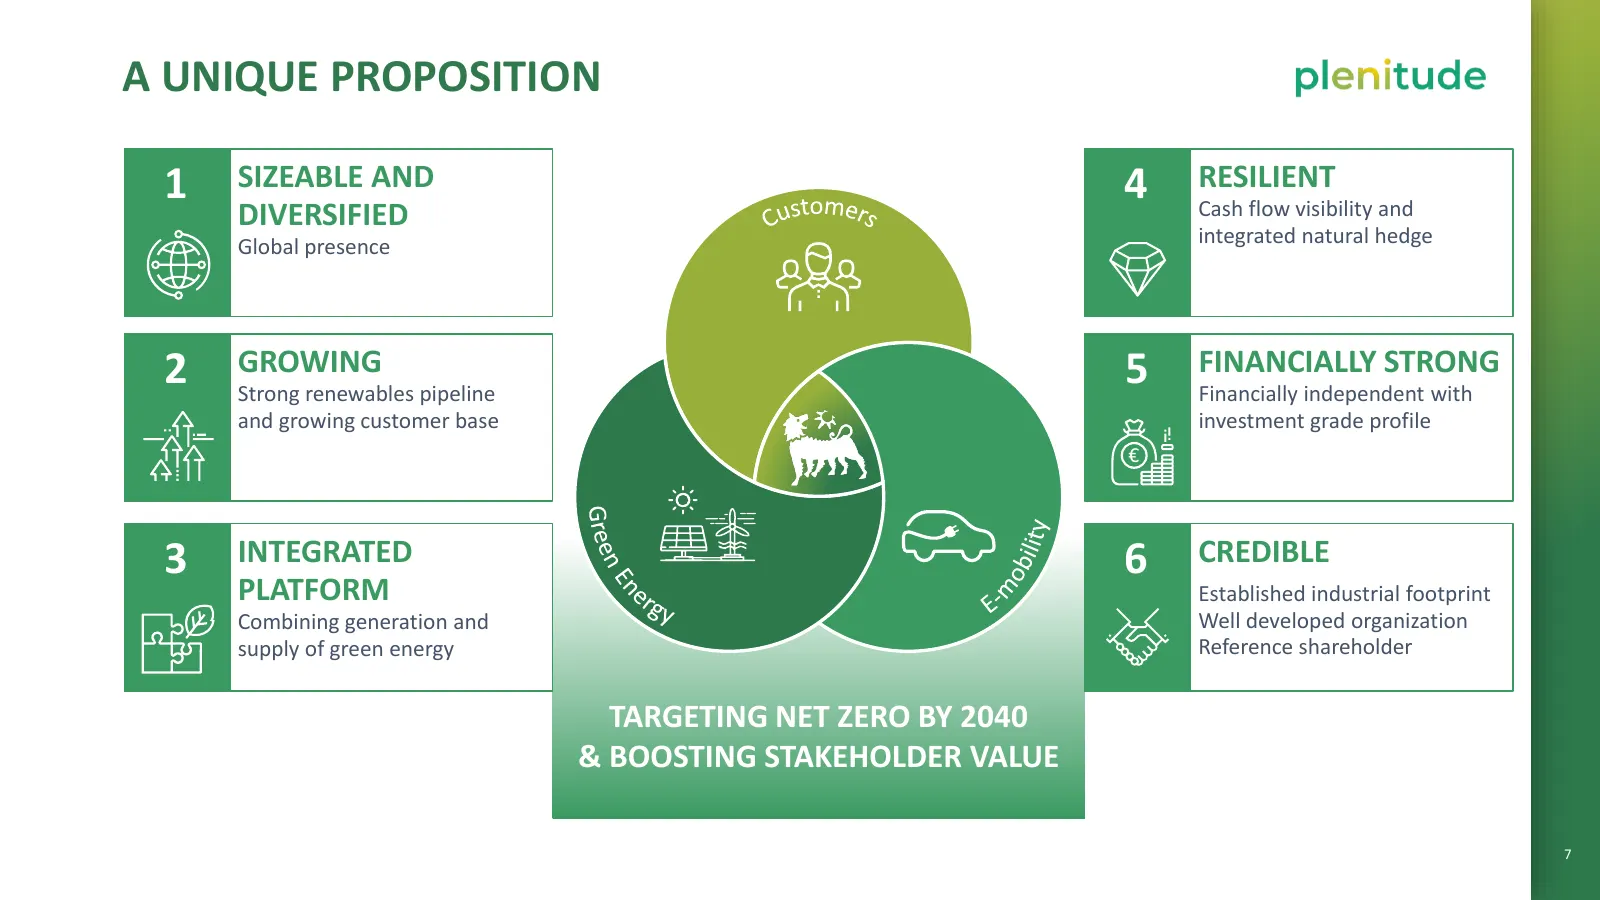
A UNIQUE PROPOSITION 1 SIZEABLE AND 4 RESILIENT DIVERSIFIED Cash flow visibility and Global presence integrated natural hedge 2 GROWING 5 FINANCIALLY STRONG Strong renewables pipeline Financially independent with and growing customer base investment grade profile € 3 INTEGRATED 6 CREDIBLE PLATFORM E
Slide 13: Sizeable and diversified
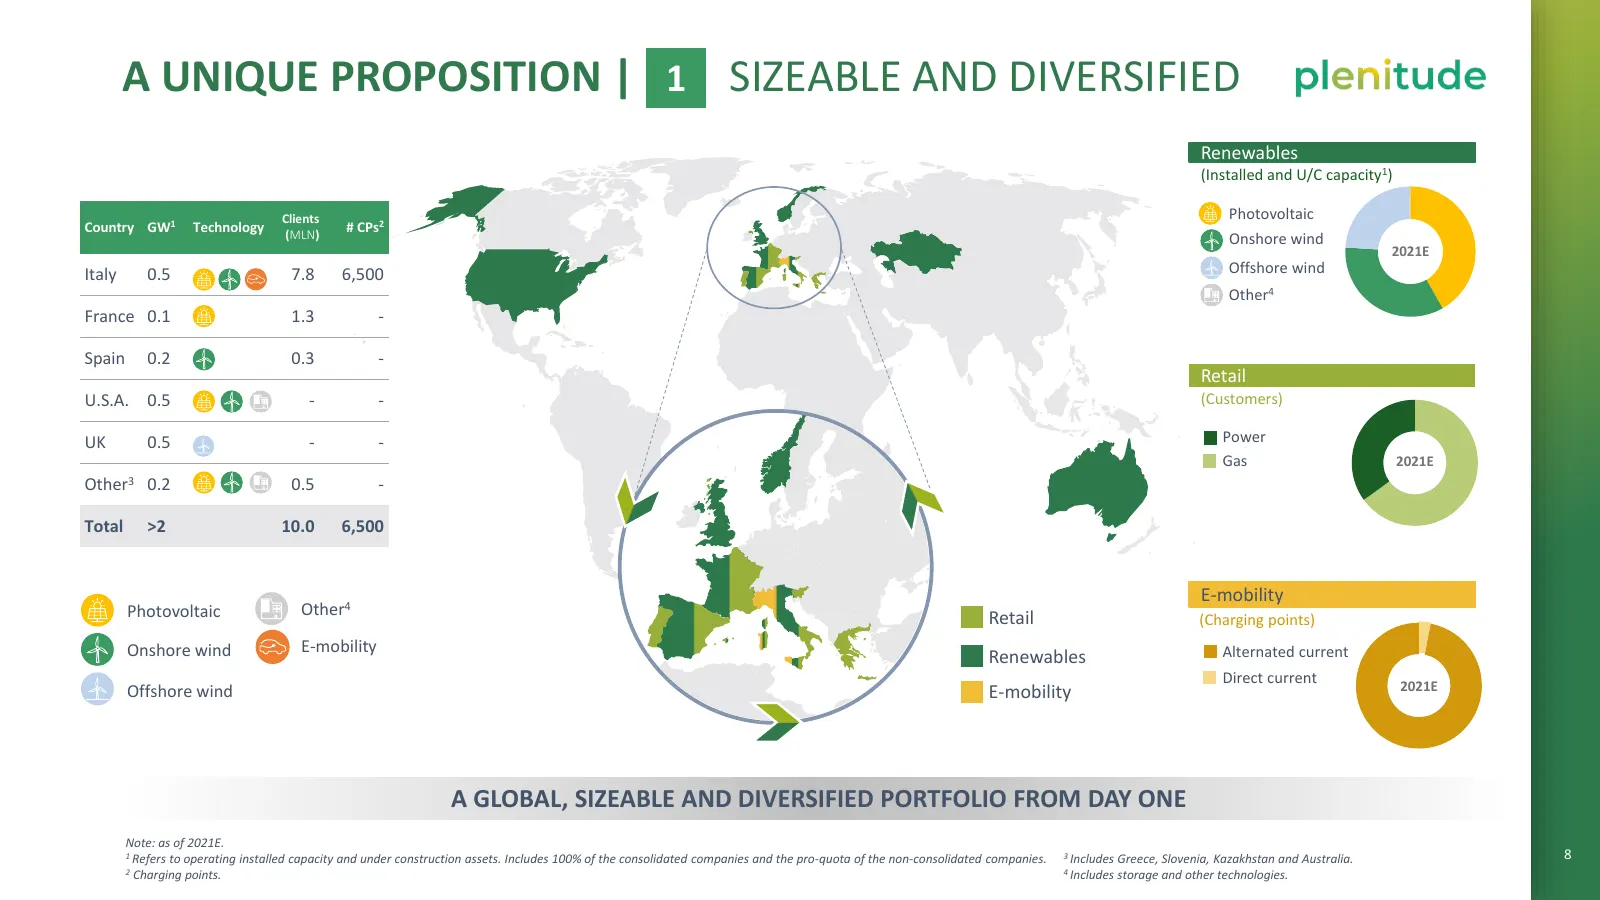
A UNIQUE PROPOSITION | 1 SIZEABLE AND DIVERSIFIED Renewables (Installed and U/C capacity1) Clients Photovoltaic Country GW1 Technology (MLN) # CPs2 Onshore wind 2021E Italy 0.5 7.8 6,500 Offshore wind Other4 France 0.1 1.3 - Spain 0.2 0.3 - Retail U.S.A. 0.5 - - (Customers) UK 0.5 - - Power Gas 2021
Slide 14: Growing
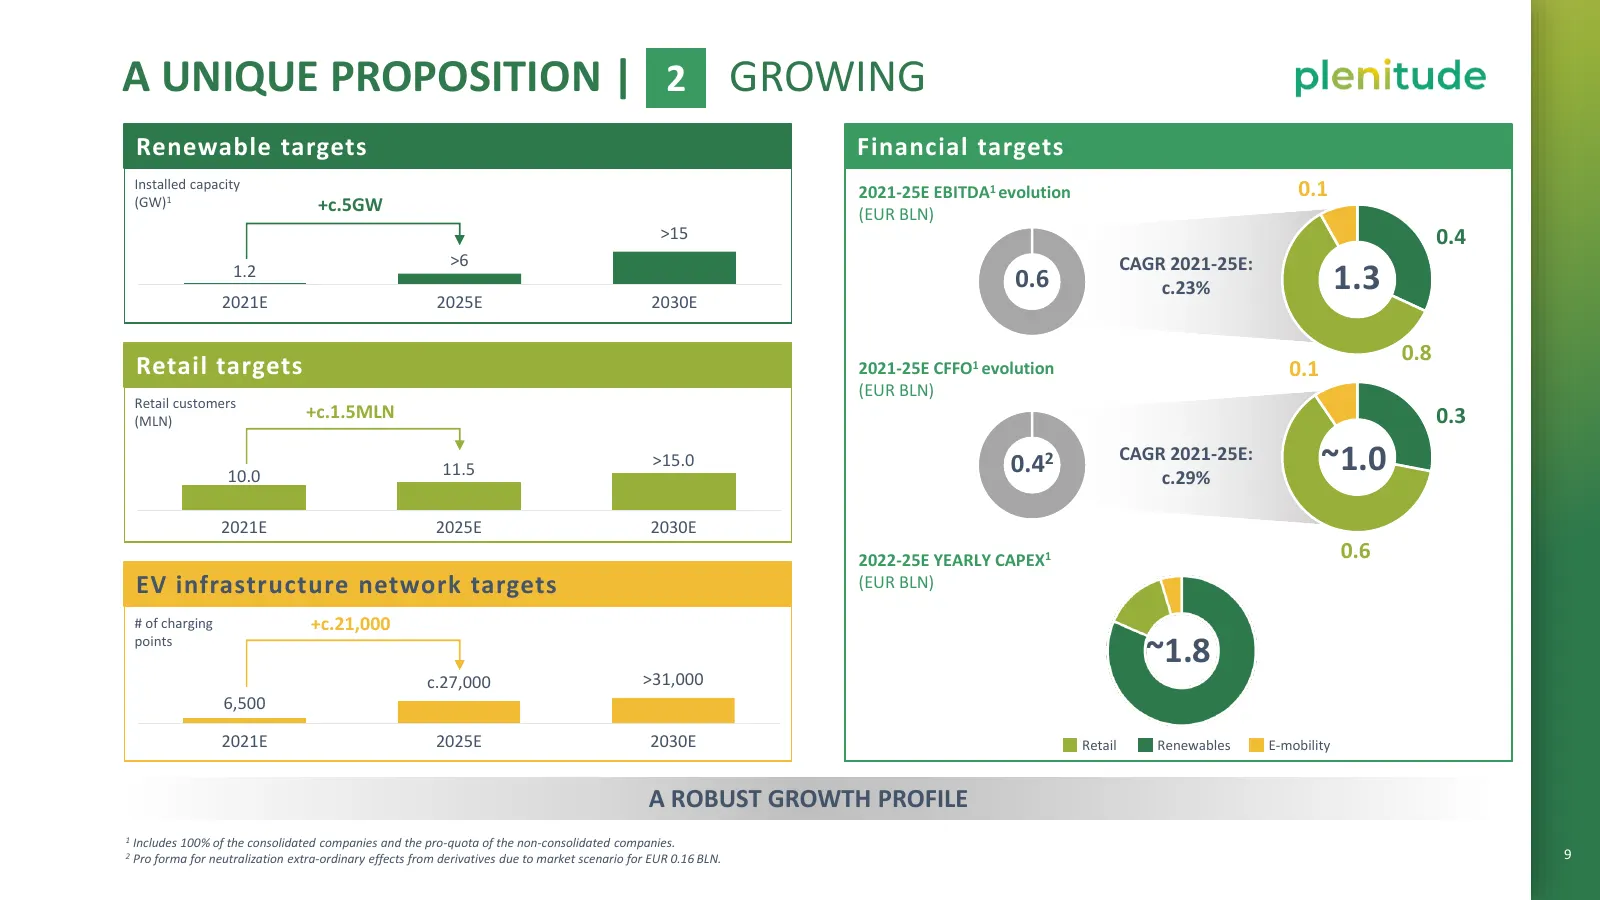
A UNIQUE PROPOSITION | 2 GROWING Renewable targets Financial targets Installed capacity 2021-25E EBITDA1 evolution 0.1 (GW)1 +c.5GW (EUR BLN) >15 0.4 >6 CAGR 2021-25E: 1.2 0.6 c.23% 1.3 2021E 2025E 2030E 0.8 Retail targets 2021-25E CFFO1 evolution 0.1 (EUR BLN) Retail customers (MLN) +c.1.5MLN 0.3 1
Slide 15: Integrated platform
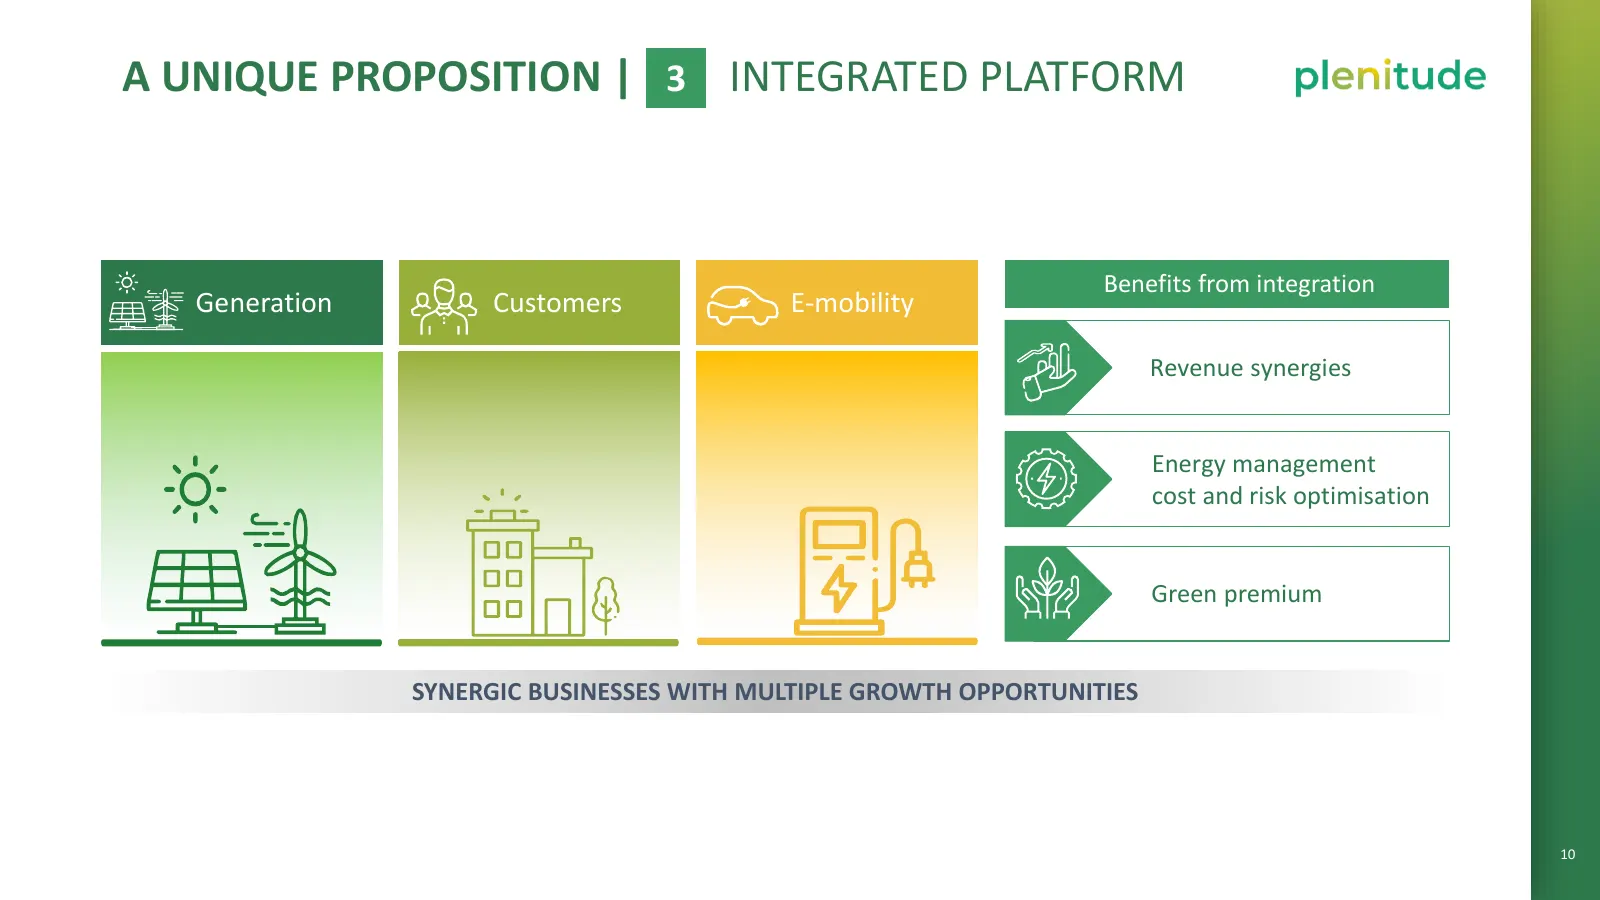
e A UNIQUE PROPOSITION | 3 INTEGRATED PLATFORM Benefits from integration Generation Customers E-mobility Revenue synergies Energy management cost and risk optimisation Green premium SYNERGIC BUSINESSES WITH MULTIPLE GROWTH OPPORTUNITIES 10
Slide 16: Resilient
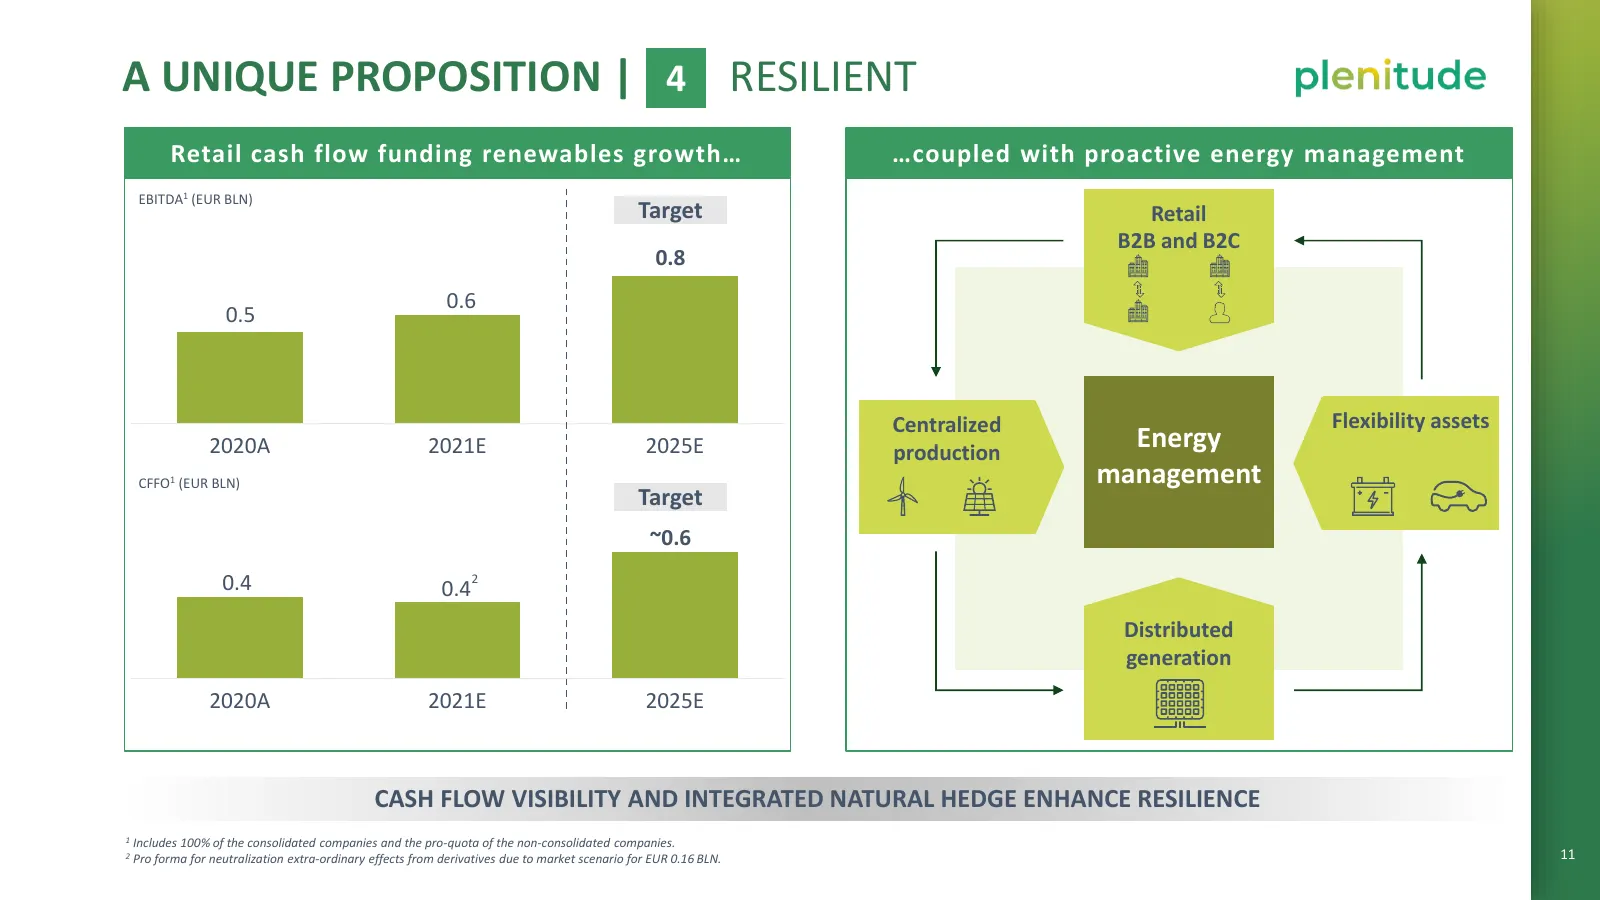
A UNIQUE PROPOSITION | 4 RESILIENT Retail cash flow funding renewables growth… …coupled with proactive energy management EBITDA1 (EUR BLN) Target Retail B2B and B2C 0.8 0.6 0.5 Centralized Flexibility assets 2020A xx 2021E 2025E production Energy CFFO1 (EUR BLN) management Target ~0.6 2 0.4 0.4 Dist
Slide 17: Financially strong
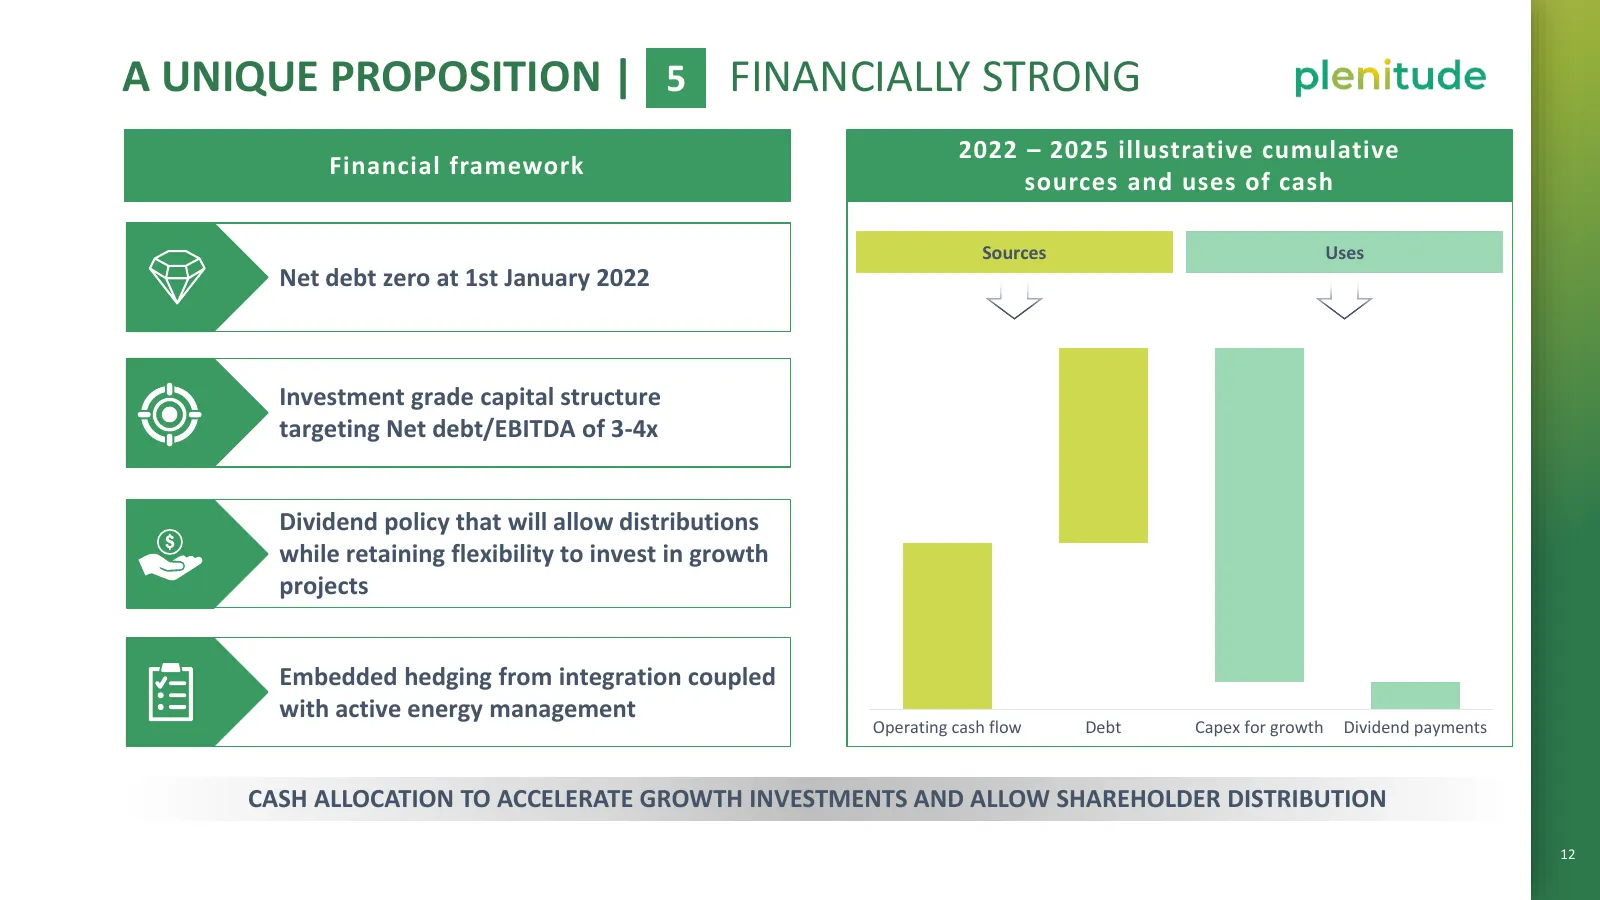
A UNIQUE PROPOSITION | 5 FINANCIALLY STRONG 2022 – 2025 illustrative cumulative Financial framework sources and uses of cash Sources Uses Net debt zero at 1st January 2022 Investment grade capital structure targeting Net debt/EBITDA of 3-4x Dividend policy that will allow distributions while retaini
Slide 18: Credible
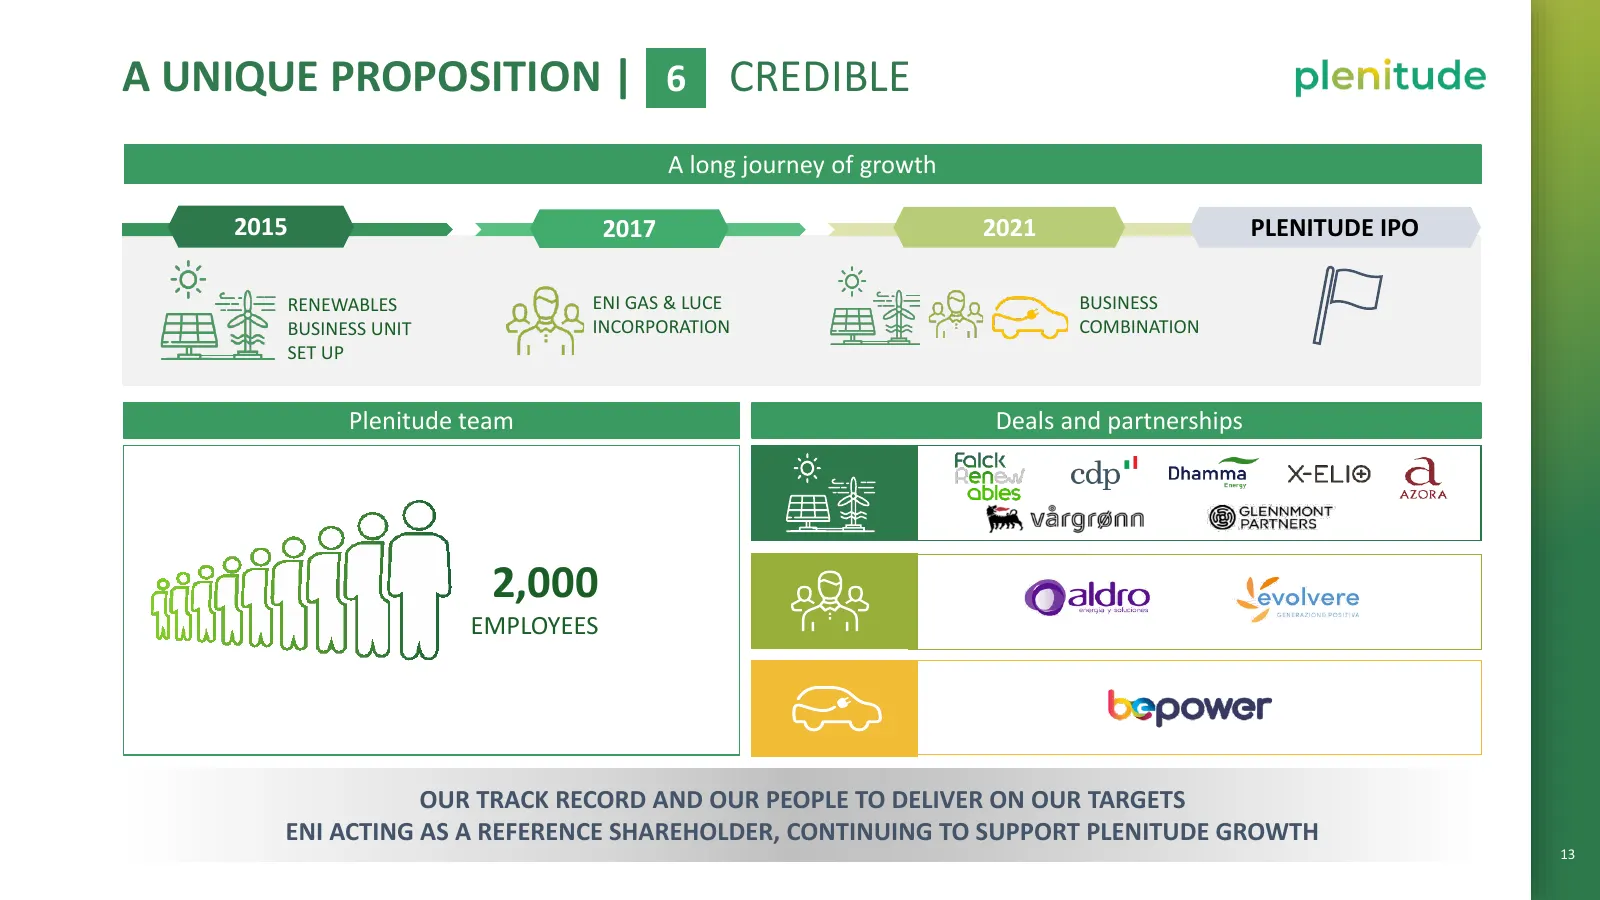
e A UNIQUE PROPOSITION | 6 CREDIBLE A long journey of growth 2015 2015 2017 2015 2017 2017 2021 2017 PLENITUDE IPO RENEWABLES ENI GAS & LUCE BUSINESS BUSINESS UNIT INCORPORATION COMBINATION SET UP Plenitude team Deals and partnerships 2,000 EMPLOYEES OUR TRACK RECORD AND OUR PEOPLE TO DELIVER ON OUR
Slide 19: Growing while decarbonising our customer base
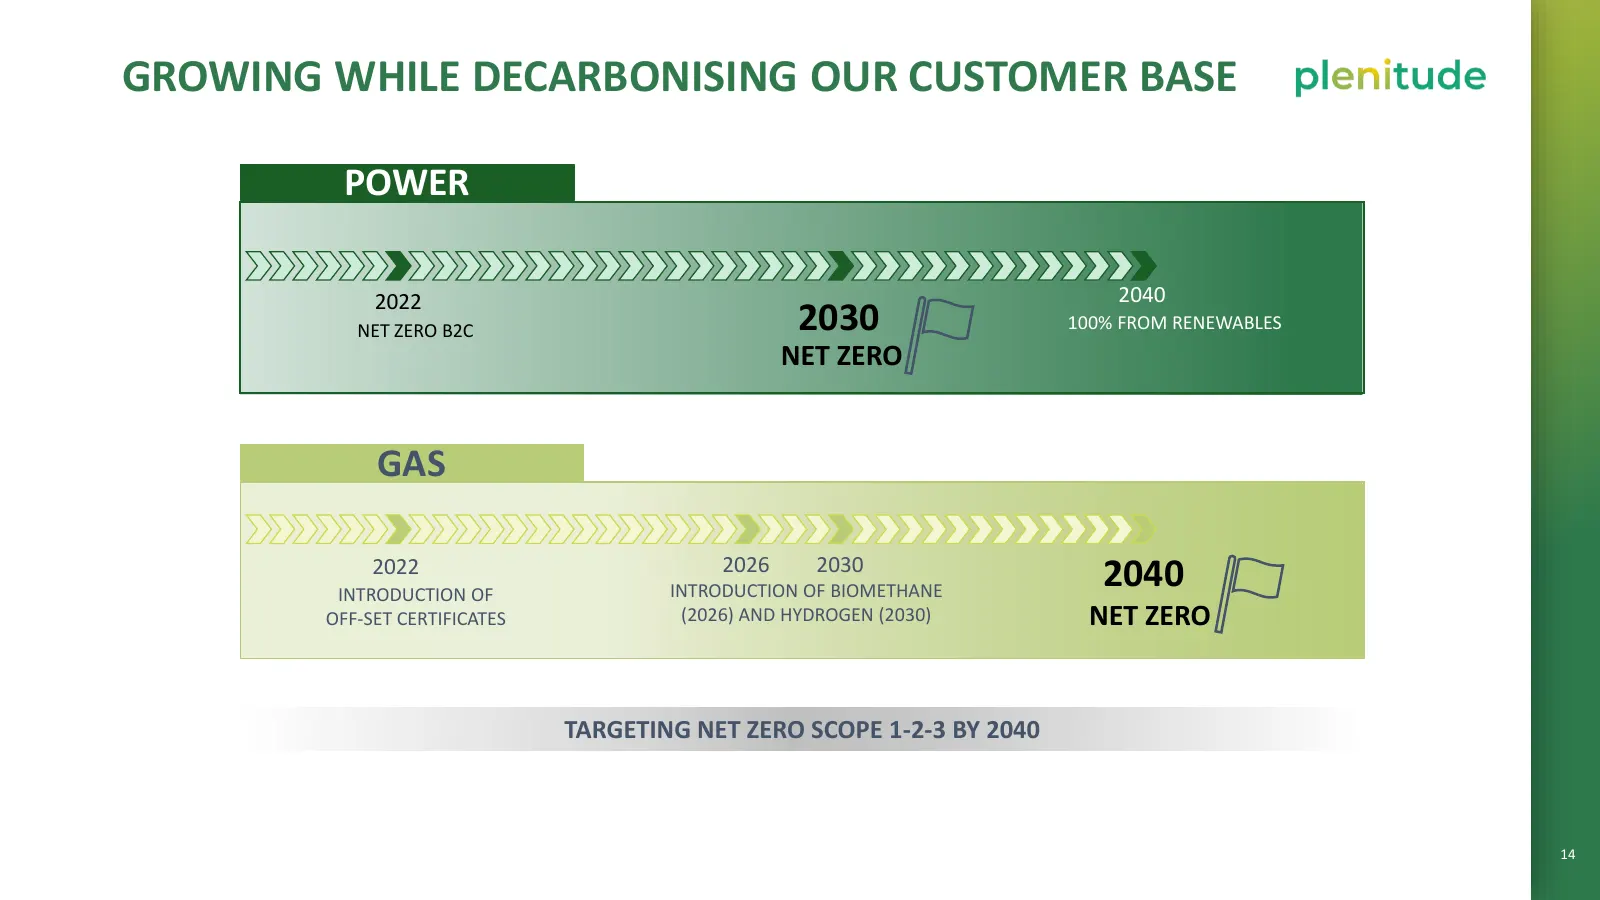
GROWING WHILE DECARBONISING OUR CUSTOMER BASE POWER 2022 2040 NET ZERO B2C 2030 100% FROM RENEWABLES NET ZERO GAS 2026 2030 2022 INTRODUCTION OF INTRODUCTION OF BIOMETHANE 2040 OFF-SET CERTIFICATES (2026) AND HYDROGEN (2030) NET ZERO TARGETING NET ZERO SCOPE 1-2-3 BY 2040 14
Slide 20: Our ESG model
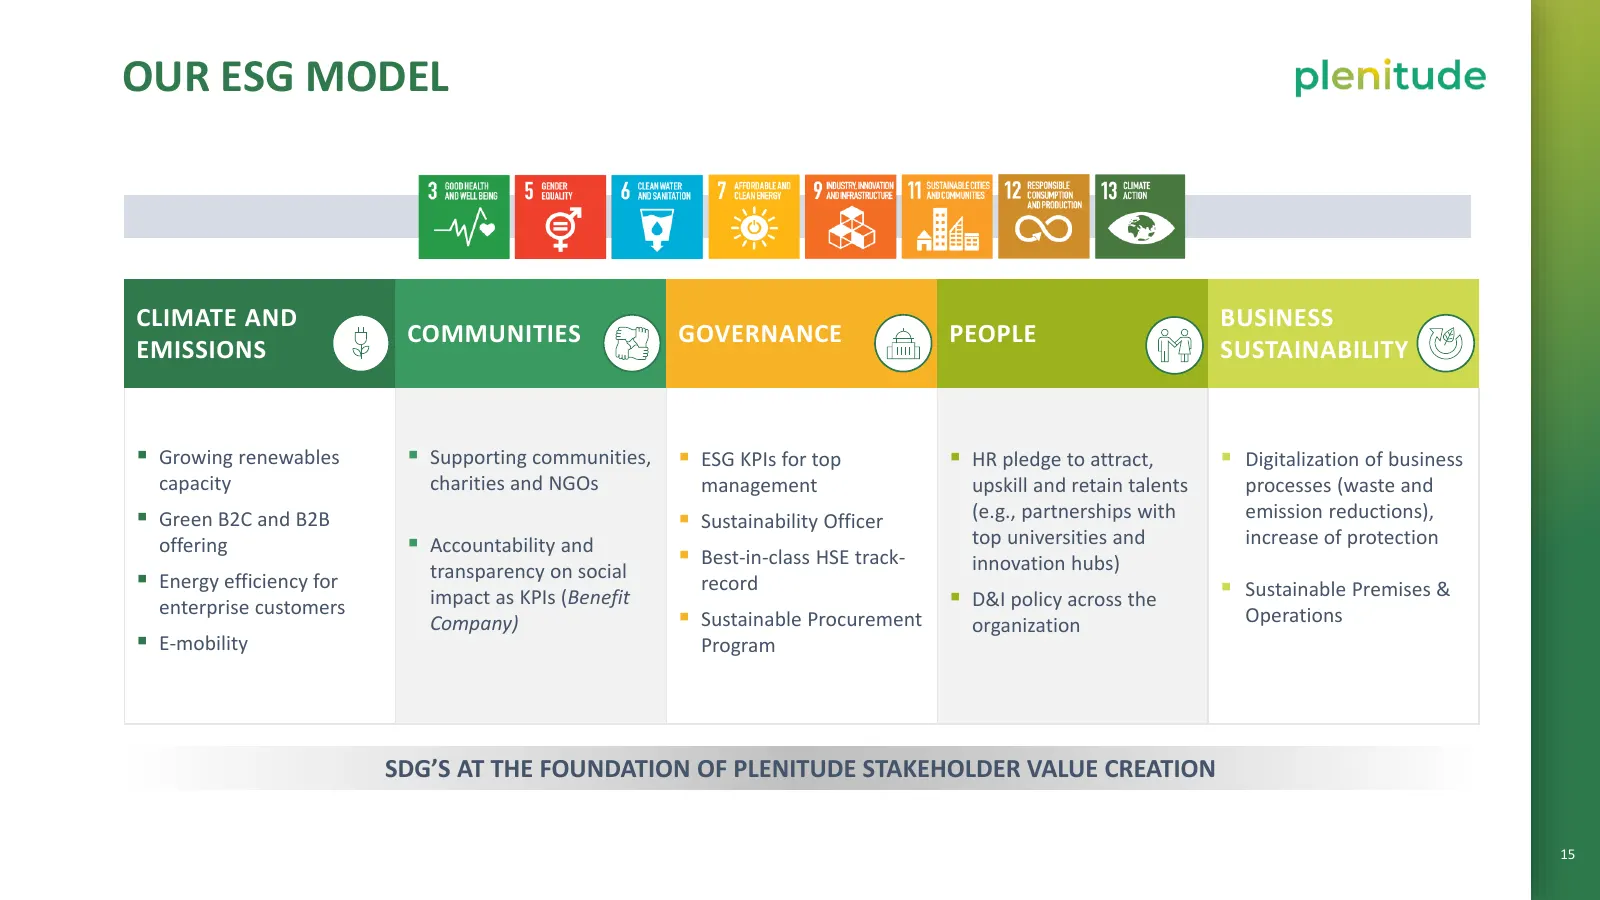
OUR ESG MODEL CLIMATE AND BUSINESS COMMUNITIES GOVERNANCE PEOPLE EMISSIONS SUSTAINABILITY ▪ Growing renewables ▪ Supporting communities, ▪ ESG KPIs for top ▪ HR pledge to attract, ▪ Digitalization of business capacity charities and NGOs management upskill and retain talents processes (waste and ▪ Gr
Slide 21: Plenitude leadership team
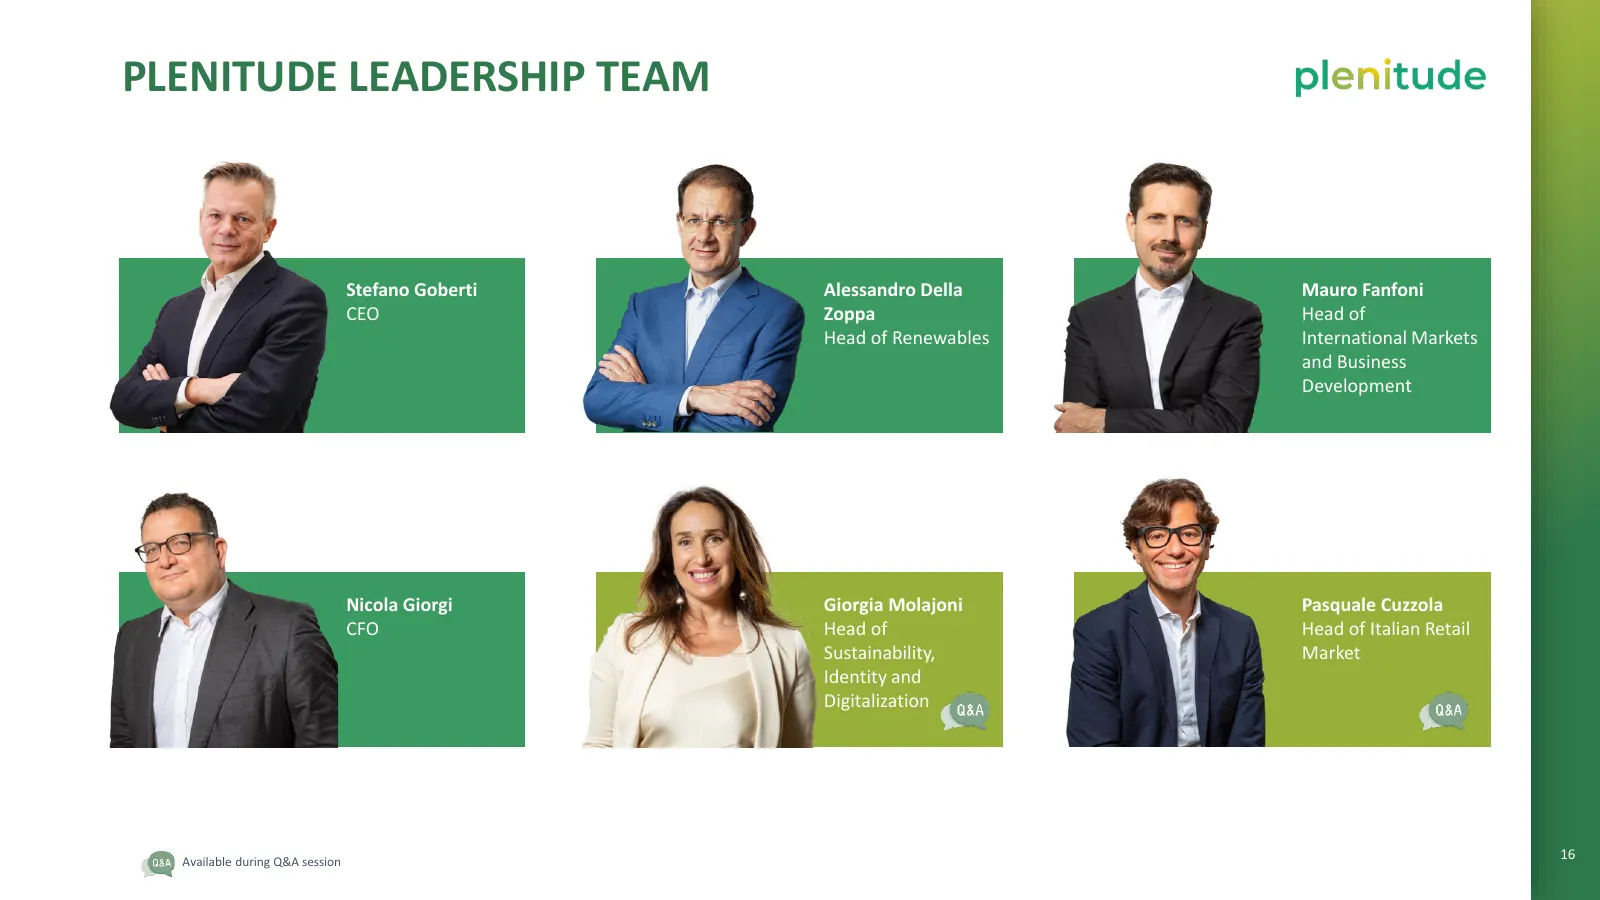
e PLENITUDE LEADERSHIP TEAM Stefano Goberti Alessandro Della Mauro Fanfoni CEO Zoppa Head of Head of Renewables International Markets and Business Development Nicola Giorgi Giorgia Molajoni Pasquale Cuzzola CFO Head of Head of Italian Retail Sustainability, Market Identity and Digitalization Availab
Slide 22: A strong renewables pipeline to fuel the growth
PLENITUDE FITS INTO ENI’S STRATEGY AND INDUSTRY BACKDROP A UNIQUE PROPOSITION A STRONG RENEWABLES PIPELINE TO FUEL THE GROWTH A LEADING RETAIL BUSINESS WITH MULTIPLE GROWTH LEVERS AN INTEGRATED E-MOBILITY STRATEGY A SOLID FINANCIAL FRAMEWORK ANNEX 17
Slide 23: Renewables snapshot
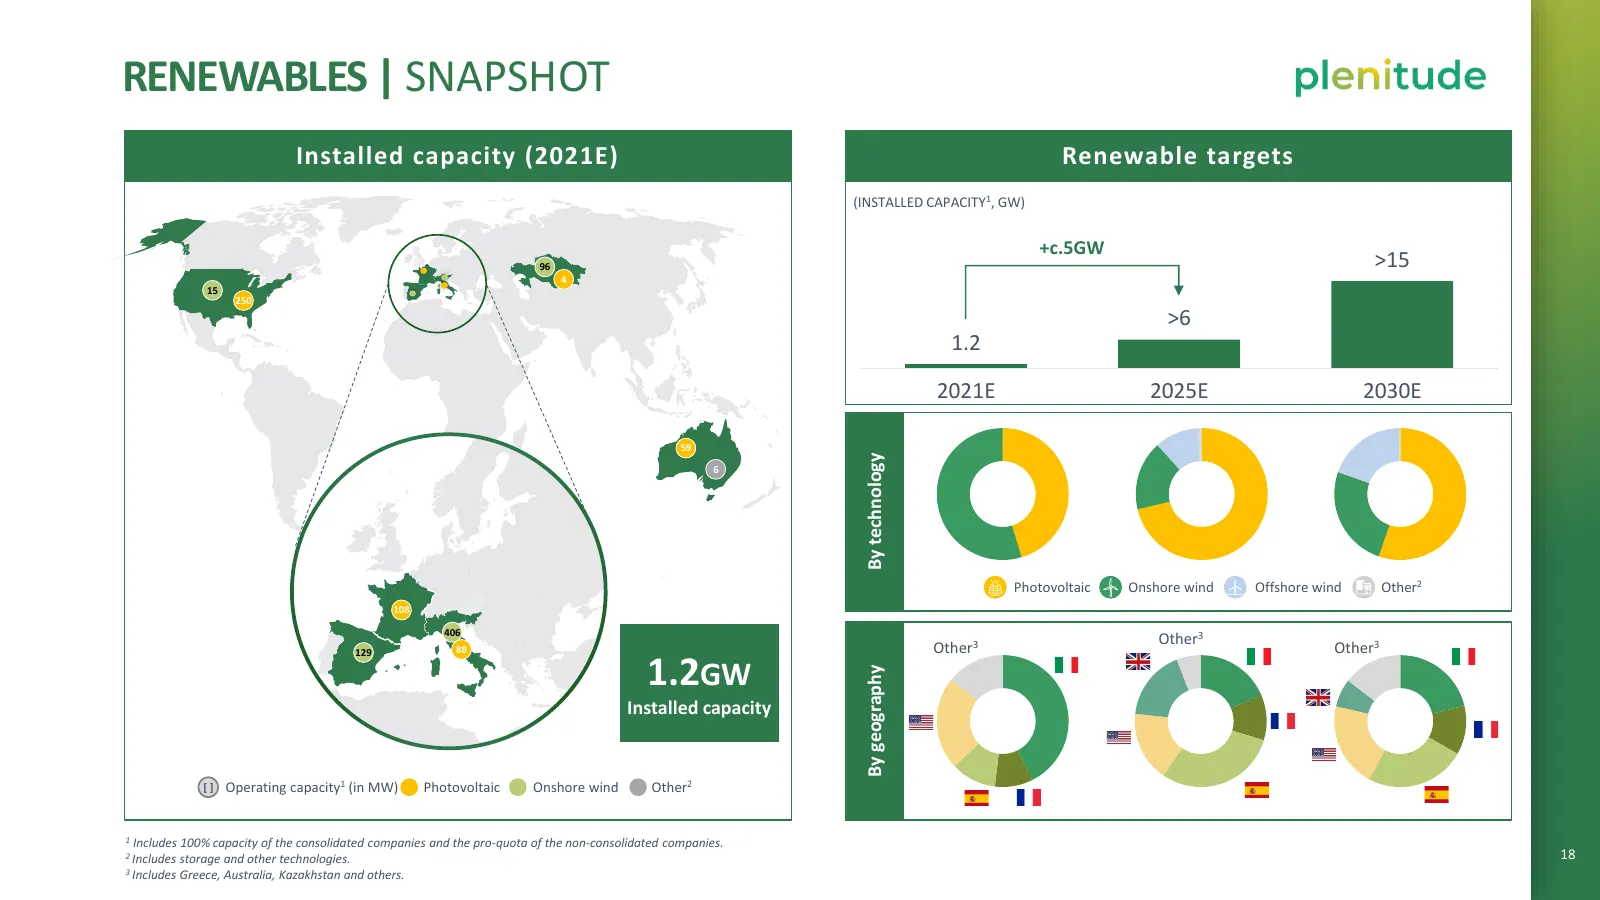
RENEWABLES | SNAPSHOT Installed capacity (2021E) Renewable targets (INSTALLED CAPACITY1, GW) +c.5GW 96 xx >15 4 15 250 >6 1.2 2021E 2025E 2030E 59 By technology 6 Geographical footprint (2021e) Photovoltaic Onshore wind Offshore wind Other2 108 406 Other3 129 88 Other3 Other3 1.2GW By geography Inst
Slide 24: Drivers for international growth
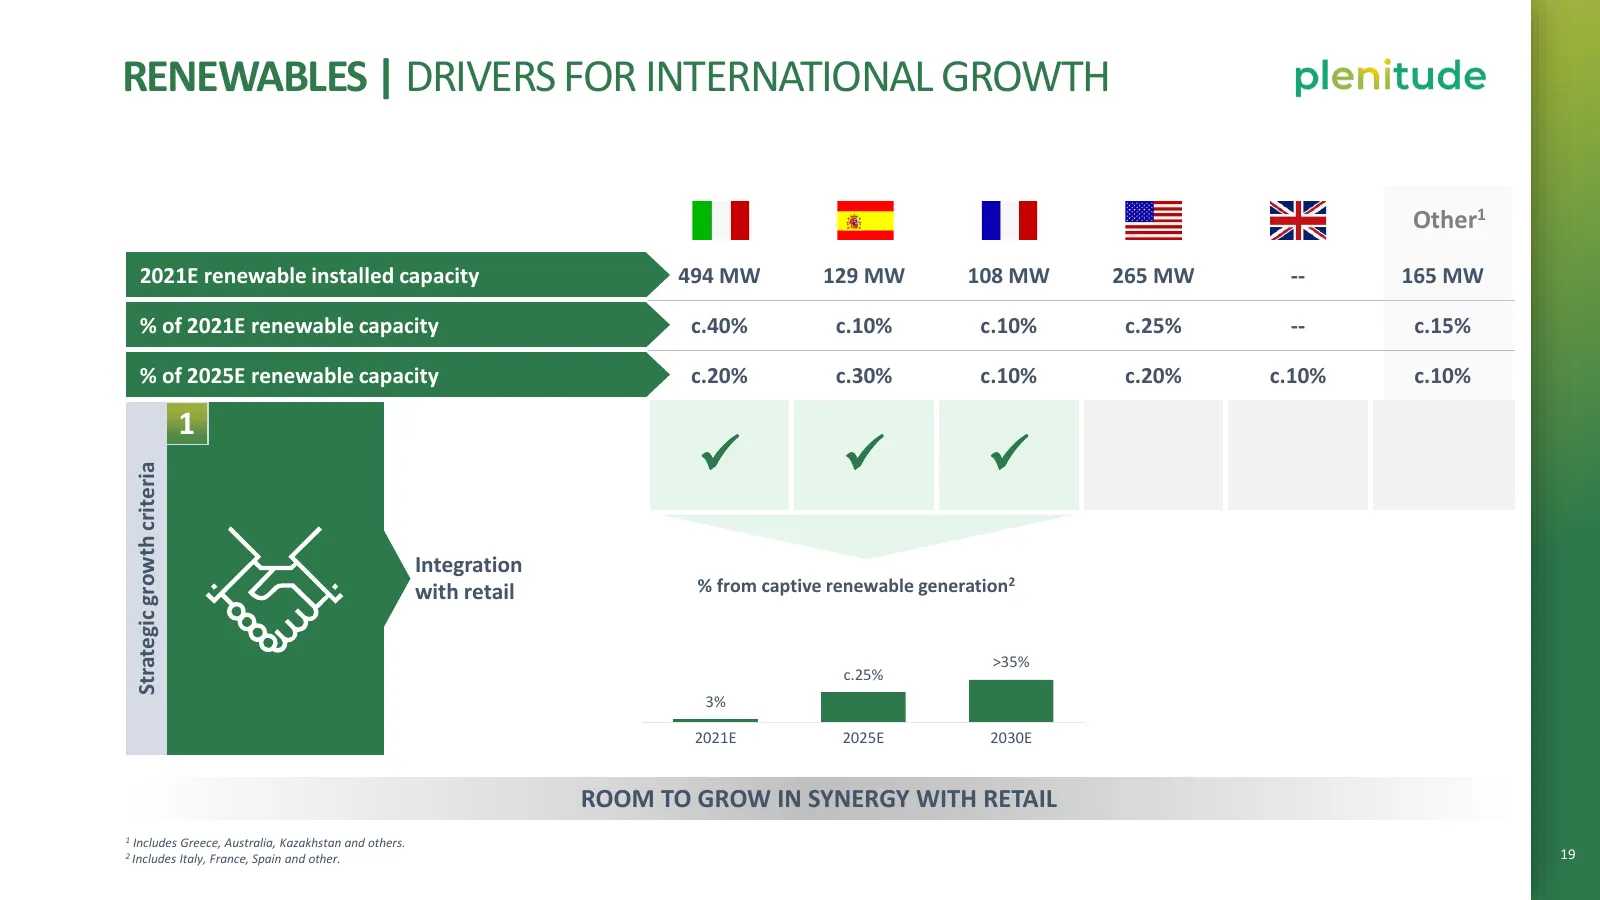
RENEWABLES | DRIVERS FOR INTERNATIONAL GROWTH Other1 2021E renewable installed capacity 494 MW 129 MW 108 MW 265 MW -- 165 MW % of 2021E renewable capacity c.40% c.10% c.10% c.25% -- c.15% % of 2025E renewable capacity c.20% c.30% c.10% c.20% c.10% c.10% 1 ✓ ✓ ✓ Strategic growth criteria Integration
Slide 25: Drivers for international growth
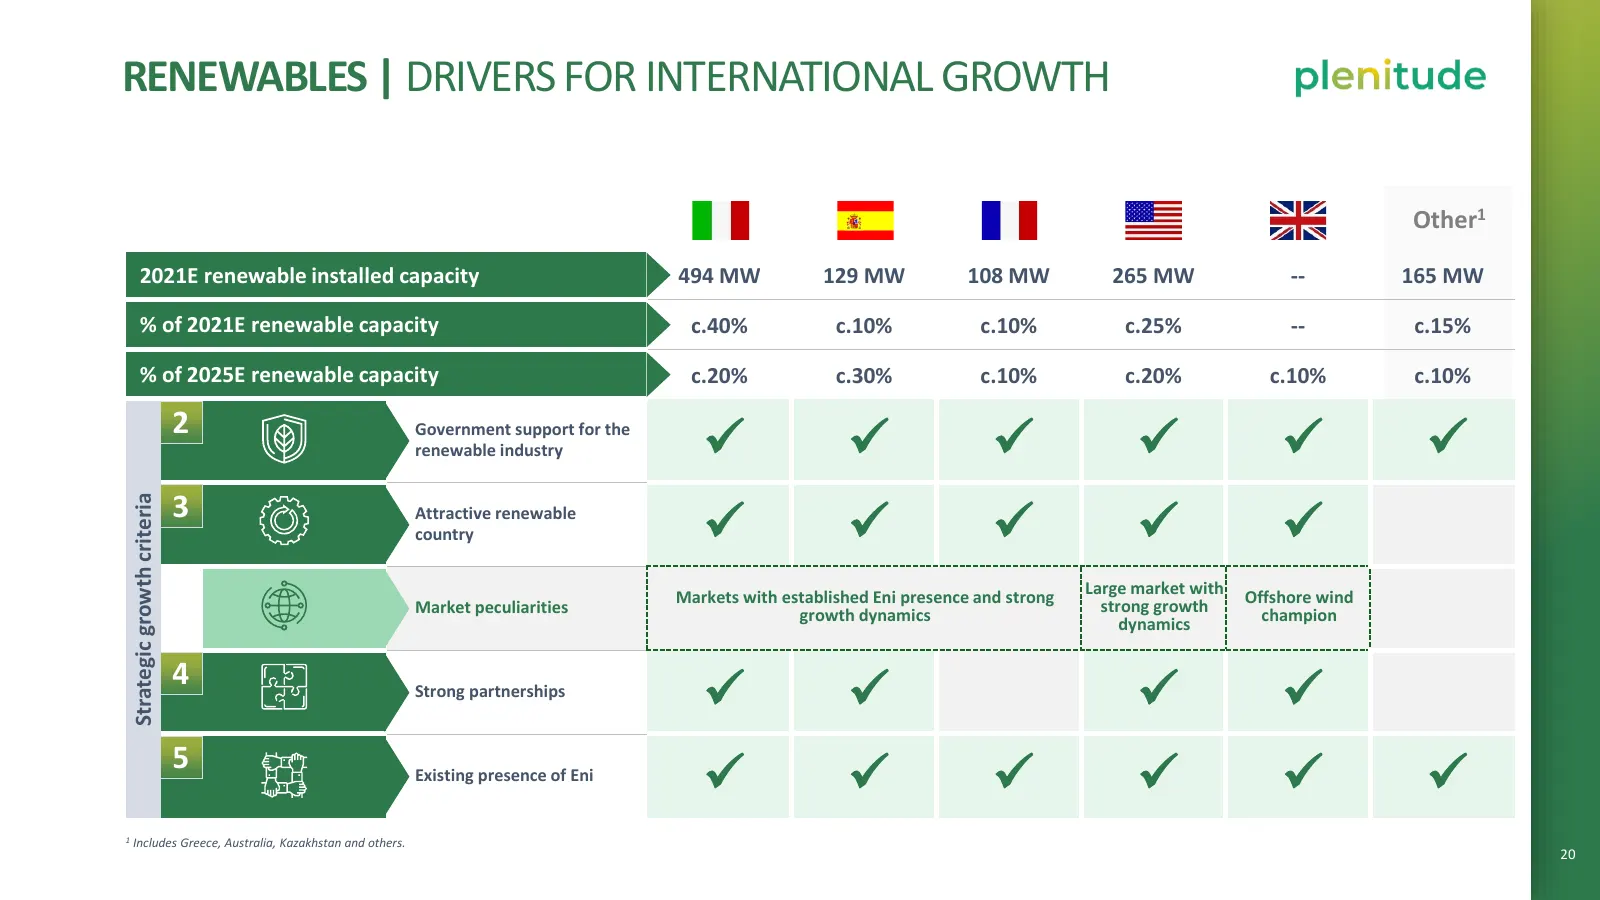
RENEWABLES | DRIVERS FOR INTERNATIONAL GROWTH Other1 2021E renewable installed capacity 494 MW 129 MW 108 MW 265 MW -- 165 MW % of 2021E renewable capacity c.40% c.10% c.10% c.25% -- c.15% % of 2025E renewable capacity c.20% c.30% c.10% c.20% c.10% c.10% 2 Government support for the renewable indust
Slide 26: Leveraging existing core capabilities
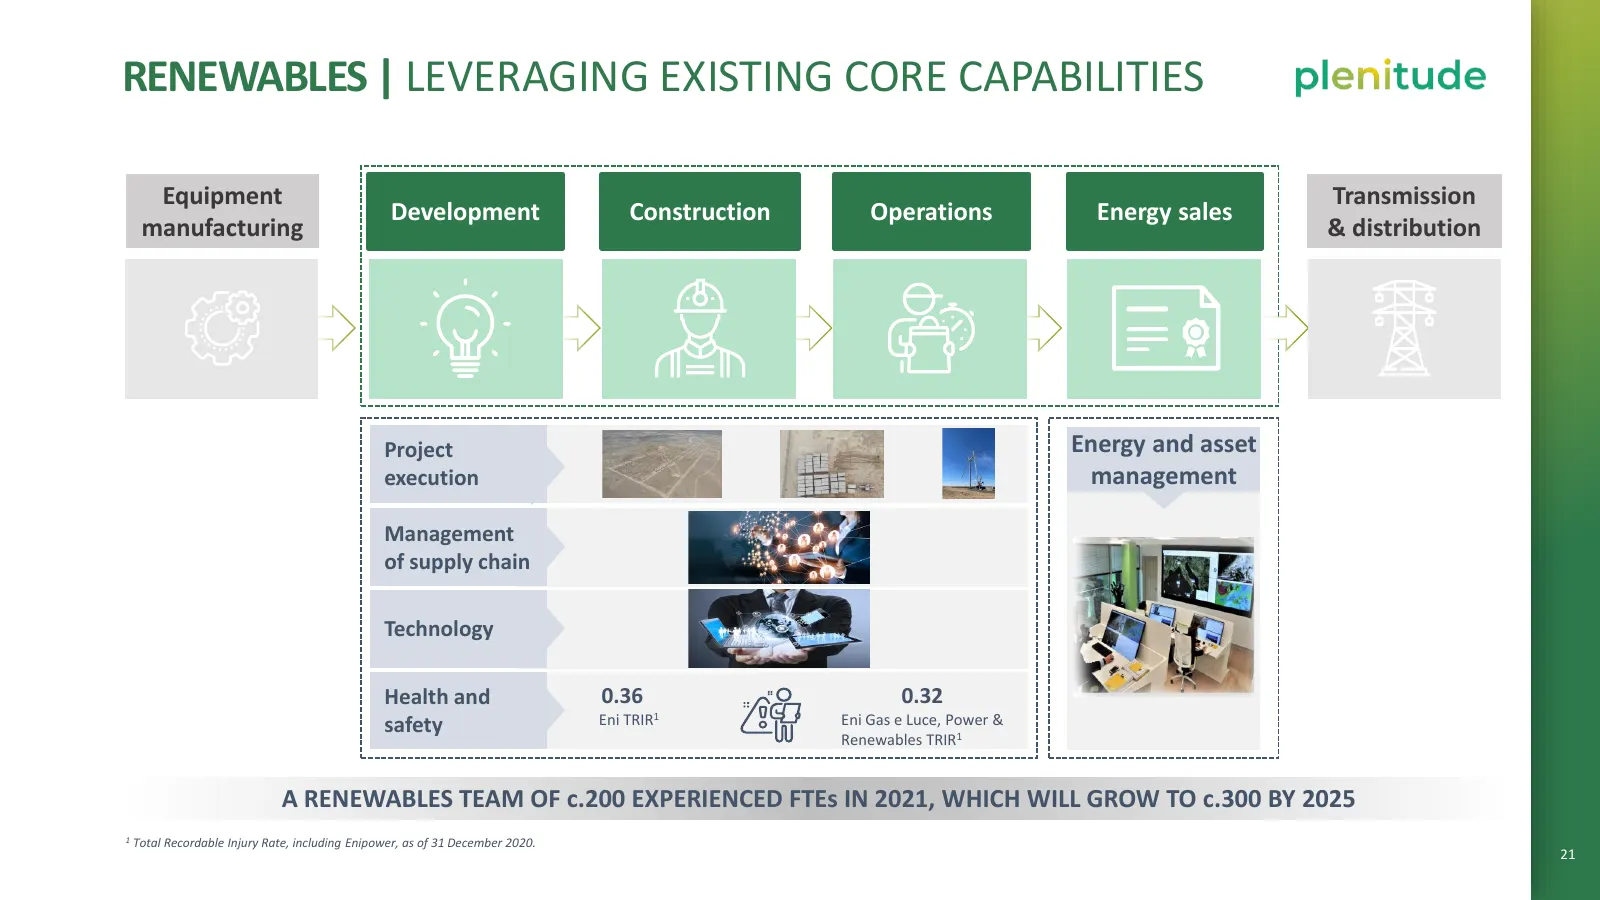
RENEWABLES | LEVERAGING EXISTING CORE CAPABILITIES Equipment Transmission Development Construction Operations Energy sales manufacturing & distribution Project Energy and asset execution management Management of supply chain Technology Health and 0.36 0.32 safety Eni TRIR1 Eni Gas e Luce, Power & Re
Slide 27: Offshore wind and Eni's capabilities
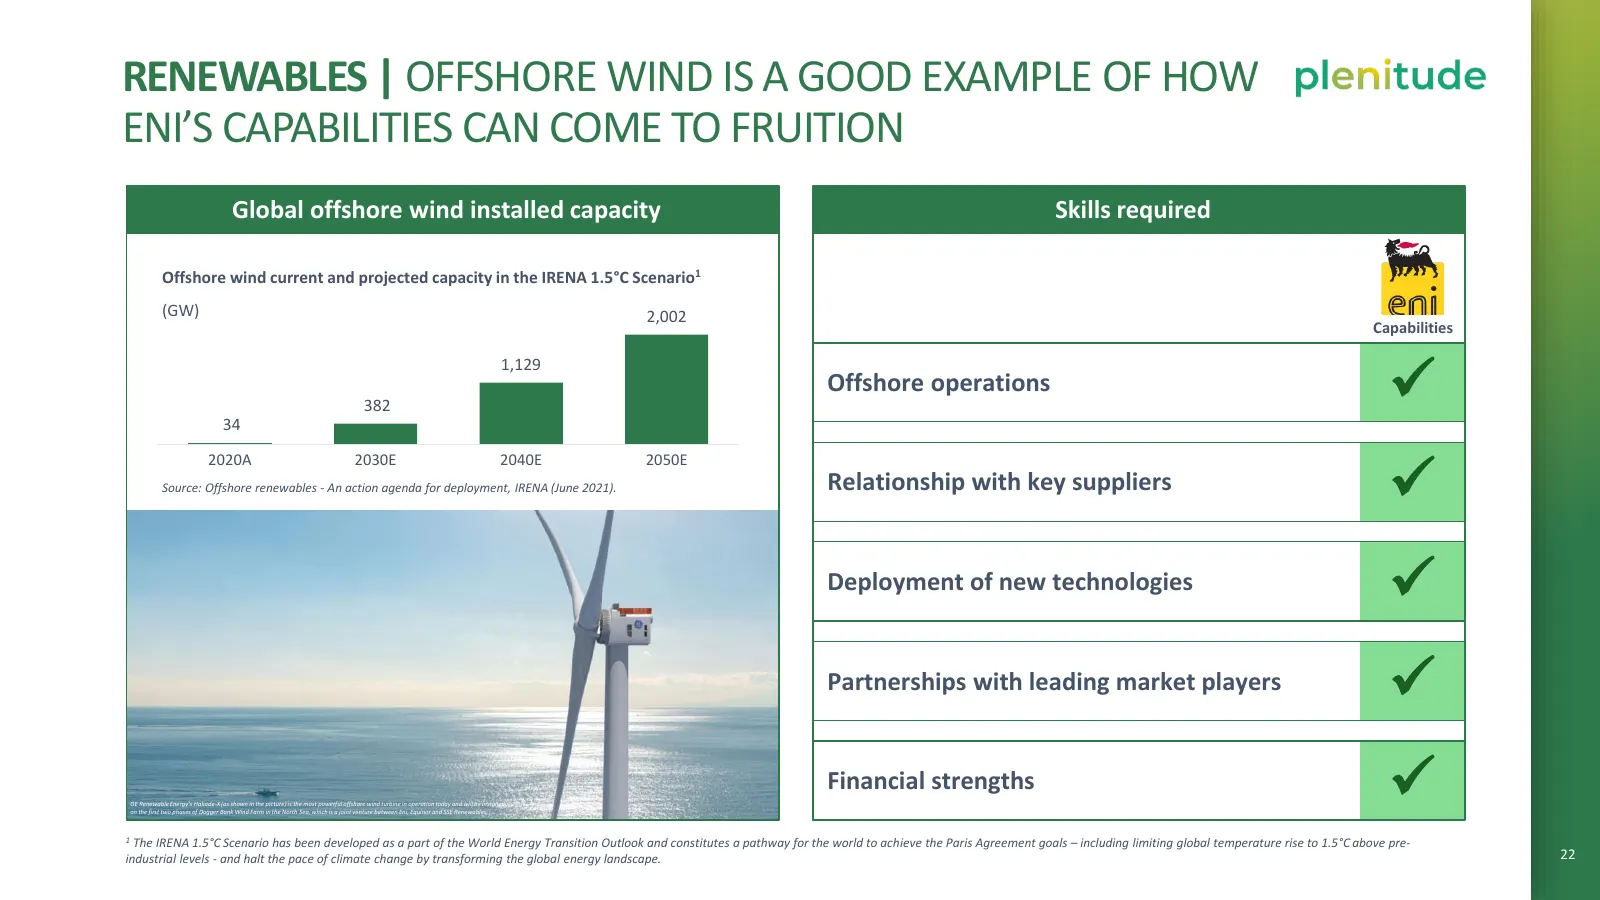
RENEWABLES | OFFSHORE WIND IS A GOOD EXAMPLE OF HOW ENI’S CAPABILITIES CAN COME TO FRUITION Global offshore wind installed capacity Skills required Offshore wind current and projected capacity in the IRENA 1.5°C Scenario1 (GW) 2,002 Capabilities ✓ 1,129 Offshore operations 382 34 ✓ 2020A 2030E 2040E
Slide 28: A highly visible pipeline
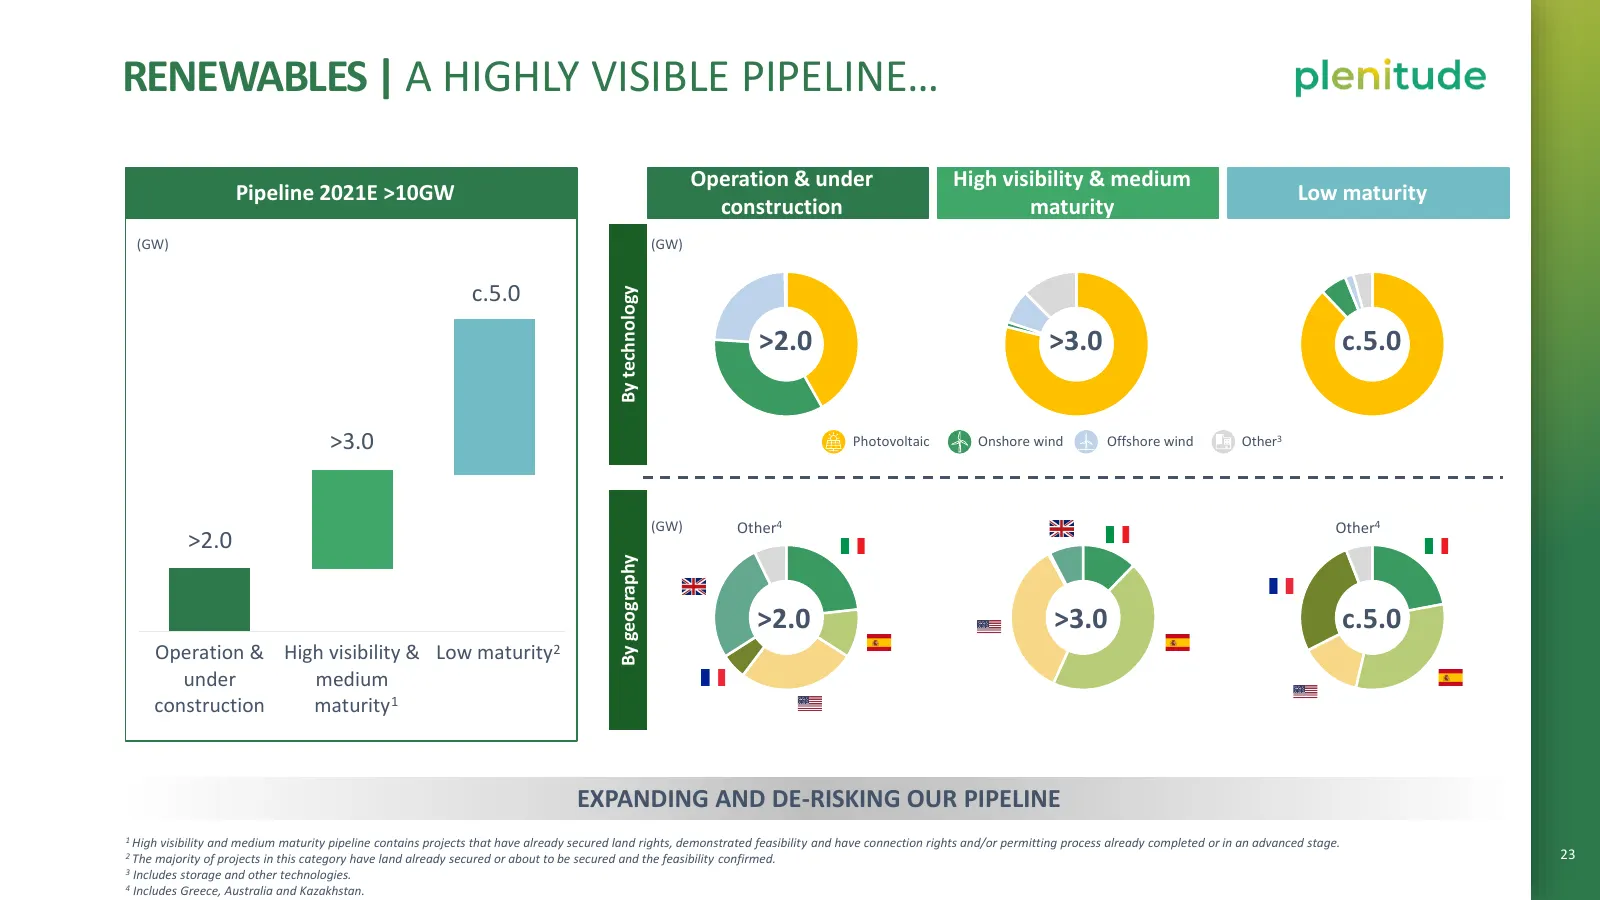
RENEWABLES | A HIGHLY VISIBLE PIPELINE… Operation & under High visibility & medium Pipeline 2021E >10GW Low maturity construction maturity (GW) (GW) c.5.0 By technology >2.0 >3.0 c.5.0 >3.0 Photovoltaic Onshore wind Offshore wind Other3 (GW) Other4 Other4 >2.0 By geography >2.0 >3.0 c.5.0 Operation
Slide 29: Scheduled capacity additions
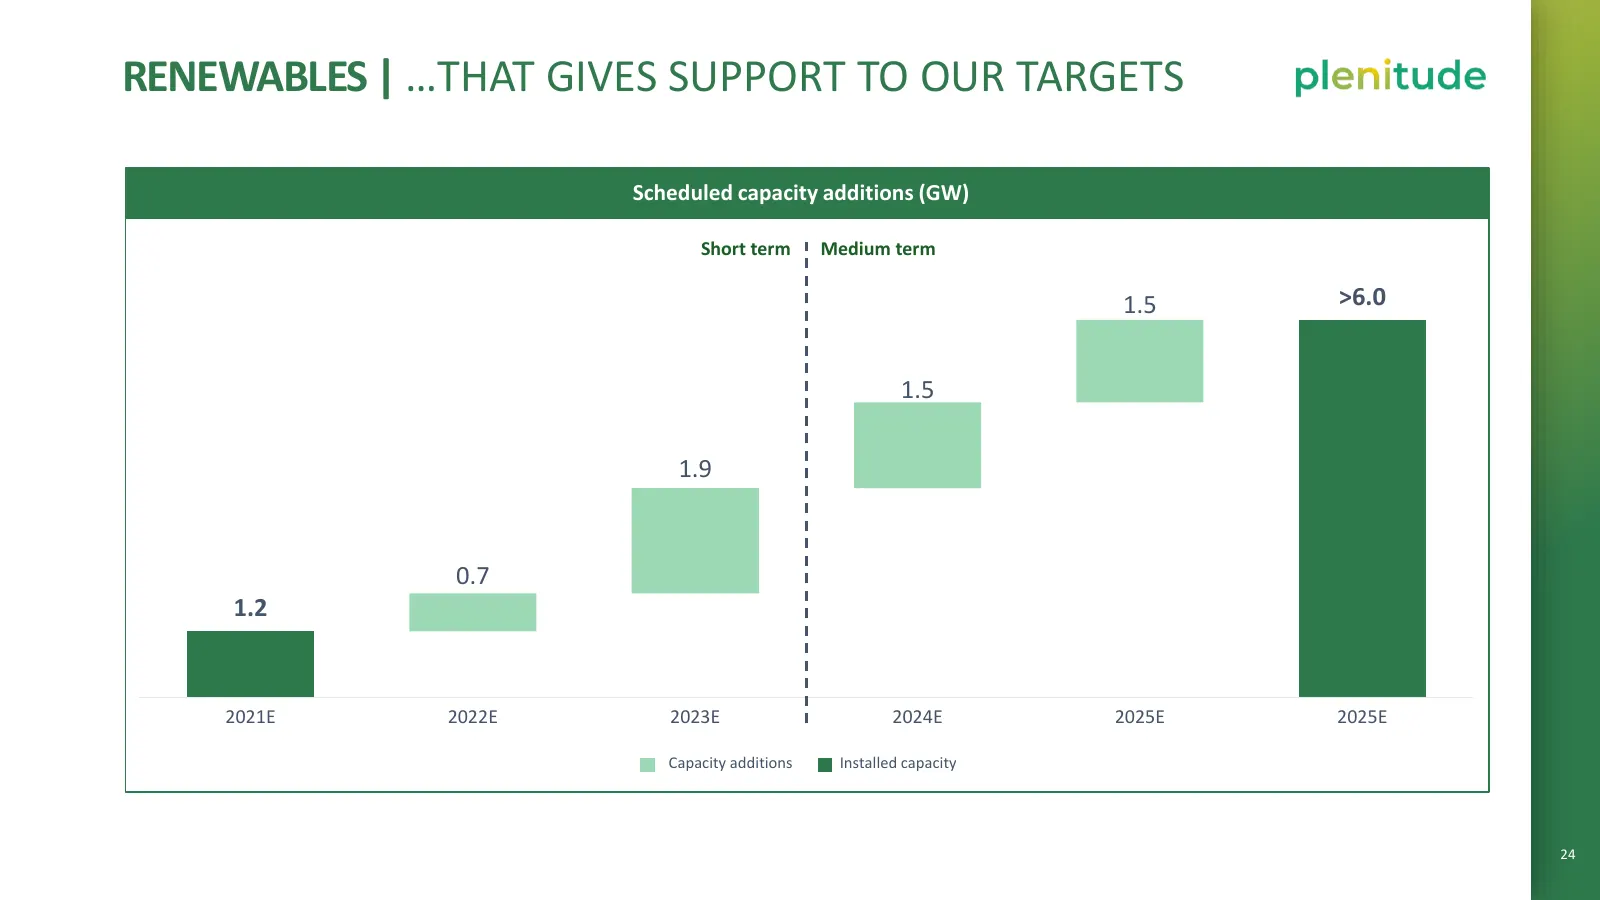
RENEWABLES | …THAT GIVES SUPPORT TO OUR TARGETS Scheduled capacity additions (GW) Short term Medium term 1.5 >6.0 1.5 1.9 0.7 1.2 2021E 2022E 2023E 2024E 2025E 2025E Capacity additions Installed capacity 24
Slide 30: Renewables key financial targets
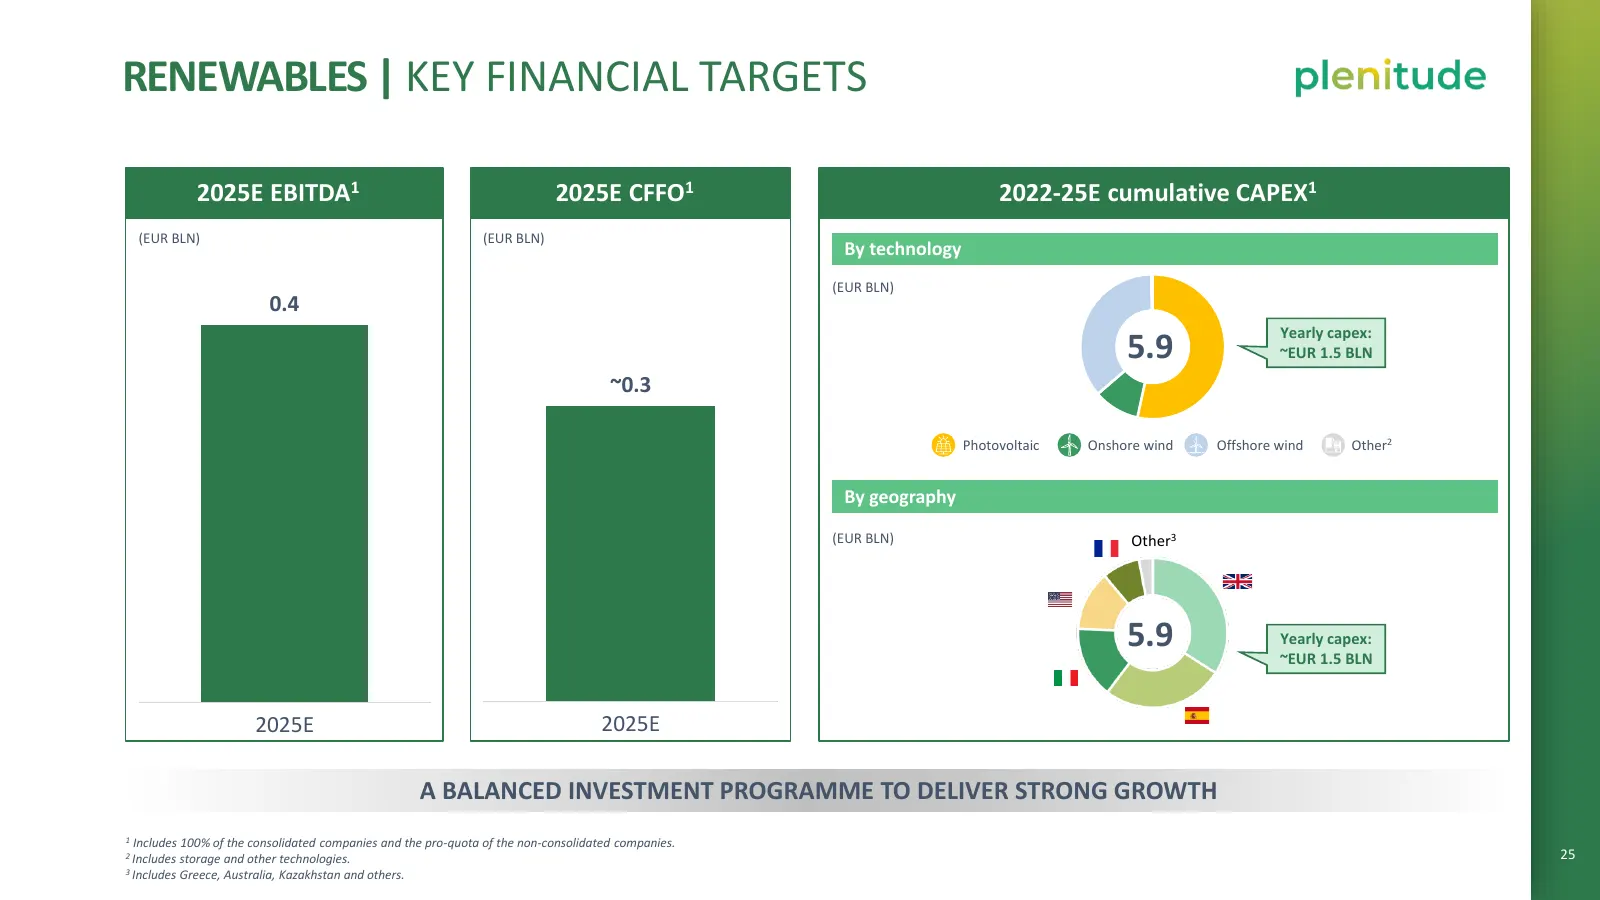
RENEWABLES | KEY FINANCIAL TARGETS 2025E EBITDA1 2025E CFFO1 2022-25E cumulative CAPEX1 (EUR BLN) (EUR BLN) By technology (EUR BLN) 0.4 Yearly capex: 5.9 ~EUR 1.5 BLN ~0.3 Photovoltaic Onshore wind Offshore wind Other2 By geography (EUR BLN) Other3 5.9 Yearly capex: ~EUR 1.5 BLN 2025E 2025E A BALANC
Slide 31: A leading retail business with multiple growth levers
PLENITUDE FITS INTO ENI’S STRATEGY AND INDUSTRY BACKDROP A UNIQUE PROPOSITION A STRONG RENEWABLES PIPELINE TO FUEL THE GROWTH A LEADING RETAIL BUSINESS WITH MULTIPLE GROWTH LEVERS AN INTEGRATED E-MOBILITY STRATEGY A SOLID FINANCIAL FRAMEWORK ANNEX 26
Slide 32: Retail accomplishments to date
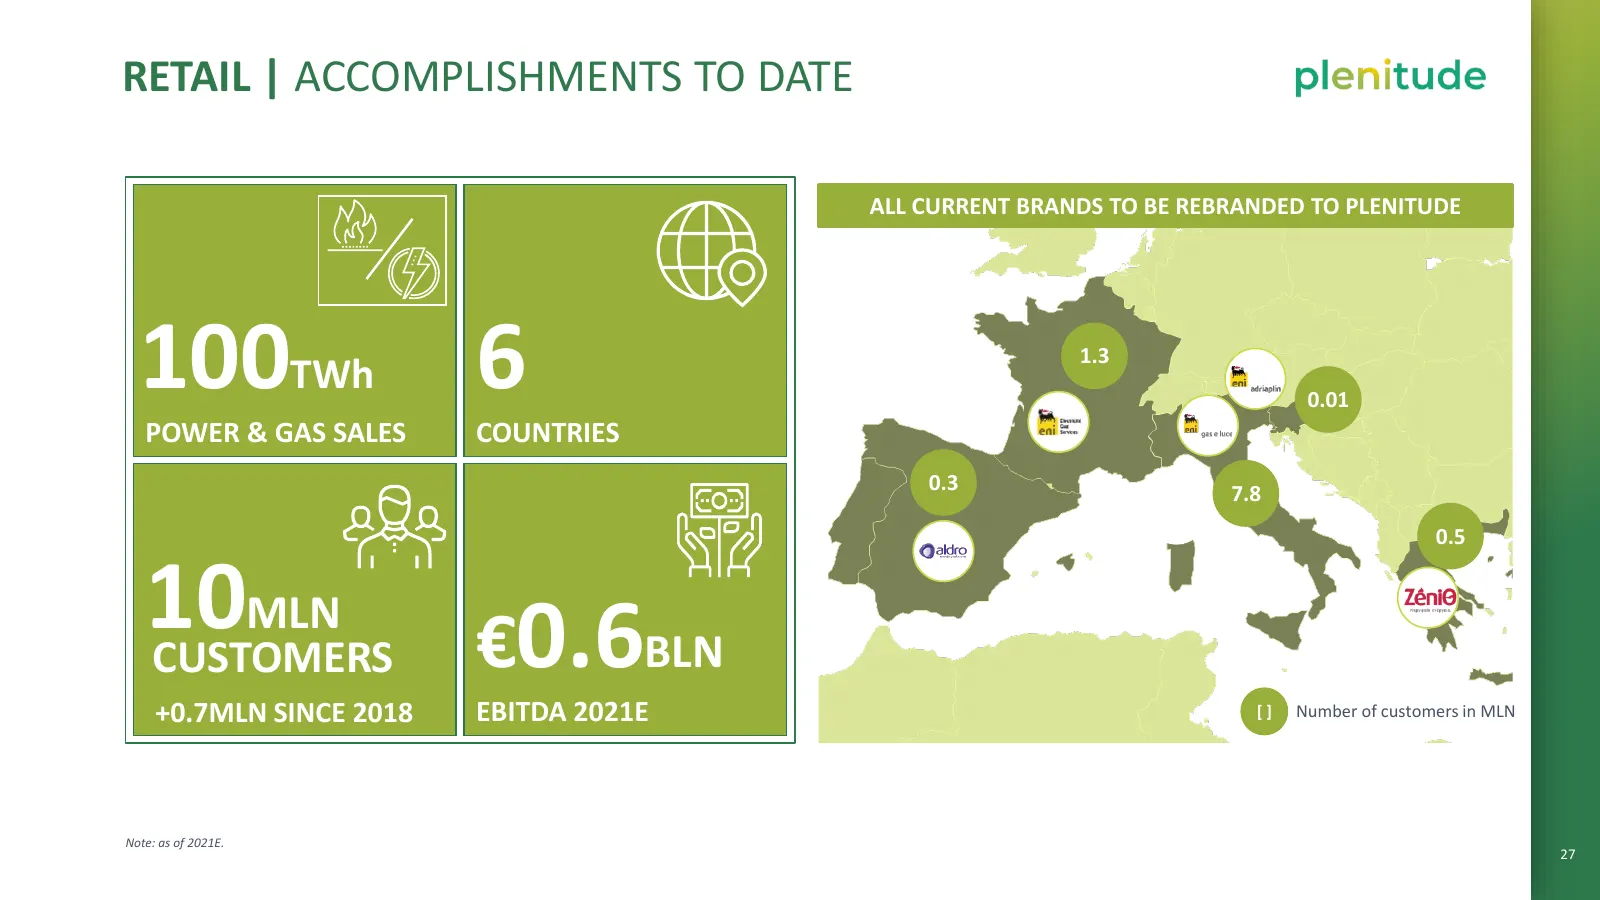
RETAIL | ACCOMPLISHMENTS TO DATE ALL CURRENT BRANDS TO BE REBRANDED TO PLENITUDE 100TWh 6 1.3 0.01 POWER & GAS SALES COUNTRIES 0.3 7.8 0.5 10 MLN CUSTOMERS €0.6BLN +0.7MLN SINCE 2018 EBITDA 2021E [] Number of customers in MLN Note: as of 2021E. 27
Slide 33: A complete and evolving suite of products
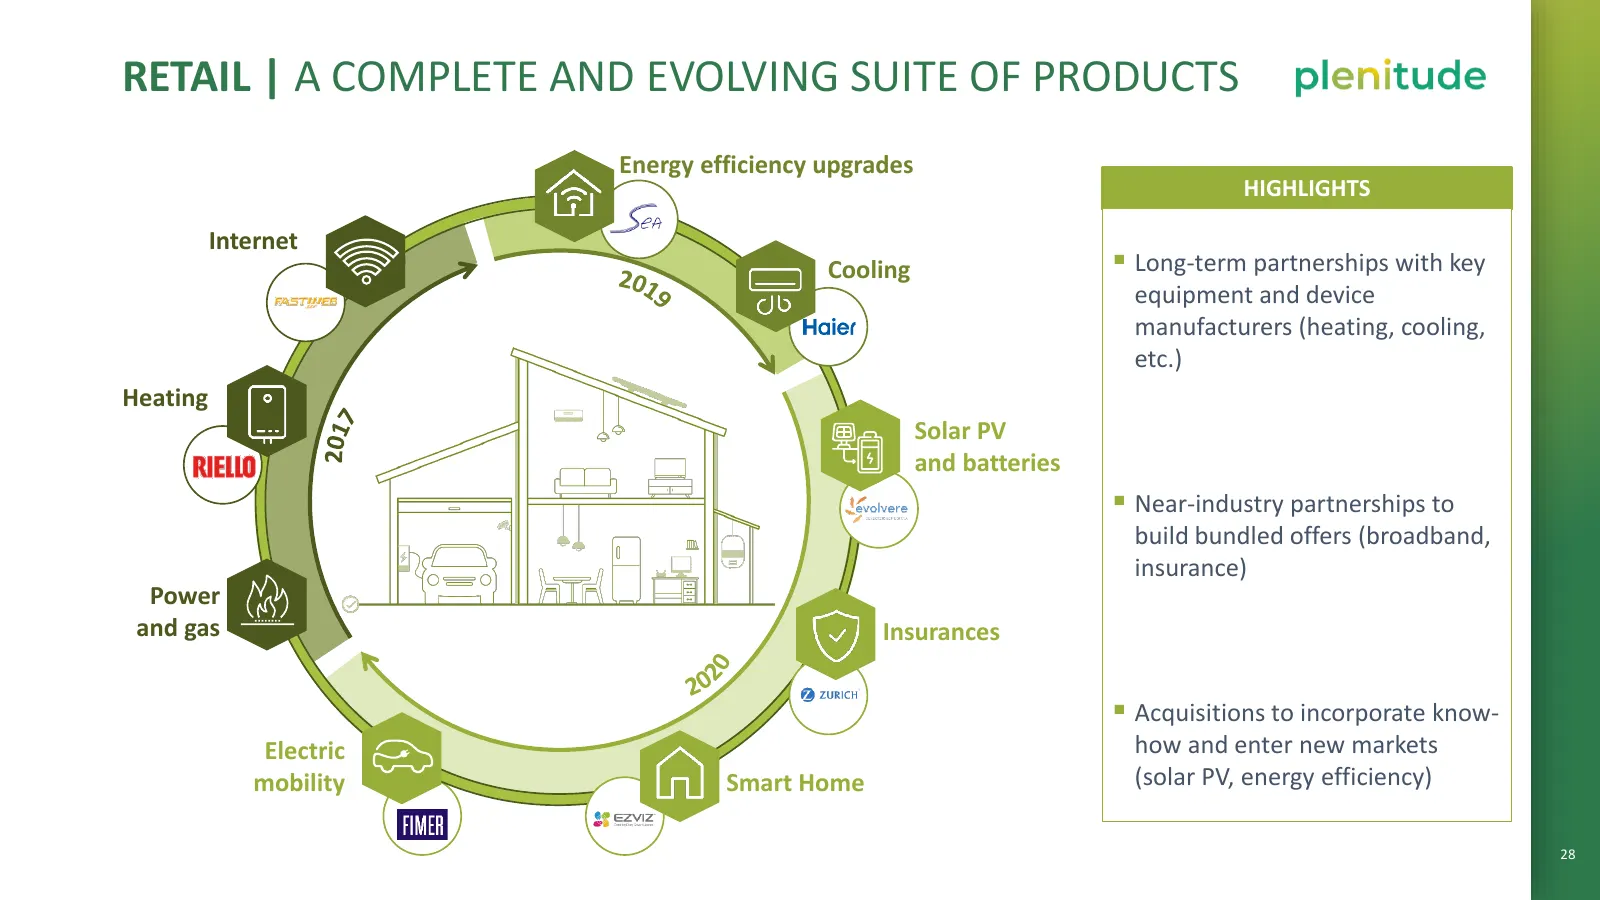
RETAIL | A COMPLETE AND EVOLVING SUITE OF PRODUCTS Energy efficiency upgrades HIGHLIGHTS Internet Cooling ▪ Long-term partnerships with key equipment and device manufacturers (heating, cooling, etc.) Heating Solar PV and batteries ▪ Near-industry partnerships to build bundled offers (broadband, insu
Slide 34: Retail multiple growth levers
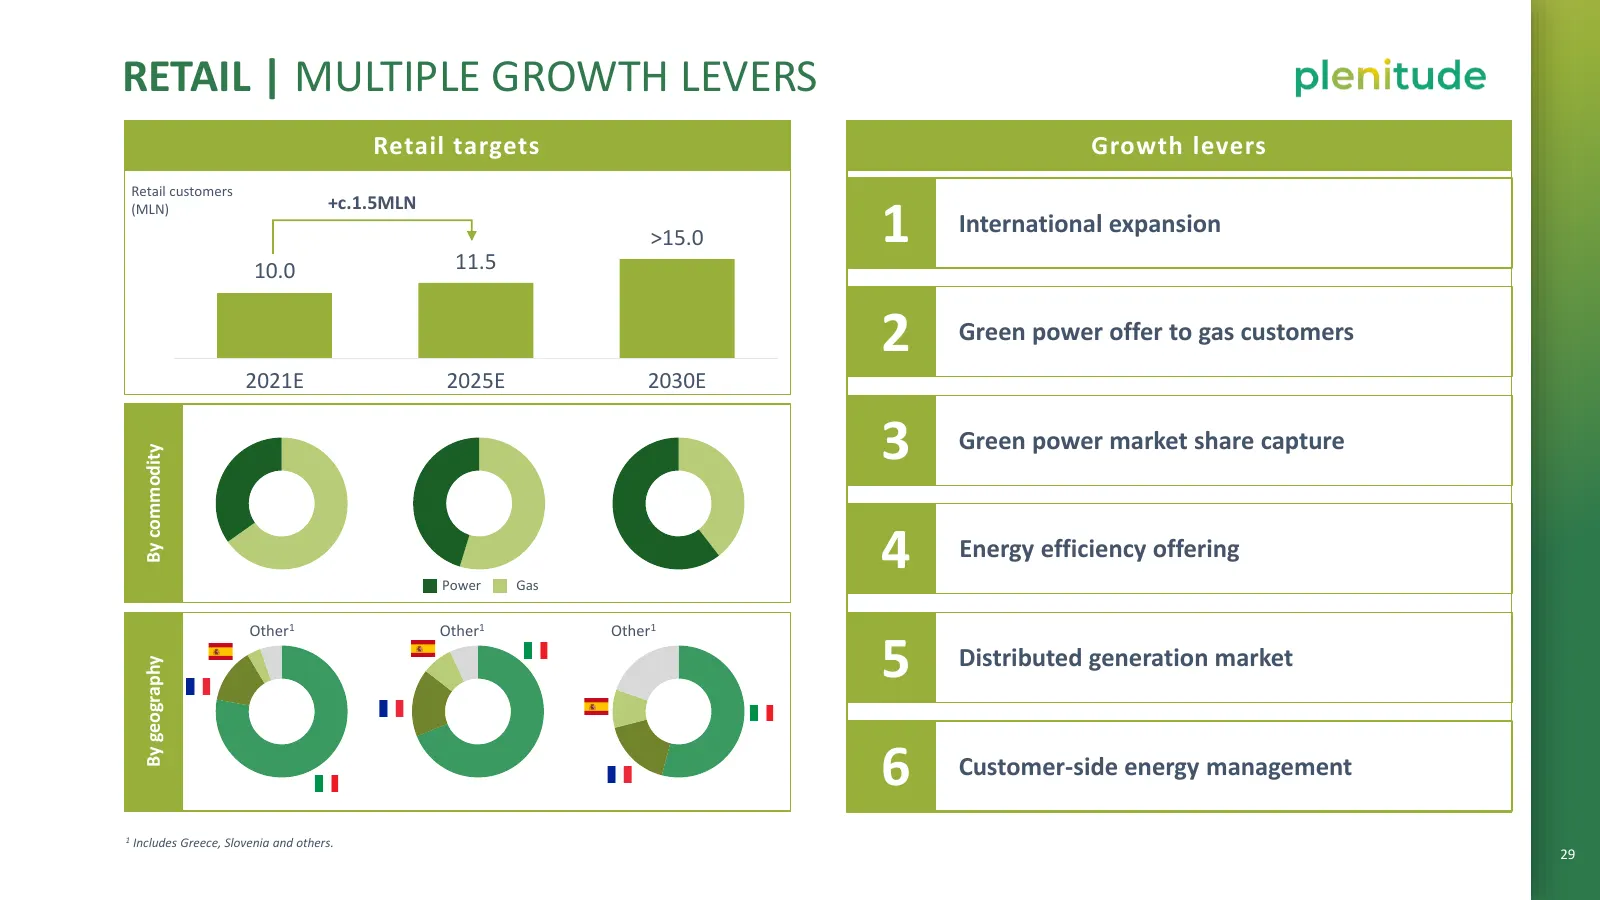
e RETAIL | MULTIPLE GROWTH LEVERS Retail targets Growth levers Retail customers +c.1.5MLN (MLN) xx 11.5 >15.0 1 International expansion 10.0 2 Green power offer to gas customers 2021E 2025E 2030E 3 Green power market share capture By commodity Power Gas 4 Energy efficiency offering Other1 Other1 Oth
Slide 35: Retail multiple growth levers
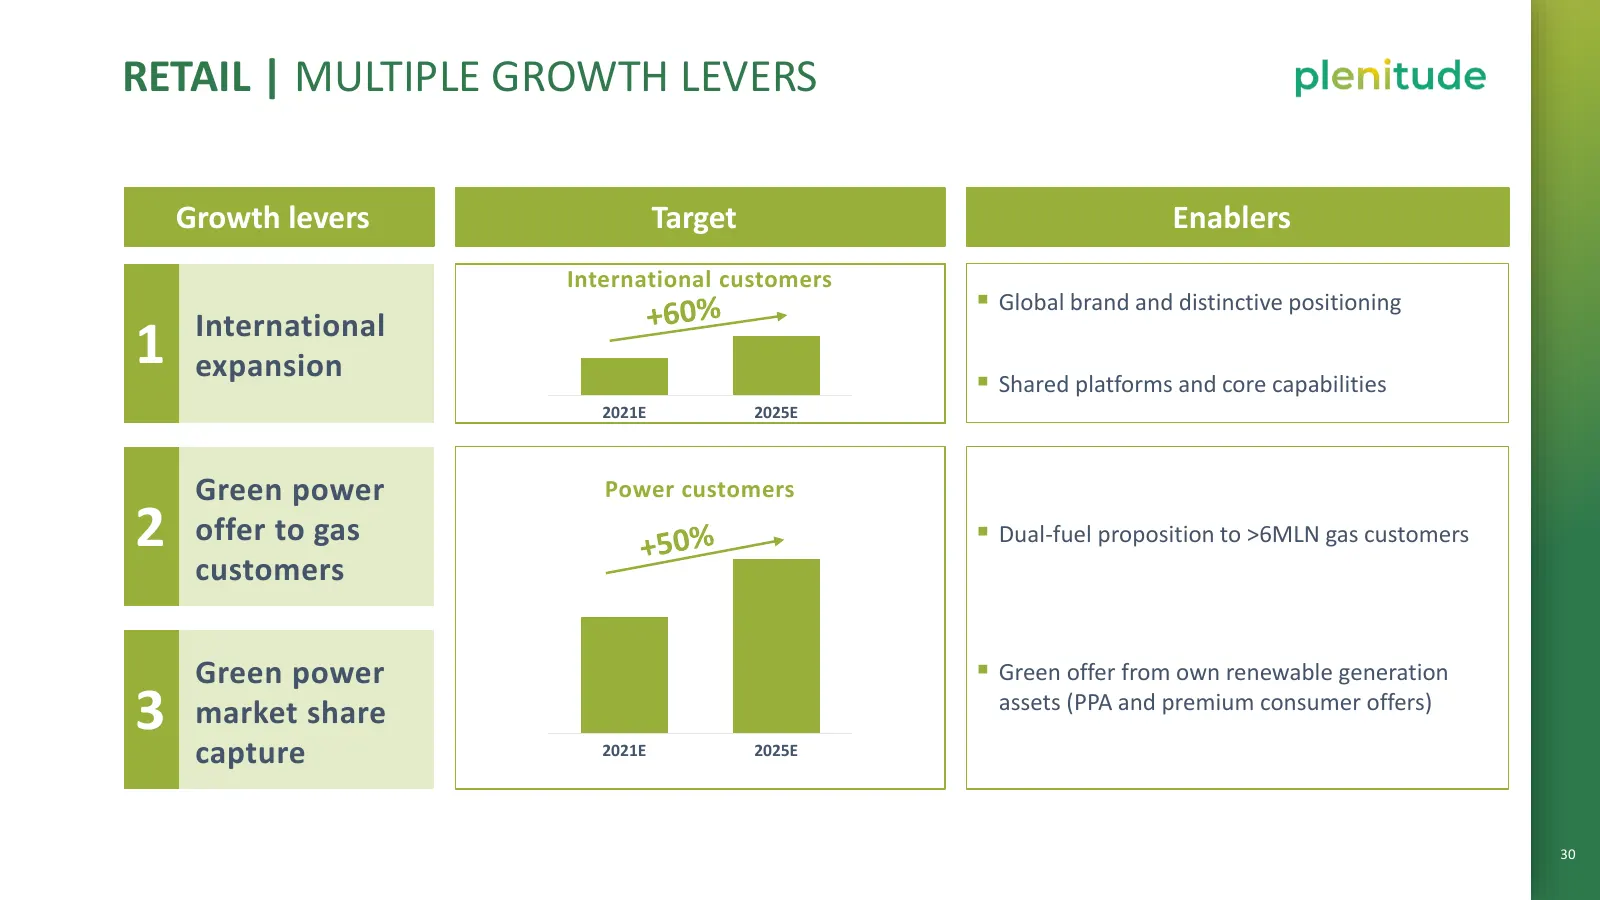
RETAIL | MULTIPLE GROWTH LEVERS Growth levers Target Enablers International customers ▪ Global brand and distinctive positioning International 1 expansion ▪ Shared platforms and core capabilities 2021E 2025E Green power Power customers 2 offer to gas ▪ Dual-fuel proposition to >6MLN gas customers cu
Slide 36: Retail multiple growth levers
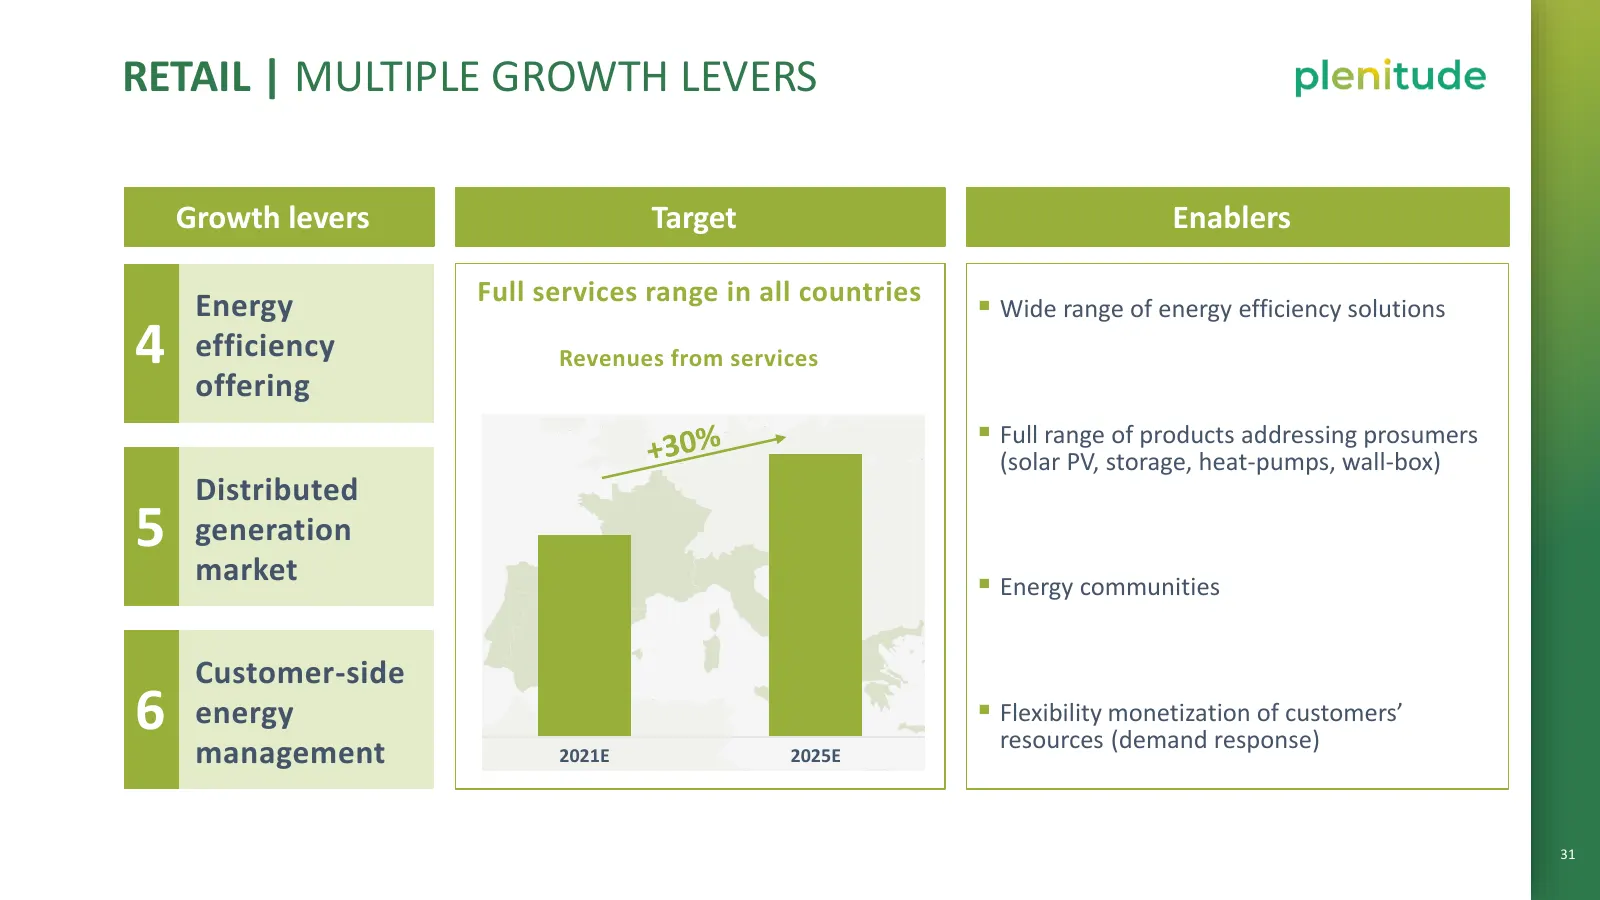
RETAIL | MULTIPLE GROWTH LEVERS Growth levers Target Enablers Full services range in all countries Energy ▪ Wide range of energy efficiency solutions 4 efficiency Revenues from services offering ▪ Full range of products addressing prosumers (solar PV, storage, heat-pumps, wall-box) Distributed 5 gen
Slide 37: Retail key financial targets
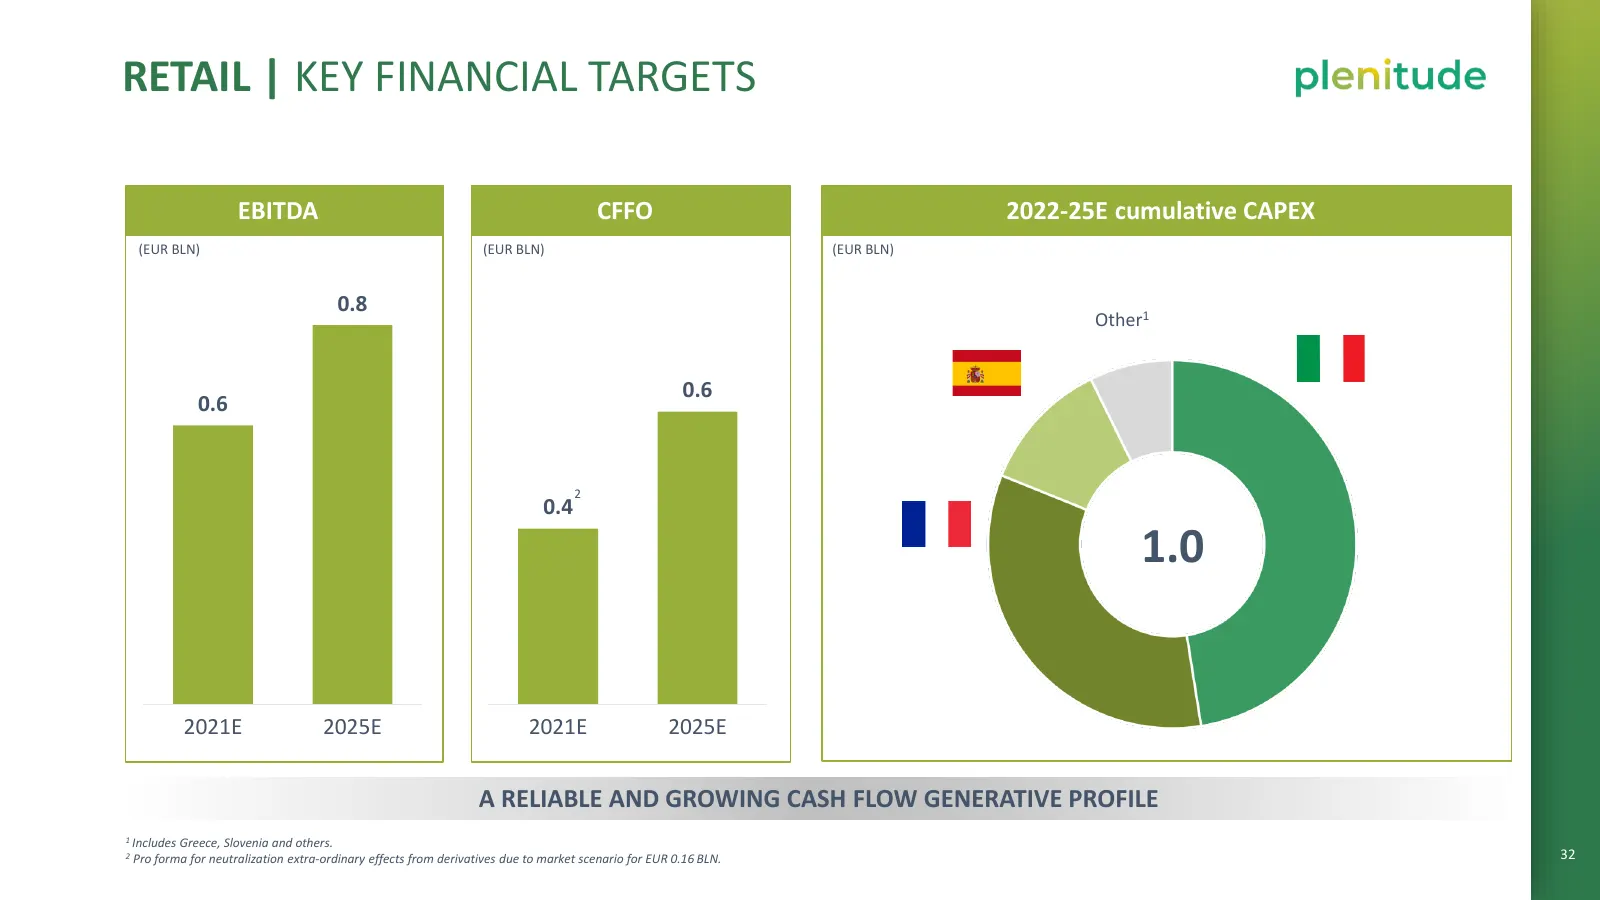
RETAIL | KEY FINANCIAL TARGETS EBITDA CFFO 2022-25E cumulative CAPEX (EUR BLN) (EUR BLN) (EUR BLN) 0.8 Other1 0.6 0.6 2 0.4 1.0 2021E 2025E 2021E 2025E A RELIABLE AND GROWING CASH FLOW GENERATIVE PROFILE 1 Includes Greece, Slovenia and others. 2 Pro forma for neutralization extra-ordinary effects fr
Slide 38: An integrated e-mobility strategy
PLENITUDE FITS INTO ENI’S STRATEGY AND INDUSTRY BACKDROP A UNIQUE PROPOSITION A STRONG RENEWABLES PIPELINE TO FUEL THE GROWTH A LEADING RETAIL BUSINESS WITH MULTIPLE GROWTH LEVERS AN INTEGRATED E-MOBILITY STRATEGY A SOLID FINANCIAL FRAMEWORK ANNEX 33
Slide 39: E-mobility snapshot
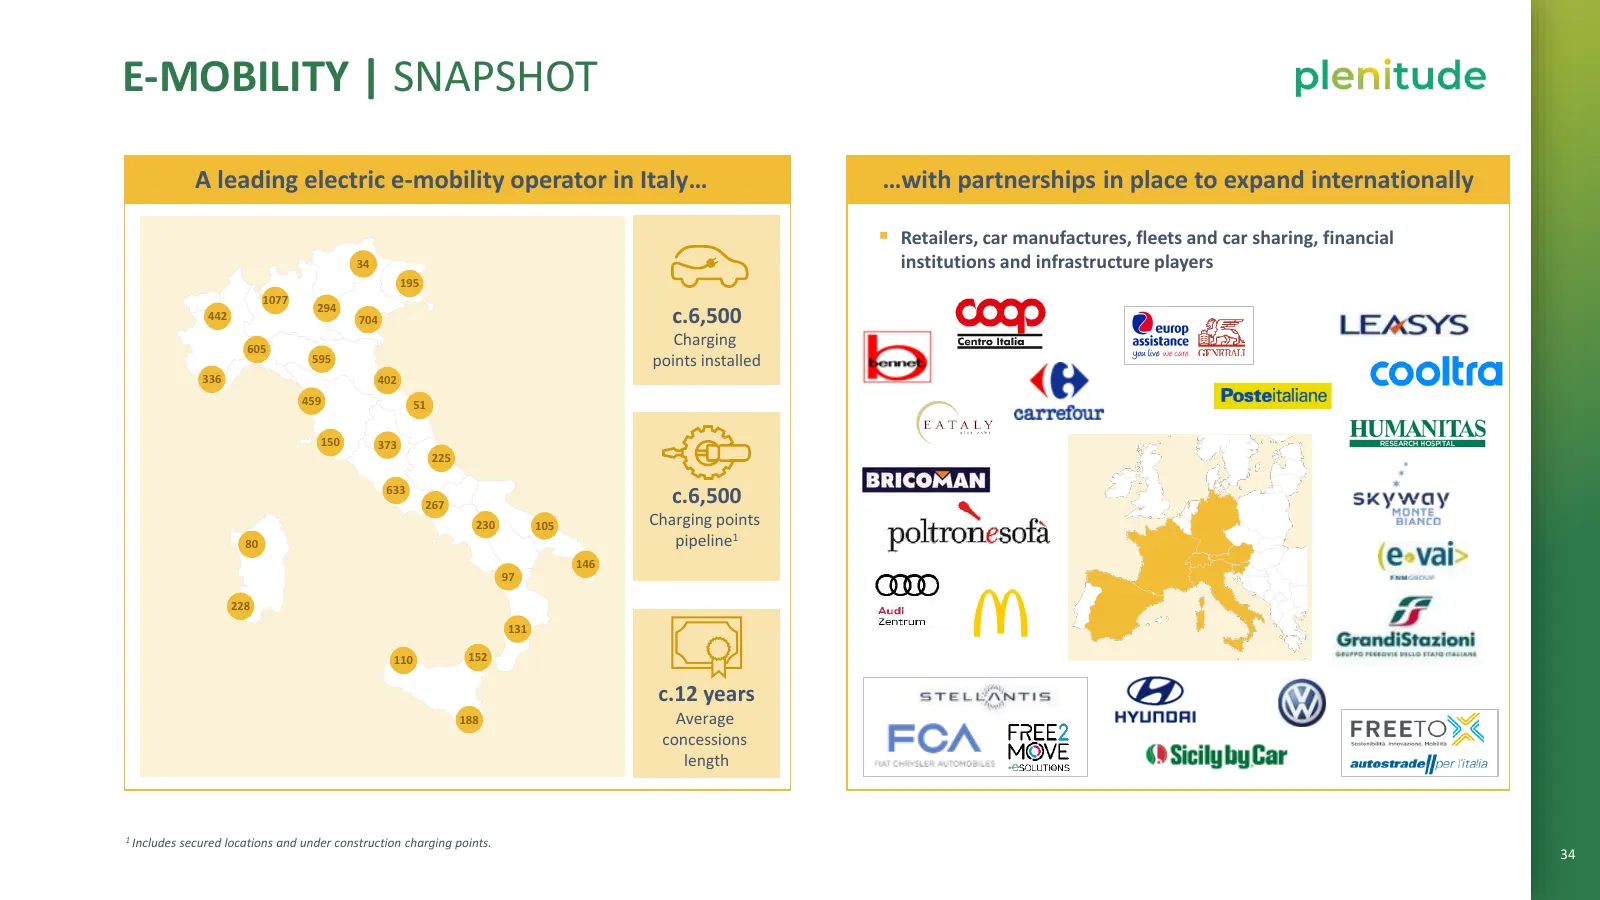
E-MOBILITY | SNAPSHOT A leading electric e-mobility operator in Italy… …with partnerships in place to expand internationally ▪ Retailers, car manufactures, fleets and car sharing, financial 34 institutions and infrastructure players 195 1077 294 442 704 c.6,500 605 Charging 595 points installed 336
Slide 40: Margin across the value chain through integrated business model
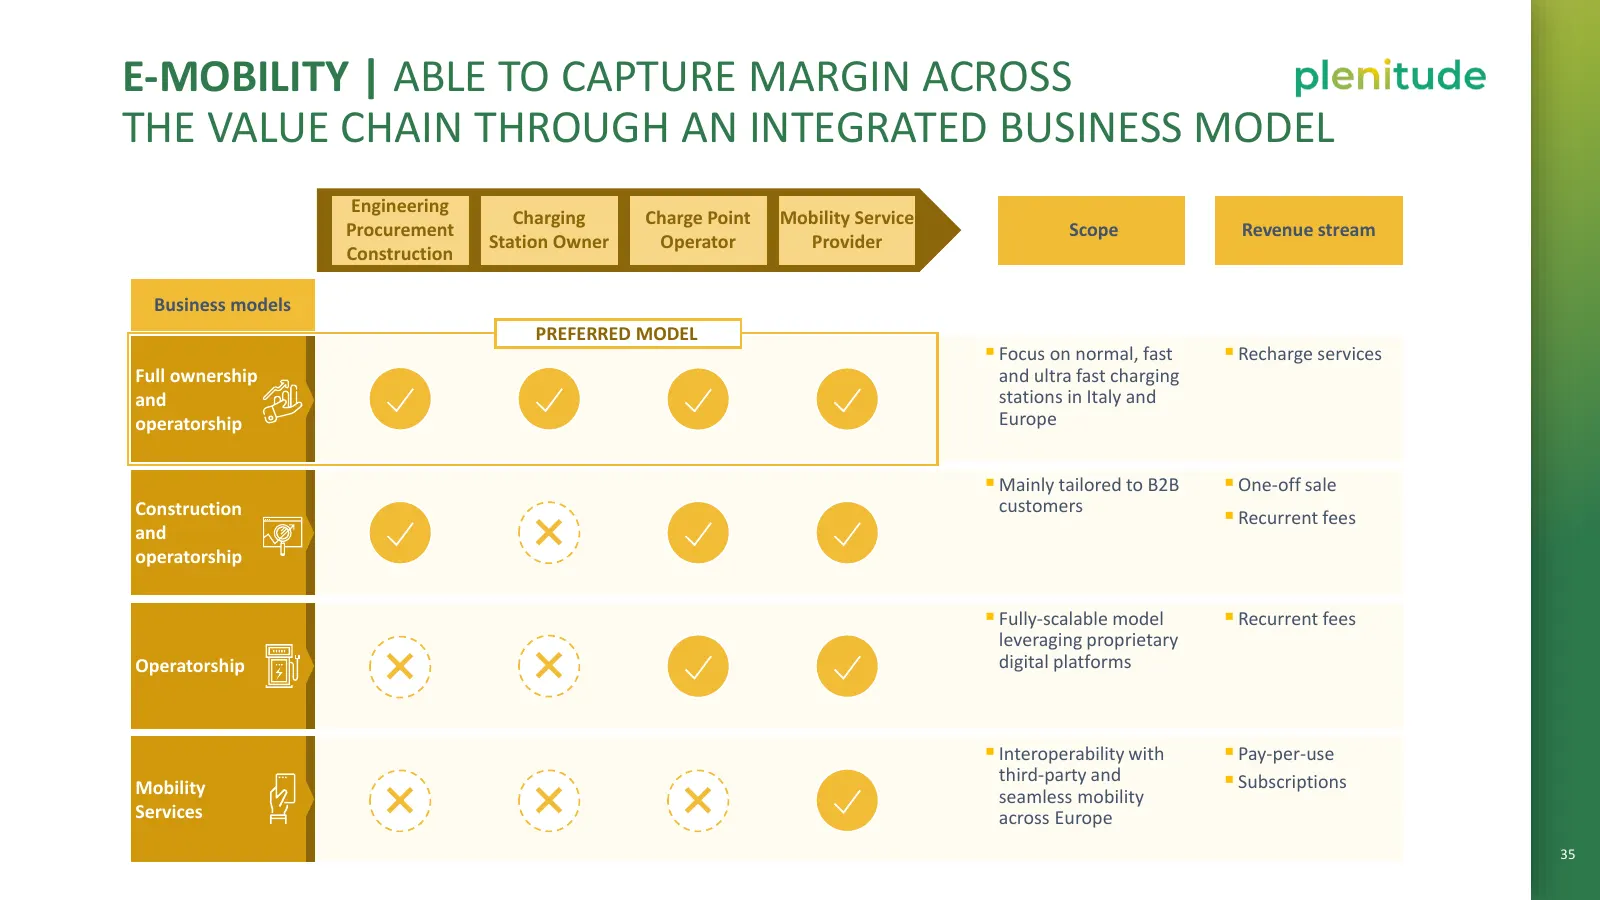
E-MOBILITY | ABLE TO CAPTURE MARGIN ACROSS THE VALUE CHAIN THROUGH AN INTEGRATED BUSINESS MODEL Engineering Charging Charge Point Mobility Service Procurement Scope Revenue stream Station Owner Operator Provider Construction Business models PREFERRED MODEL ▪ Focus on normal, fast ▪ Recharge services
Slide 41: Synergic business with retail and renewables
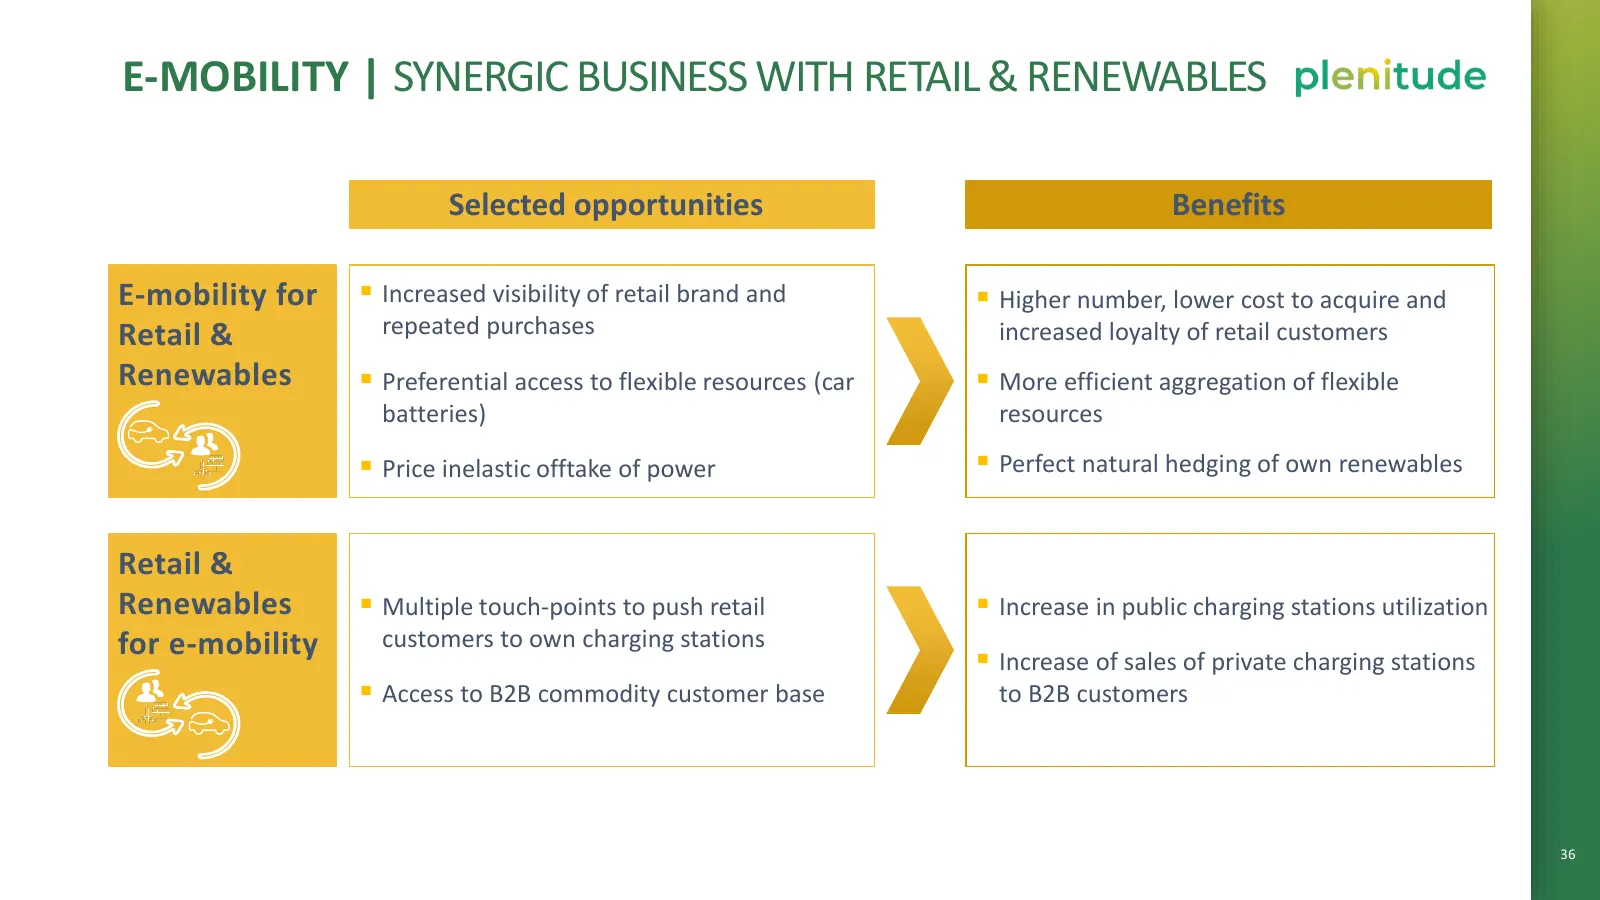
E-MOBILITY | SYNERGIC BUSINESS WITH RETAIL & RENEWABLES Selected opportunities Benefits E-mobility for ▪ Increased visibility of retail brand and ▪ Higher number, lower cost to acquire and Retail & repeated purchases increased loyalty of retail customers Renewables ▪ Preferential access to flexible
Slide 42: A high growth revenue stream
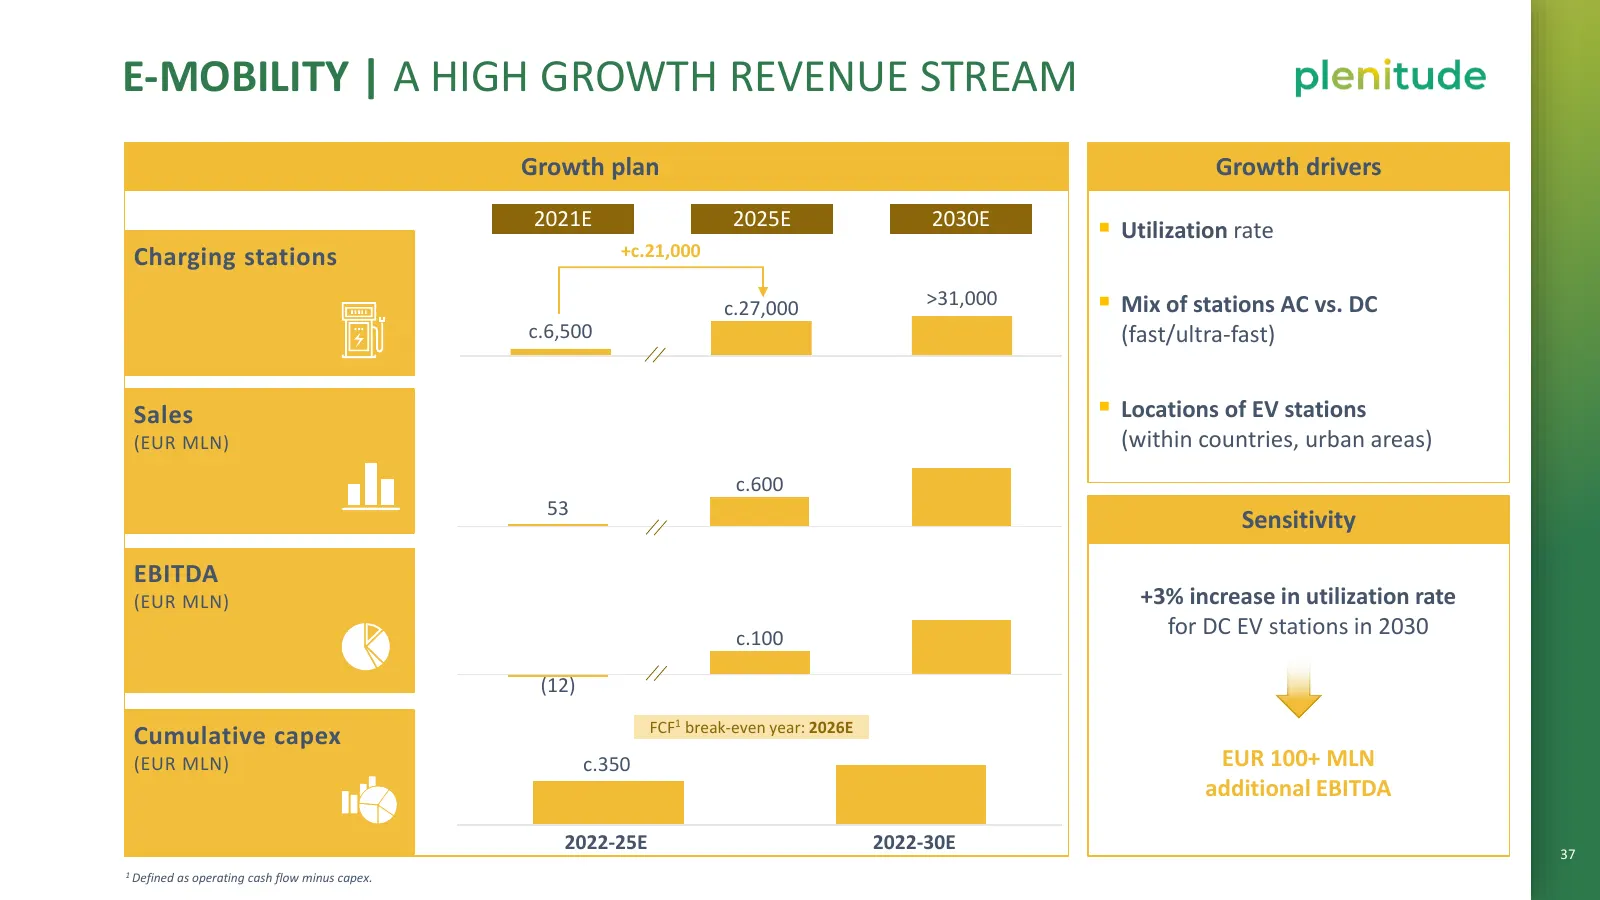
E-MOBILITY | A HIGH GROWTH REVENUE STREAM Growth plan Growth drivers 2021E 2025E 2030E ▪ Utilization rate Charging stations +c.21,000 c.27,000 >31,000 ▪ Mix of stations AC vs. DC c.6,500 (fast/ultra-fast) Sales ▪ Locations of EV stations (EUR MLN) (within countries, urban areas) c.600 53 Sensitivity
Slide 43: A solid financial framework
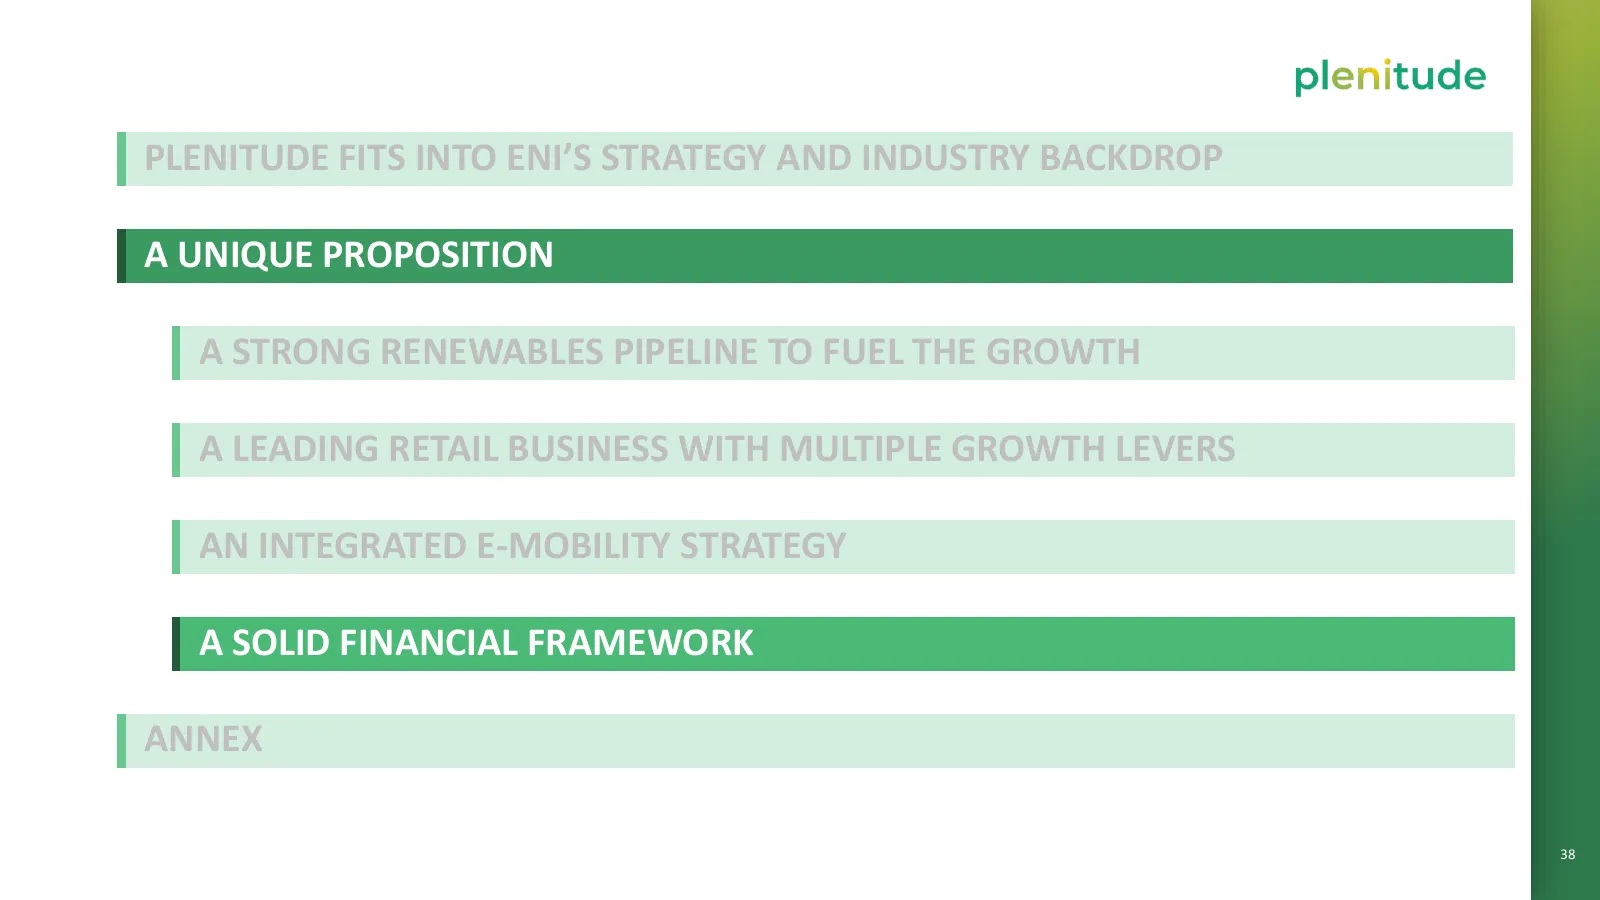
PLENITUDE FITS INTO ENI’S STRATEGY AND INDUSTRY BACKDROP A UNIQUE PROPOSITION A STRONG RENEWABLES PIPELINE TO FUEL THE GROWTH A LEADING RETAIL BUSINESS WITH MULTIPLE GROWTH LEVERS AN INTEGRATED E-MOBILITY STRATEGY A SOLID FINANCIAL FRAMEWORK ANNEX 38
Slide 44: A solid financial framework
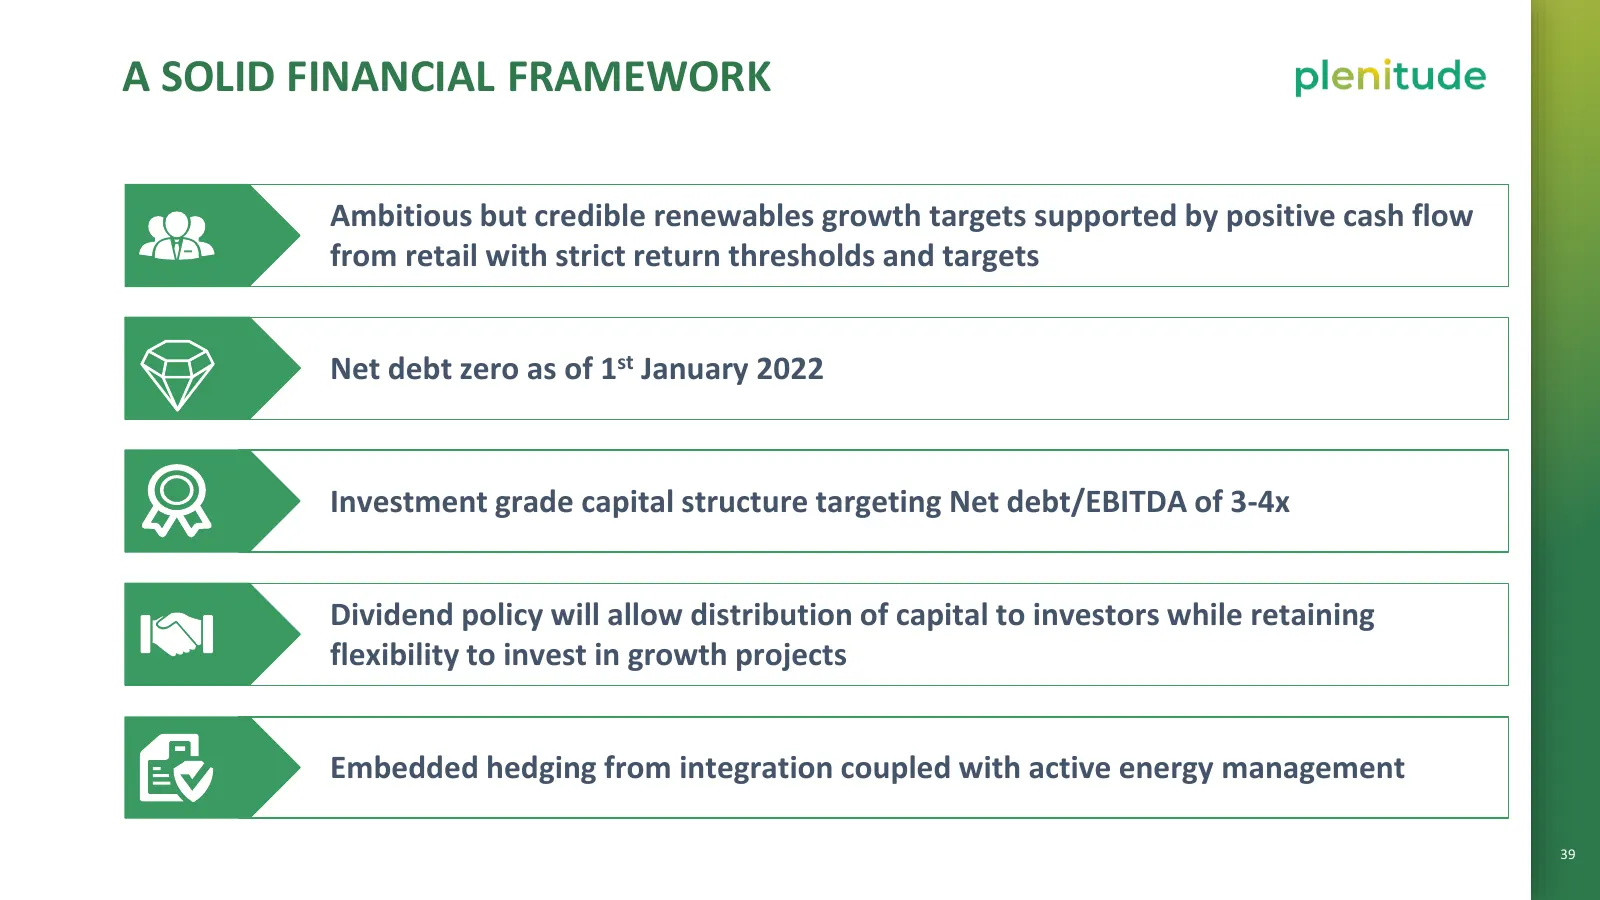
A SOLID FINANCIAL FRAMEWORK Ambitious but credible renewables growth targets supported by positive cash flow from retail with strict return thresholds and targets Net debt zero as of 1st January 2022 Investment grade capital structure targeting Net debt/EBITDA of 3-4x Dividend policy will allow dist
Slide 45: Ambitious but credible renewables growth targets
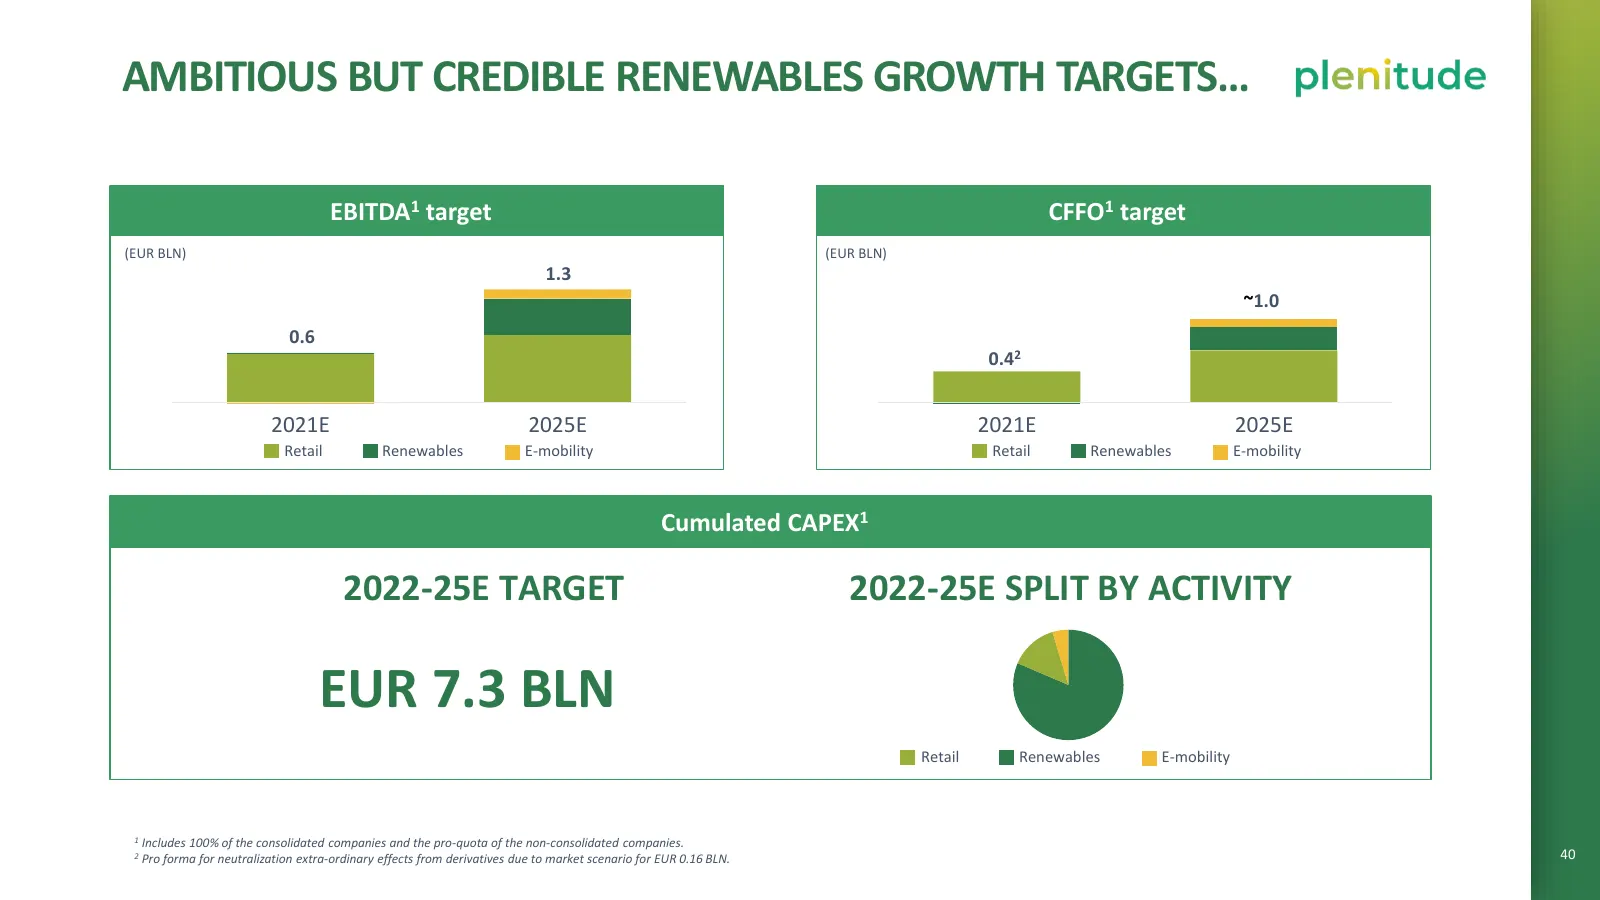
AMBITIOUS BUT CREDIBLE RENEWABLES GROWTH TARGETS… EBITDA1 target CFFO1 target (EUR BLN) (EUR BLN) 1.3 ~1.0 0.6 0.42 2021E 2025E 2021E 2025E Retail Renewables E-mobility Retail Renewables E-mobility Cumulated CAPEX1 2022-25E TARGET 2022-25E SPLIT BY ACTIVITY EUR 7.3 BLN Retail Renewables E-mobility 1
Slide 46: Strict return thresholds and targets
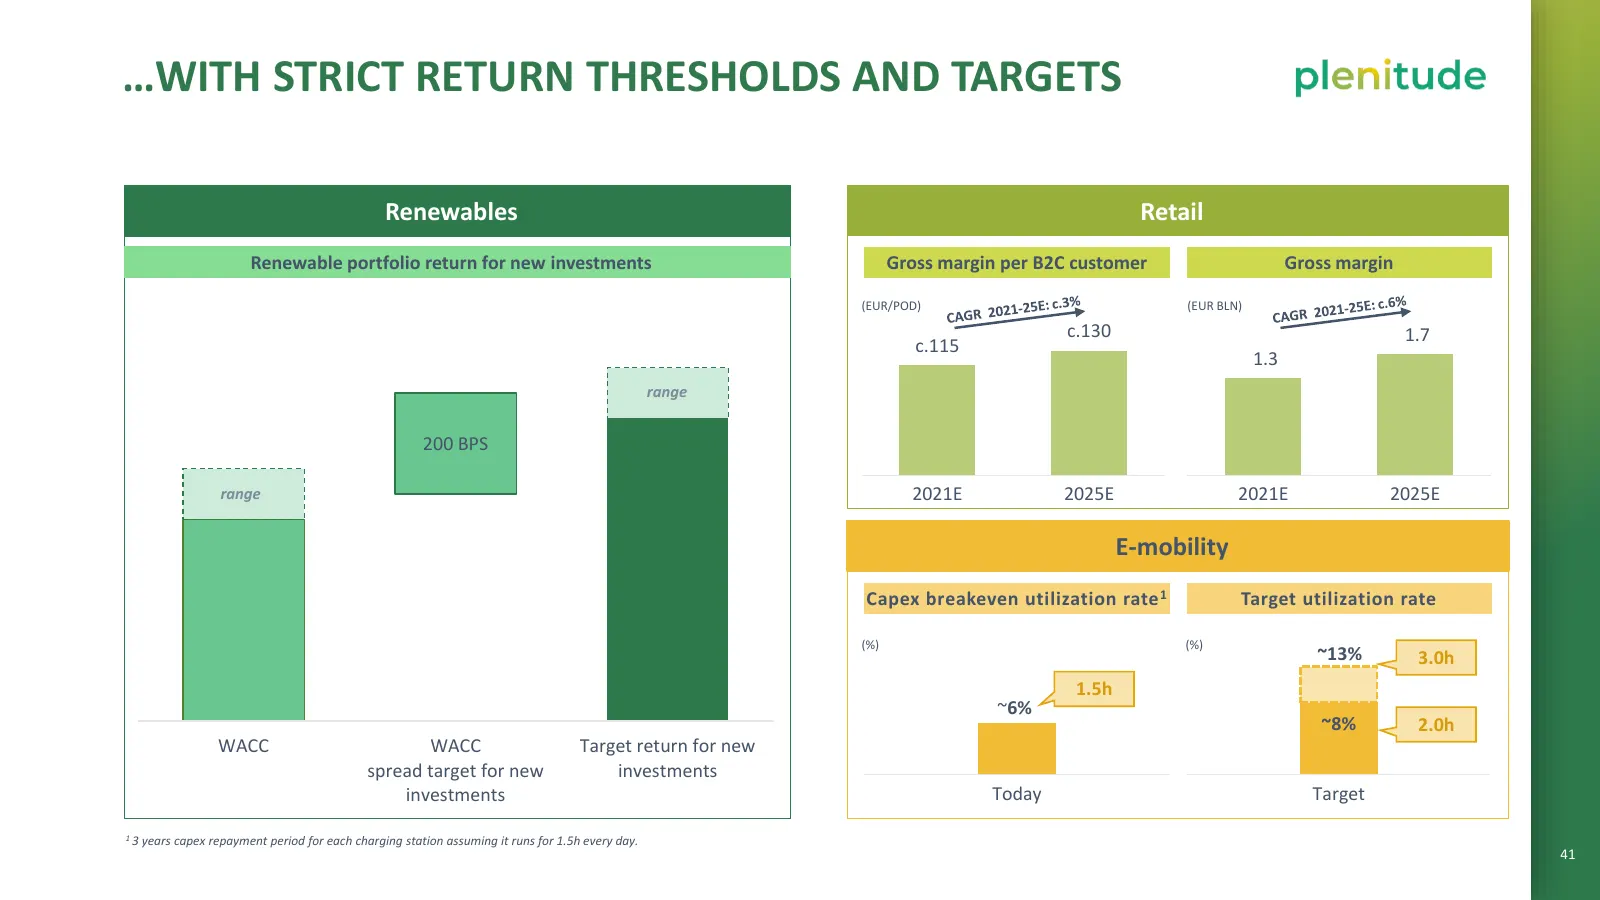
…WITH STRICT RETURN THRESHOLDS AND TARGETS Renewables Retail Renewable portfolio return for new investments Gross margin per B2C customer Gross margin (EUR/POD) (EUR BLN) c.130 1.7 c.115 1.3 range 200 BPS range 2021E 2025E 2021E 2025E E-mobility Capex breakeven utilization rate 1 Target utilization
Slide 47: Plenitude: a unique proposition
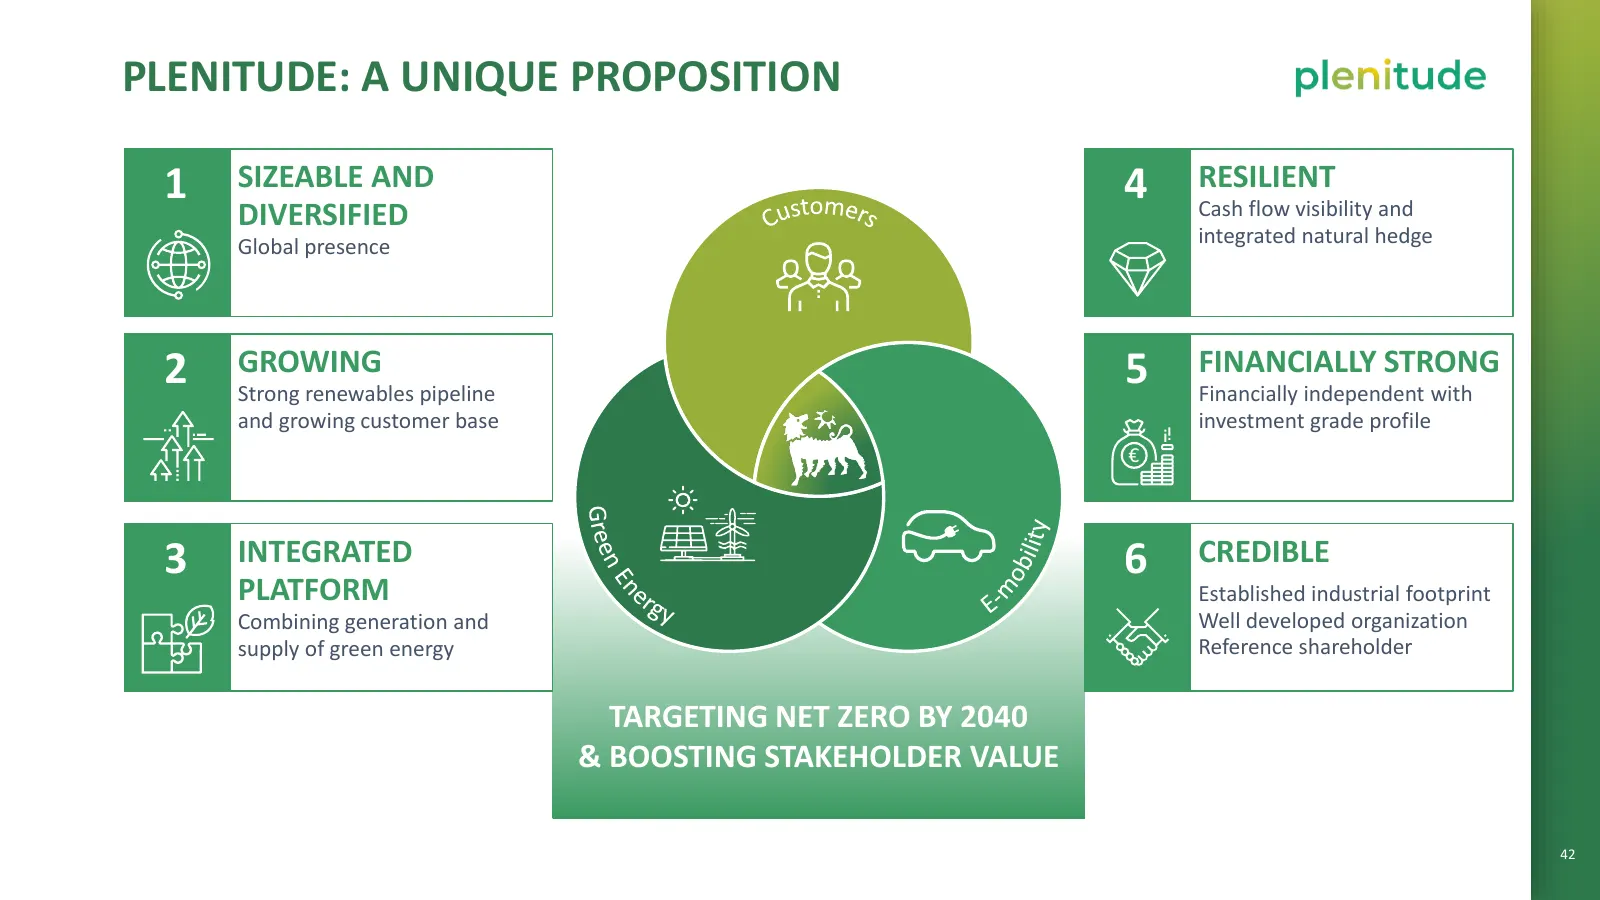
PLENITUDE: A UNIQUE PROPOSITION 1 SIZEABLE AND 4 RESILIENT DIVERSIFIED Cash flow visibility and Global presence integrated natural hedge 2 GROWING 5 FINANCIALLY STRONG Strong renewables pipeline Financially independent with and growing customer base investment grade profile € 3 INTEGRATED 6 CREDIBLE
Slide 48: Annex
PLENITUDE FITS INTO ENI’S STRATEGY AND INDUSTRY BACKDROP A UNIQUE PROPOSITION A STRONG RENEWABLES PIPELINE TO FUEL THE GROWTH A LEADING RETAIL BUSINESS WITH MULTIPLE GROWTH LEVERS AN INTEGRATED E-MOBILITY STRATEGY A SOLID FINANCIAL FRAMEWORK ANNEX 43
Slide 49: Annex - Renewables
plenitude ANNEX — RENEWABLES
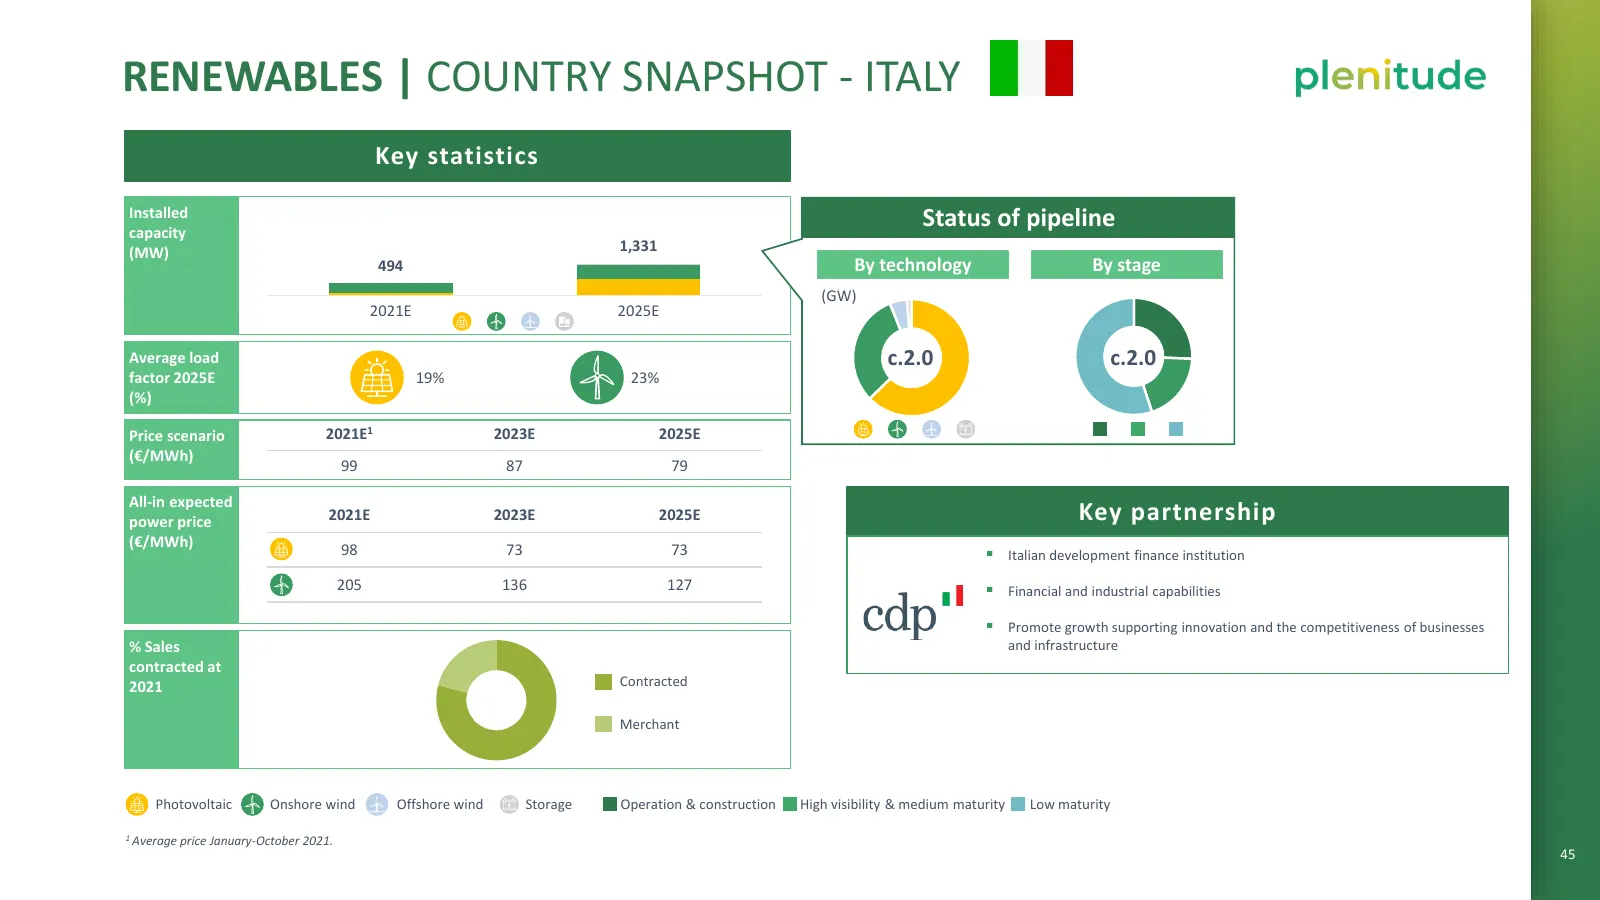
Slide 50: Renewables country snapshot - Italy
RENEWABLES | COUNTRY SNAPSHOT - ITALY Key statistics Installed Status of pipeline capacity (MW) 1,331 494 By technology By stage (GW) 2021E 2025E Average load c.2.0 c.2.0 factor 2025E 19% 23% (%) Price scenario 2021E1 2023E 2025E (€/MWh) 99 87 79 All-in expected power price 2021E 2023E 2025E Key par
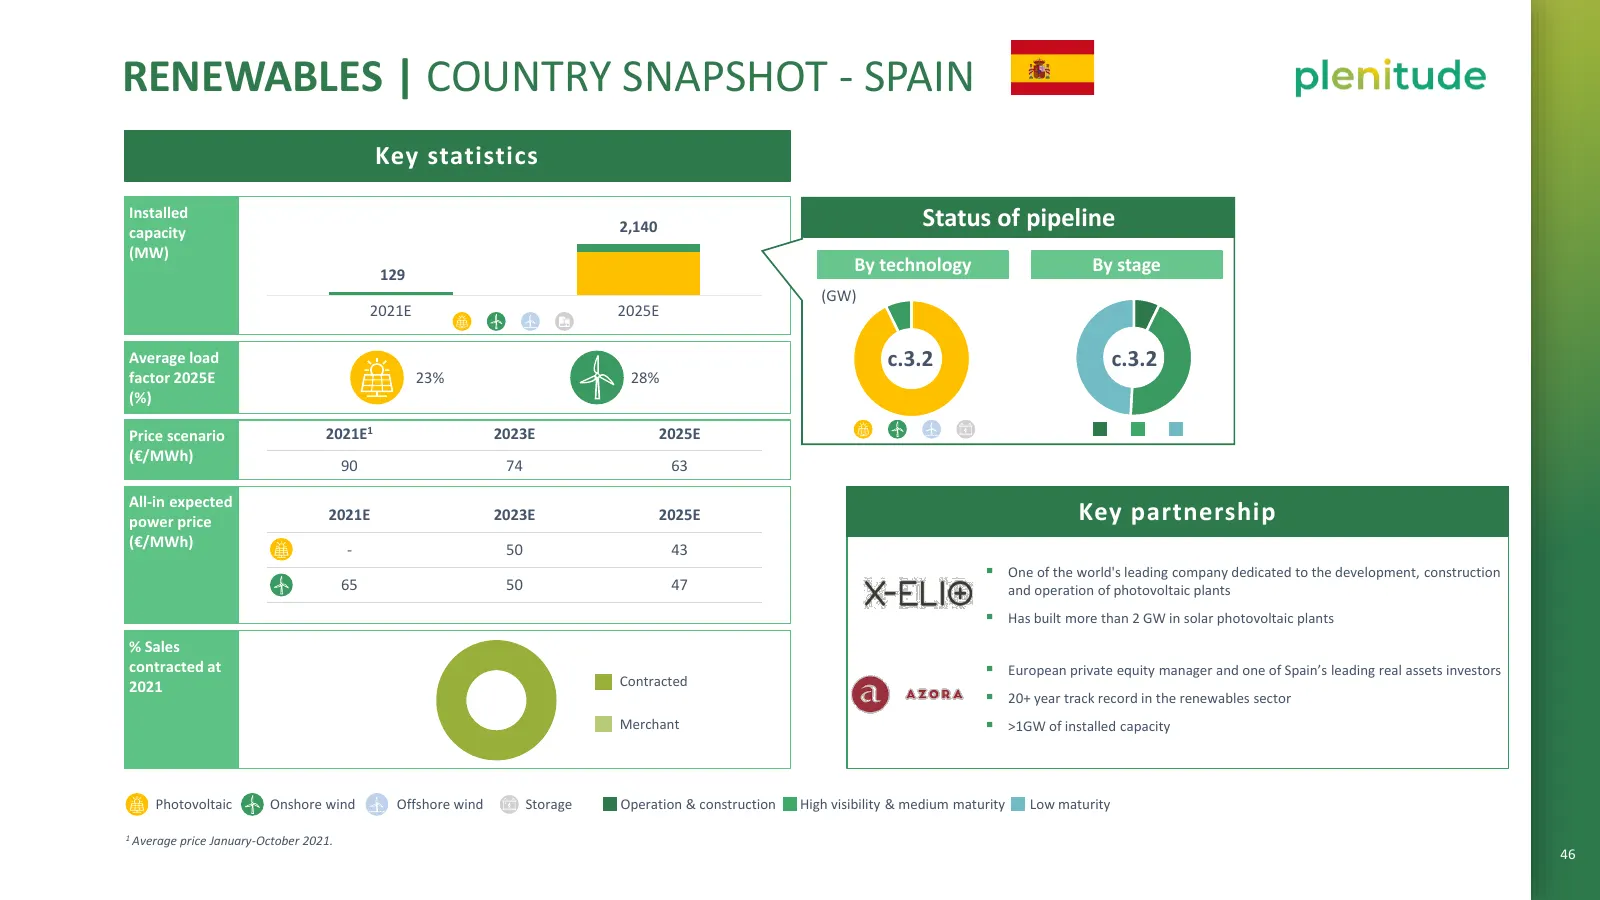
Slide 51: Renewables country snapshot - Spain
RENEWABLES | COUNTRY SNAPSHOT - SPAIN Key statistics Installed Status of pipeline capacity 2,140 (MW) 129 By technology By stage (GW) 2021E 2025E Average load c.3.2 c.3.2 factor 2025E 23% 28% (%) Price scenario 2021E1 2023E 2025E (€/MWh) 90 74 63 All-in expected power price 2021E 2023E 2025E Key par
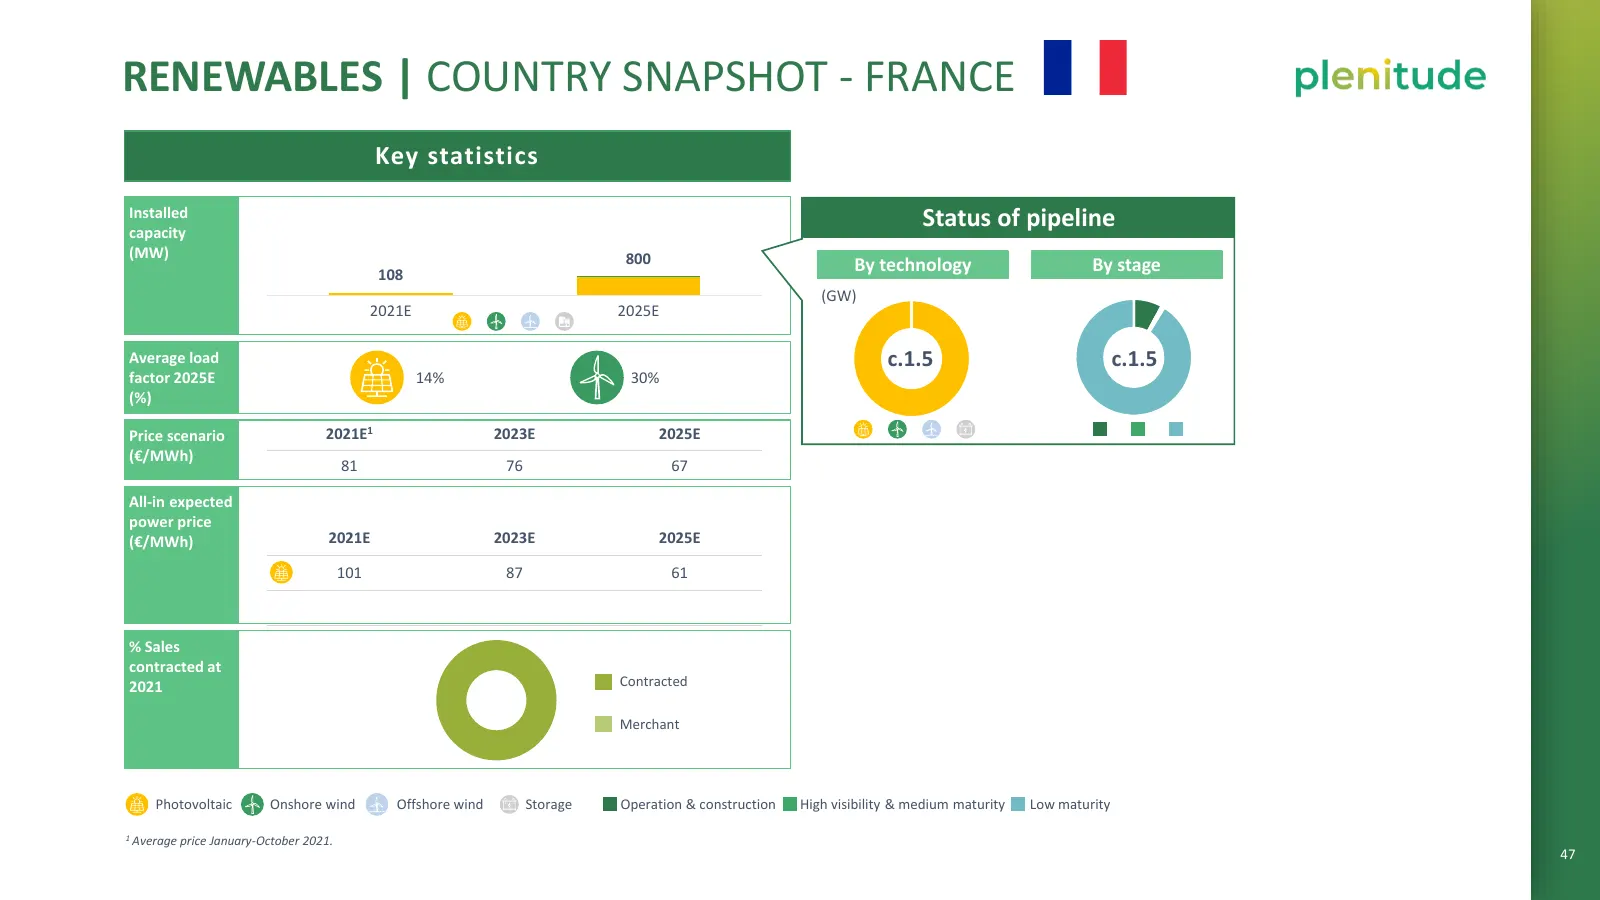
Slide 52: Renewables country snapshot - France
RENEWABLES | COUNTRY SNAPSHOT - FRANCE Key statistics Installed Status of pipeline capacity (MW) 800 108 By technology By stage (GW) 2021E 2025E Average load c.1.5 c.1.5 factor 2025E 14% 30% (%) Price scenario 2021E1 2023E 2025E (€/MWh) 81 76 67 All-in expected power price (€/MWh) 2021E 2023E 2025E
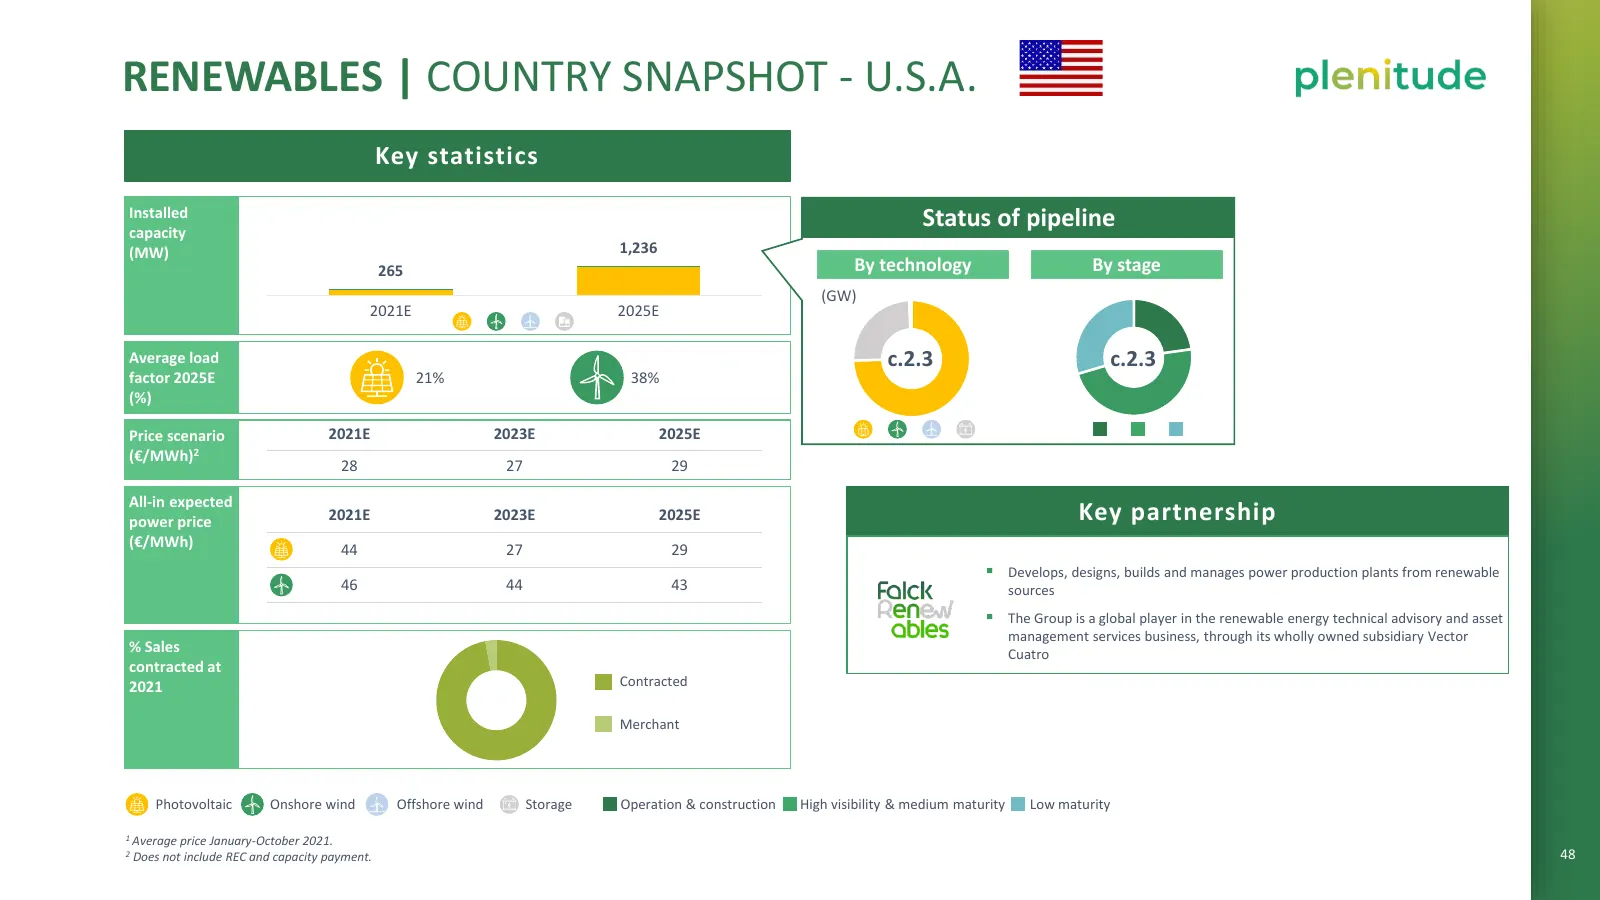
Slide 53: Renewables country snapshot - U.S.A.
RENEWABLES | COUNTRY SNAPSHOT - U.S.A. Key statistics Installed Status of pipeline capacity (MW) 1,236 265 By technology By stage (GW) 2021E 2025E Average load c.2.3 c.2.3 factor 2025E 21% 38% (%) Price scenario 2021E 2023E 2025E (€/MWh)2 28 27 29 All-in expected power price 2021E 2023E 2025E Key pa

Slide 54: Annex - Retail
plenitude ANNEX — RETAIL
Slide 55: Retail key targets by segments
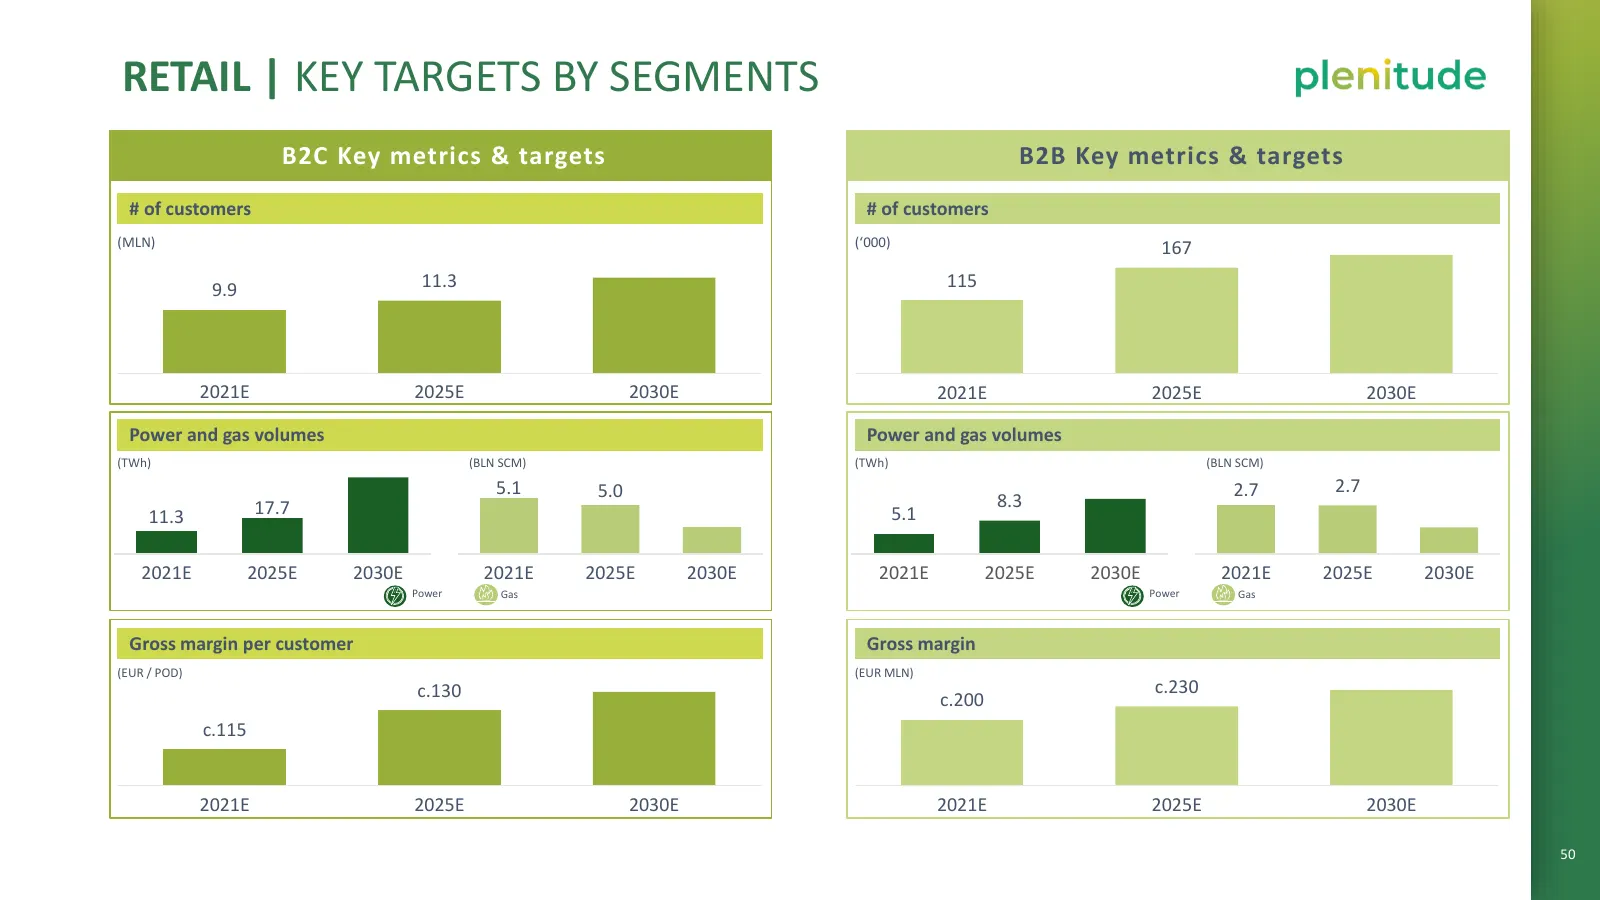
RETAIL | KEY TARGETS BY SEGMENTS B2C Key metrics & targets B2B Key metrics & targets # of customers # of customers (MLN) (‘000) 167 xx 11.3 115 xx 9.9 2021E 2025E 2030E 2021E 2025E 2030E Power and gas volumes Power and gas volumes (TWh) (BLN SCM) (TWh) (BLN SCM) 5.1 5.0 2.7 2.7 17.7 8.3 11.3 5.1 202
Slide 56: Evolvere: value driven post acquisition management
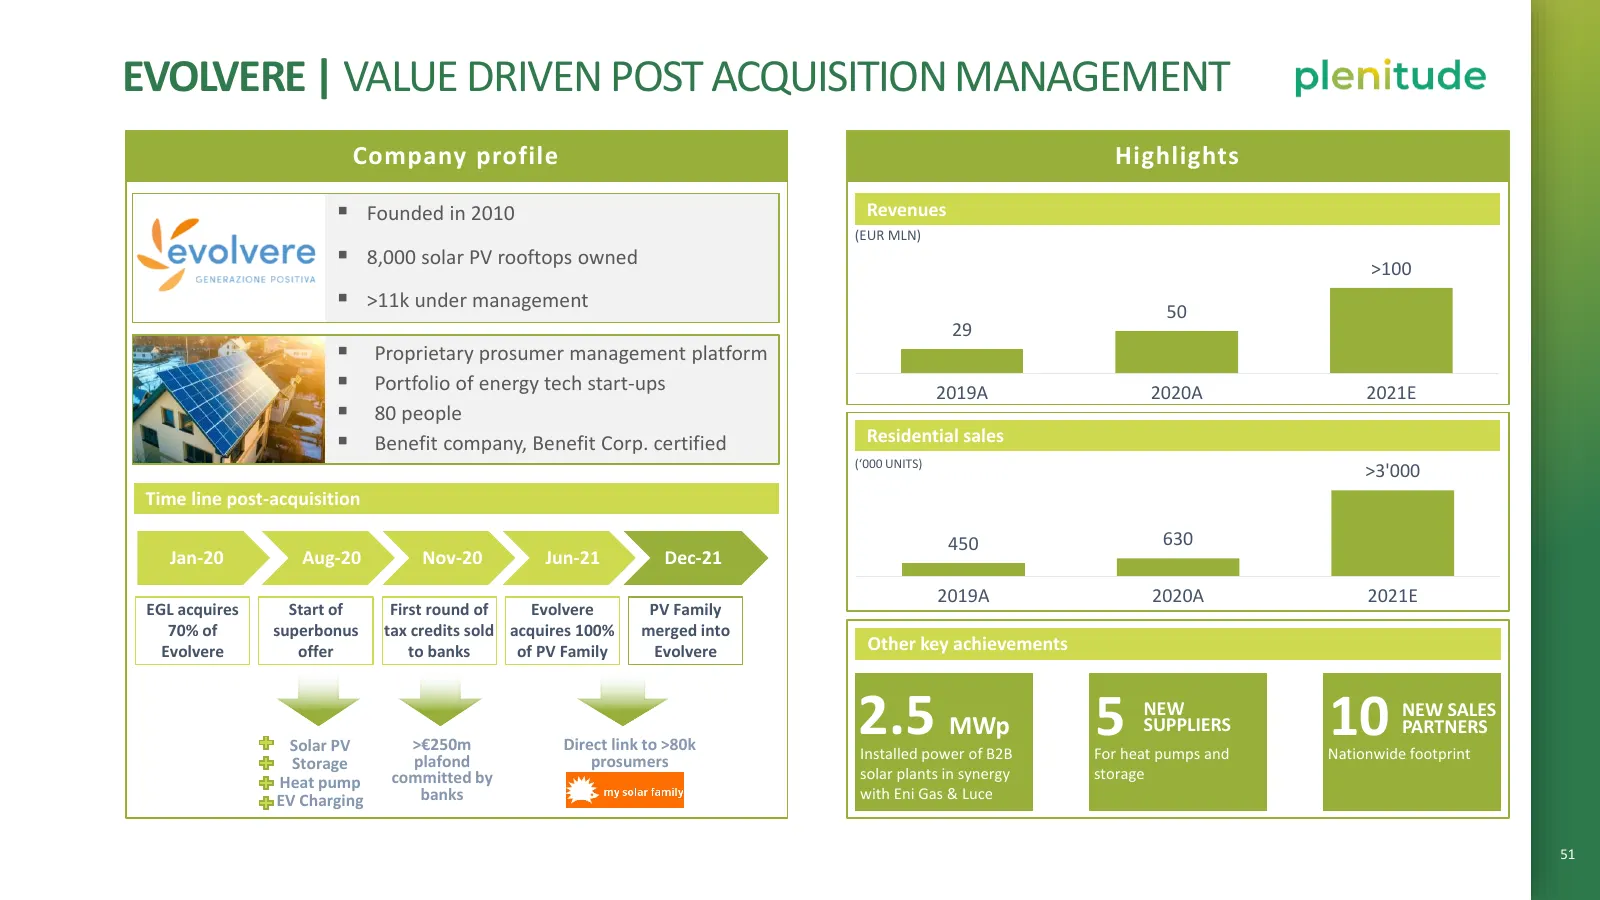
e EVOLVERE | VALUE DRIVEN POST ACQUISITION MANAGEMENT Company profile Highlights ▪ Founded in 2010 Revenues (EUR MLN) ▪ 8,000 solar PV rooftops owned xx >100 ▪ >11k under management 50 29 ▪ Proprietary prosumer management platform ▪ Portfolio of energy tech start-ups 2019A 2020A 2021E ▪ 80 people ▪
Slide 57: Annex
plenitude
Slide 58: Detailed profiles of leadership team of Plenitude
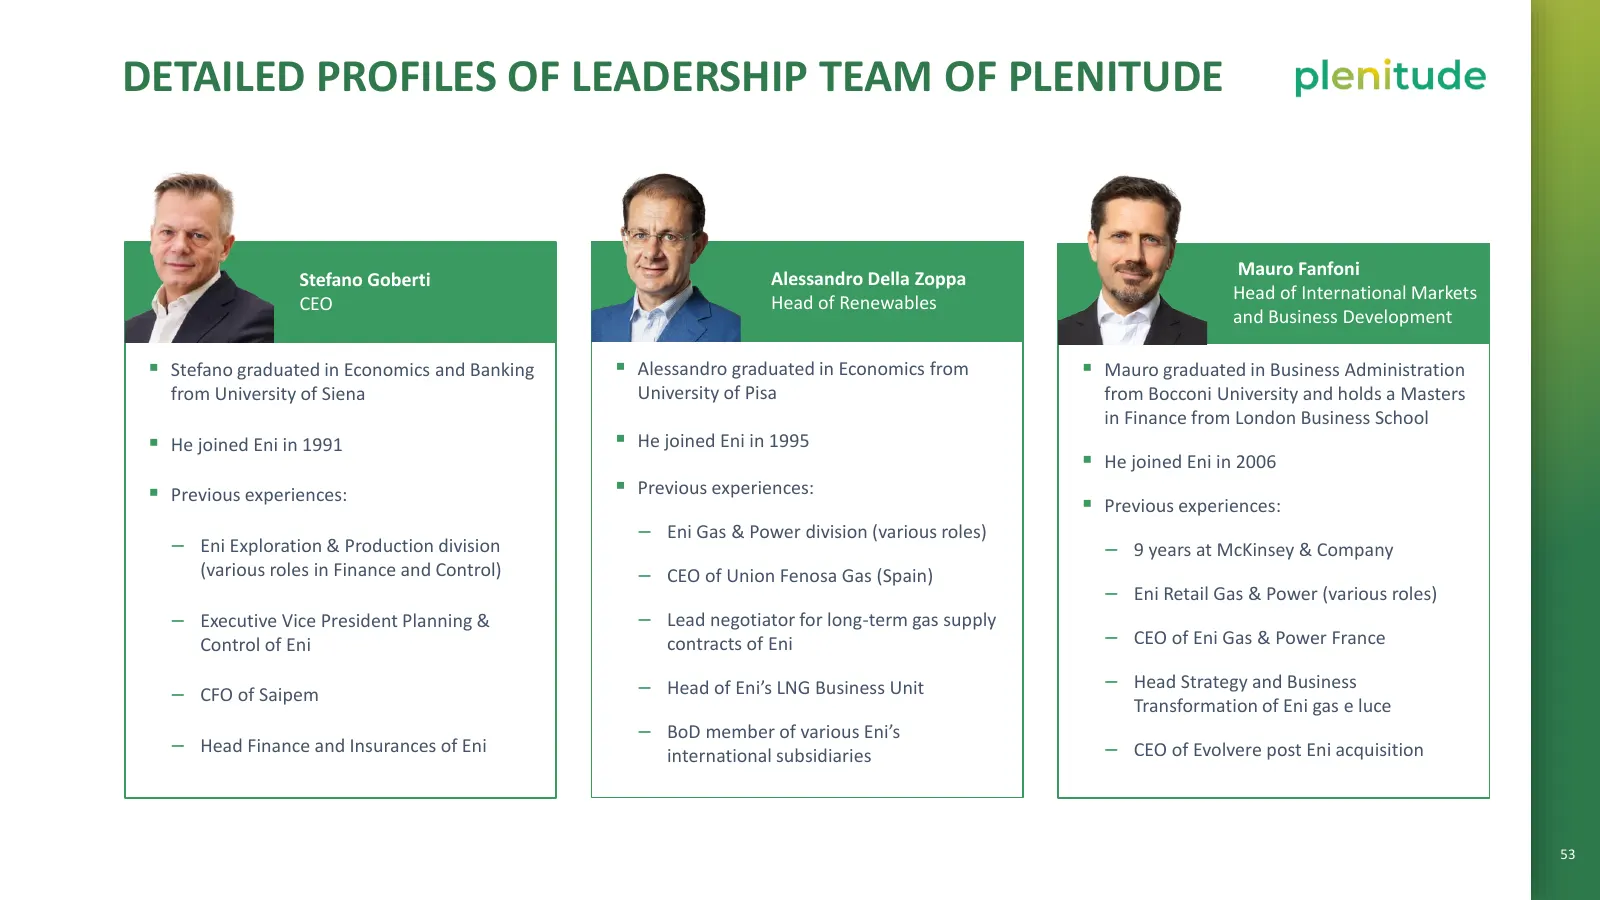
DETAILED PROFILES OF LEADERSHIP TEAM OF PLENITUDE Alessandro Della Zoppa Mauro Fanfoni Stefano Goberti Head of Renewables Head of International Markets CEO and Business Development ▪ Stefano graduated in Economics and Banking ▪ Alessandro graduated in Economics from ▪ Mauro graduated in Business Adm
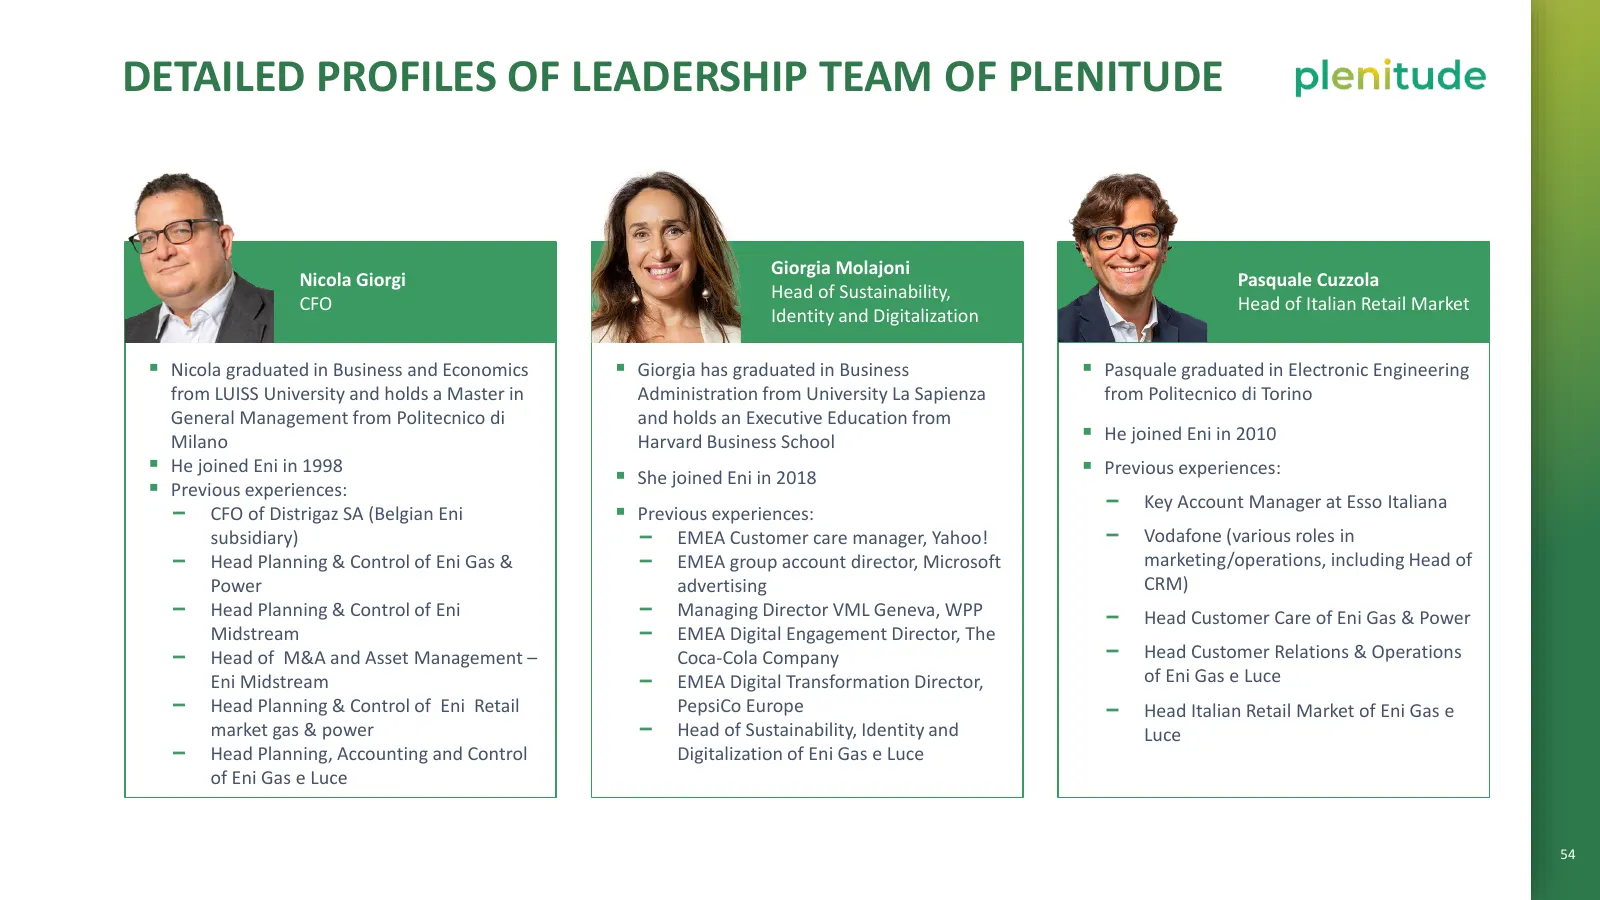
Slide 59: Detailed profiles of leadership team of Plenitude
DETAILED PROFILES OF LEADERSHIP TEAM OF PLENITUDE Giorgia Molajoni Nicola Giorgi Pasquale Cuzzola Head of Sustainability, CFO Head of Italian Retail Market Identity and Digitalization ▪ Nicola graduated in Business and Economics ▪ Giorgia has graduated in Business ▪ Pasquale graduated in Electronic
Source: Internet Archive copy of eni.com
More decks from ENI S.p.A.
 9M 2026 Earnings Presentation20 slides · Oct 23, 2026
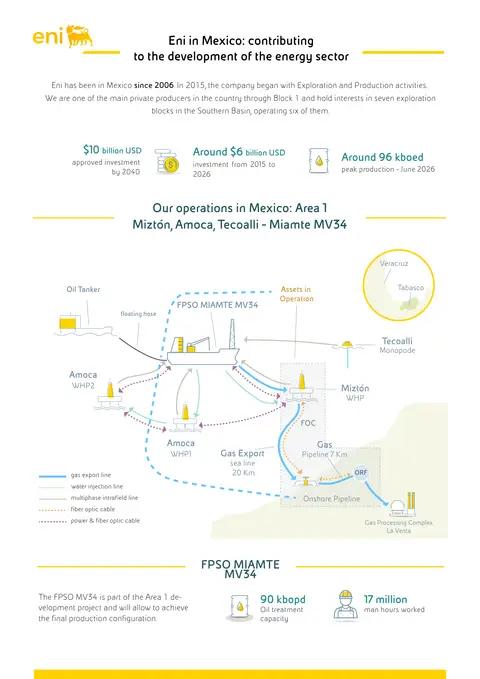 Fact Sheet (2026)3 slides · Oct 8, 2026
 H1 2026 Earnings Presentation24 slides · Jul 29, 2026
 Q1 2026 Earnings Presentation17 slides · Apr 24, 2026
 Investor Day (March 2026)61 slides · Mar 19, 2026
 Q4 2025 Earnings Presentation19 slides · Feb 26, 2026