MidWestOne Financial Group Inc
MidWestOne Financial — IPO Roadshow (September 2024)
31 slides from MidWestOne Financial's IPO roadshow presentation, Sep 26, 2024
Slide 1: Follow-On Offering Investor Presentation
Follow-On Offering Investor Presentation September 2024 Iowa City, Iowa Minneapolis, Minnesota Denver, Colorado Dubuque, Iowa
Slide 2: Notice to and Undertaking by Recipients
2 Notice to and Undertaking by Recipients In this presentation, “we,” “our,” “us,” “MidWestOne,” “MOFG" or the “Company” refers to MidWestOne Financial Group, Inc., and our consolidated subsidiaries, including MidWestOne Bank, unless the context indicates that we refer only to the parent company, Mi
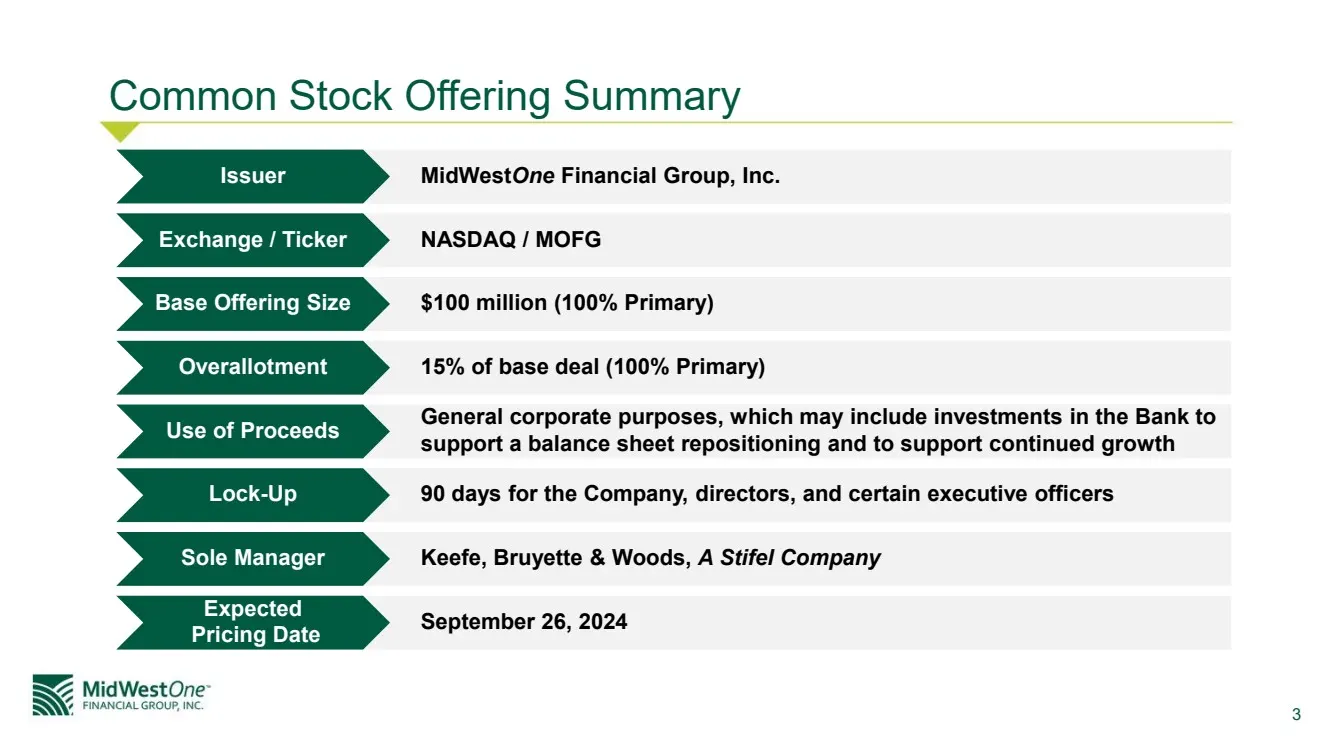
Slide 3: Common Stock Offering Summary
3 MidWestOne Financial Group, Inc. NASDAQ / MOFG $100 million (100% Primary) 15% of base deal (100% Primary) General corporate purposes, which may include investments in the Bank to support a balance sheet repositioning and to support continued growth 90 days for the Company, directors, and certain
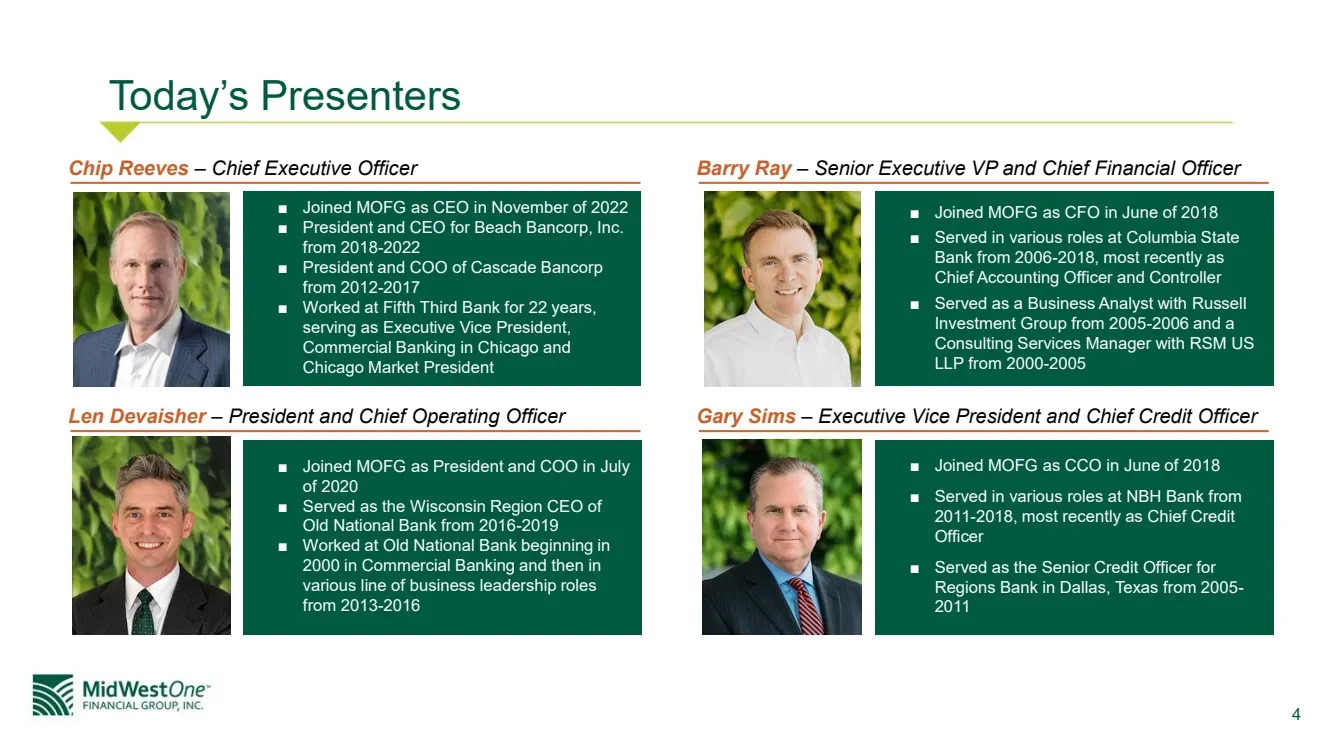
Slide 4: Executive management team
4 ■ Joined MOFG as CEO in November of 2022 ■ President and CEO for Beach Bancorp, Inc. from 2018-2022 ■ President and COO of Cascade Bancorp from 2012-2017 ■ Worked at Fifth Third Bank for 22 years, serving as Executive Vice President, Commercial Banking in Chicago and Chicago Market President ■ Joi
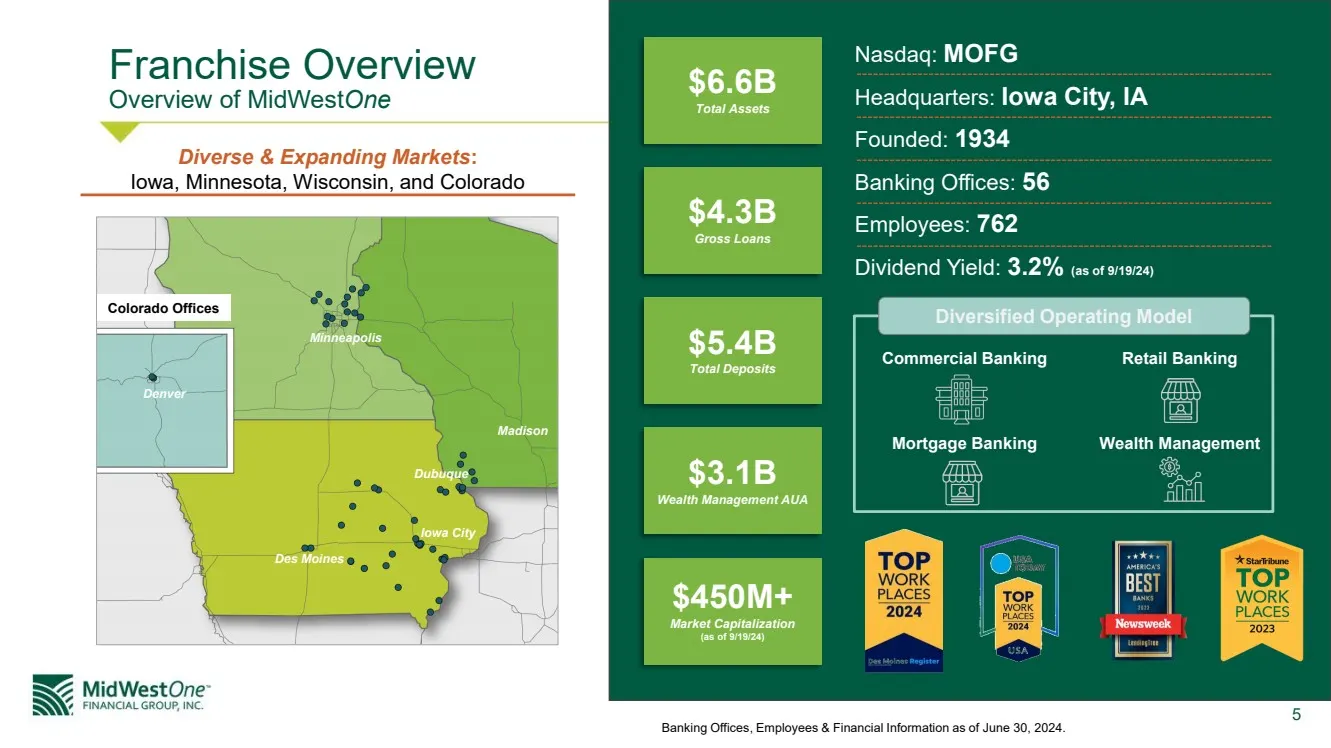
Slide 5: Overview of MidWestOne
5 Banking Offices, Employees & Financial Information as of June 30, 2024. $6.6B Total Assets $4.3B Gross Loans $5.4B Total Deposits $3.1B Wealth Management AUA $450M+ Market Capitalization (as of 9/19/24) Growing Communities for 90 Years Nasdaq: MOFG Headquarters: Iowa City, IA Founded: 1934 Banking
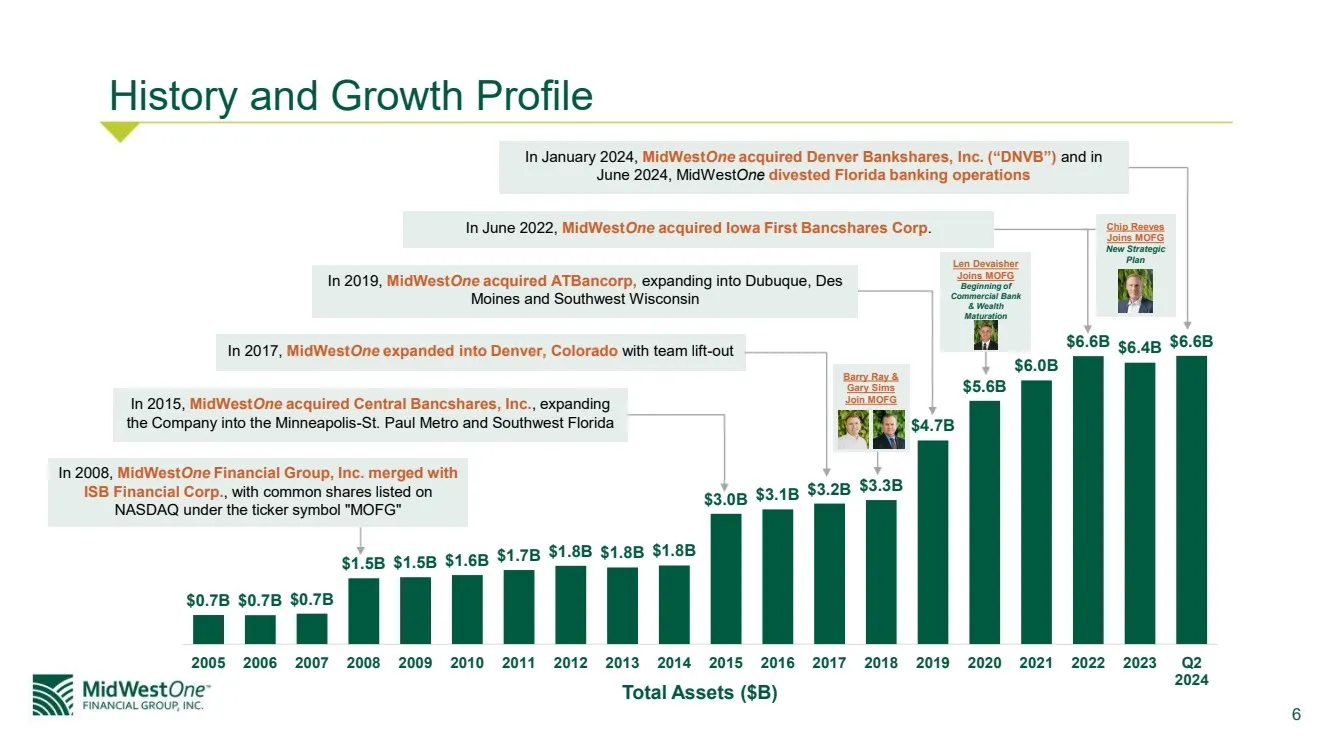
Slide 6: History and Growth Profile
6 History and Growth Profile $0.7B $0.7B $0.7B $1.5B $1.5B $1.6B $1.7B $1.8B $1.8B $1.8B $3.0B $3.1B $3.2B $3.3B $4.7B $5.6B $6.0B $6.6B $6.4B $6.6B 2005 2006 2007 2008 2009 2010 2011 2012 2013 2014 2015 2016 2017 2018 2019 2020 2021 2022 2023 Q2 2024 In 2008, MidWestOne Financial Group, Inc. merged
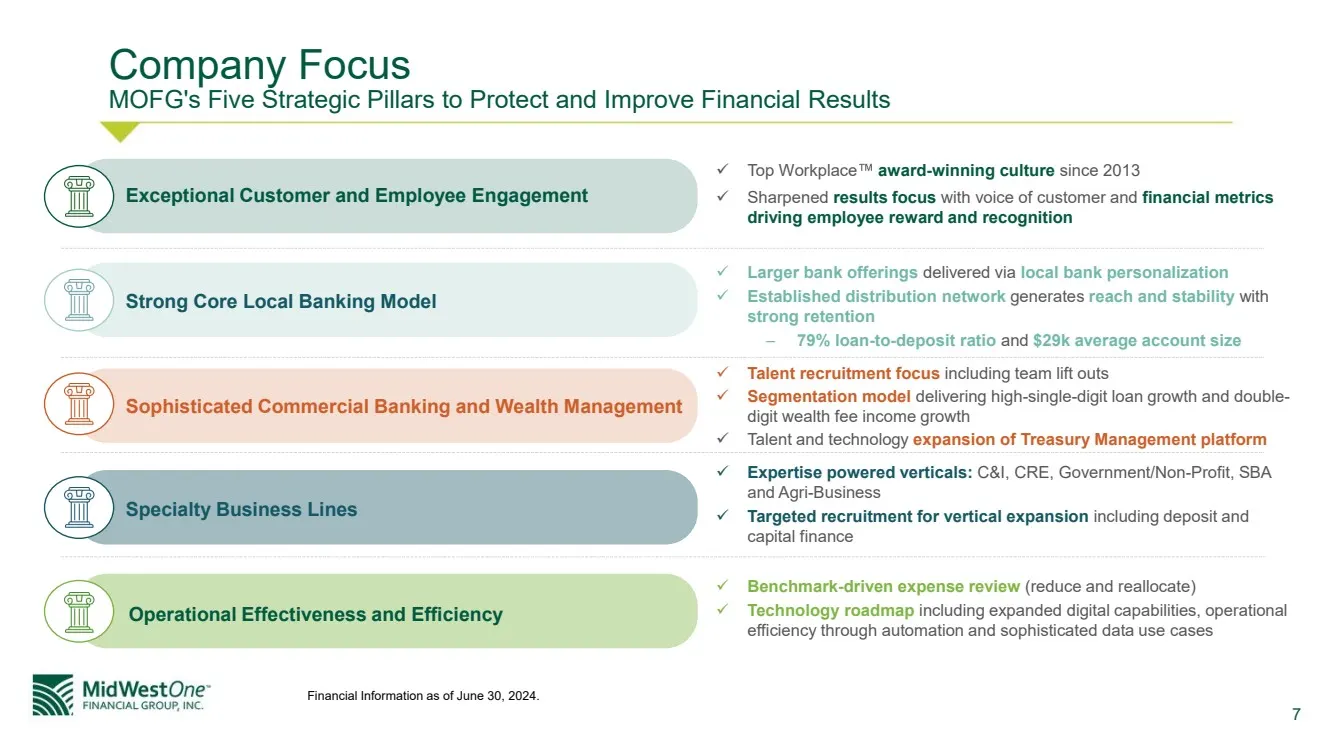
Slide 7: Strong Core Local Banking Model
7 Exceptional Customer and Employee Engagement Strong Core Local Banking Model Sophisticated Commercial Banking and Wealth Management Specialty Business Lines Operational Effectiveness and Efficiency ✓ Top Workplace award-winning culture since 2013 ✓ Sharpened results focus with voice of customer an
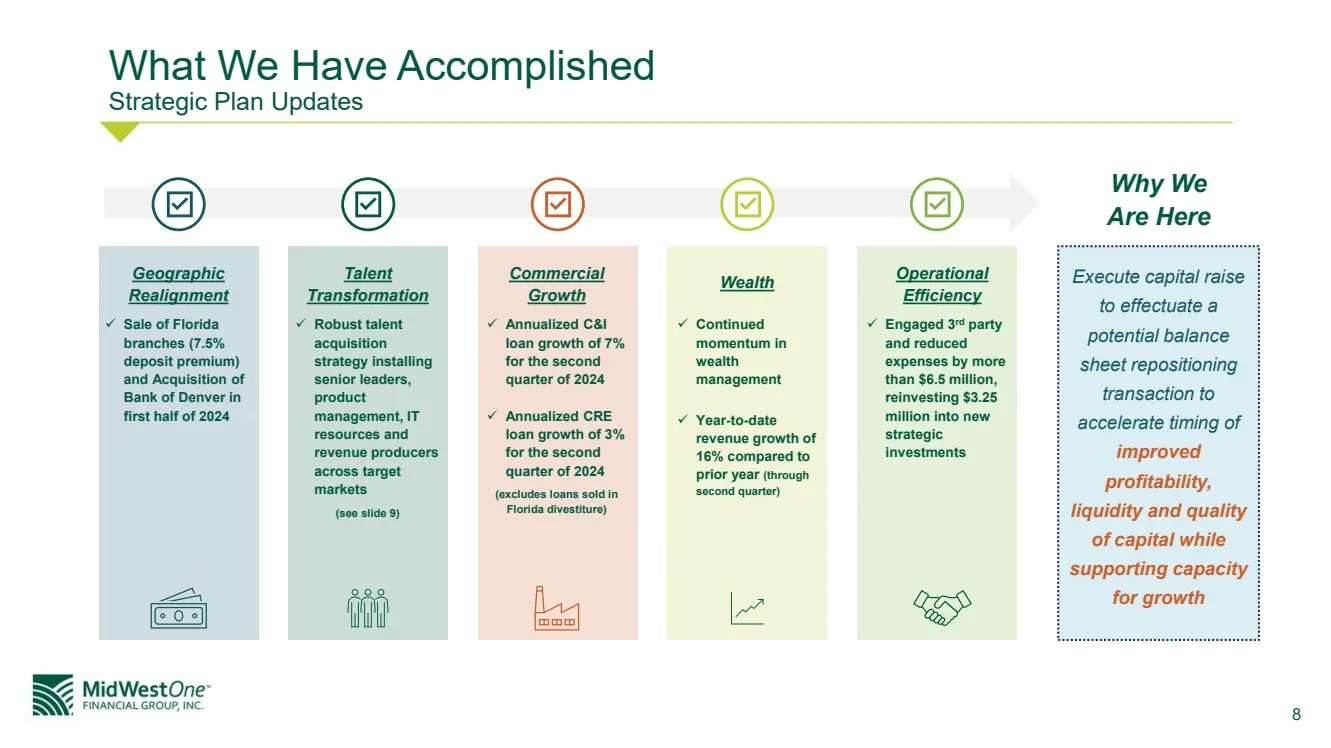
Slide 8: What We Have Accomplished
8 What We Have Accomplished Strategic Plan Updates Geographic Realignment ✓ Sale of Florida branches (7.5% deposit premium) and Acquisition of Bank of Denver in first half of 2024 Operational Efficiency ✓ Engaged 3rd party and reduced expenses by more than $6.5 million, reinvesting $3.25 million int
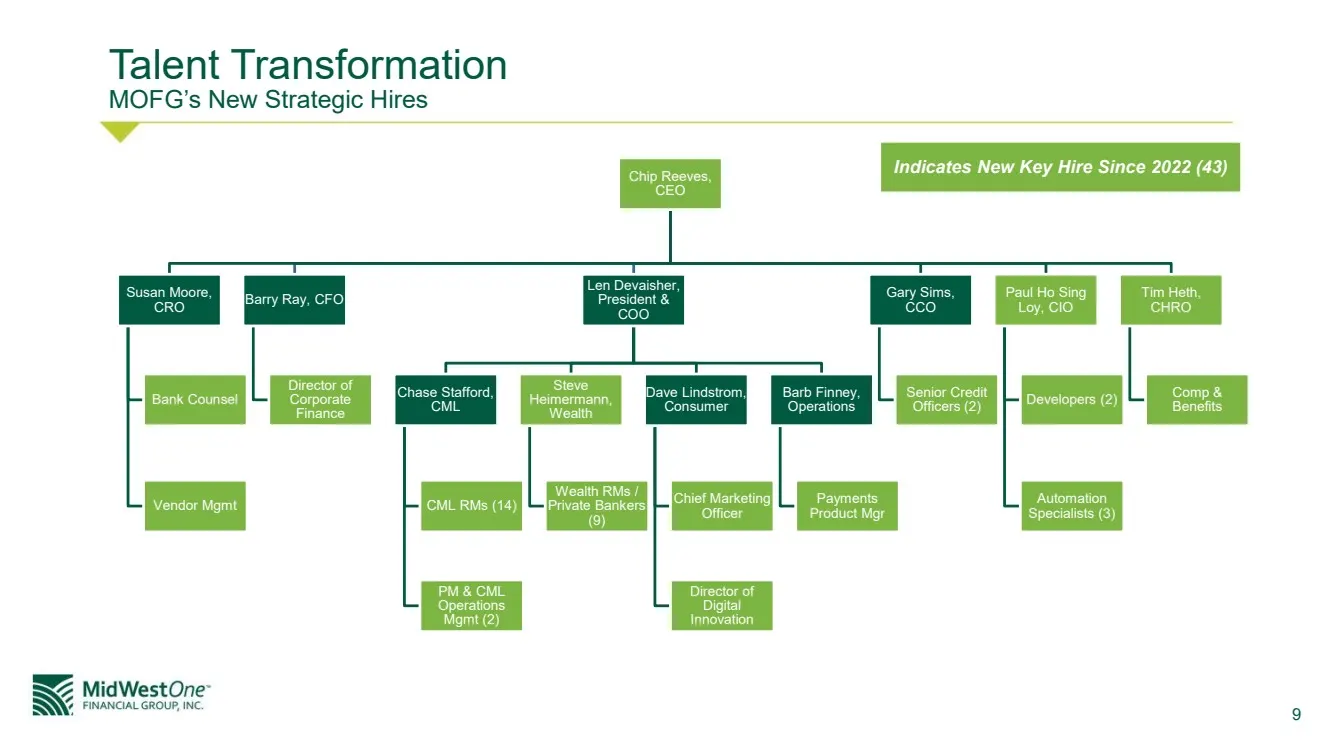
Slide 9: MOFG's New Strategic Hires
9 Chip Reeves, CEO Susan Moore, CRO Bank Counsel Vendor Mgmt Barry Ray, CFO Director of Corporate Finance Len Devaisher, President & COO Chase Stafford, CML CML RMs (14) PM & CML Operations Mgmt (2) Steve Heimermann, Wealth Wealth RMs / Private Bankers (9) Dave Lindstrom, Consumer Chief Marketing Of
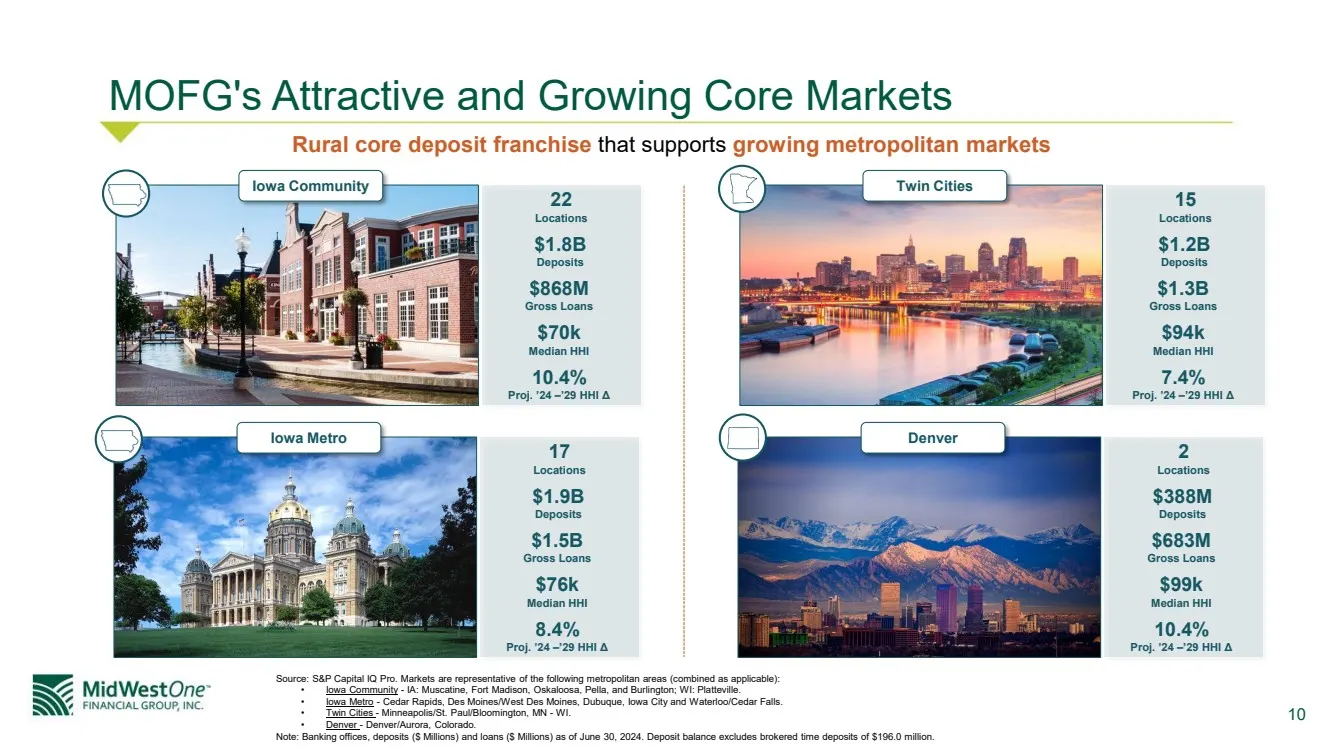
Slide 10: Rural core deposit franchise supporting growing metropolitan markets
10 Rural core deposit franchise that supports growing metropolitan markets 22 Locations $1.8B Deposits $868M Gross Loans $70k Median HHI 10.4% Proj. ’24 –’29 HHI Δ Iowa Community 17 Locations $1.9B Deposits $1.5B Gross Loans $76k Median HHI 8.4% Proj. ’24 –’29 HHI Δ Iowa Metro 15 Locations $1.2B Dep
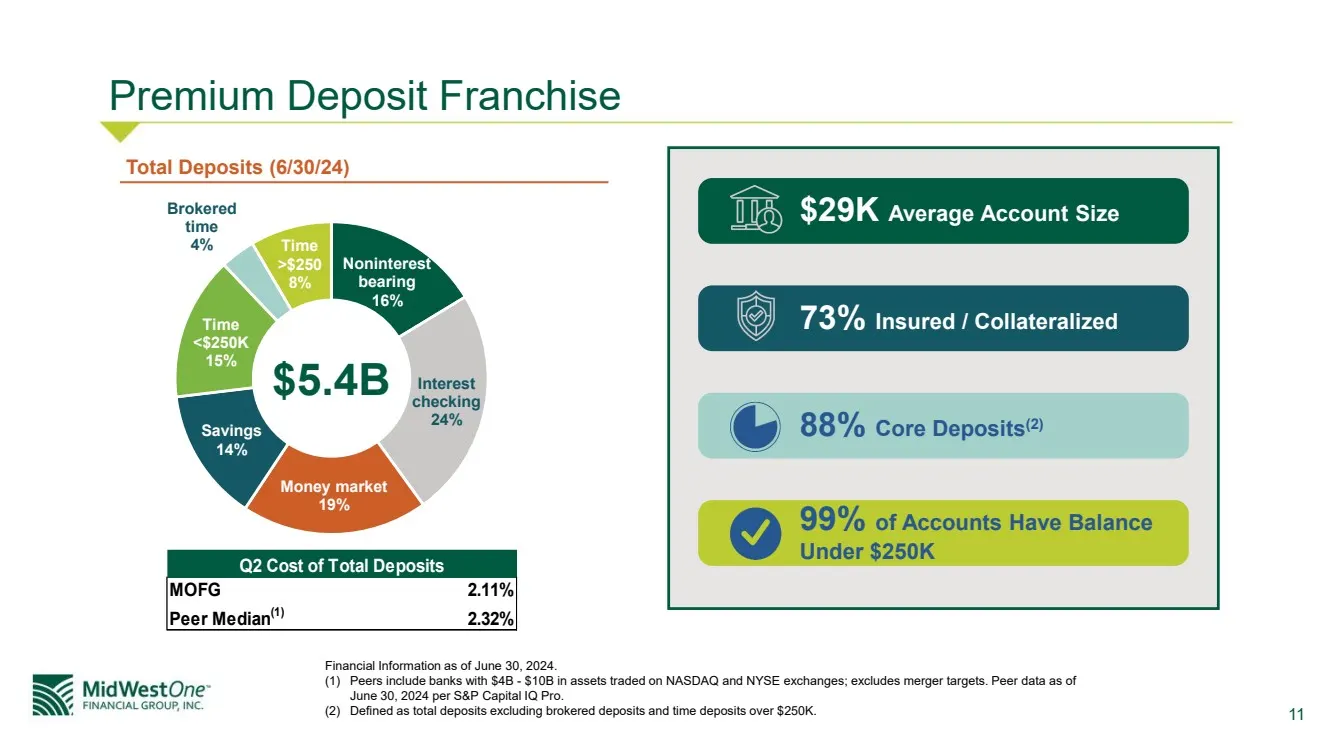
Slide 11: Premium Deposit Franchise
11 Premium Deposit Franchise Q2 Cost of Total Deposits MOFG 2.11% Peer Median(1) 2.32% $29K Average Account Size 73% Insured / Collateralized 88% Core Deposits(2) 99% of Accounts Have Balance Under $250K Financial Information as of June 30, 2024. (1) Peers include banks with $4B - $10B in assets tra
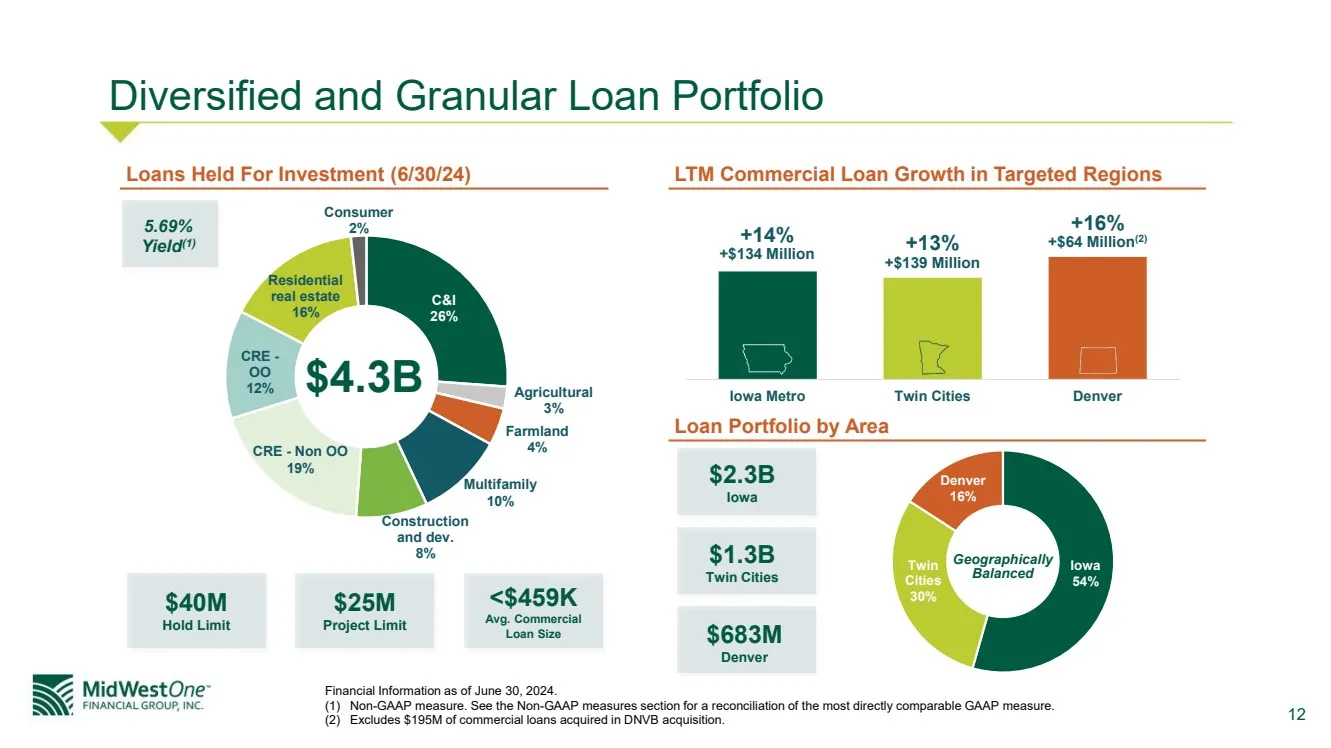
Slide 12: Diversified and Granular Loan Portfolio
12 C&I 26% Agricultural 3% Farmland 4% Multifamily 10% Construction and dev. 8% CRE - Non OO 19% CRE - OO 12% Residential real estate 16% Consumer 2% Iowa Metro Twin Cities Denver Diversified and Granular Loan Portfolio $4.3B Loans Held For Investment (6/30/24) LTM Commercial Loan Growth in Targeted
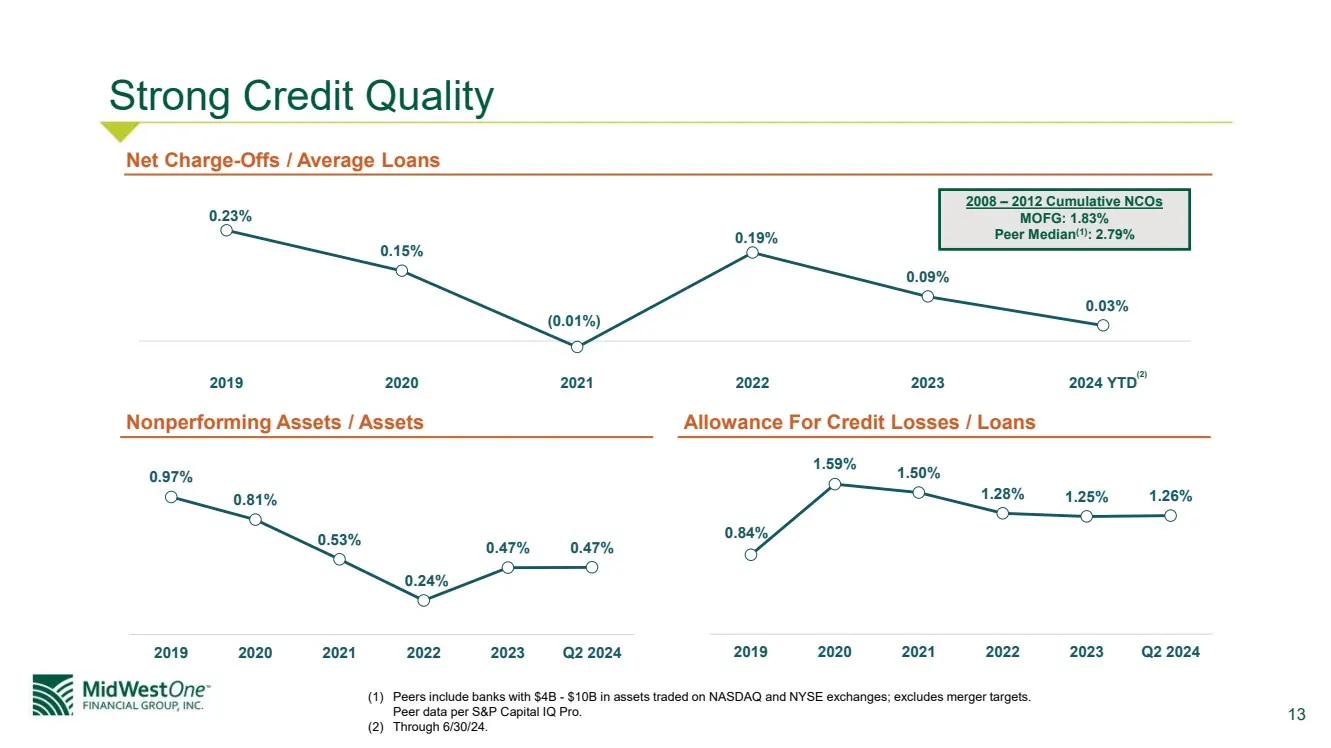
Slide 13: Strong Credit Quality
13 0.97% 0.81% 0.53% 0.24% 0.47% 0.47% 2019 2020 2021 2022 2023 Q2 2024 0.84% 1.59% 1.50% 1.28% 1.25% 1.26% 2019 2020 2021 2022 2023 Q2 2024 0.23% 0.15% (0.01%) 0.19% 0.09% 0.03% 2019 2020 2021 2022 2023 2024 YTD Strong Credit Quality Net Charge-Offs / Average Loans Nonperforming Assets / Assets All
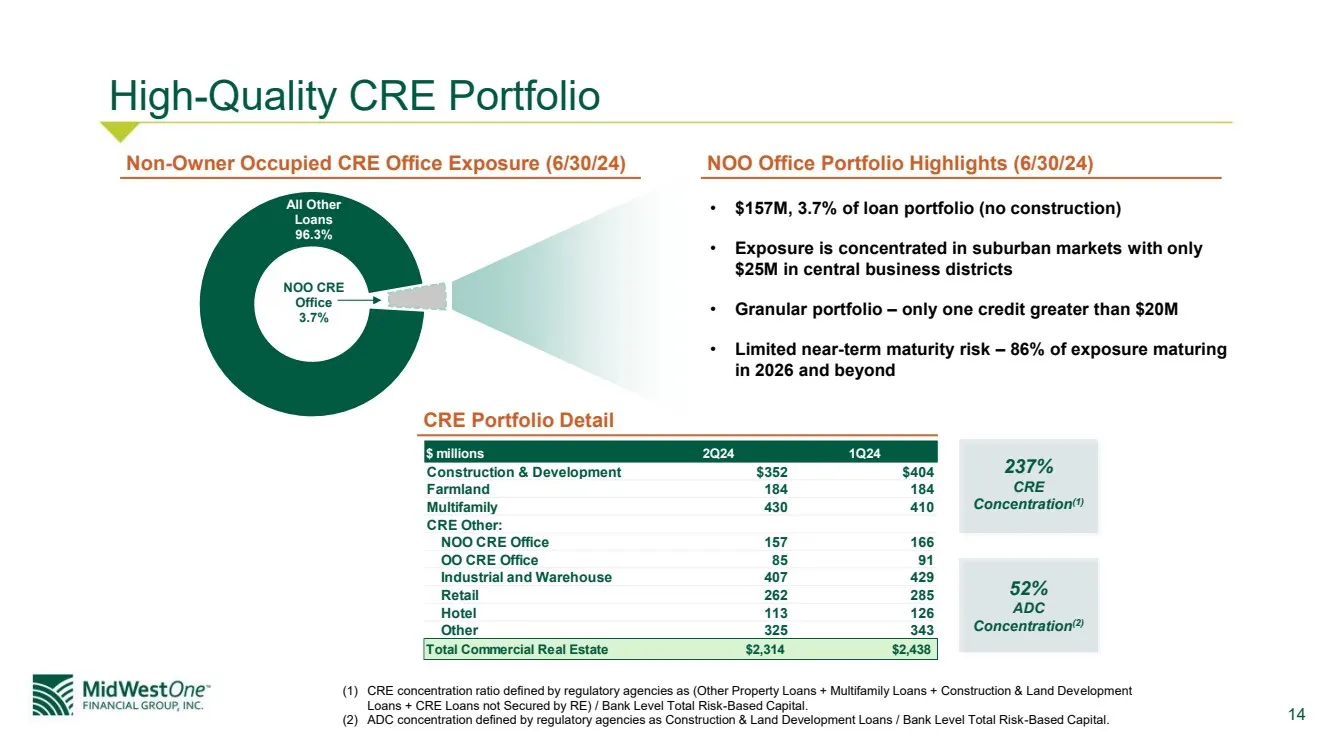
Slide 14: High-Quality CRE Portfolio
14 $ millions 2Q24 1Q24 Construction & Development $352 $404 Farmland 184 184 Multifamily 430 410 CRE Other: NOO CRE Office 157 166 OO CRE Office 85 91 Industrial and Warehouse 407 429 Retail 262 285 Hotel 113 126 Other 325 343 Total Commercial Real Estate $2,314 $2,438 NOO CRE Office 3.7% All Other
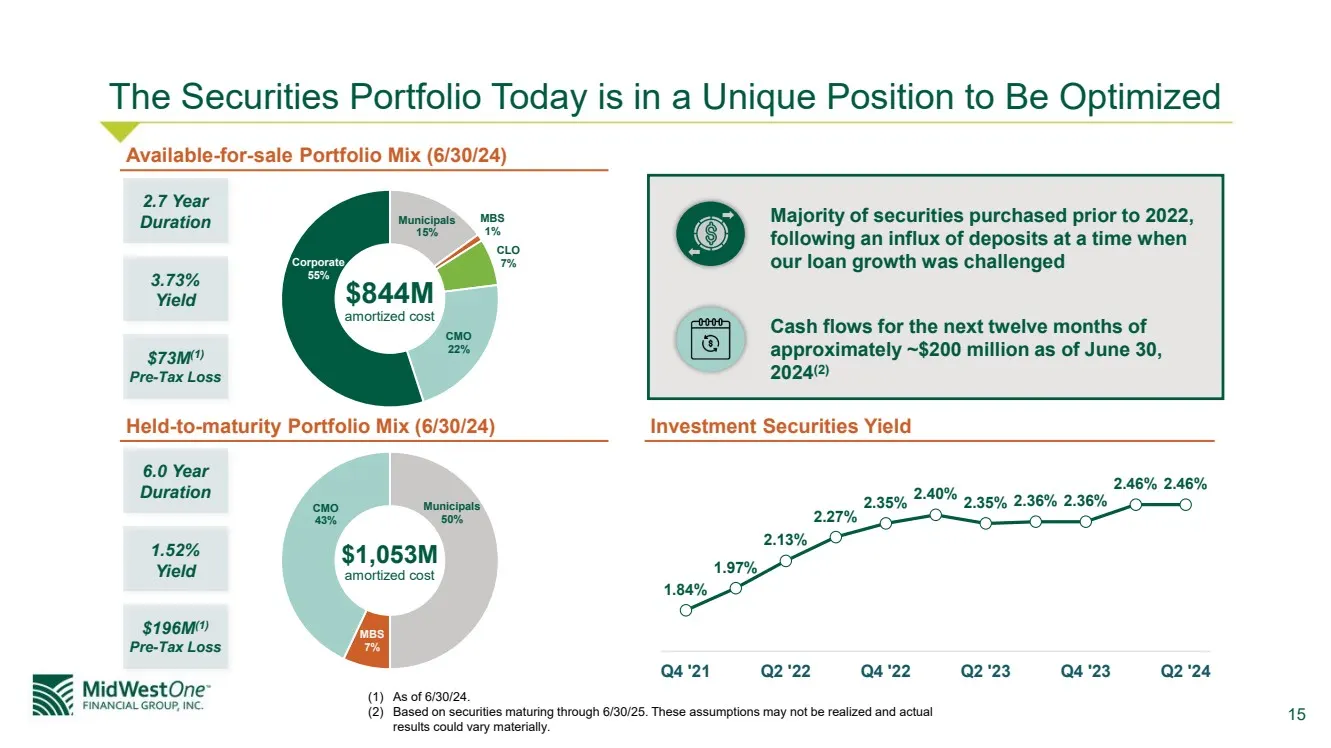
Slide 15: Securities Portfolio Positioned to Be Optimized
15 Available-for-sale Portfolio Mix (6/30/24) Held-to-maturity Portfolio Mix (6/30/24) Majority of securities purchased prior to 2022, following an influx of deposits at a time when our loan growth was challenged Cash flows for the next twelve months of approximately ~$200 million as of June 30, 202
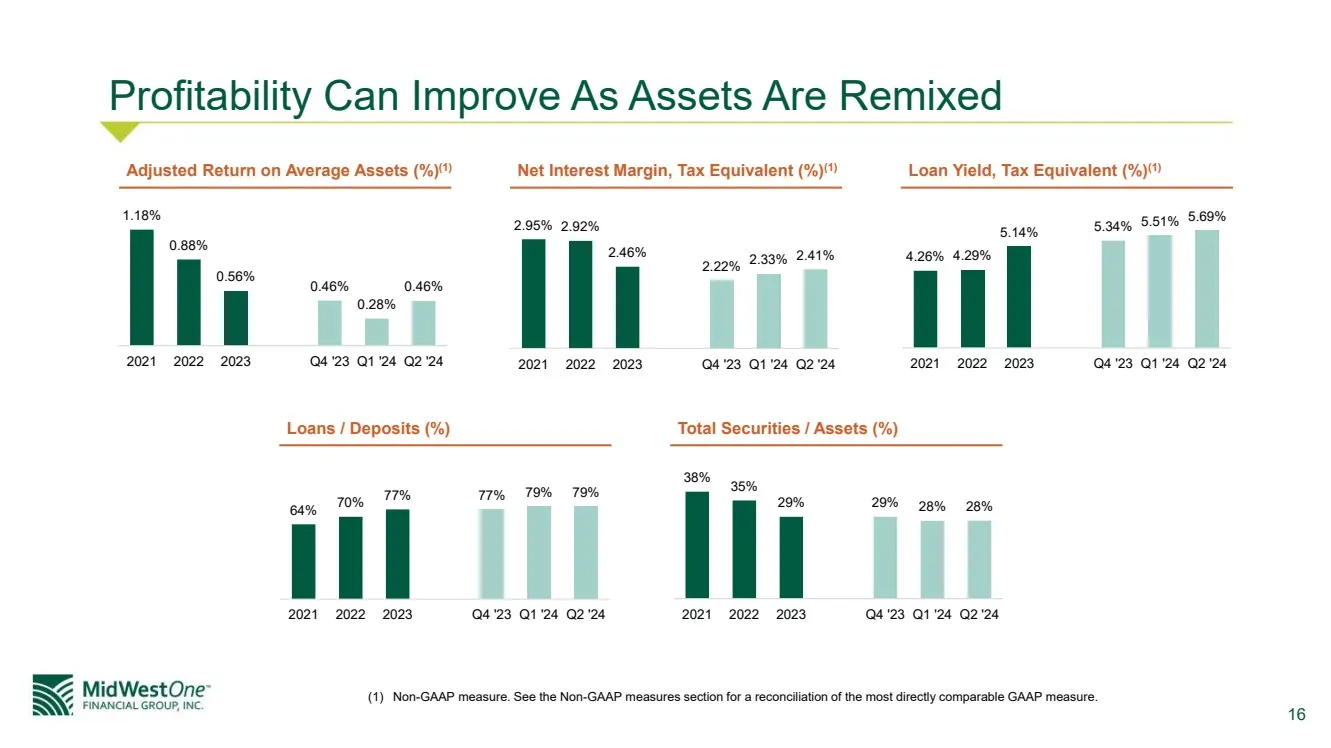
Slide 16: Profitability Can Improve As Assets Are Remixed
16 Adjusted Return on Average Assets (%)(1) Net Interest Margin, Tax Equivalent (%)(1) Loan Yield, Tax Equivalent (%)(1) Loans / Deposits (%) Total Securities / Assets (%) 1.18% 0.88% 0.56% 0.46% 0.28% 0.46% 2021 2022 2023 Q4 '23 Q1 '24 Q2 '24 2.95% 2.92% 2.46% 2.22% 2.33% 2.41% 2021 2022 2023 Q4 '2
Slide 17: Potential Securities Repositioning
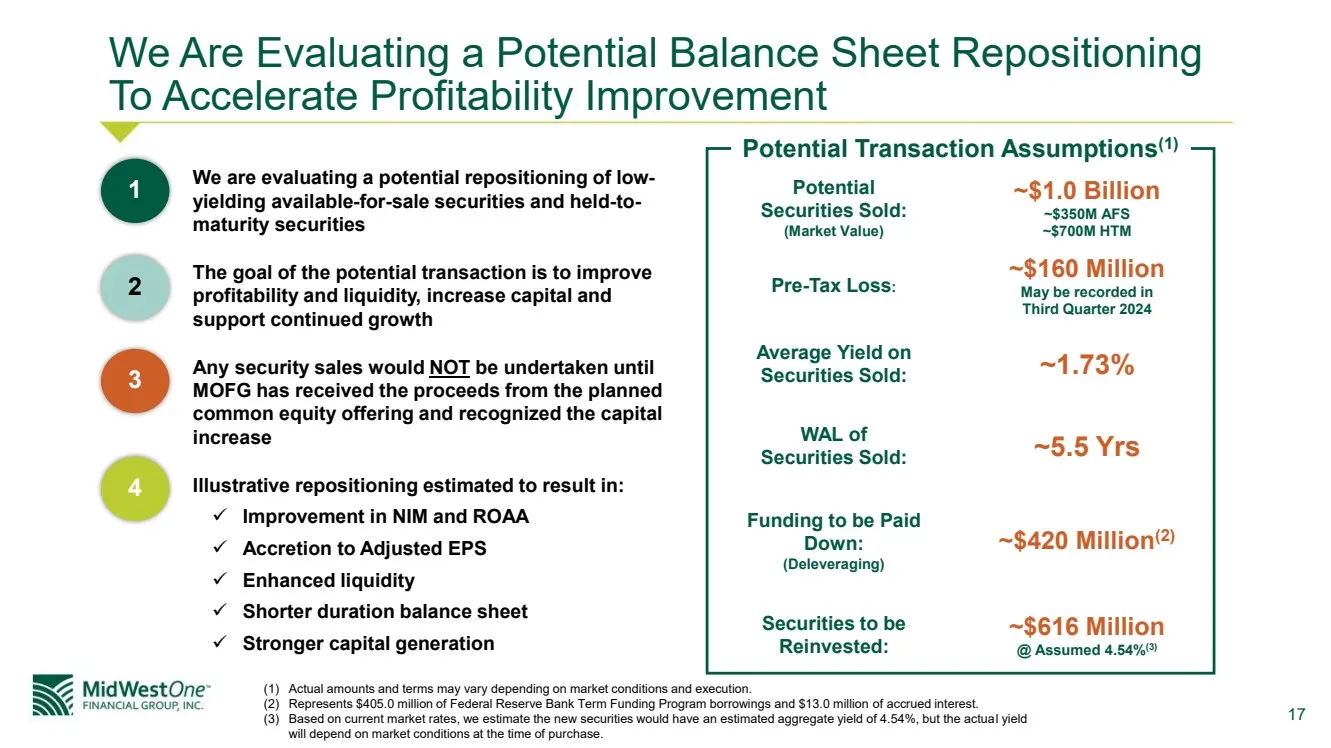
17 We are evaluating a potential repositioning of low-yielding available-for-sale securities and held-to-maturity securities The goal of the potential transaction is to improve profitability and liquidity, increase capital and support continued growth Any security sales would NOT be undertaken until
Slide 18: Potential Repositioning Accelerates Profitability
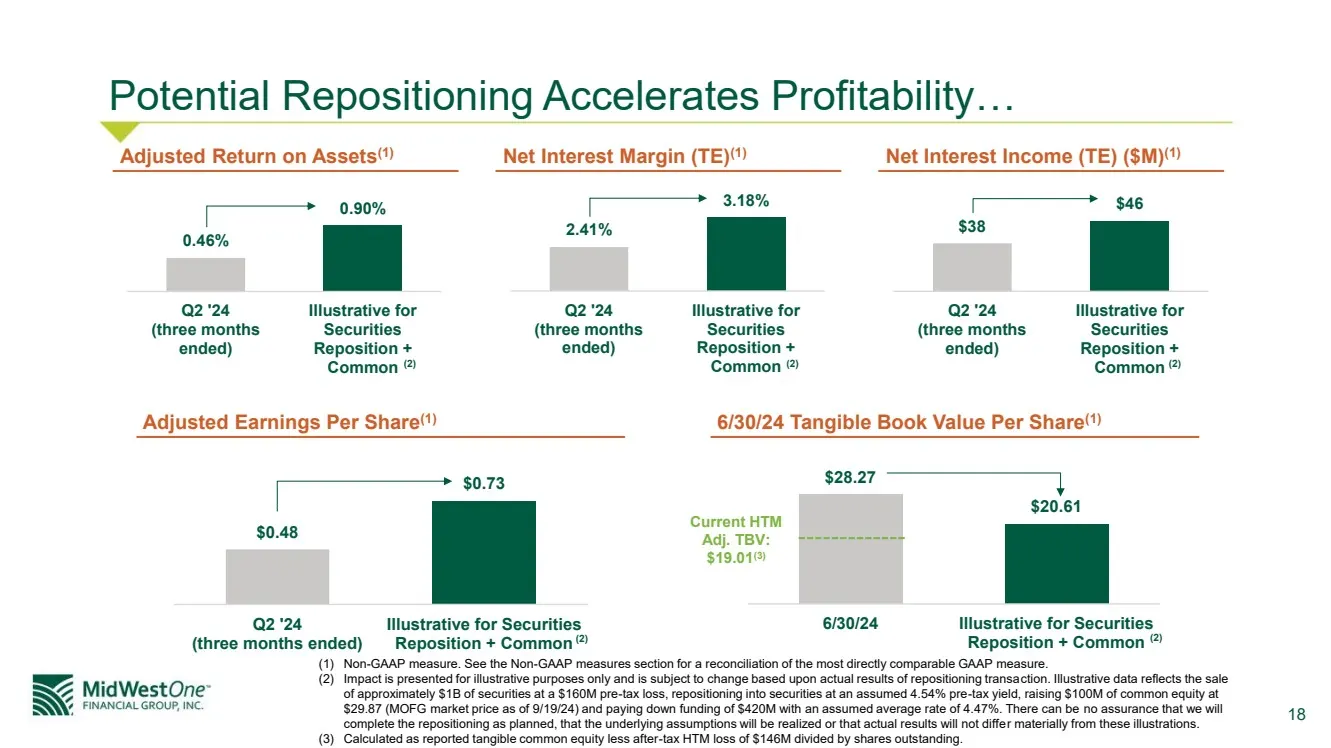
18 $0.48 $0.73 Q2 '24 (three months ended) Illustrative for Securities Reposition + Common $28.27 $20.61 6/30/24 Illustrative for Securities Reposition + Common Potential Repositioning Accelerates Profitability… Adjusted Earnings Per Share(1) 6/30/24 Tangible Book Value Per Share(1) Current HTM Adj.
Slide 19: And Strengthens The Balance Sheet
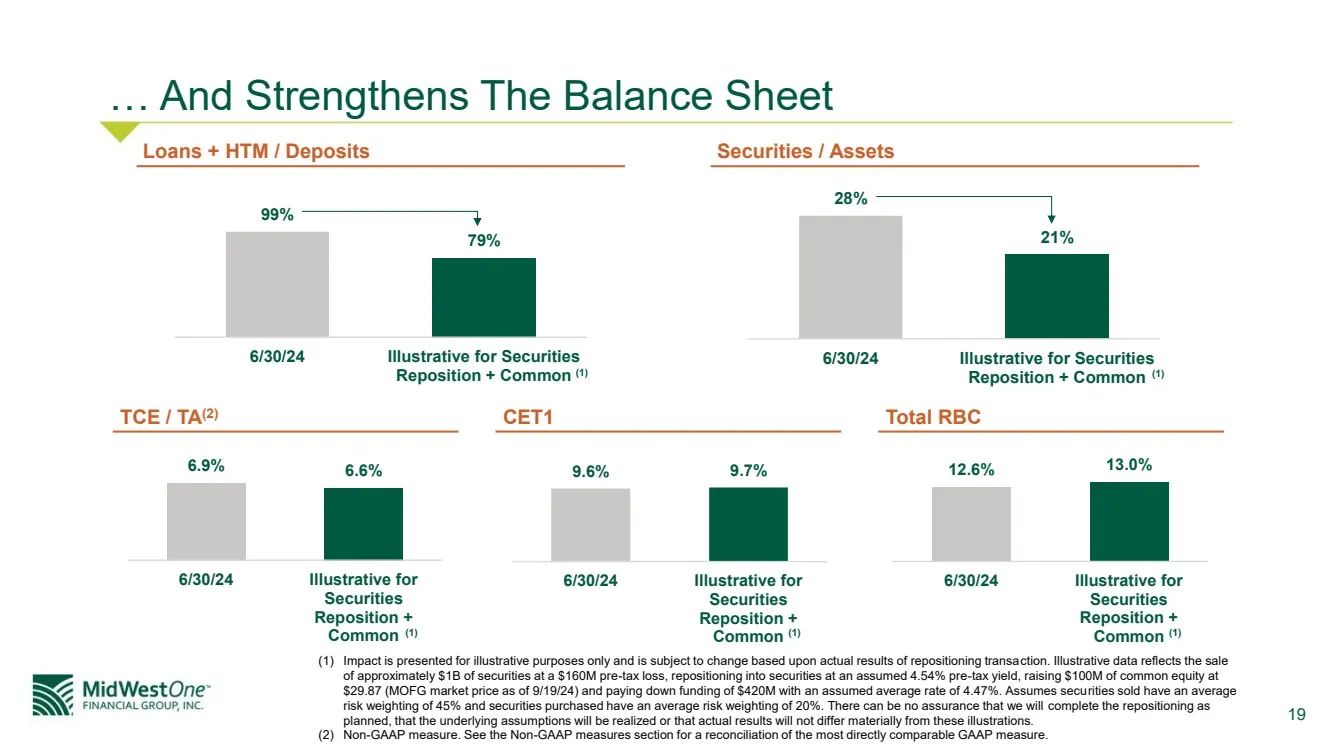
19 28% 21% 6/30/24 Illustrative for Securities Reposition + Common 99% 79% 6/30/24 Illustrative for Securities Reposition + Common … And Strengthens The Balance Sheet Loans + HTM / Deposits Securities / Assets TCE / TA(2) CET1 Total RBC 6.9% 6.6% 6/30/24 Illustrative for Securities Reposition + Comm
Slide 20: Investment Thesis: A Transformed MOFG
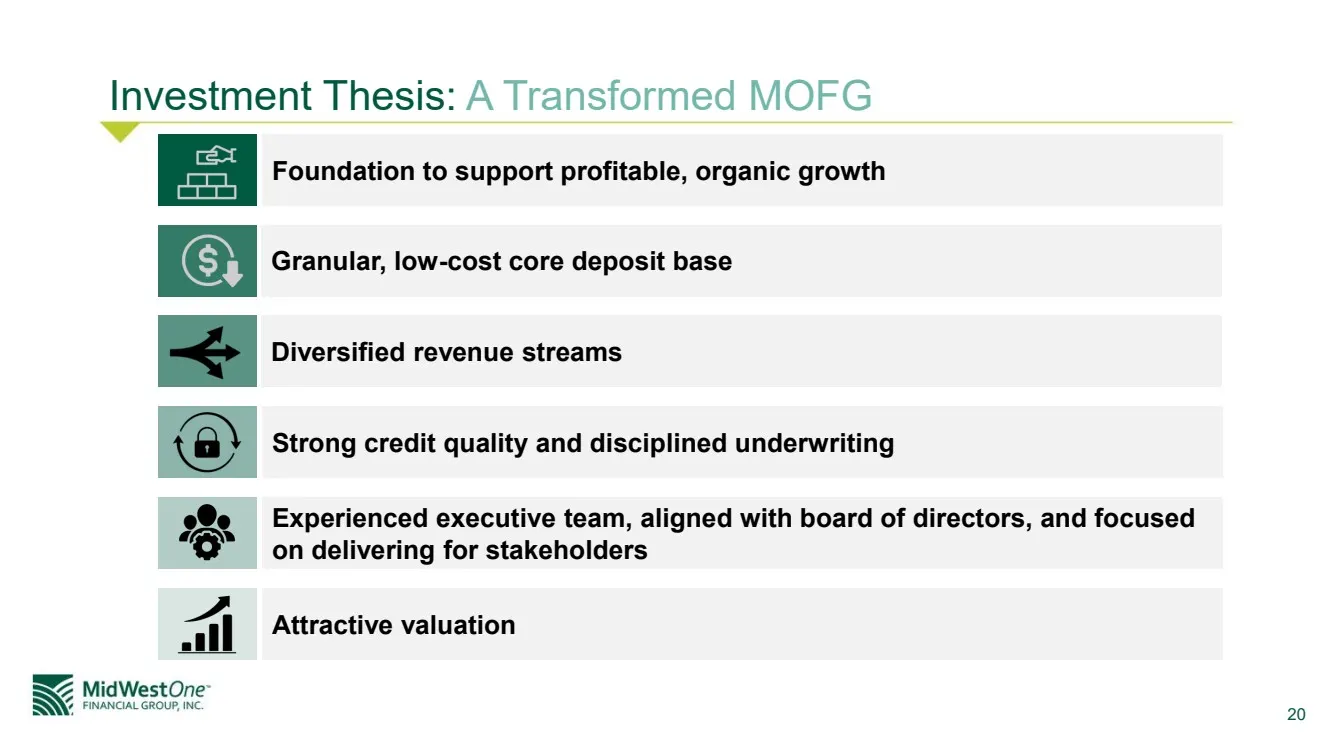
20 Investment Thesis: A Transformed MOFG Granular, low-cost core deposit base Diversified revenue streams Strong credit quality and disciplined underwriting Foundation to support profitable, organic growth Attractive valuation Experienced executive team, aligned with board of directors, and focused
Slide 21: FINANCIAL GROUP, INC. a
FINANCIAL GROUP, INC. a
Slide 22: Historical Financial Performance
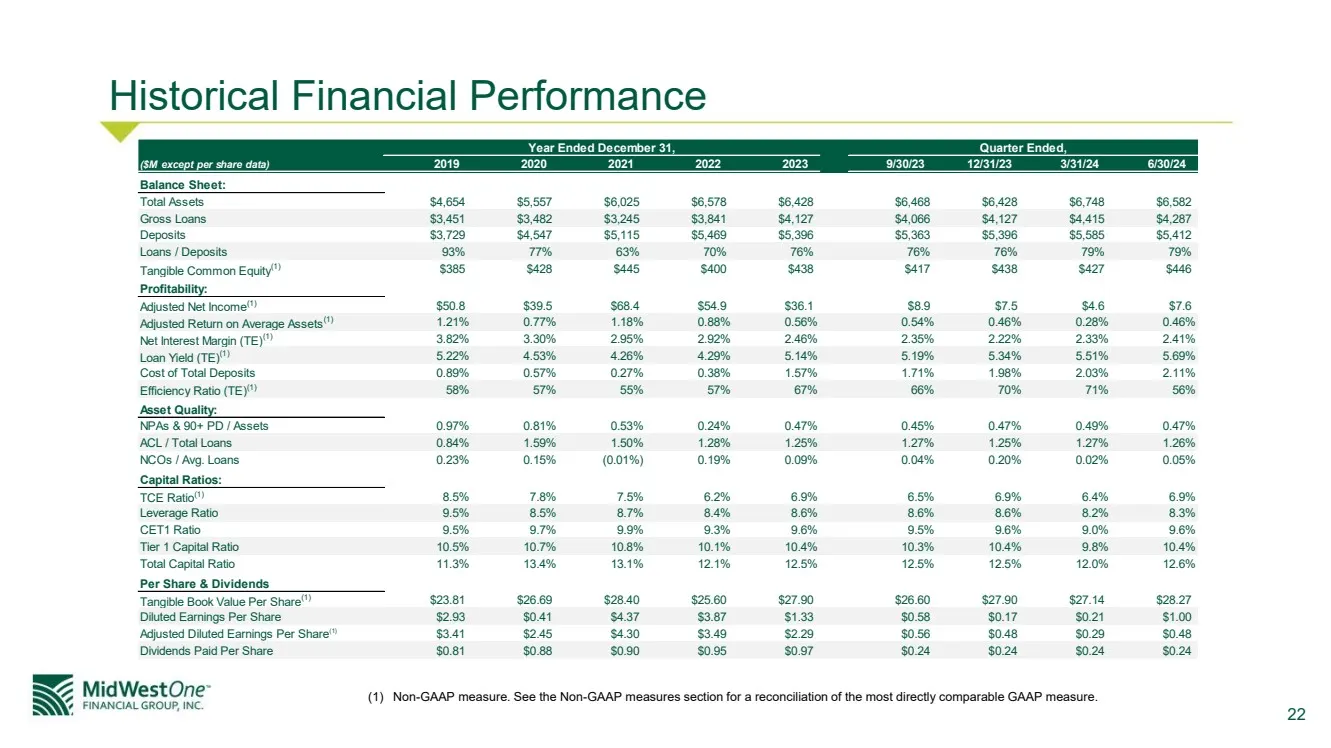
22 Historical Financial Performance Year Ended December 31, Quarter Ended, ($M except per share data) 2019 2020 2021 2022 2023 9/30/23 12/31/23 3/31/24 6/30/24 Balance Sheet: Total Assets $4,654 $5,557 $6,025 $6,578 $6,428 $6,468 $6,428 $6,748 $6,582 Gross Loans $3,451 $3,482 $3,245 $3,841 $4,127 $4
Slide 23: Review of Securities Portfolio Accounting Treatment
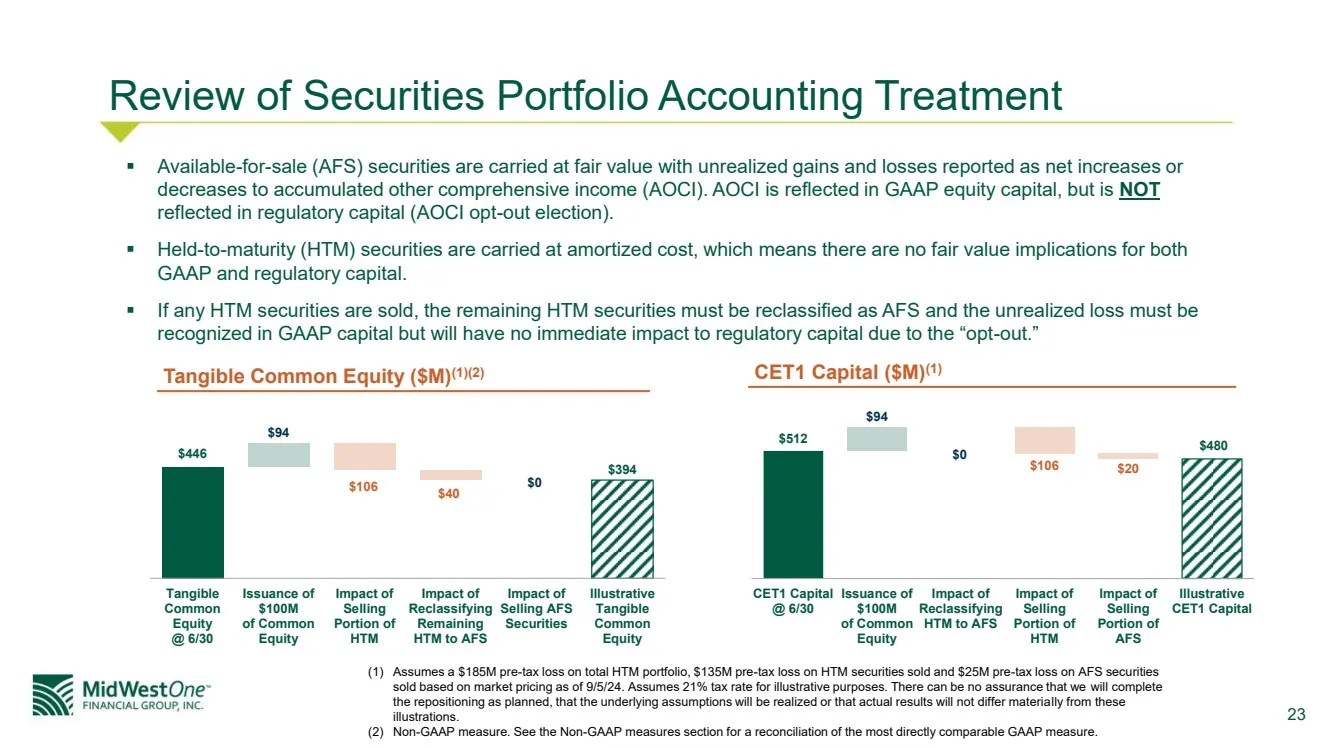
23 $512 $480 $94 $0 $106 $20 CET1 Capital @ 6/30 Issuance of $100M of Common Equity Impact of Reclassifying HTM to AFS Impact of Selling Portion of HTM Impact of Selling Portion of AFS Illustrative CET1 Capital $446 $0 $394 $94 $106 $40 Tangible Common Equity @ 6/30 Issuance of $100M of Common Equit
Slide 24: Earnings Per Share Non-GAAP Reconciliation
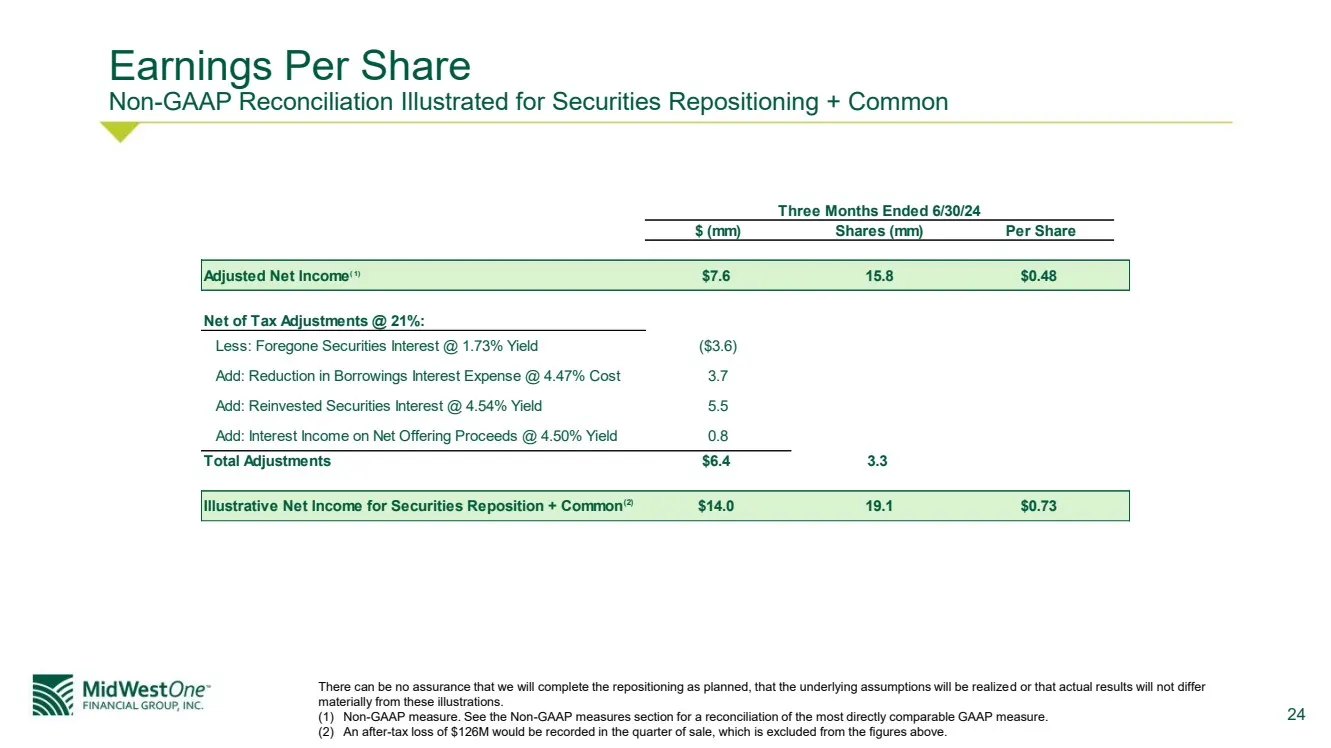
24 Three Months Ended 6/30/24 $ (mm) Shares (mm) Per Share Adjusted Net Income( 1) $7.6 15.8 $0.48 Net of Tax Adjustments @ 21%: Less: Foregone Securities Interest @ 1.73% Yield ($3.6) Add: Reduction in Borrowings Interest Expense @ 4.47% Cost 3.7 Add: Reinvested Securities Interest @ 4.54% Yield 5.
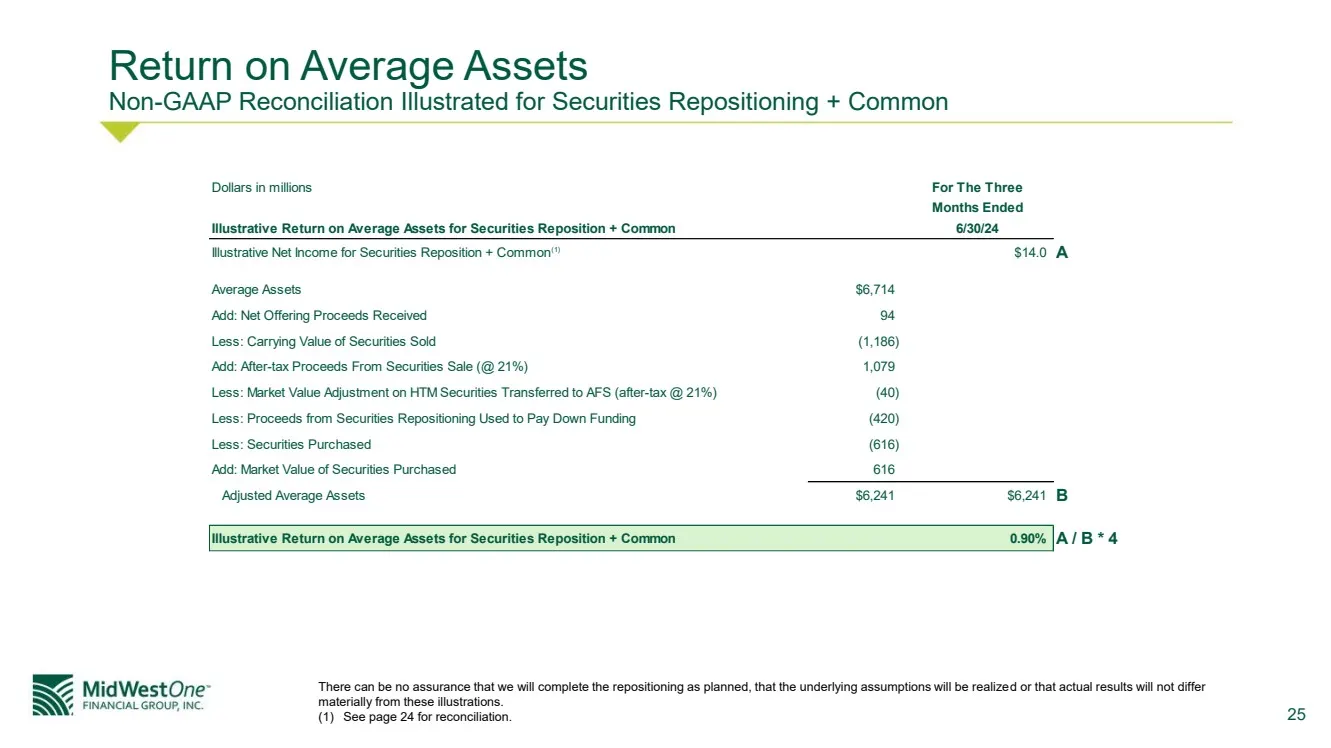
Slide 25: Return on Average Assets Non-GAAP Reconciliation
25 Dollars in millions For The Three Months Ended Illustrative Return on Average Assets for Securities Reposition + Common 6/30/24 Illustrative Net Income for Securities Reposition + Common(1) $14.0 A Average Assets $6,714 Add: Net Offering Proceeds Received 94 Less: Carrying Value of Securities Sol
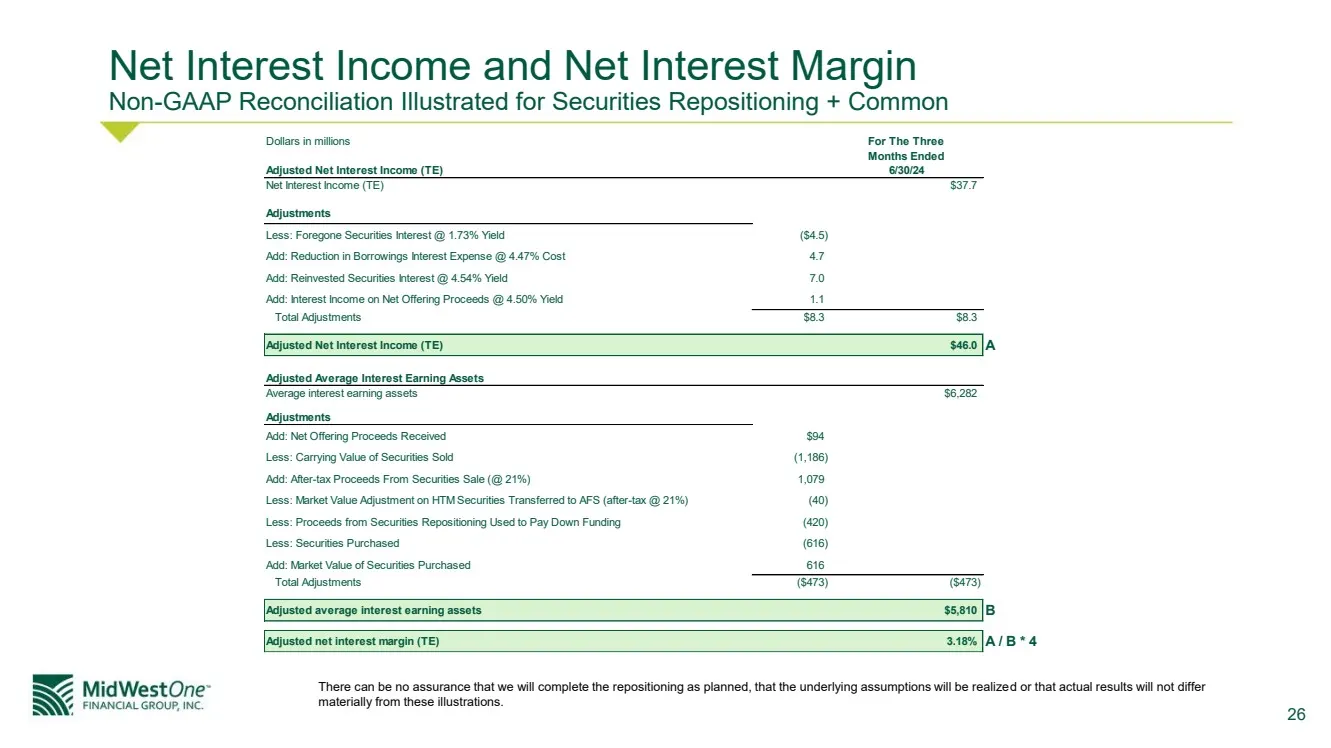
Slide 26: Adjusted Net Interest Income and Margin Reconciliation
26 Dollars in millions For The Three Months Ended Adjusted Net Interest Income (TE) 6/30/24 Net Interest Income (TE) $37.7 Adjustments Less: Foregone Securities Interest @ 1.73% Yield ($4.5) Add: Reduction in Borrowings Interest Expense @ 4.47% Cost 4.7 Add: Reinvested Securities Interest @ 4.54% Yi
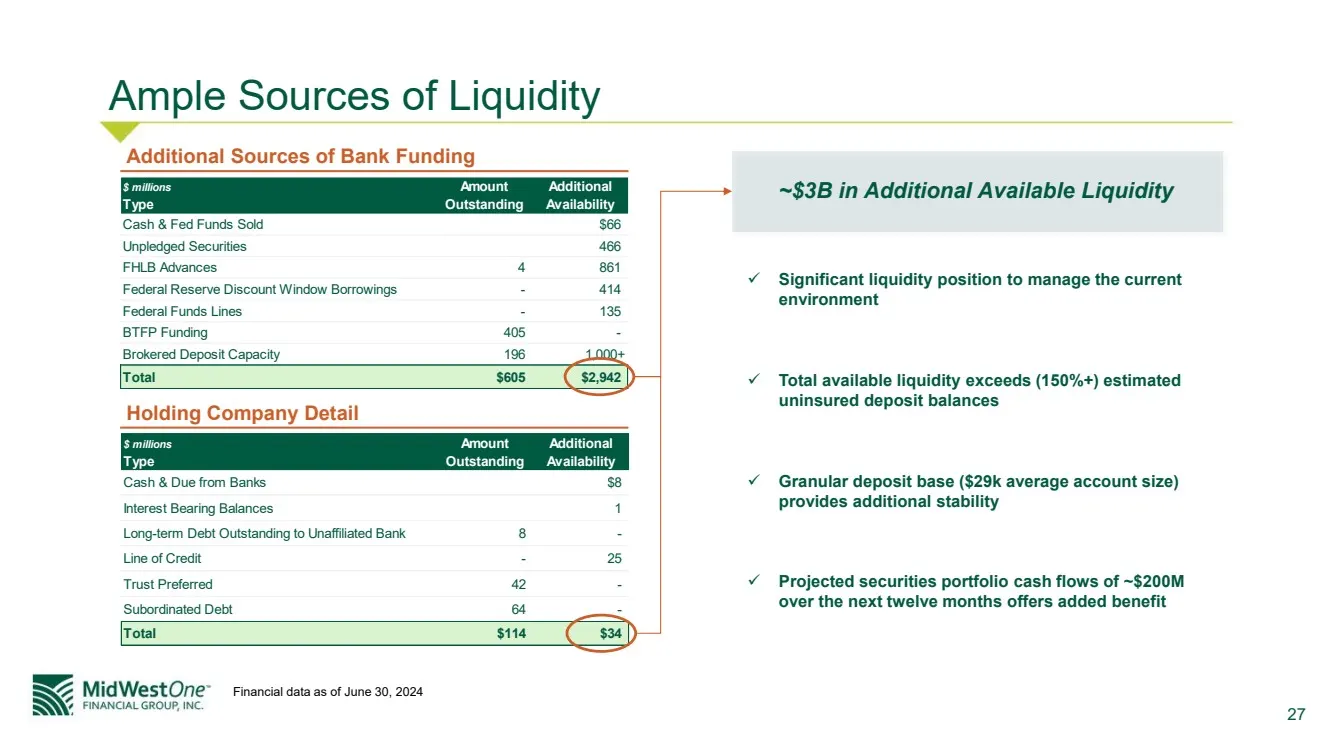
Slide 27: Ample Sources of Liquidity
27 Ample Sources of Liquidity Additional Sources of Bank Funding Holding Company Detail Financial data as of June 30, 2024 $ millions Amount Additional Type Outstanding Availability Cash & Fed Funds Sold $66 Unpledged Securities 466 FHLB Advances 4 861 Federal Reserve Discount Window Borrowings - 41
Slide 28: Non-GAAP Financial Measures
28 Non-GAAP Financial Measures
Slide 29: Non-GAAP Financial Measures: Efficiency Ratio
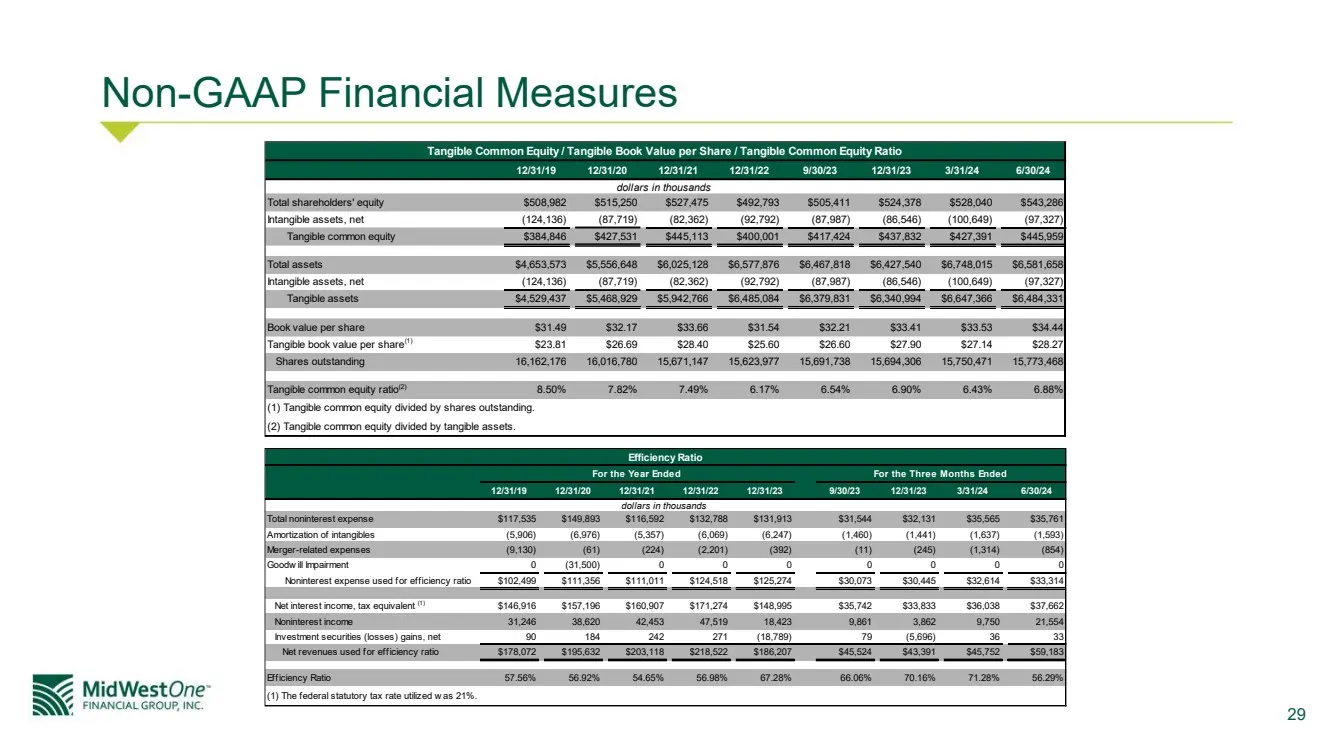
29 Non-GAAP Financial Measures Efficiency Ratio For the Year Ended For the Three Months Ended 12/31/19 12/31/20 12/31/21 12/31/22 12/31/23 9/30/23 12/31/23 3/31/24 6/30/24 dollars in thousands Total noninterest expense $117,535 $149,893 $116,592 $132,788 $131,913 $31,544 $32,131 $35,565 $35,761 Amor
Slide 30: Non-GAAP Financial Measures: Net Interest Margin, Tax Equivalent
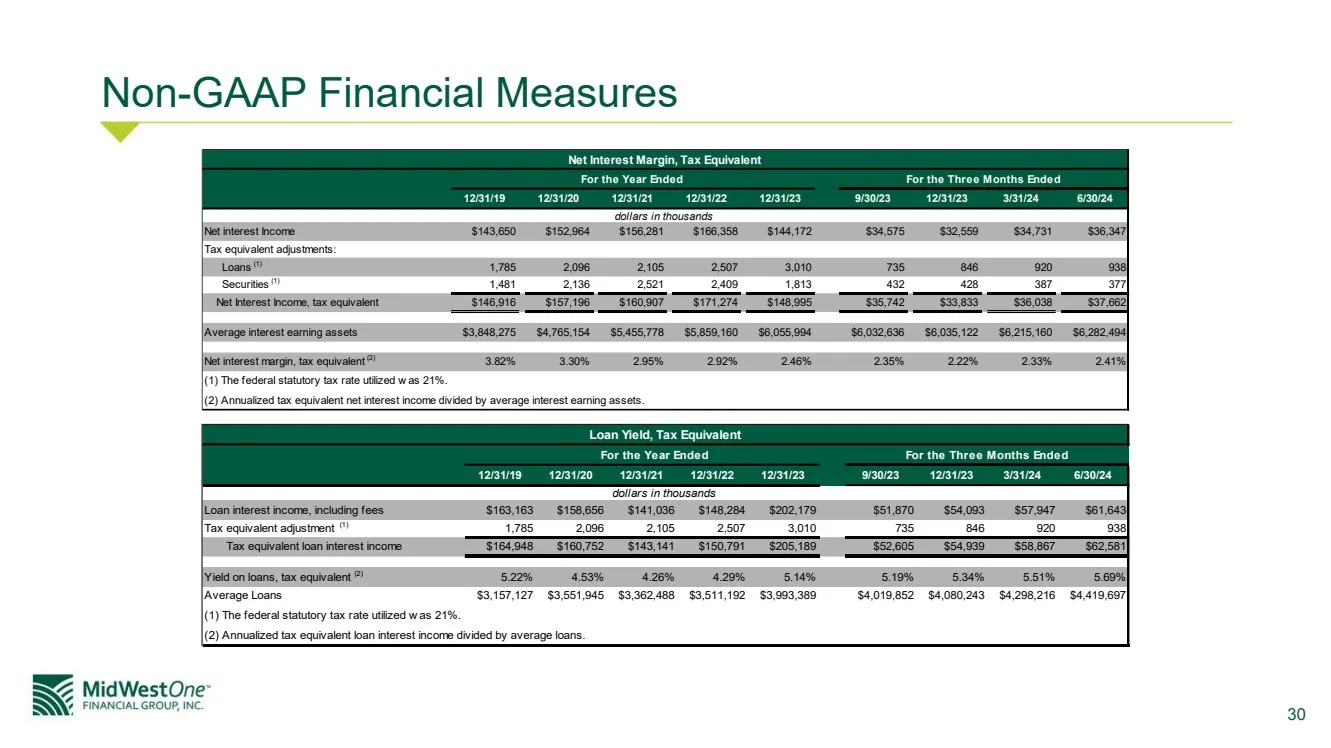
30 Non-GAAP Financial Measures Net Interest Margin, Tax Equivalent For the Year Ended For the Three Months Ended 12/31/19 12/31/20 12/31/21 12/31/22 12/31/23 9/30/23 12/31/23 3/31/24 6/30/24 dollars in thousands Net interest Income $143,650 $152,964 $156,281 $166,358 $144,172 $34,575 $32,559 $34,731
Slide 31: Non-GAAP Financial Measures: Adjusted Net Income and ROAA
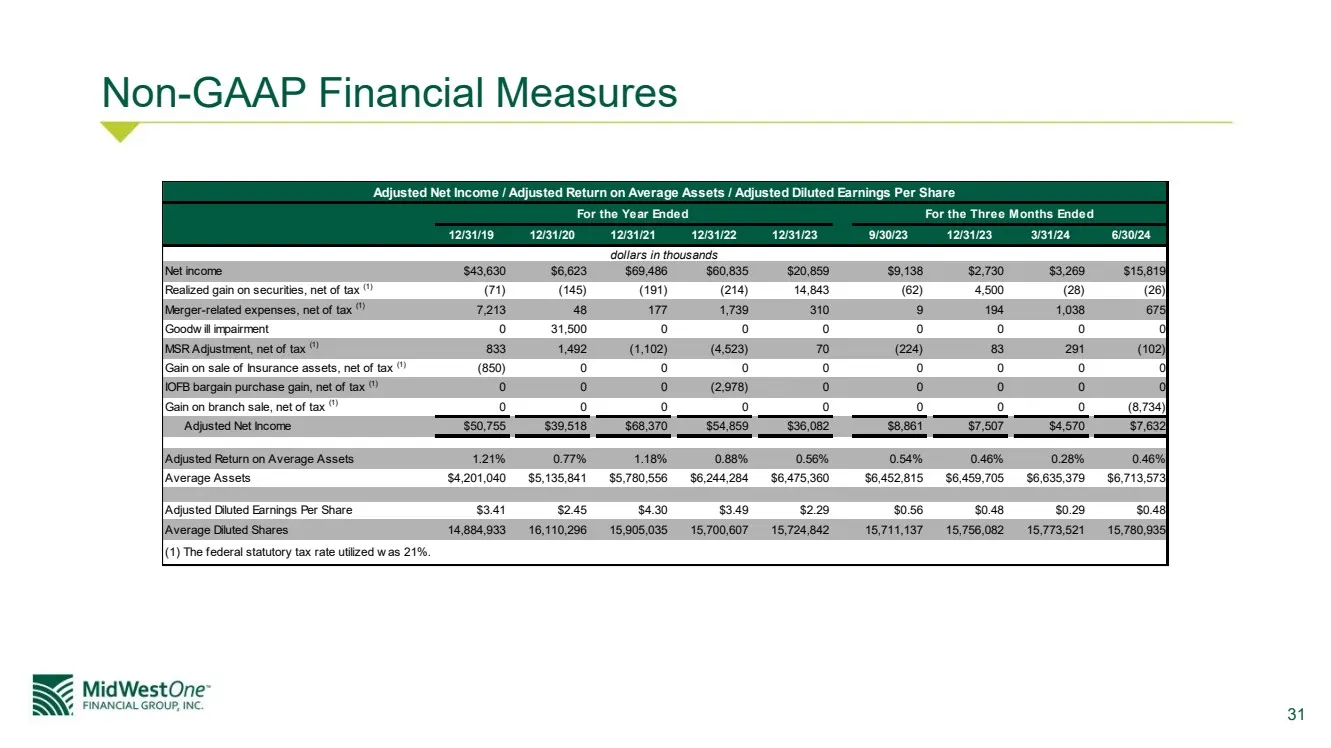
31 Non-GAAP Financial Measures Adjusted Net Income / Adjusted Return on Average Assets / Adjusted Diluted Earnings Per Share For the Year Ended For the Three Months Ended 12/31/19 12/31/20 12/31/21 12/31/22 12/31/23 9/30/23 12/31/23 3/31/24 6/30/24 dollars in thousands Net income $43,630 $6,623 $69,
Source: SEC EDGAR · FWP filed Sep 26, 2024
More decks from MidWestOne Financial Group Inc
 Q3 2025 Earnings Presentation18 slides · Oct 23, 2025
 Merger or Acquisition (October 2025)20 slides · Oct 23, 2025
 Q2 2025 Earnings Presentation32 slides · Jul 25, 2025
 Q2 2025 Earnings Presentation18 slides · Jul 25, 2025
 Investor Presentation (April 2025)31 slides · Apr 28, 2025
 Q1 2025 Earnings Presentation17 slides · Apr 25, 2025