NHPC Limited · NSE:NHPC
NHPC — Analysts'/Investors' Conference (May 2013)
24 slides from NHPC's conference presentation, May 30, 2013
Slide 1: Welcome to Analysts'/Investors' Conference
Slide 2: Hydro Scenario in India NHPC Overview Investment Plan
Hydro Scenario in India NHPC Overview Investment Plan Financial Highlights
Slide 3: Hydro Scenario in India
Hydro Scenario in India
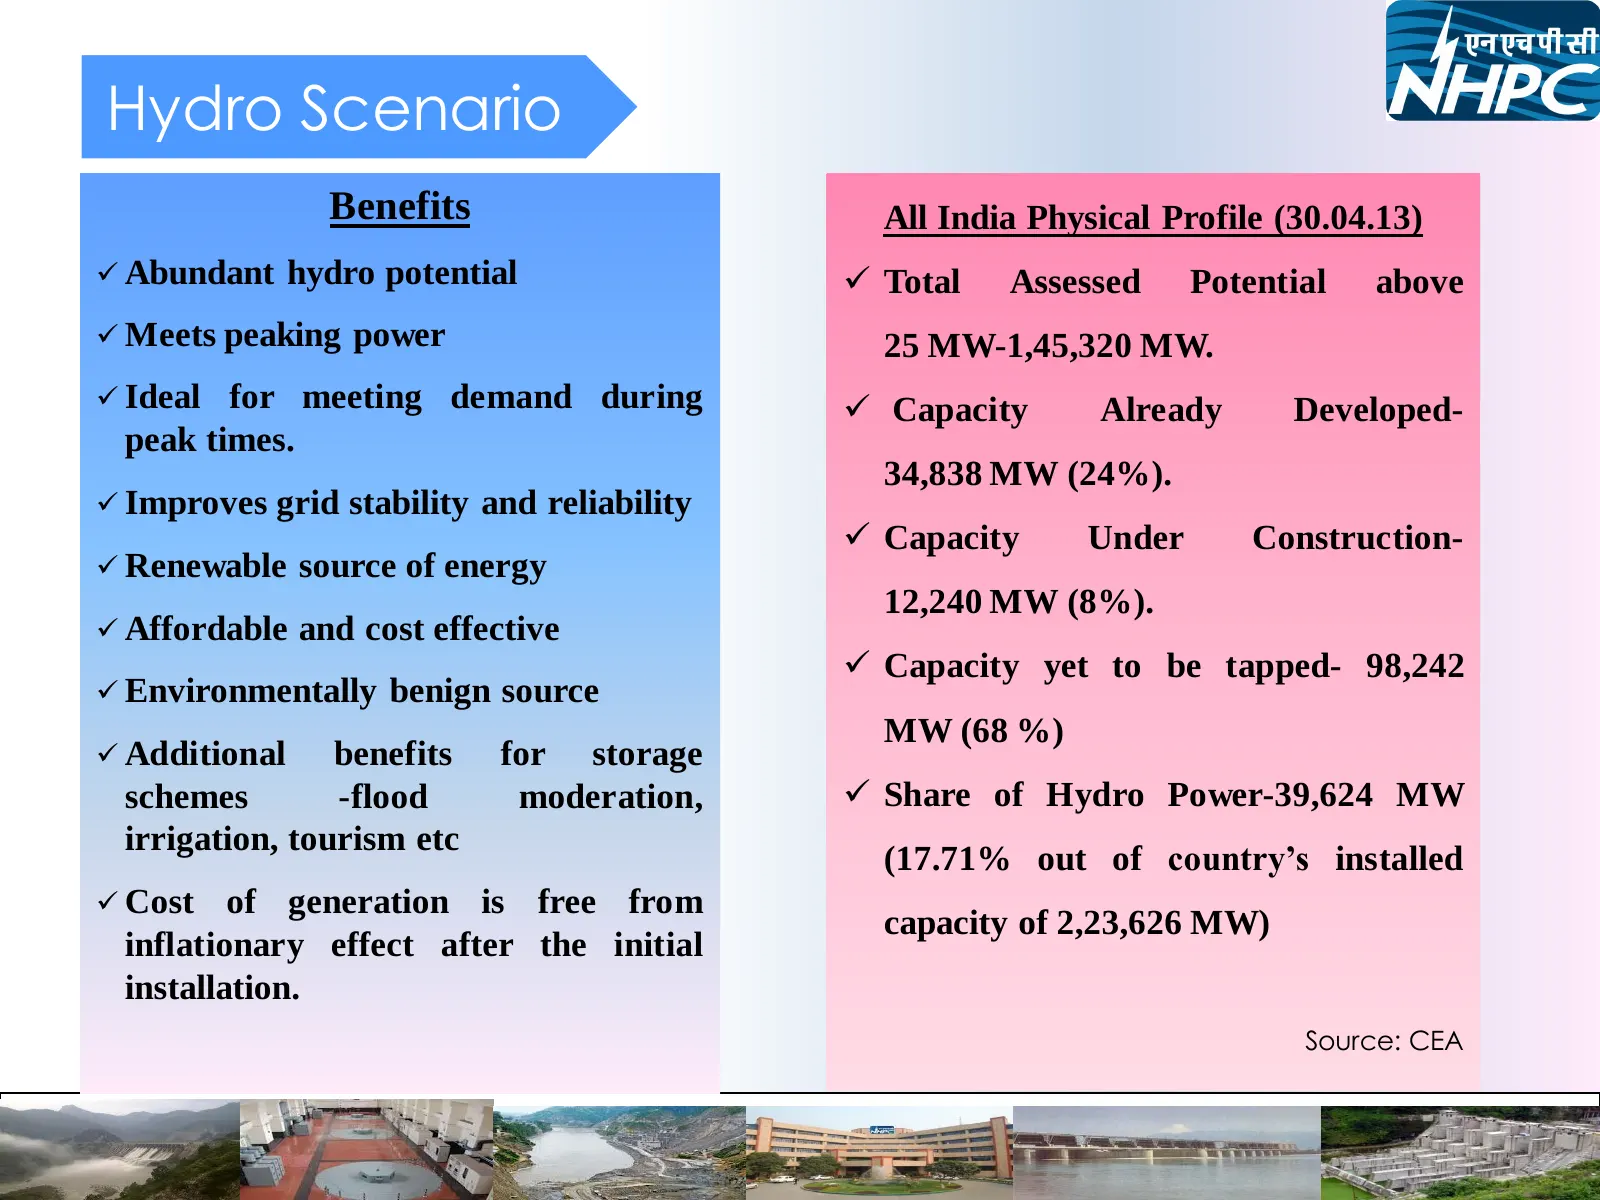
Slide 4: Hydro Scenario
Hydro Scenario Benefits All India Physical Profile (30.04.13) Abundant hydro potential Total Assessed Potential above Meets peaking power 25 MW-1,45,320 MW. Ideal for meeting demand during Capacity Already Developed- peak times. 34,838 MW (24%). Improves grid stability and reliability
Slide 5: NHPC Overview
NHPC Overview
Slide 6: Projects Awaiting Clearances – Standalone 5 Nos. (5115 MW) Projects Awaiting Clearances – Joint
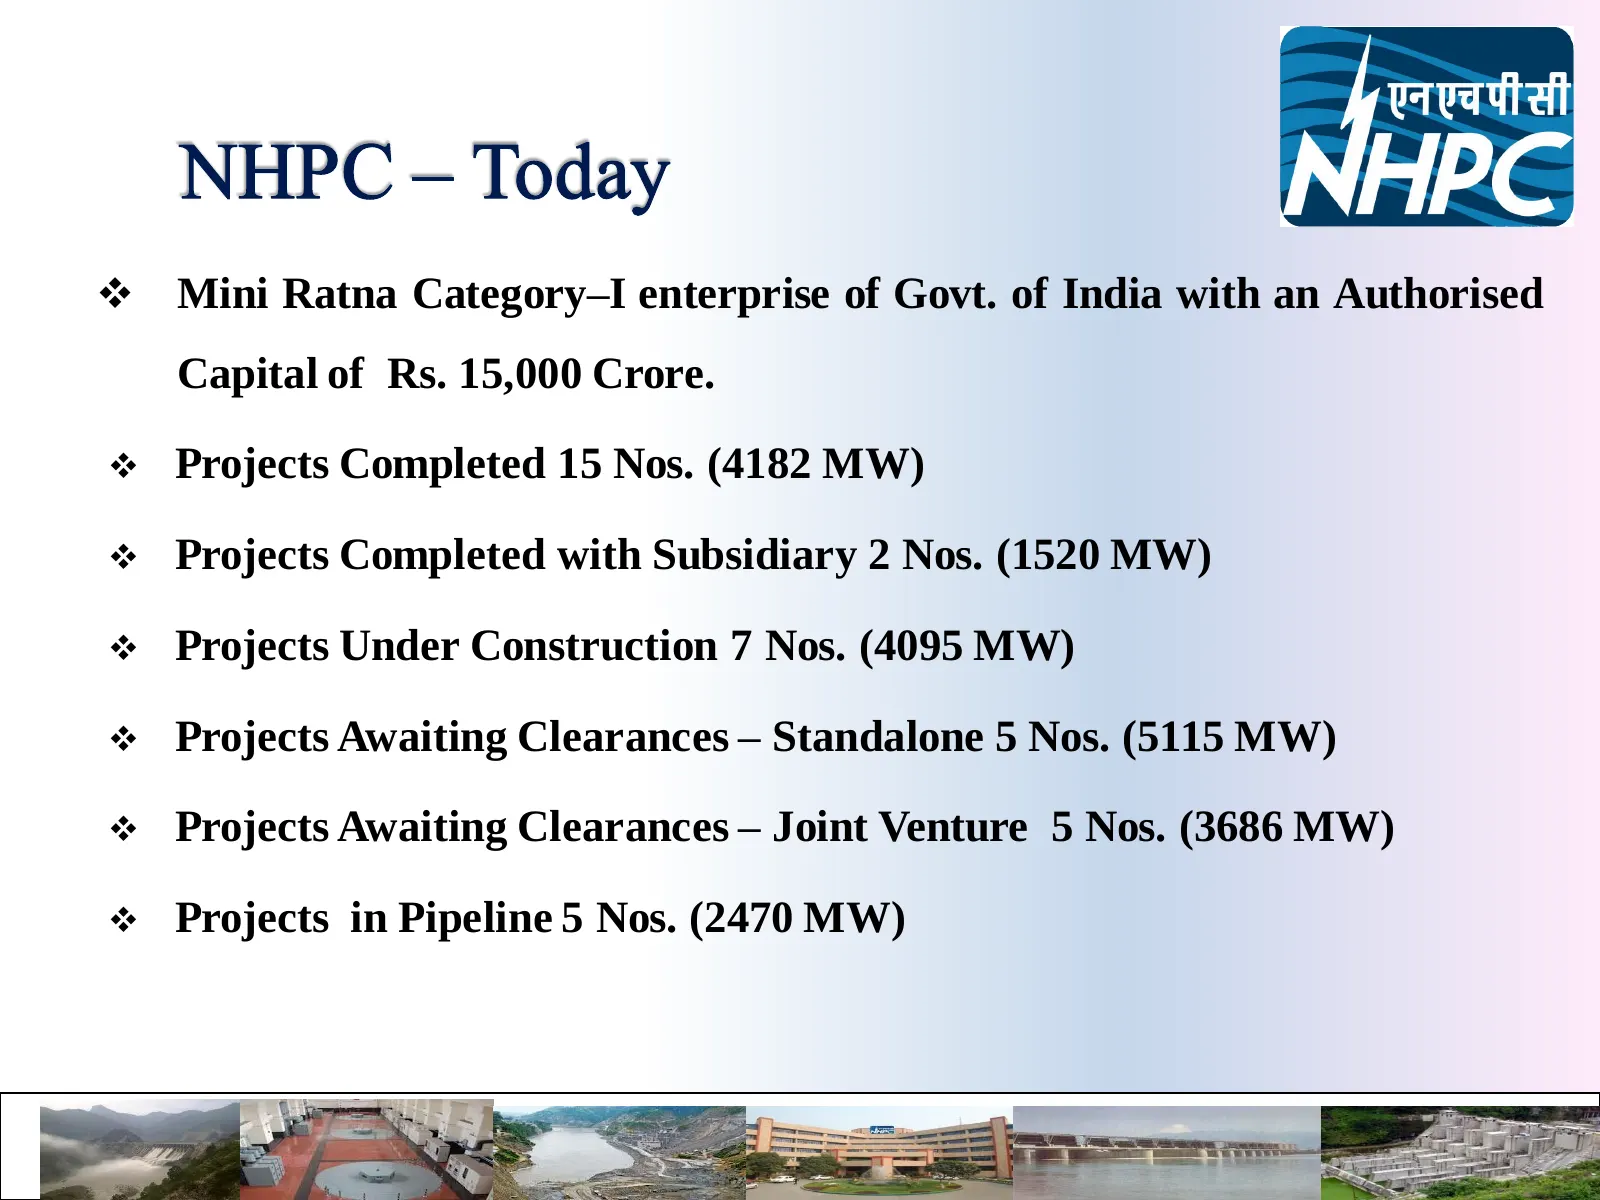
Mini Ratna Category–I enterprise of Govt. of India with an Authorised Capital of Rs. 15,000 Crore. Projects Completed 15 Nos. (4182 MW) Projects Completed with Subsidiary 2 Nos. (1520 MW) Projects Under Construction 7 Nos. (4095 MW) Projects Awaiting Clearances – Standalone 5 Nos. (5115 MW
Slide 7: NHPC's Track Record
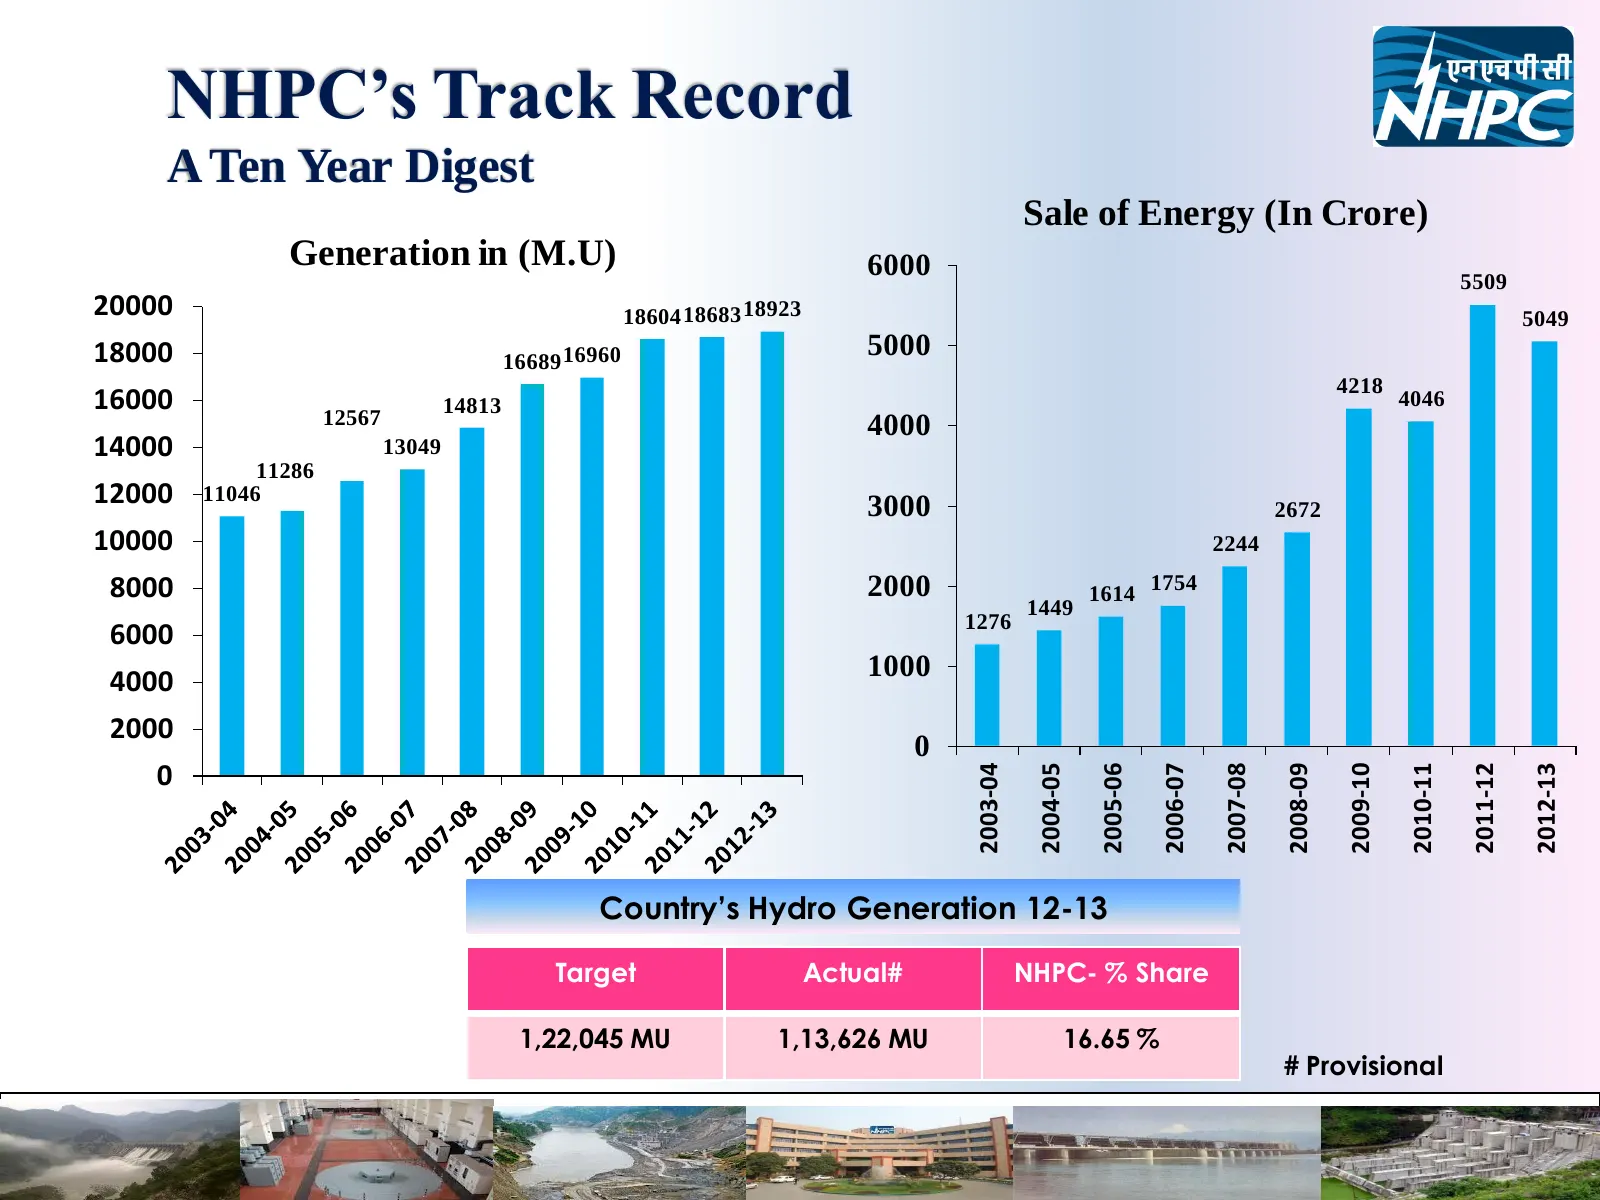
NHPC’s Track Record A Ten Year Digest Sale of Energy (In Crore) Generation in (M.U) 6000 5509 20000 18604 18683 18923 5049 18000 16689 16960 5000 4218 16000 14813 4046 12567 4000 14000 13049 11286 12000 11046 3000 2672 10000 2244 8000 2000 1614 1754 1449 1276 6000 4000 1000 2000 0 0 2003-04 2005-06
Slide 8: NHPC's Track Record
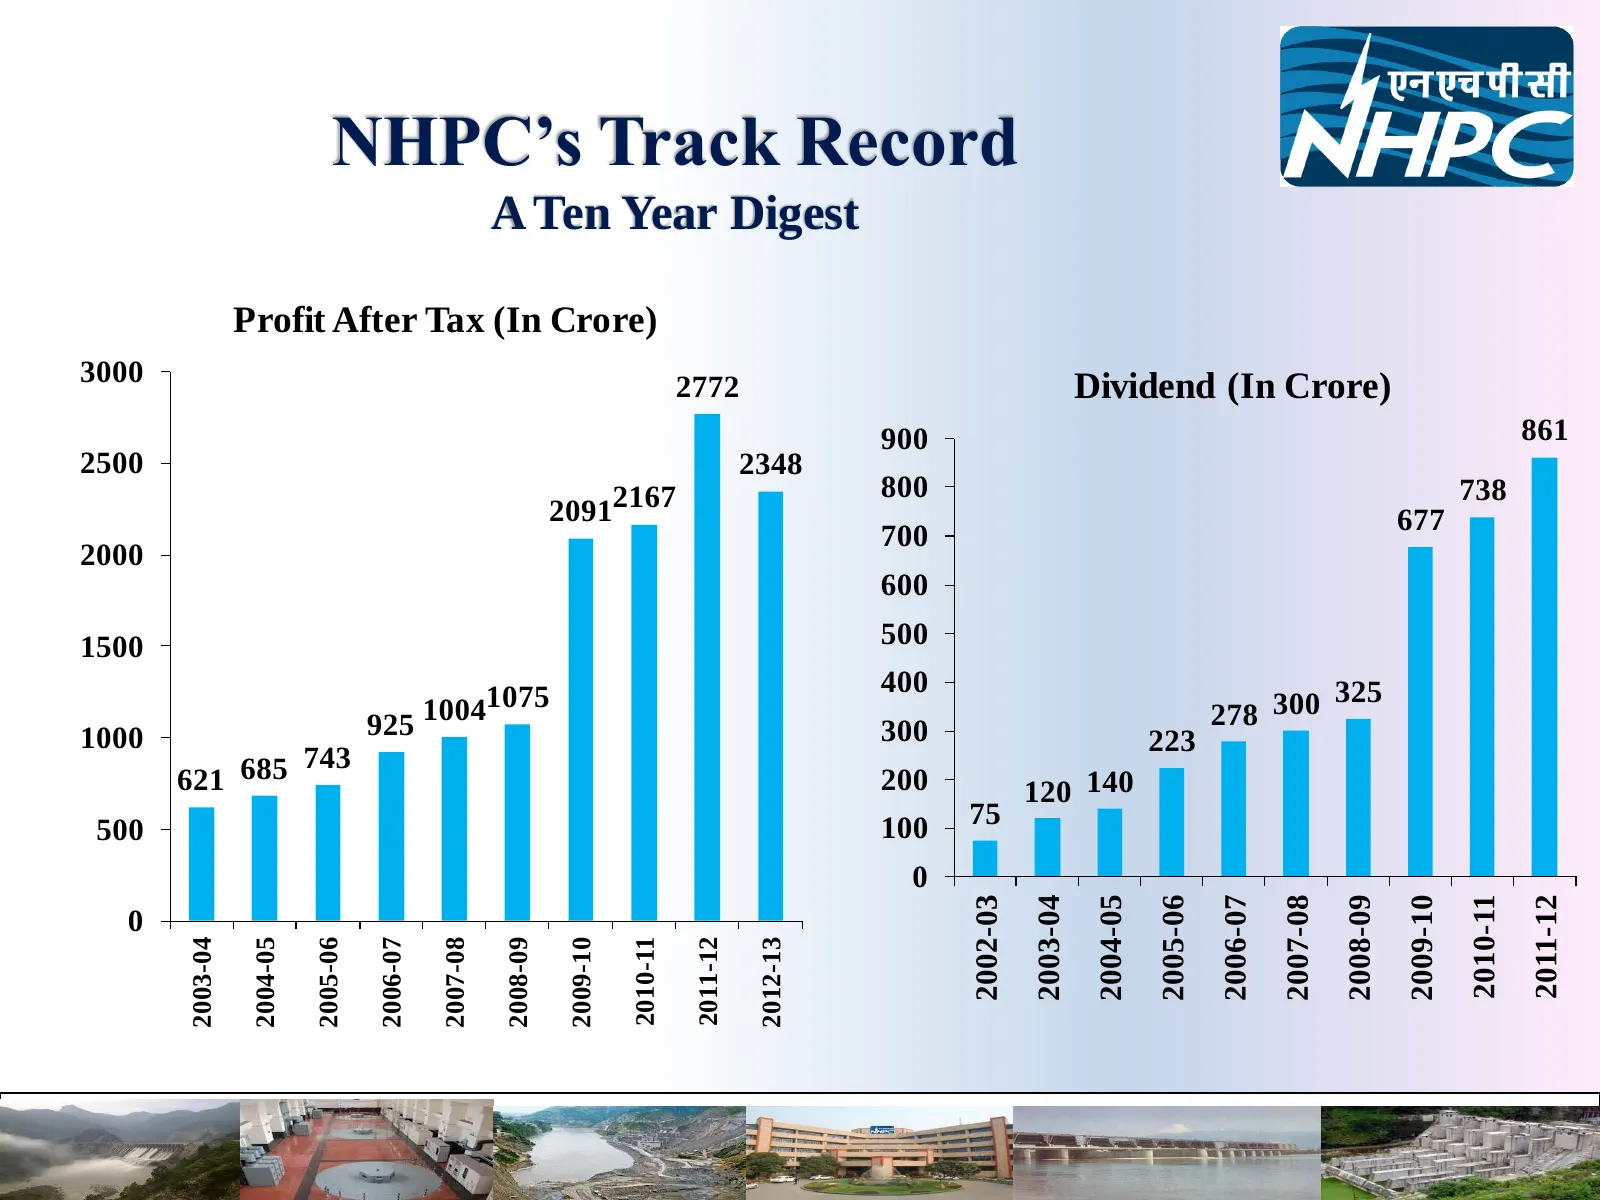
NHPC’s Track Record A Ten Year Digest Profit After Tax (In Crore) 3000 2772 Dividend (In Crore) 900 861 2500 2348 800 738 20912167 677 700 2000 600 1500 500 1075 400 325 925 1004 278 300 1000 300 223 621 685 743 200 120 140 100 75 500 0 2002-03 2003-04 2006-07 2007-08 2004-05 2005-06 2008-09 2009-10
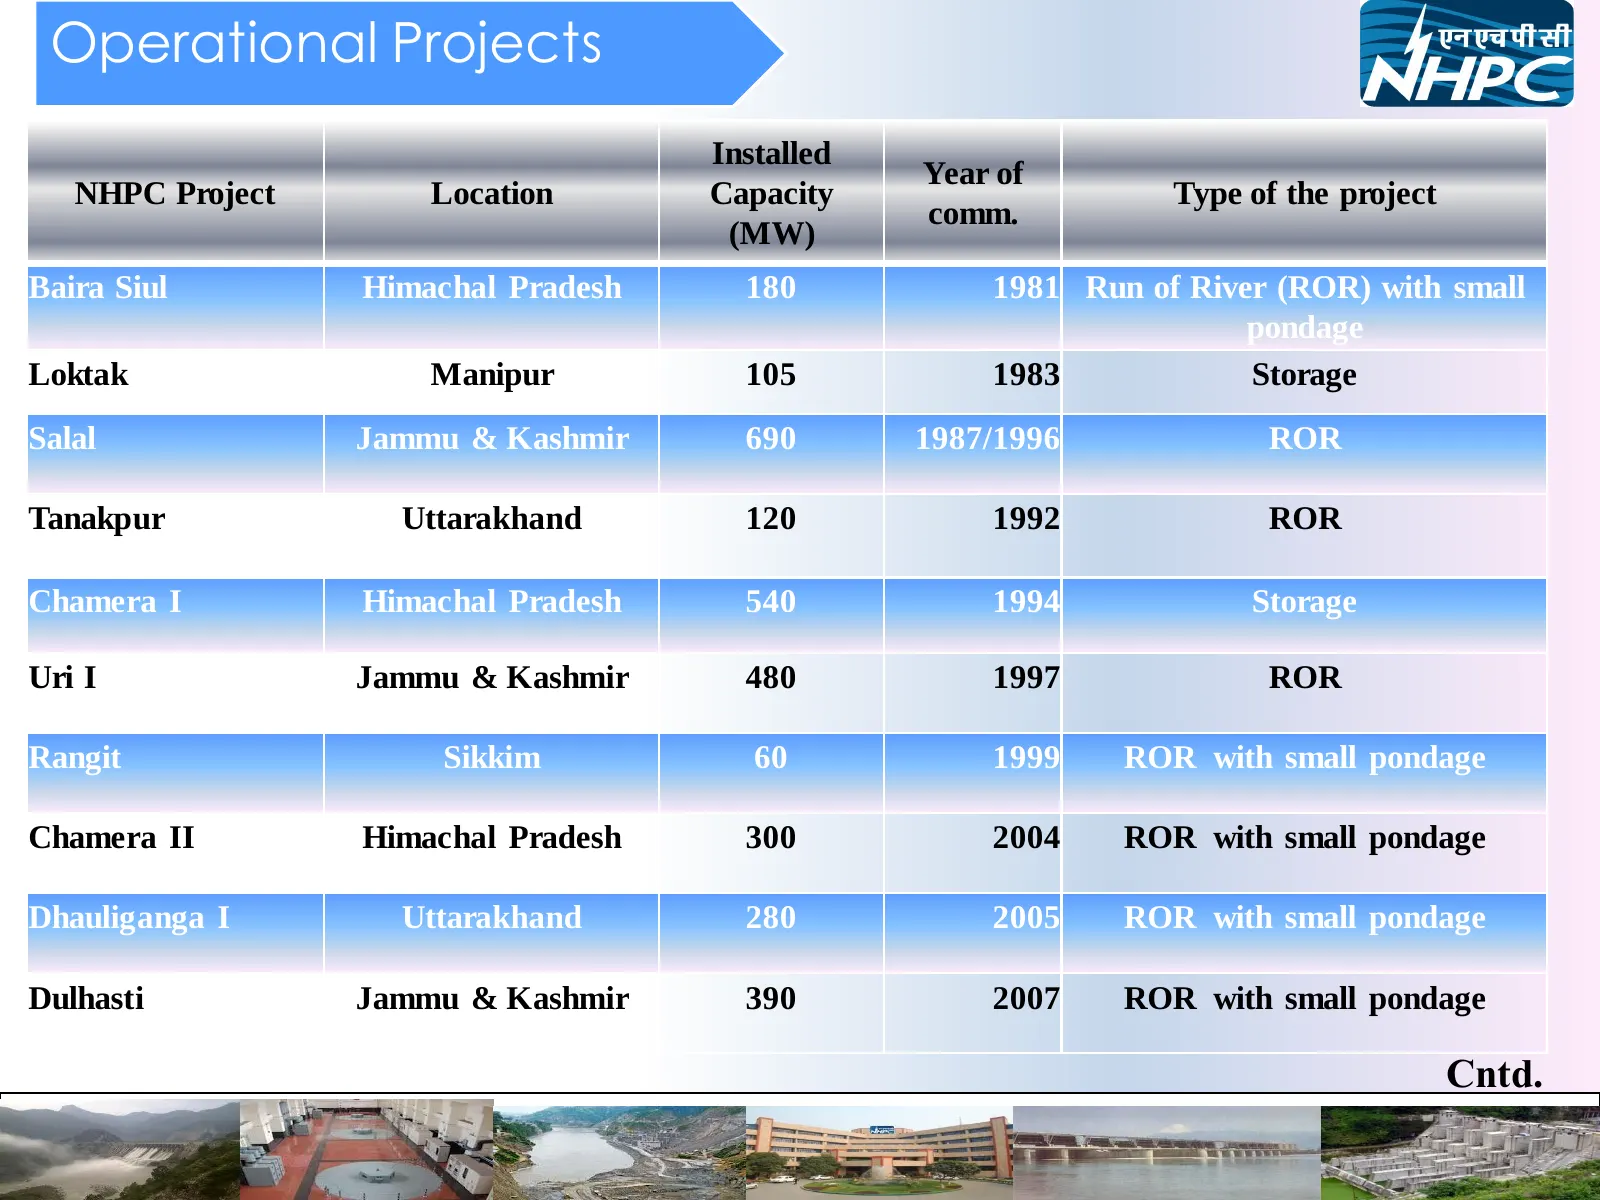
Slide 9: Operational Projects
Operational Projects Installed Year of NHPC Project Location Capacity Type of the project comm. (MW) Baira Siul Himachal Pradesh 180 1981 Run of River (ROR) with small pondage Loktak Manipur 105 1983 Storage Salal Jammu & Kashmir 690 1987/1996 ROR Tanakpur Uttarakhand 120 1992 ROR Chamera I Himachal
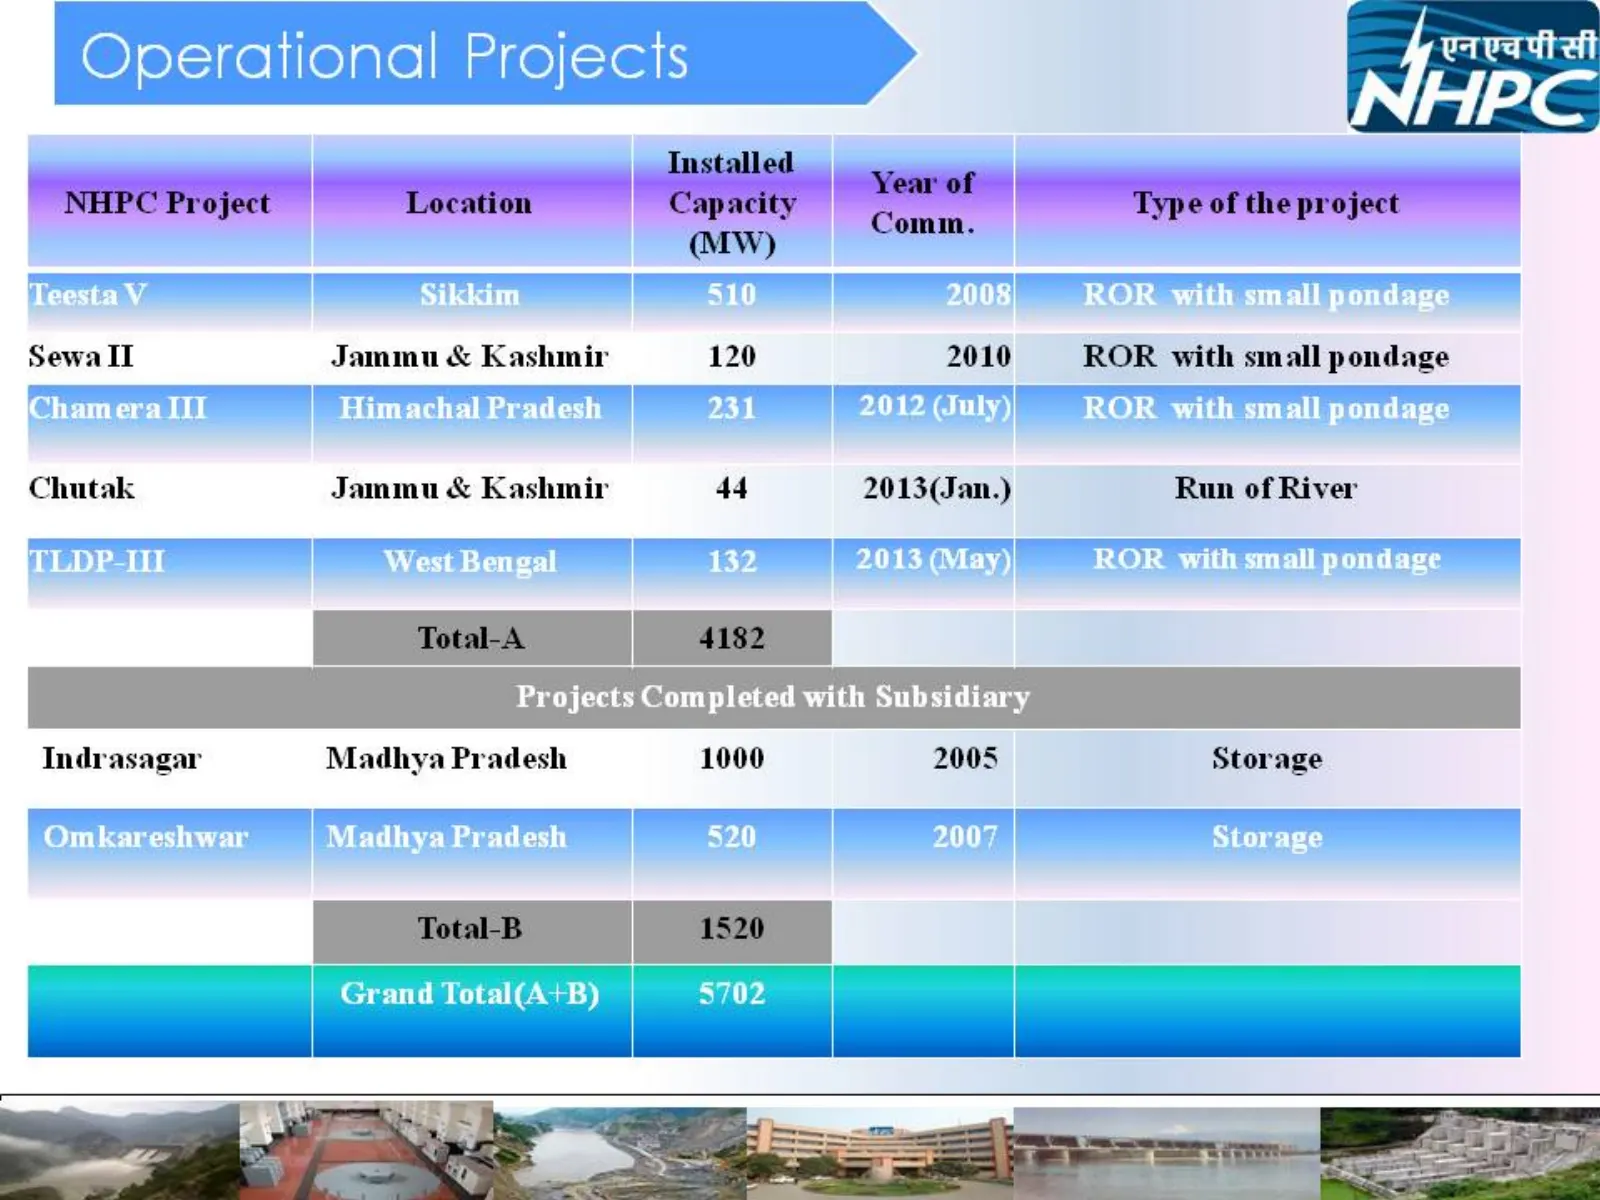
Slide 10: Operational Projects (continued)
©) ti | Project vavattelt Installed aeuenei NHPC Project Location Capacity i Type of the project Comm. (Ww) Sewa II Jammu & Kashmir 120 2010 ROR with small pondage Chamera Il] Himachal Prad R Chutak Jammu & Kashmir 44 2013(Jan.) Run of River Projects Completed with Subsidiary Indrasagar Madhya Prade
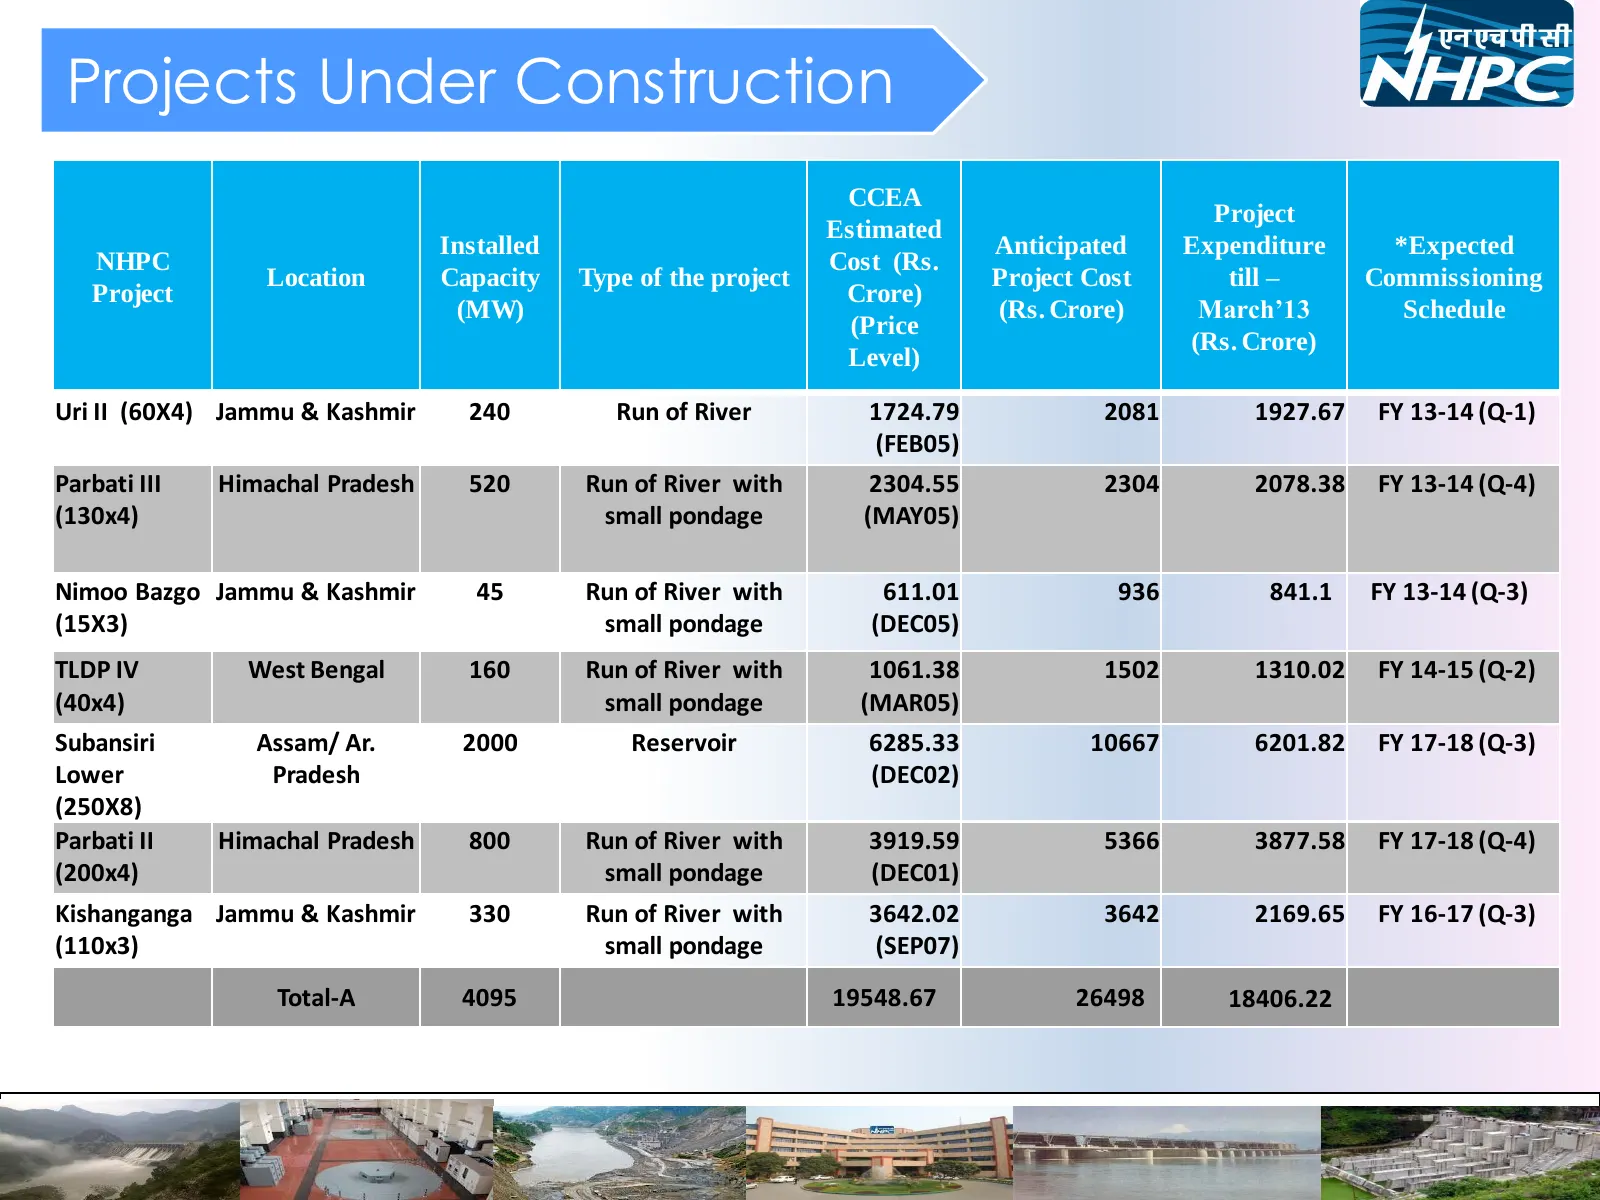
Slide 11: Projects Under Construction
Projects Under Construction CCEA Project Estimated Installed Anticipated Expenditure *Expected NHPC Cost (Rs. Location Capacity Type of the project Project Cost till – Commissioning Project Crore) (MW) (Rs. Crore) March’13 Schedule (Price (Rs. Crore) Level) Uri II (60X4) Jammu & Kashmir 240 Run of R
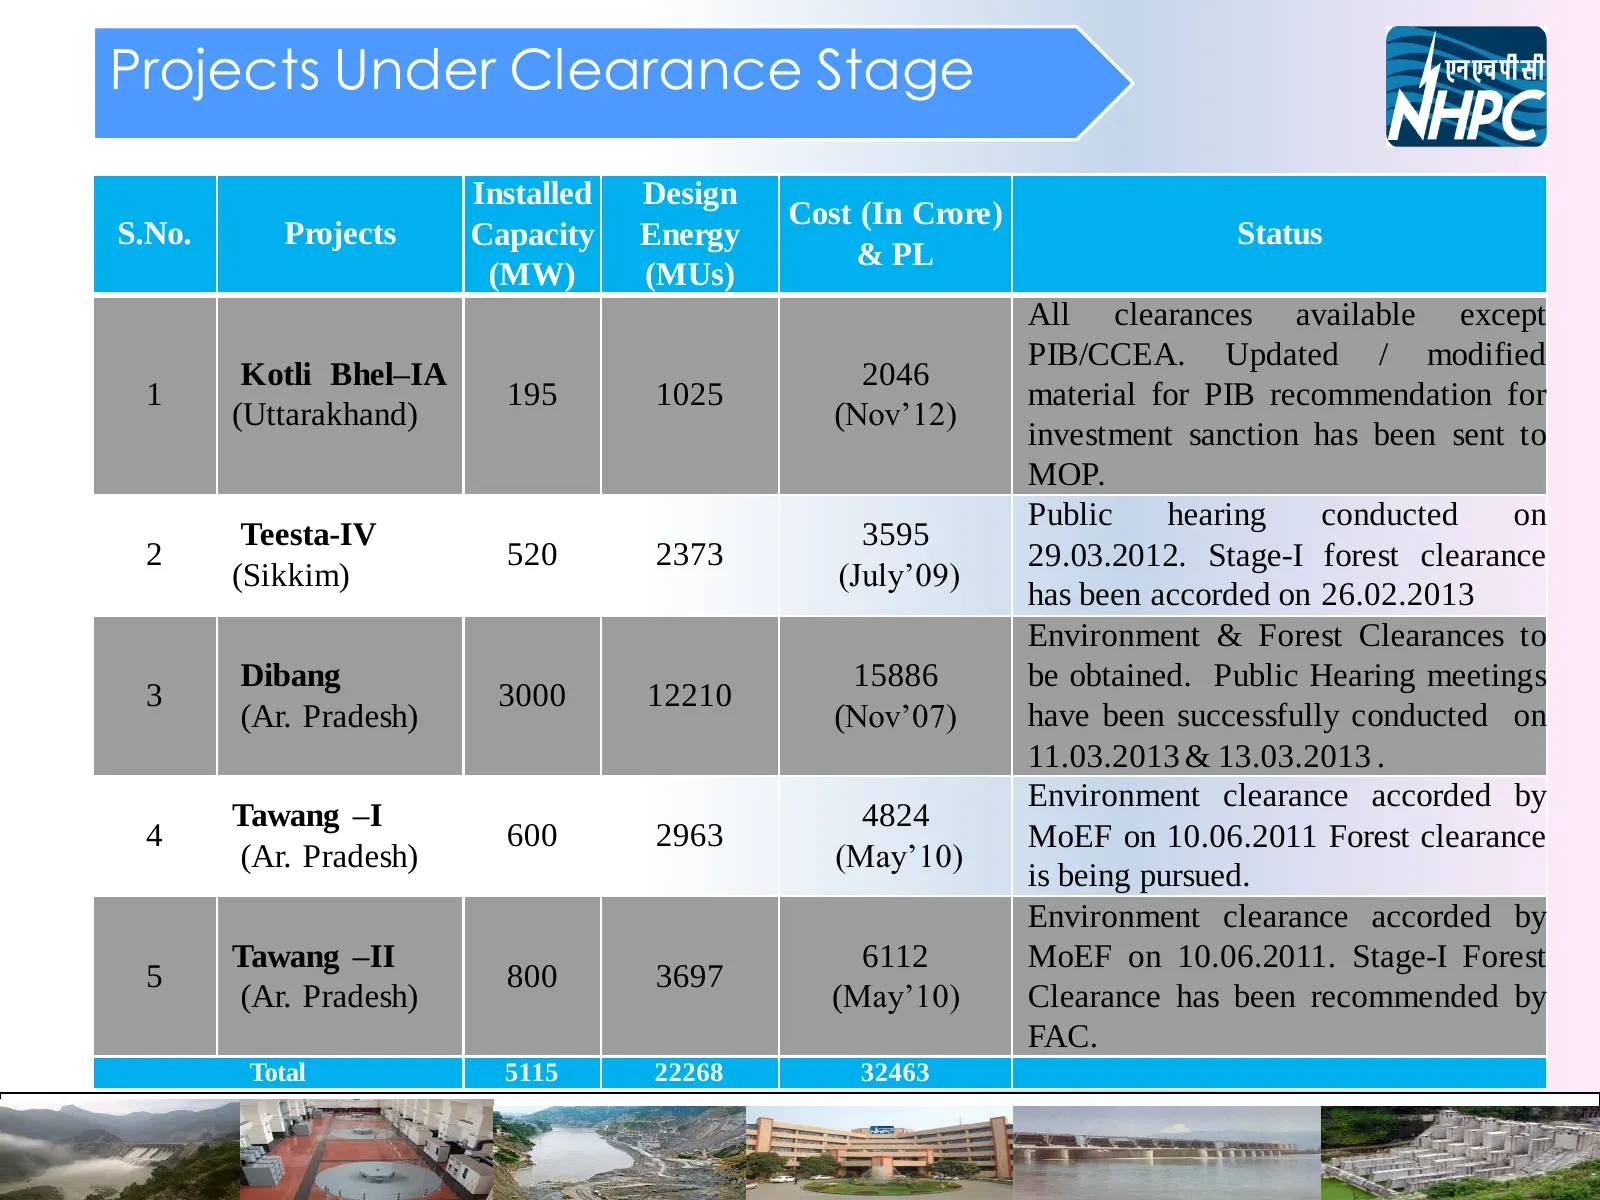
Slide 12: Projects Under Clearance Stage
Projects Under Clearance Stage Installed Design Cost (In Crore) S.No. Projects Capacity Energy Status & PL (MW) (MUs) All clearances available except PIB/CCEA. Updated / modified Kotli Bhel–IA 2046 1 195 1025 material for PIB recommendation for (Uttarakhand) (Nov’12) investment sanction has been sen
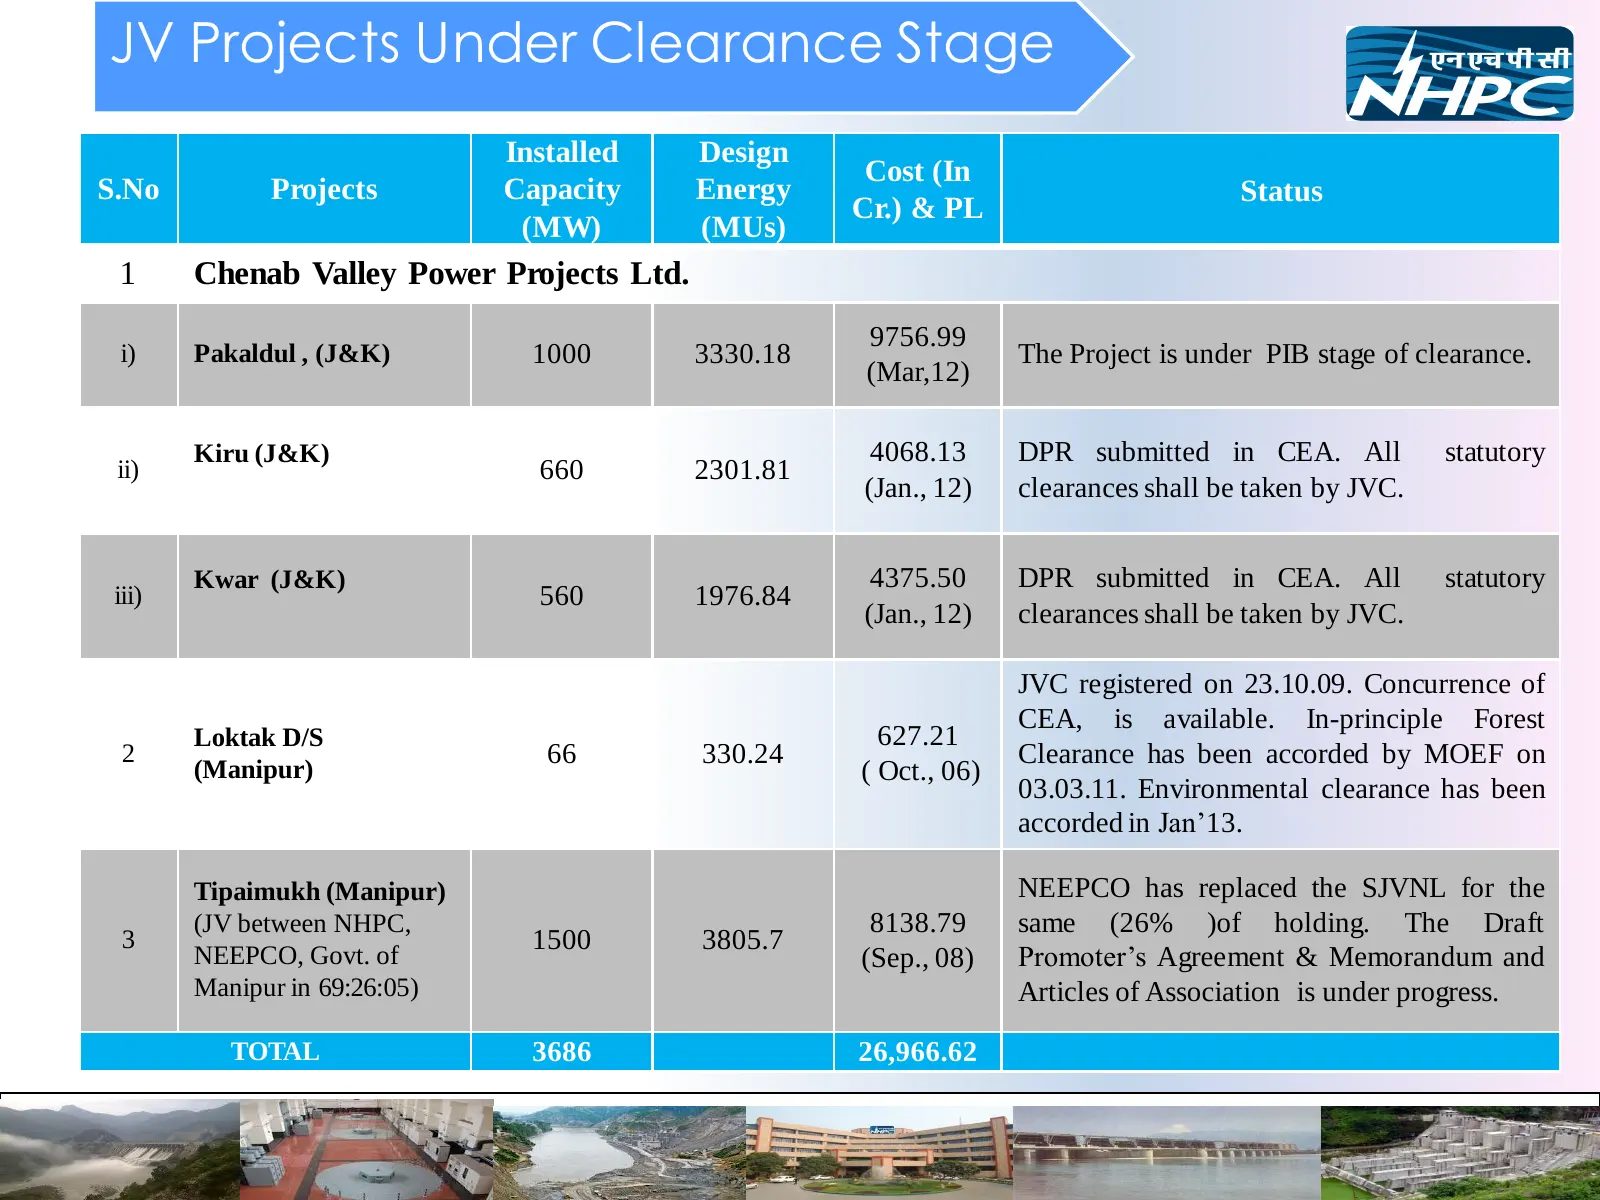
Slide 13: JV Projects Under Clearance Stage
JV Projects Under Clearance Stage Installed Design Cost (In S.No Projects Capacity Energy Status Cr.) & PL (MW) (MUs) 1 Chenab Valley Power Projects Ltd. 9756.99 i) Pakaldul , (J&K) 1000 3330.18 The Project is under PIB stage of clearance. (Mar,12) Kiru (J&K) 4068.13 DPR submitted in CEA. All statut
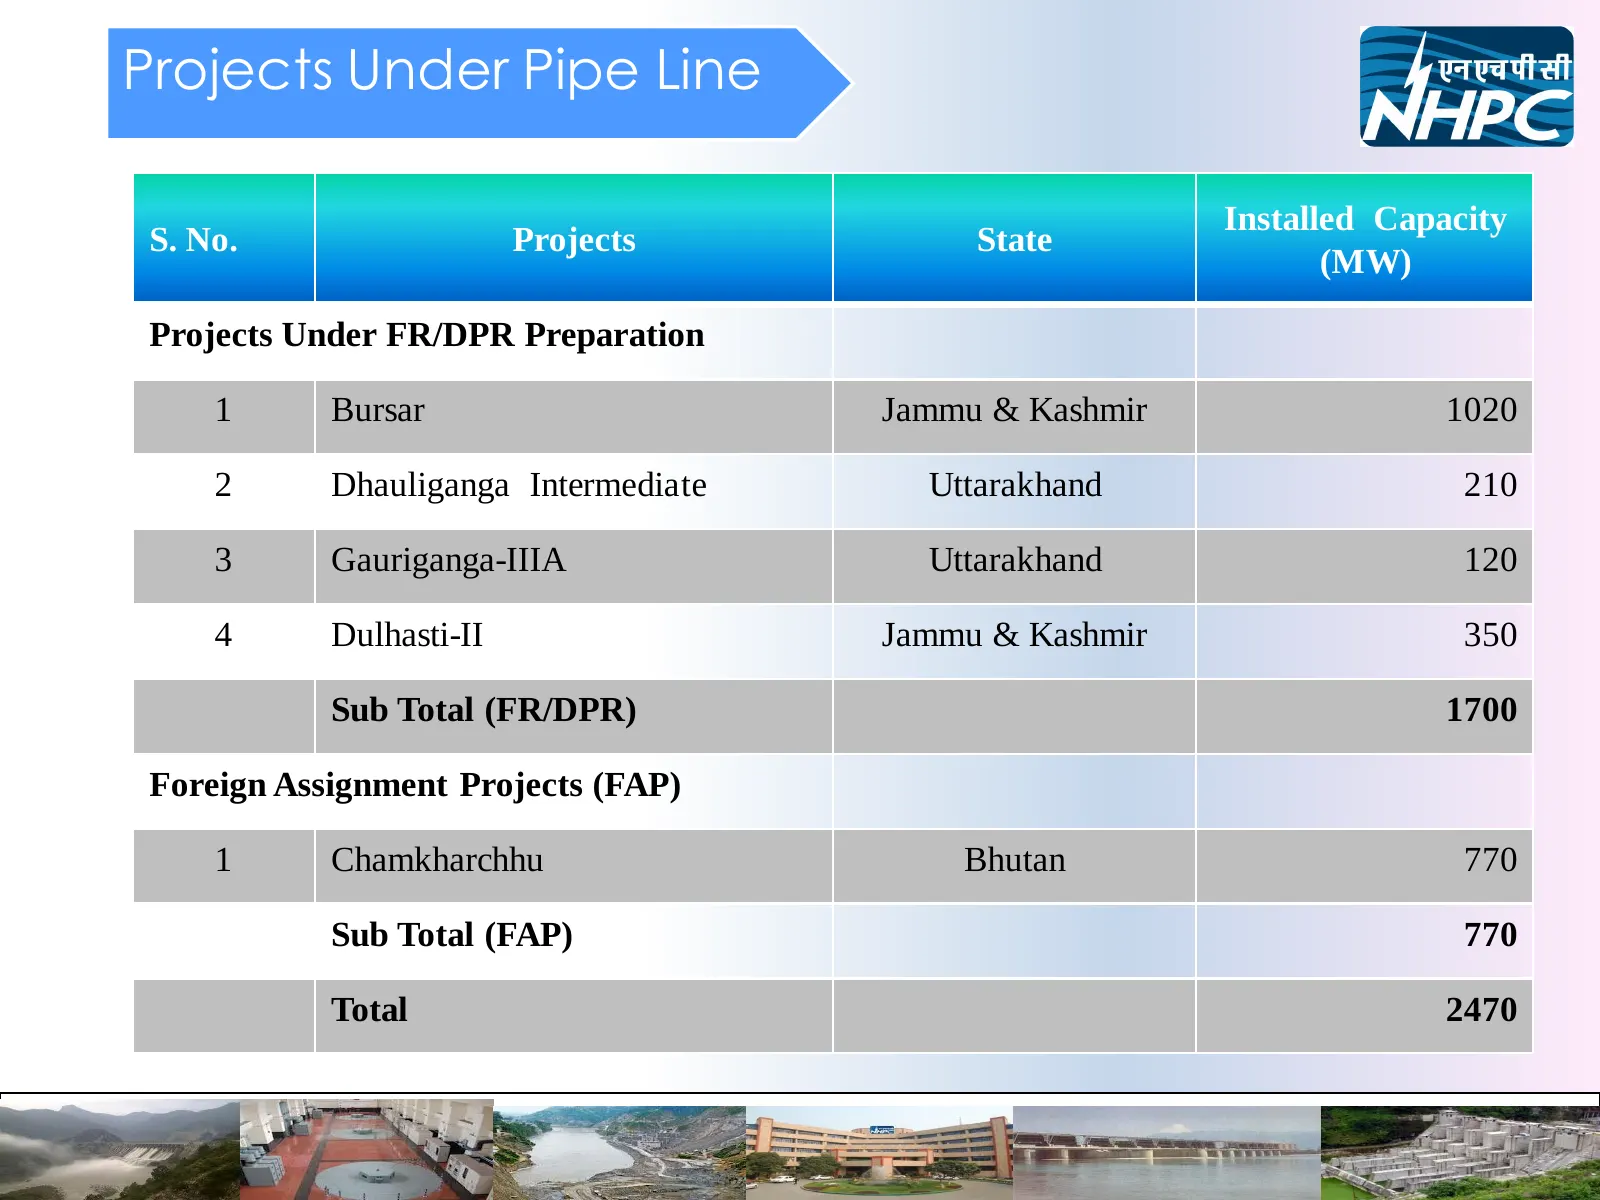
Slide 14: Projects Under Pipe Line
Projects Under Pipe Line Installed Capacity S. No. Projects State (MW) Projects Under FR/DPR Preparation 1 Bursar Jammu & Kashmir 1020 2 Dhauliganga Intermediate Uttarakhand 210 3 Gauriganga-IIIA Uttarakhand 120 4 Dulhasti-II Jammu & Kashmir 350 Sub Total (FR/DPR) 1700 Foreign Assignment Projects (F
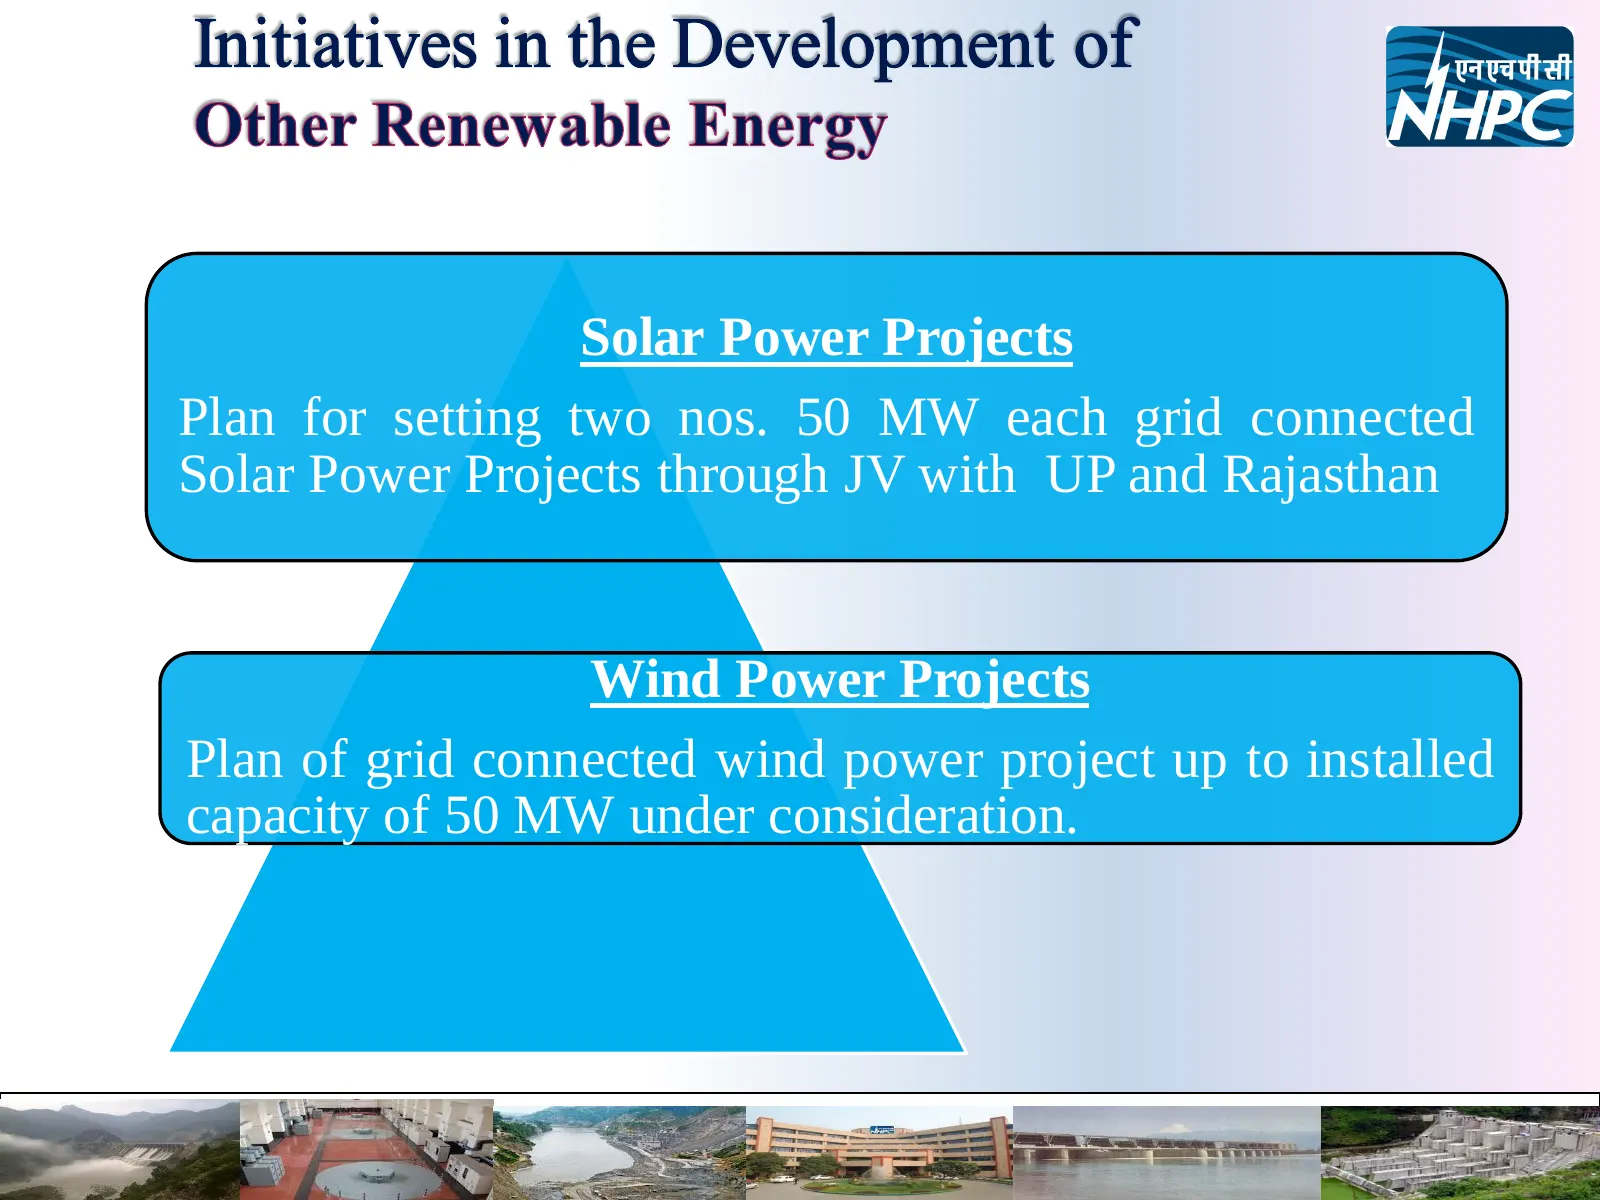
Slide 15: Solar Power Projects
Solar Power Projects Plan for setting two nos. 50 MW each grid connected Solar Power Projects through JV with UP and Rajasthan Wind Power Projects Plan of grid connected wind power project up to installed capacity of 50 MW under consideration.

Slide 16: Investment Plan
Investment Plan
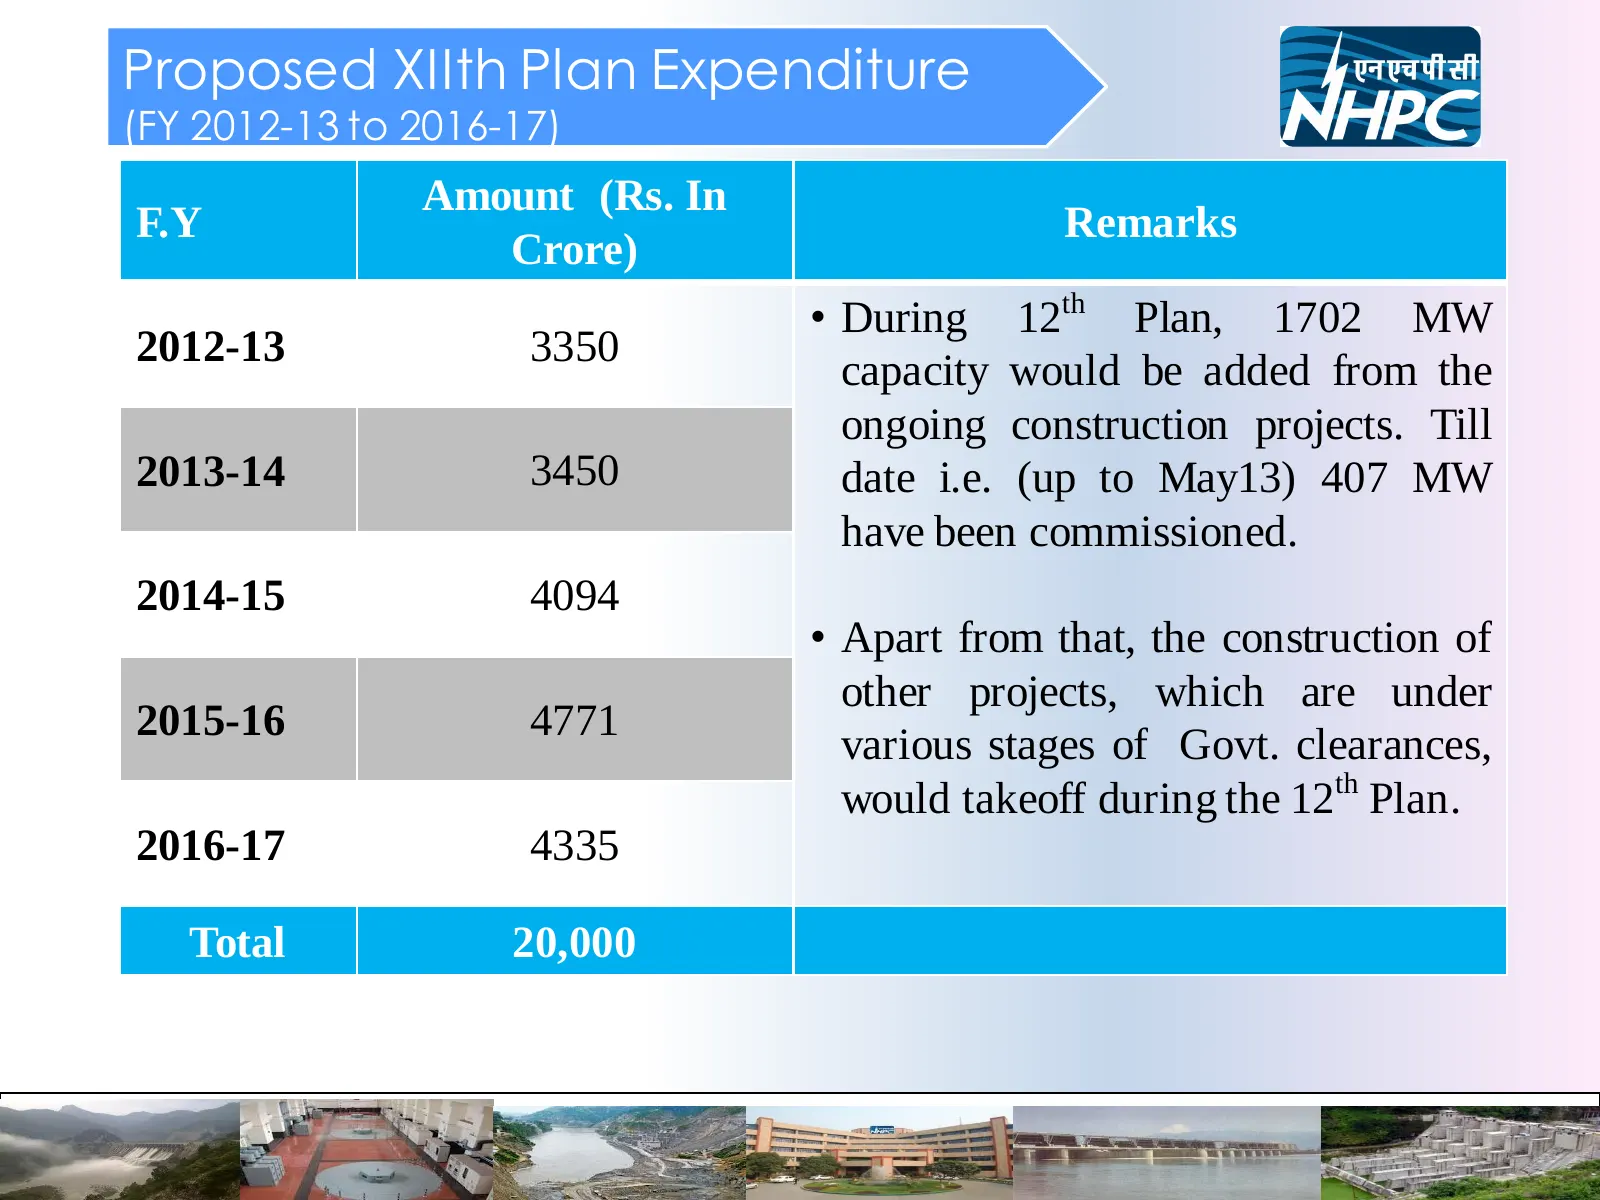
Slide 17: Proposed XIIth Plan Expenditure
Proposed XIIth Plan Expenditure (FY 2012-13 to 2016-17) Amount (Rs. In F.Y Remarks Crore) • During 12th Plan, 1702 MW 2012-13 3350 capacity would be added from the ongoing construction projects. Till 2013-14 3450 date i.e. (up to May13) 407 MW have been commissioned. 2014-15 4094 • Apart from that,

Slide 18: Financial Highlights
Financial Highlights
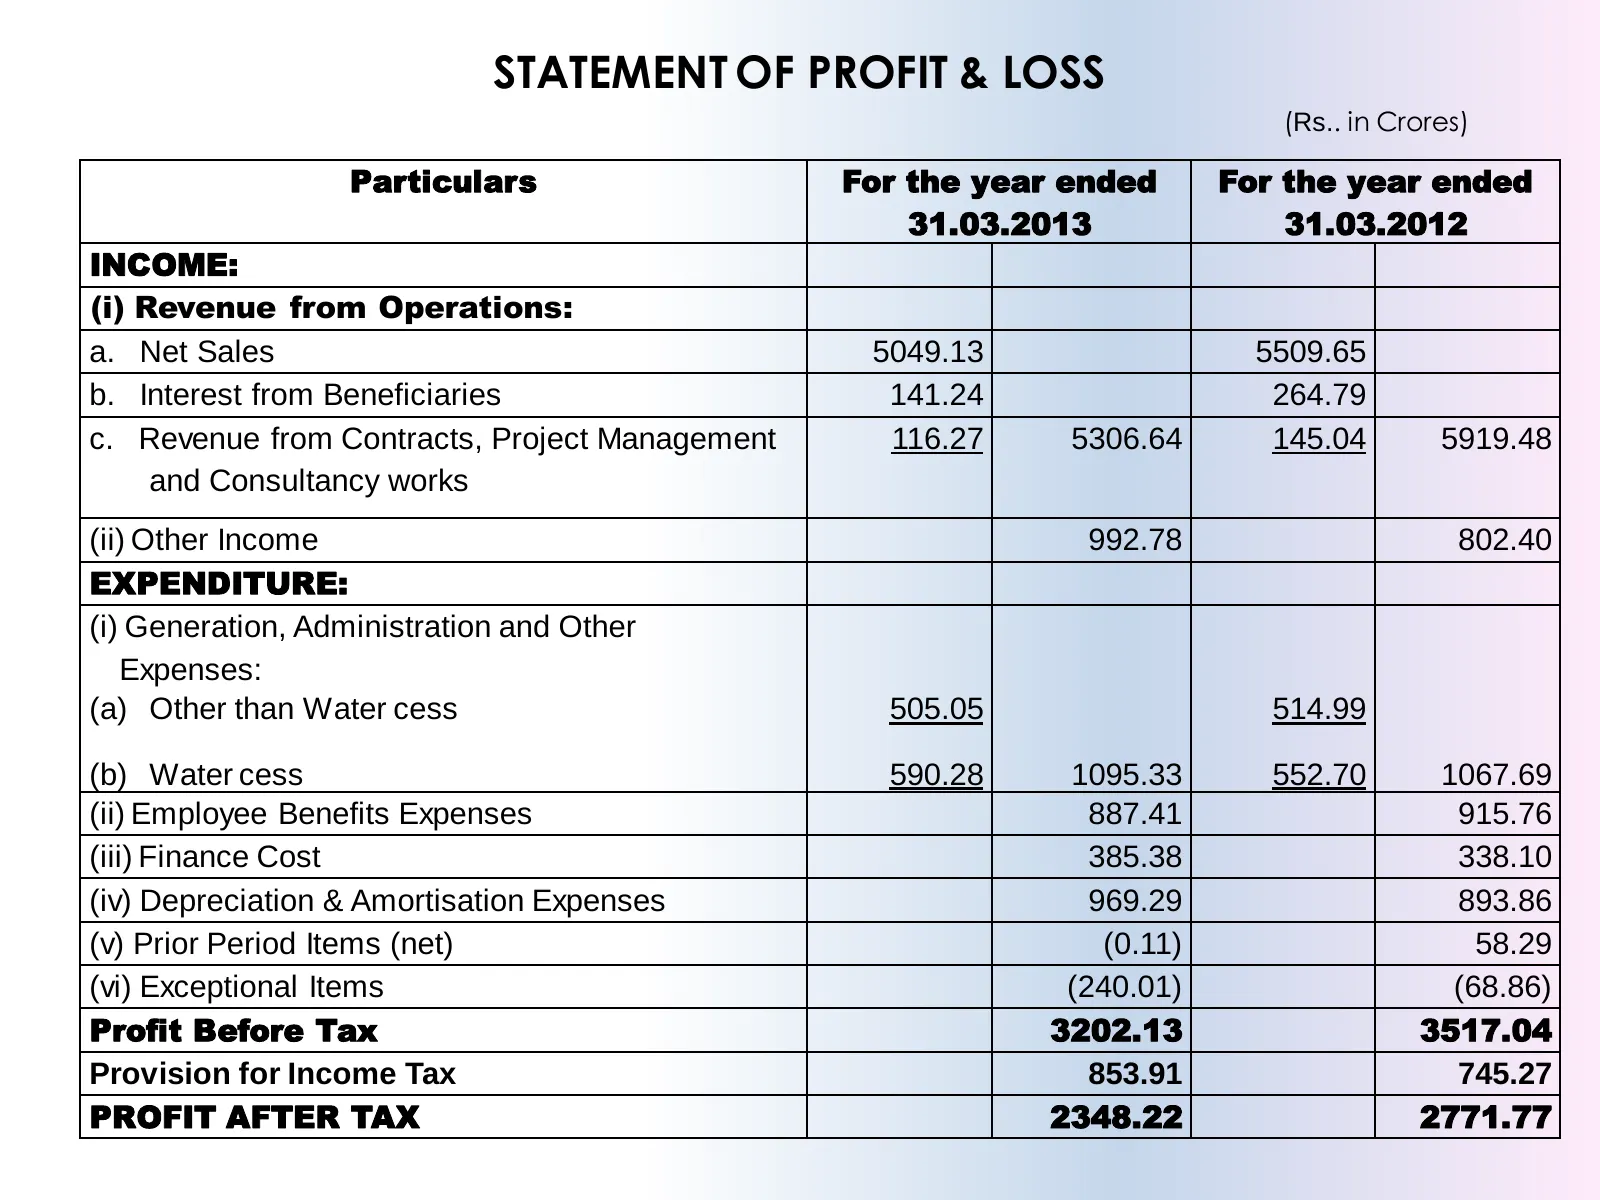
Slide 19: Statement of Profit & Loss
STATEMENT OF PROFIT & LOSS (Rs.. in Crores) Particulars For the year ended For the year ended 31.03.2013 31.03.2012 INCOME: (i) Revenue from Operations: a. Net Sales 5049.13 5509.65 b. Interest from Beneficiaries 141.24 264.79 c. Revenue from Contracts, Project Management 116.27 5306.64 145.04 5919.
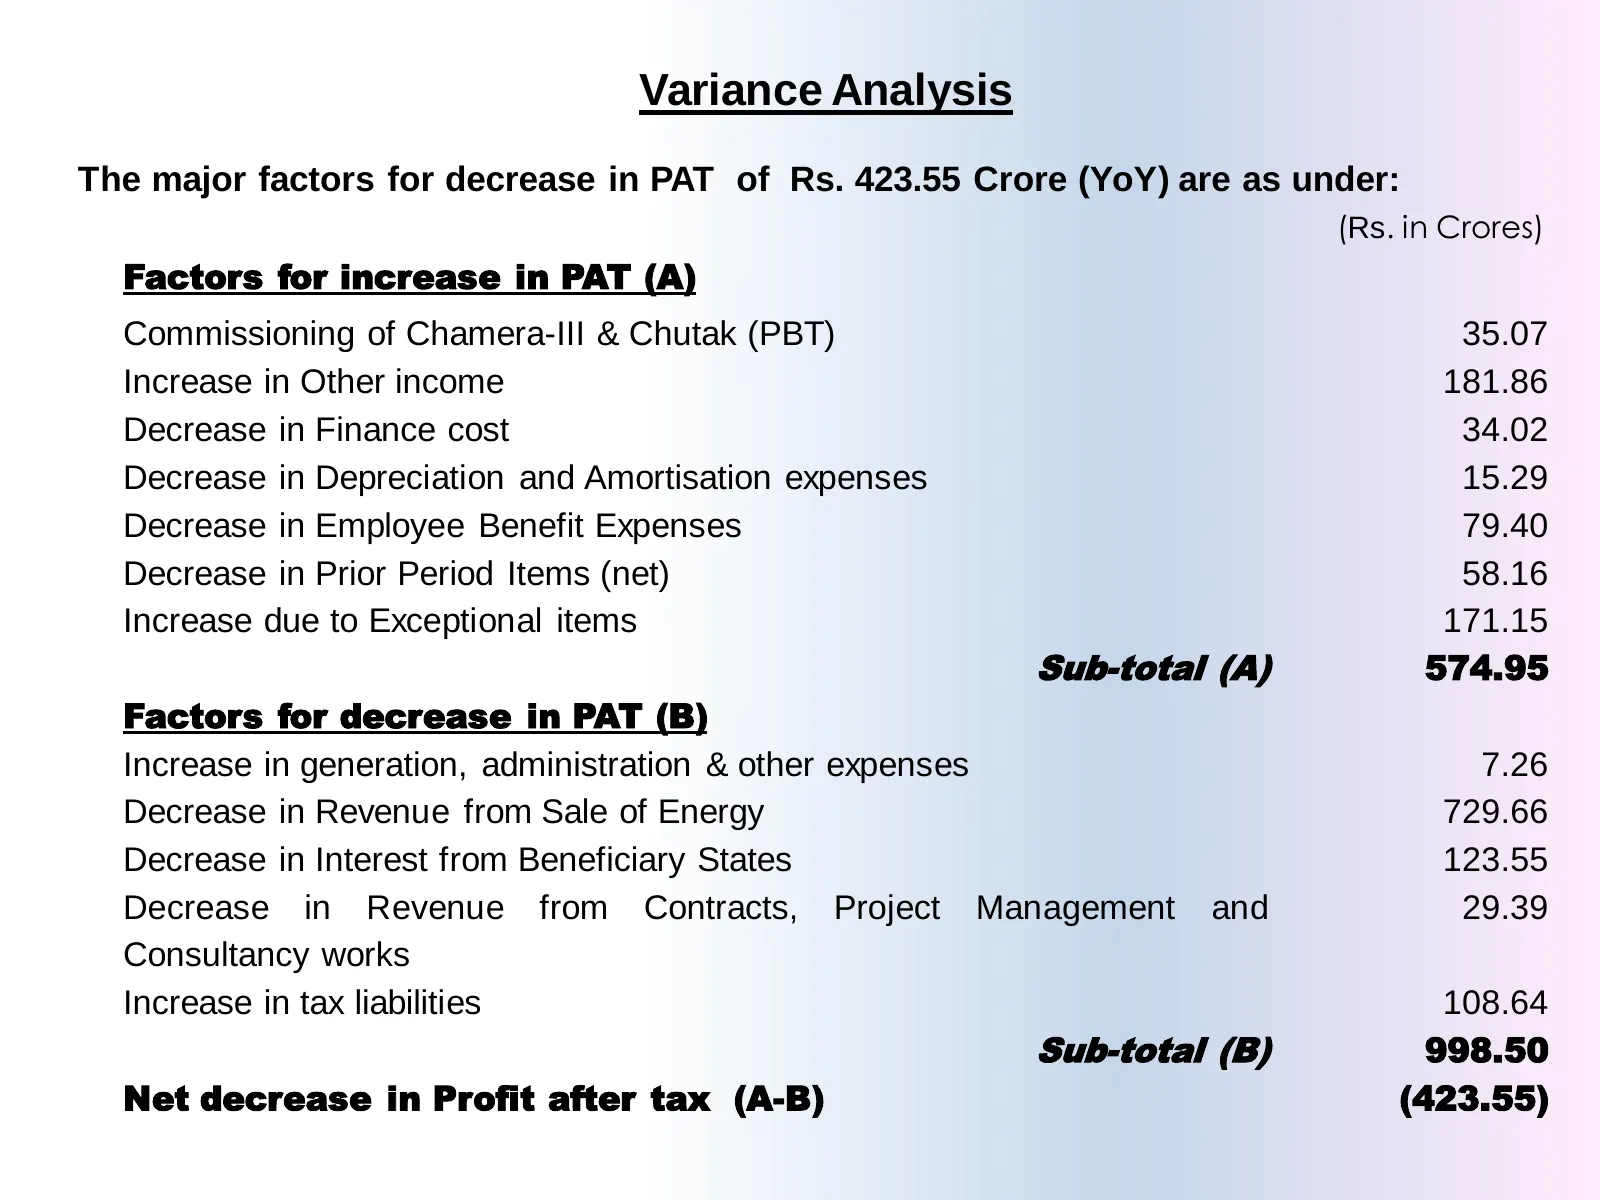
Slide 20: Variance Analysis
Variance Analysis The major factors for decrease in PAT of Rs. 423.55 Crore (YoY) are as under: (Rs. in Crores) Factors for increase in PAT (A) Commissioning of Chamera-III & Chutak (PBT) 35.07 Increase in Other income 181.86 Decrease in Finance cost 34.02 Decrease in Depreciation and Amortisation e
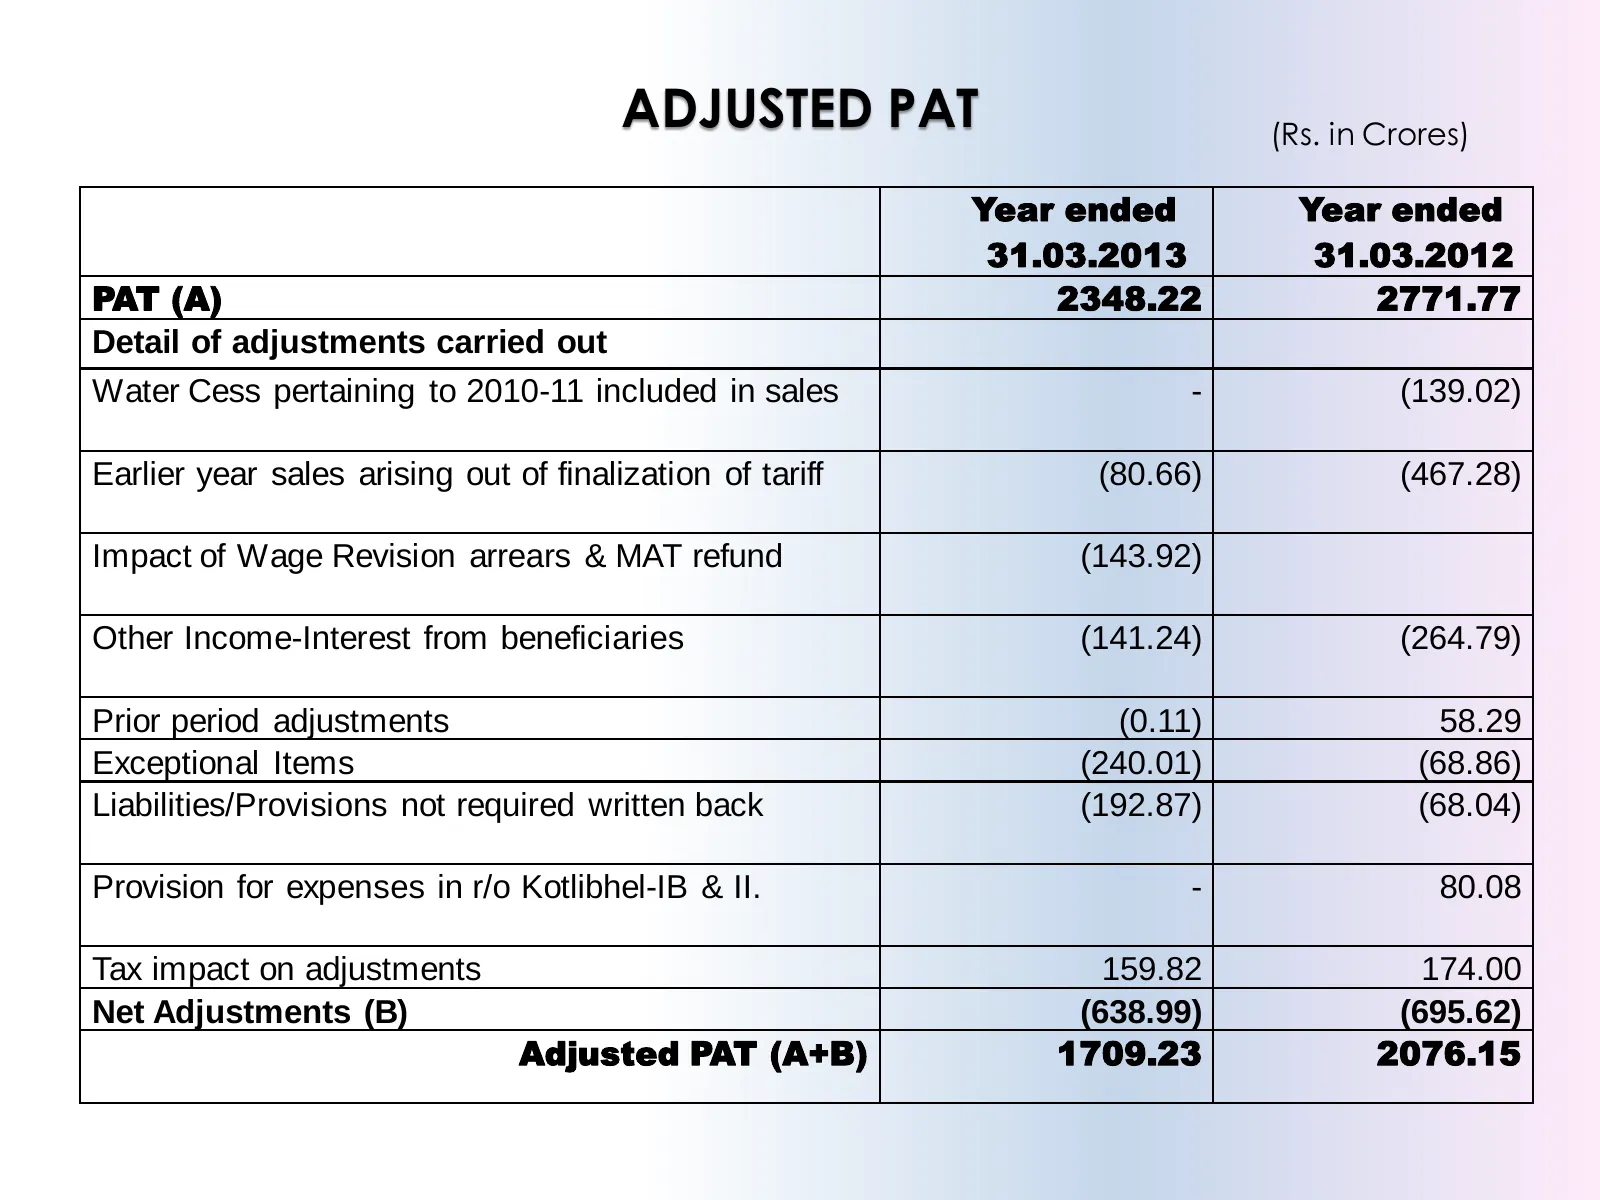
Slide 21: Adjusted PAT
ADJUSTED PAT (Rs. in Crores) Year ended Year ended 31.03.2013 31.03.2012 PAT (A) 2348.22 2771.77 Detail of adjustments carried out Water Cess pertaining to 2010-11 included in sales - (139.02) Earlier year sales arising out of finalization of tariff (80.66) (467.28) Impact of Wage Revision arrears &
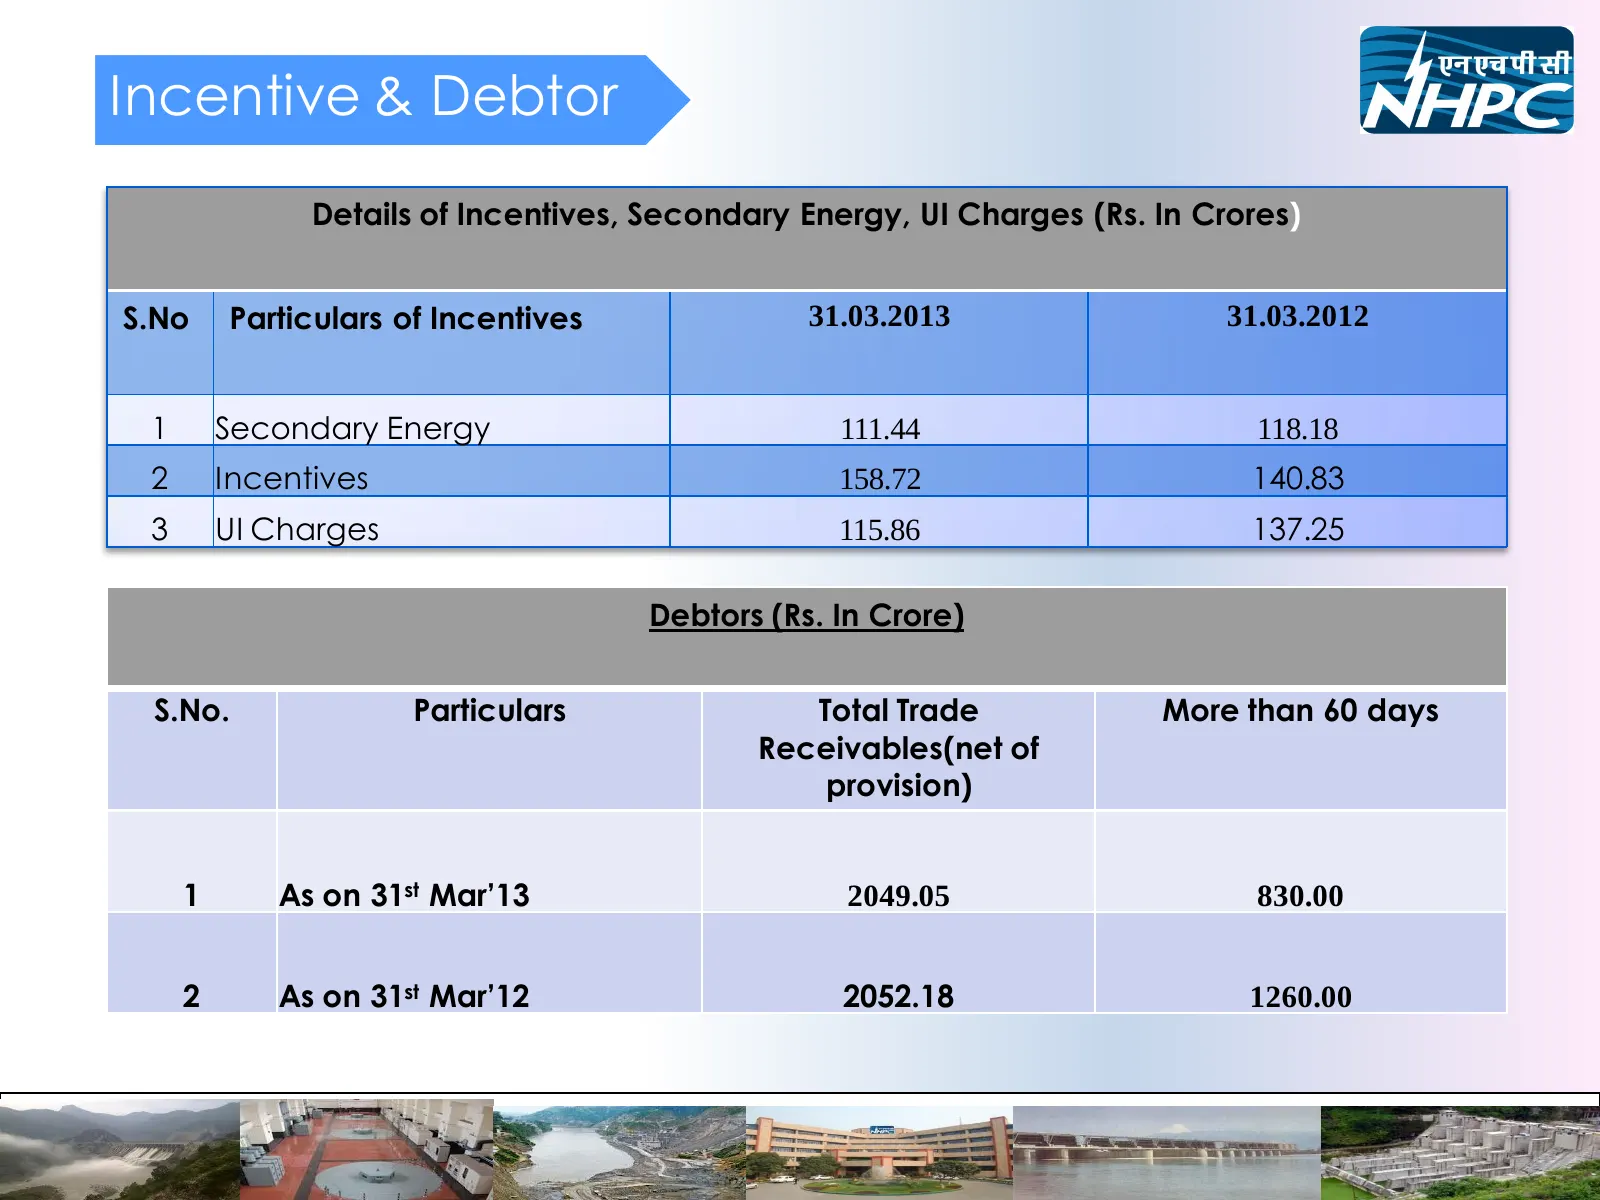
Slide 22: Incentive & Debtor
Incentive & Debtor Details of Incentives, Secondary Energy, UI Charges (Rs. In Crores) S.No Particulars of Incentives 31.03.2013 31.03.2012 1 Secondary Energy 111.44 118.18 2 Incentives 158.72 140.83 3 UI Charges 115.86 137.25 Debtors (Rs. In Crore) S.No. Particulars Total Trade More than 60 days Re
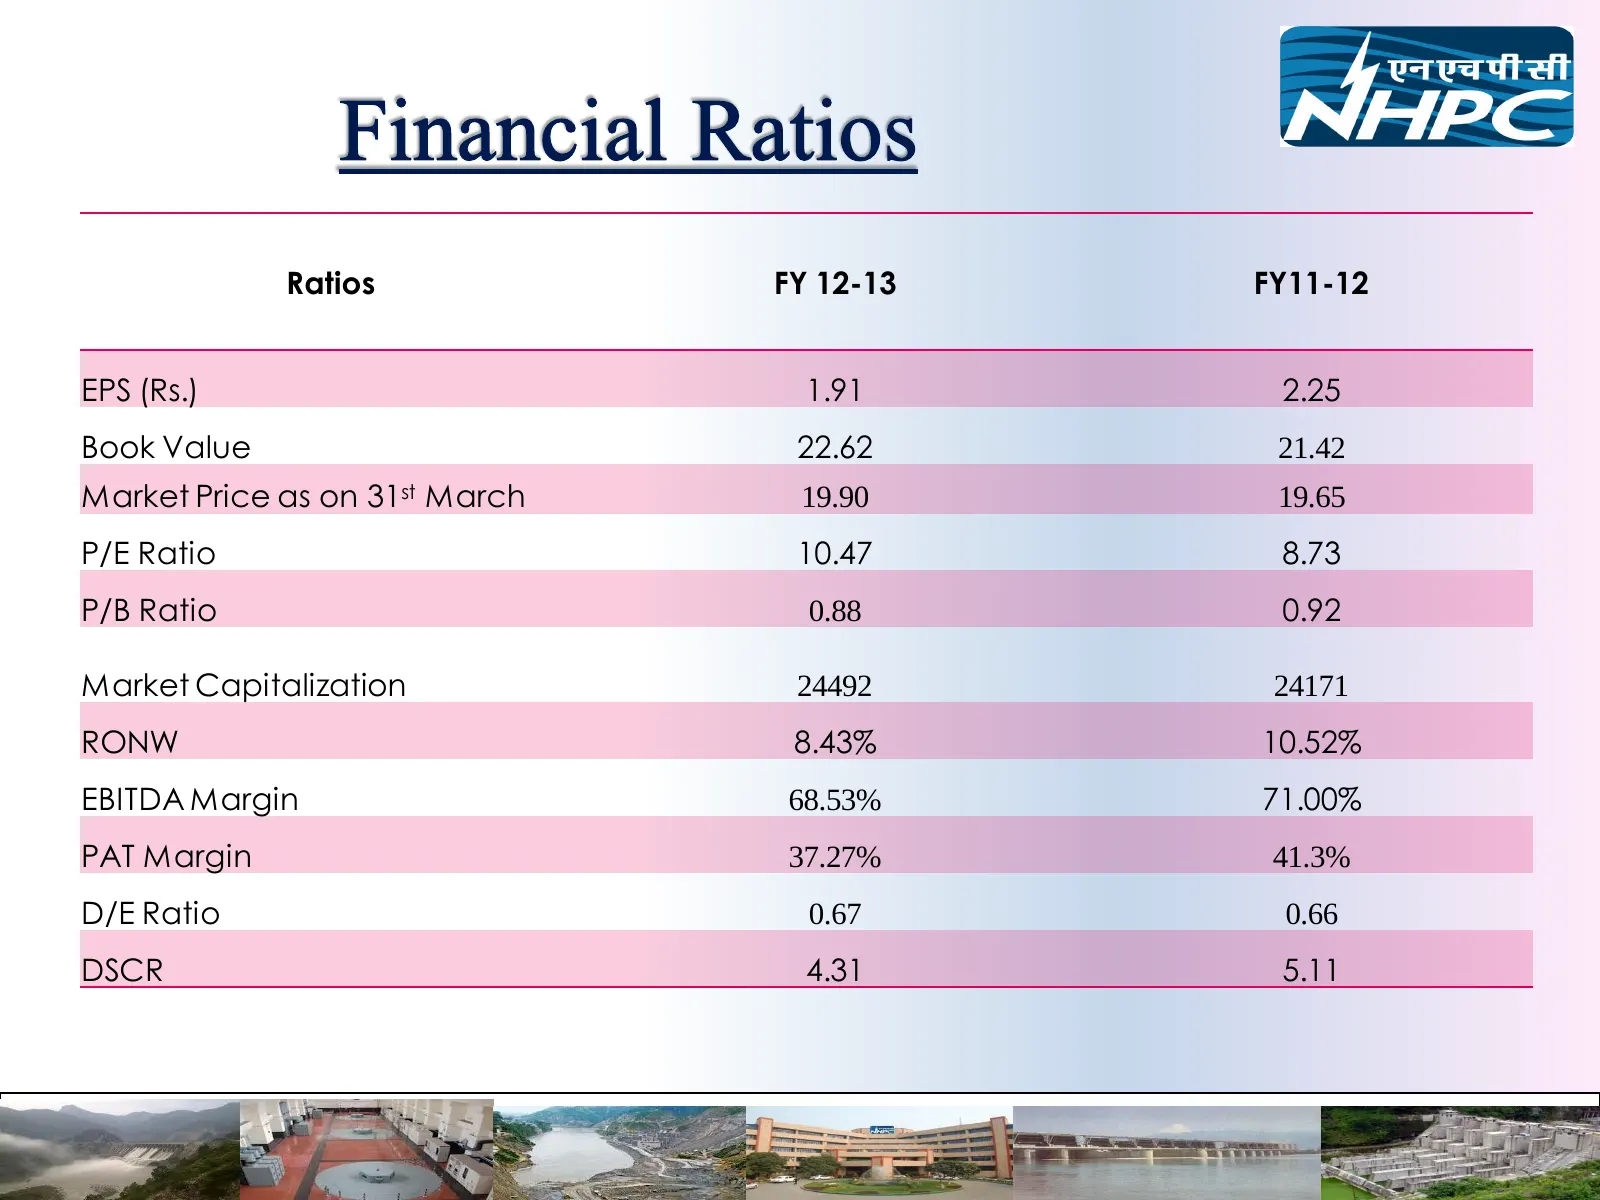
Slide 23: Ratios FY 12-13 FY11-12
Ratios FY 12-13 FY11-12 EPS (Rs.) 1.91 2.25 Book Value 22.62 21.42 Market Price as on 31st March 19.90 19.65 P/E Ratio 10.47 8.73 P/B Ratio 0.88 0.92 Market Capitalization 24492 24171 RONW 8.43% 10.52% EBITDA Margin 68.53% 71.00% PAT Margin 37.27% 41.3% D/E Ratio 0.67 0.66 DSCR 4.31 5.11

Slide 24: Thanks
THANKS
Source: Internet Archive copy of nhpcindia.com
More decks from NHPC Limited
 Investor Presentation (June 2026)49 slides · June 2026
 Investor Presentation (March 2026)48 slides · March 2026
 Investor Presentation (December 2025)49 slides · December 2025
 Investor Presentation (September 2025)49 slides · September 2025
 Investor Presentation (June 2025)51 slides · June 2025
 Investor Presentation (May 2025)49 slides · May 2025