SGL Carbon SE · XETR:SGL
SGL Carbon — SGL Group — 9M 2015 Earnings Presentation
18 slides from SGL Carbon's earnings presentation, Nov 5, 2015
Slide 1: Interim Financial Report 9M/2015
Interim Financial Report 9M/2015 Investor & Analyst Conference Call 5 November 2015 Investor Relations
Slide 2: Agenda
Agenda. 1. Financials 9M/2015 2. Outlook Page 2 | SGL Group – Investor Relations | 05 November 2015
Slide 3: Performance Products. Substantial EBIT improvement despite lack of recovery in graphite electrodes
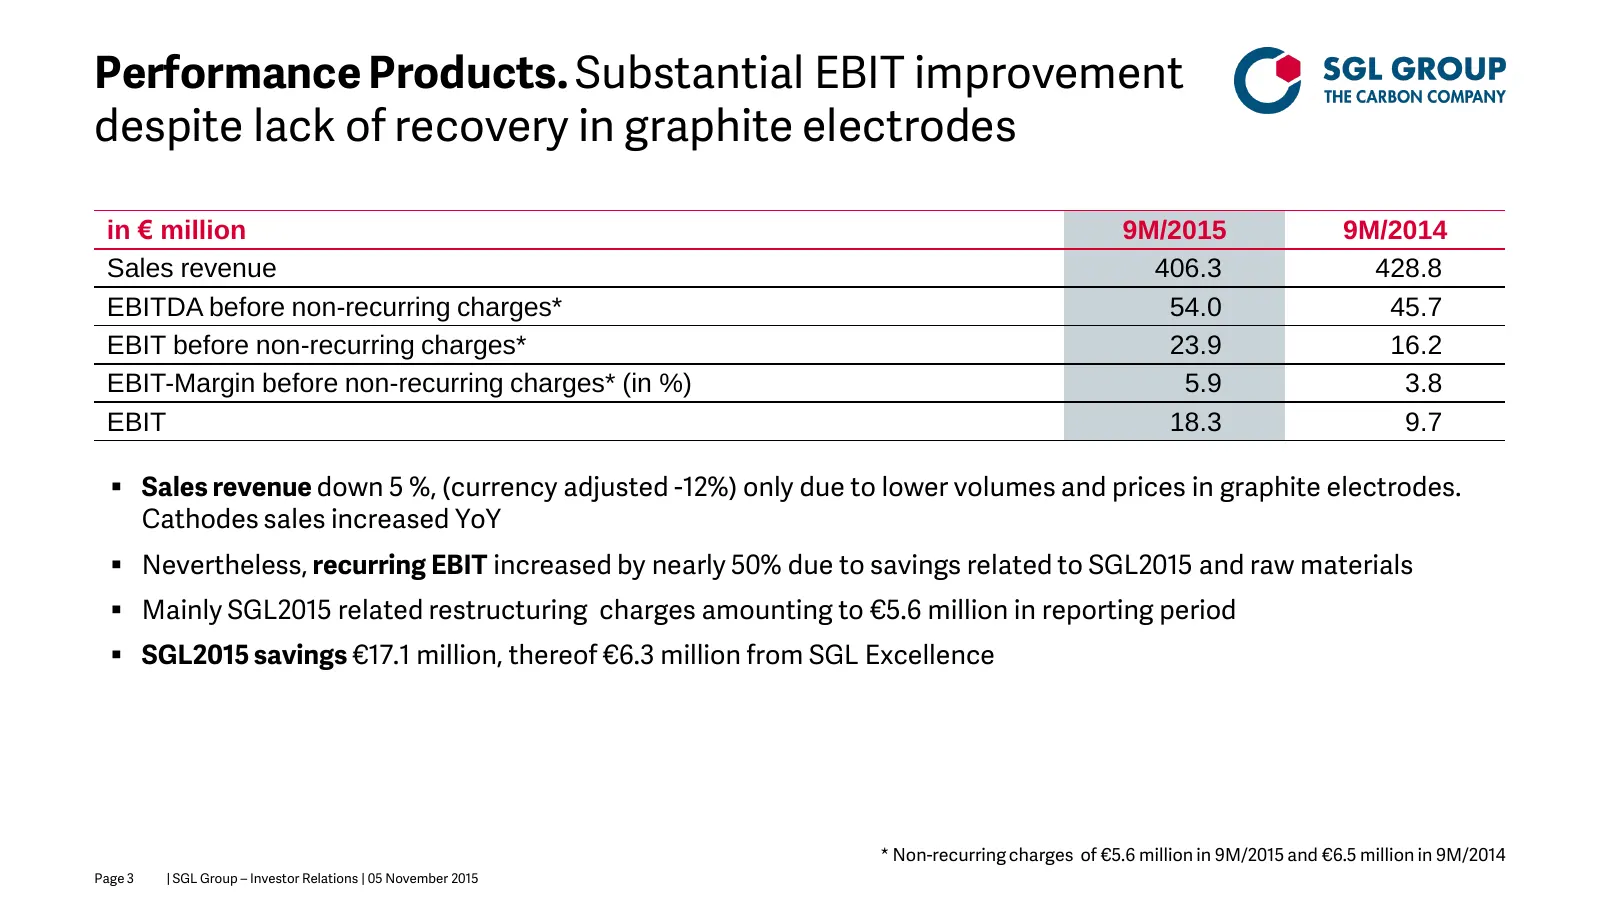
Performance Products. Substantial EBIT improvement despite lack of recovery in graphite electrodes in € million 9M/2015 9M/2014 Sales revenue 406.3 428.8 EBITDA before non-recurring charges* 54.0 45.7 EBIT before non-recurring charges* 23.9 16.2 EBIT-Margin before non-recurring charges* (in %) 5.9 3
Slide 4: Graphite Materials & Systems. Stable sales, declining earnings
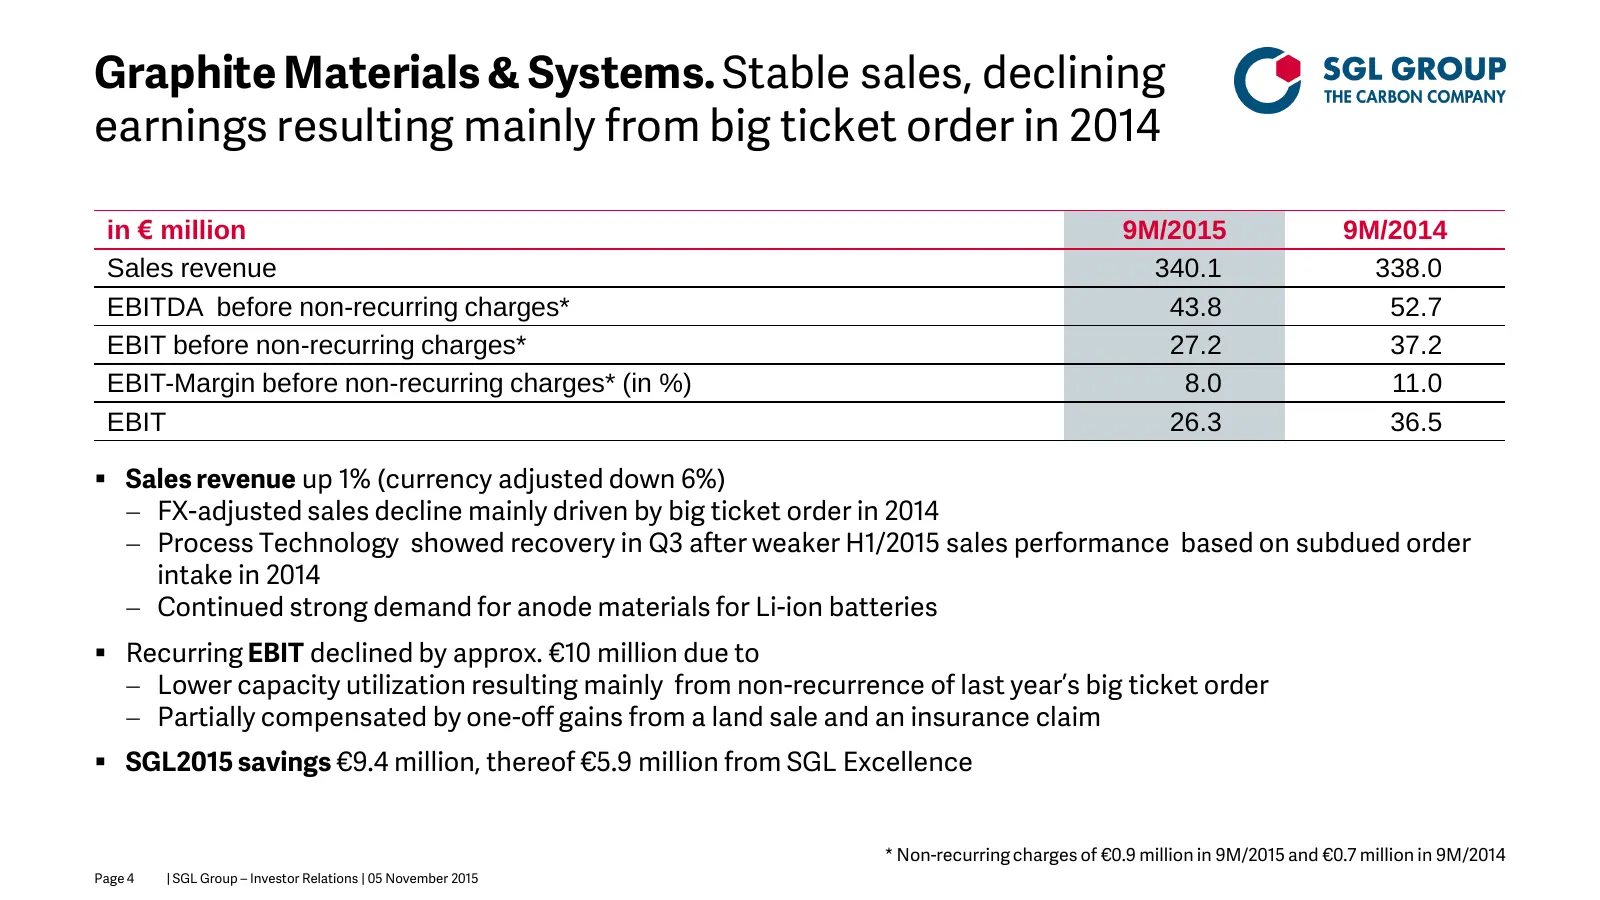
Graphite Materials & Systems. Stable sales, declining earnings resulting mainly from big ticket order in 2014 in € million 9M/2015 9M/2014 Sales revenue 340.1 338.0 EBITDA before non-recurring charges* 43.8 52.7 EBIT before non-recurring charges* 27.2 37.2 EBIT-Margin before non-recurring charges* (
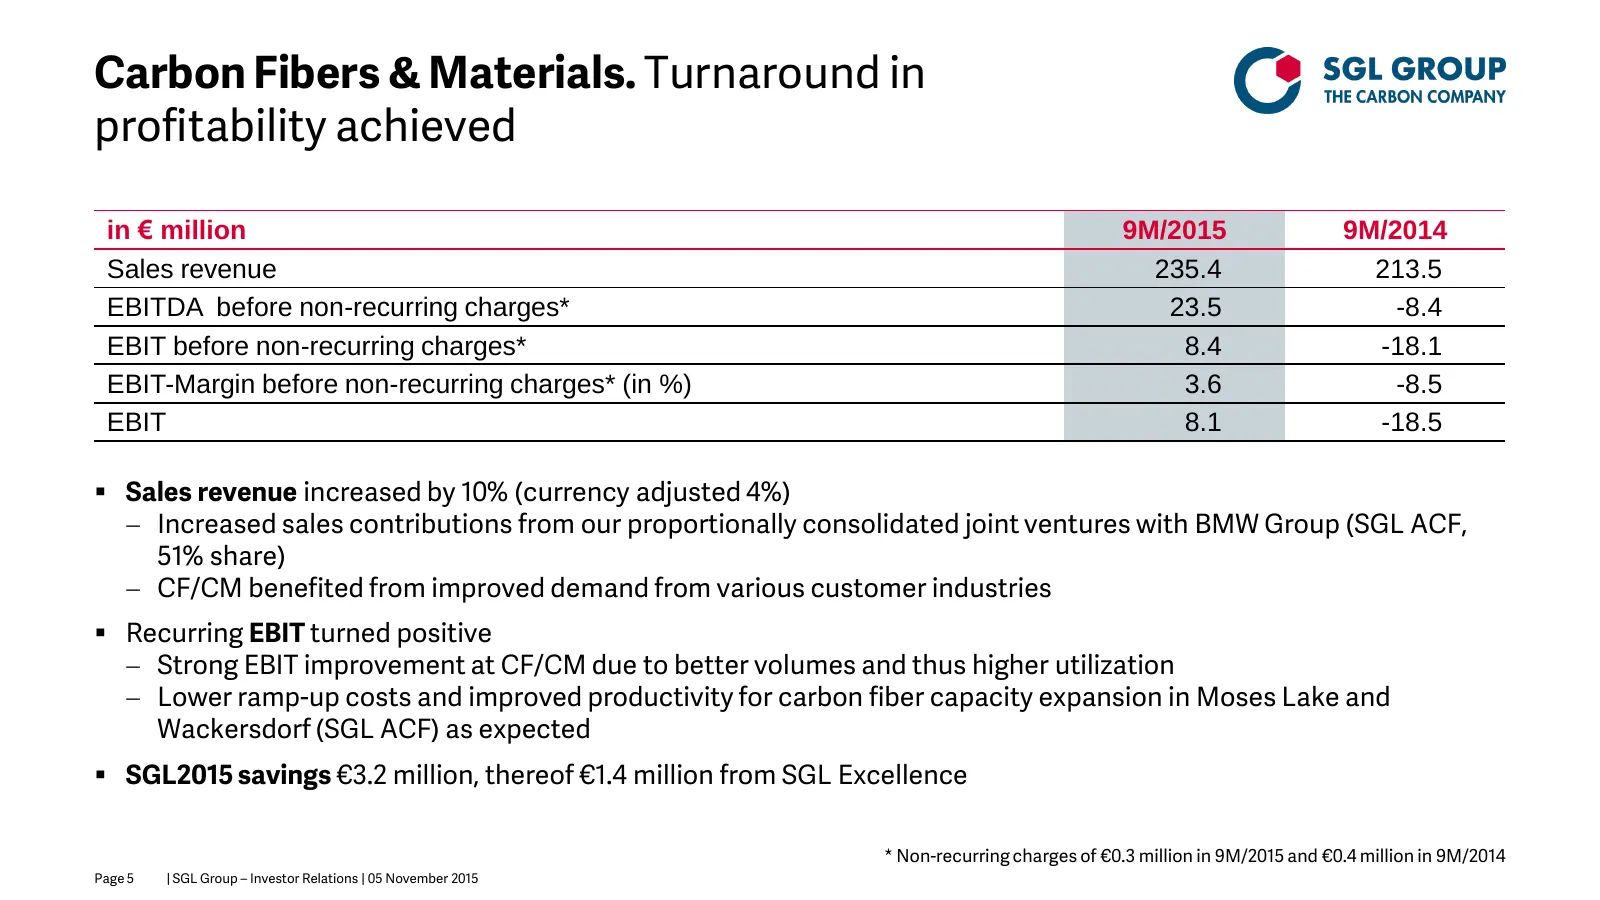
Slide 5: Carbon Fibers & Materials. Turnaround in profitability achieved
Carbon Fibers & Materials. Turnaround in profitability achieved in € million 9M/2015 9M/2014 Sales revenue 235.4 213.5 EBITDA before non-recurring charges* 23.5 -8.4 EBIT before non-recurring charges* 8.4 -18.1 EBIT-Margin before non-recurring charges* (in %) 3.6 -8.5 EBIT 8.1 -18.5 Sales revenue
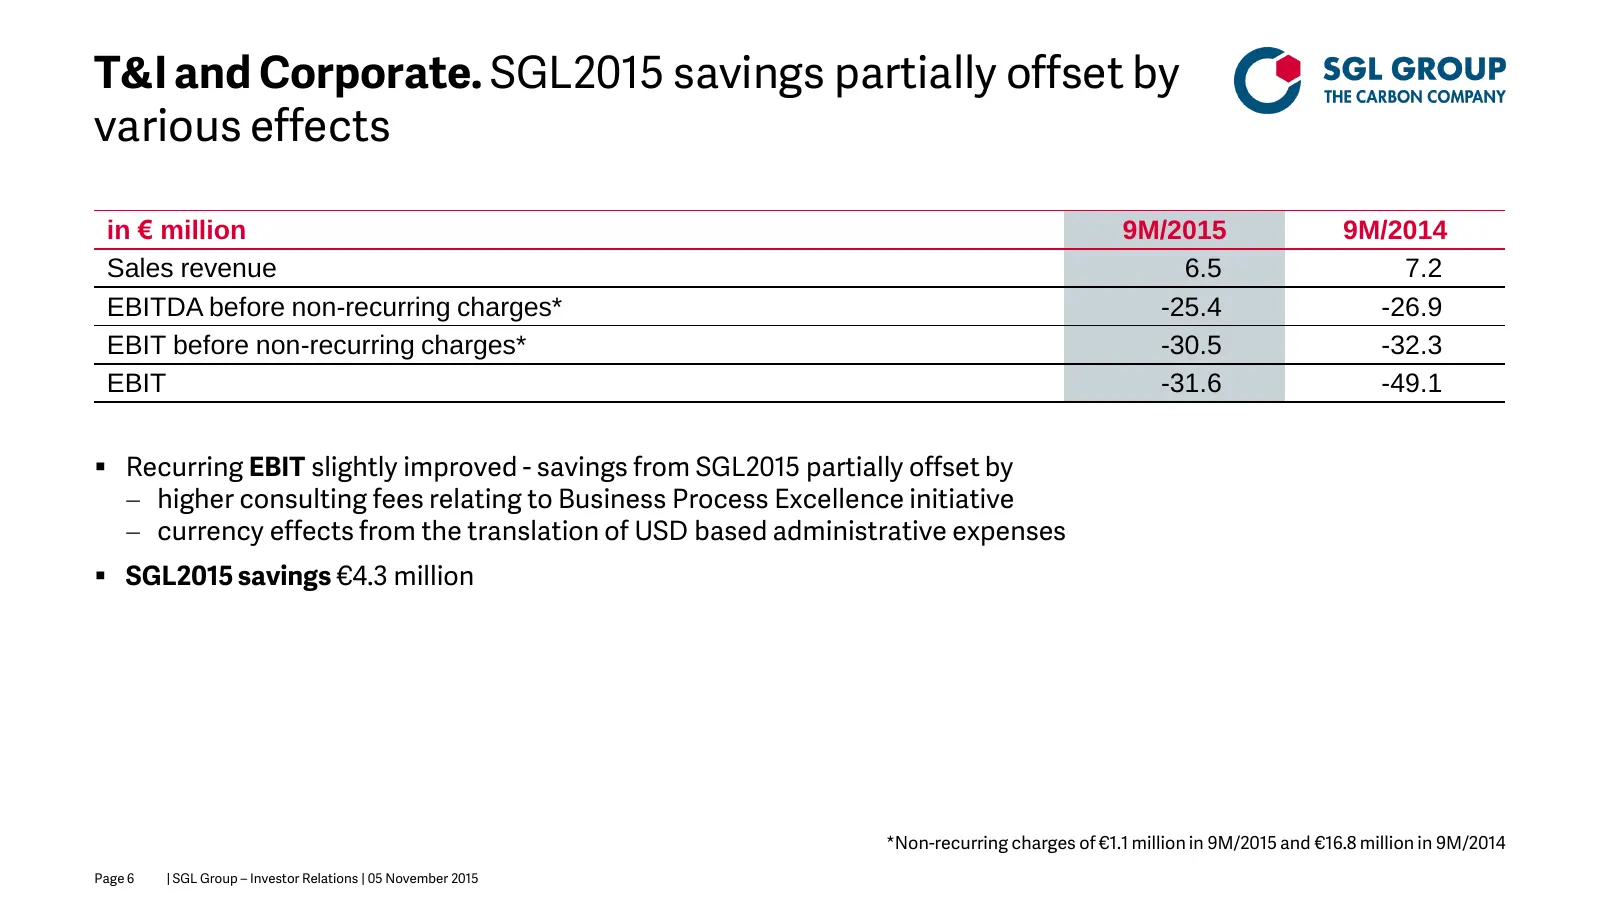
Slide 6: T&I and Corporate. SGL2015 savings partially offset by various effects
T&I and Corporate. SGL2015 savings partially offset by various effects in € million 9M/2015 9M/2014 Sales revenue 6.5 7.2 EBITDA before non-recurring charges* -25.4 -26.9 EBIT before non-recurring charges* -30.5 -32.3 EBIT -31.6 -49.1 Recurring EBIT slightly improved - savings from SGL2015 partial
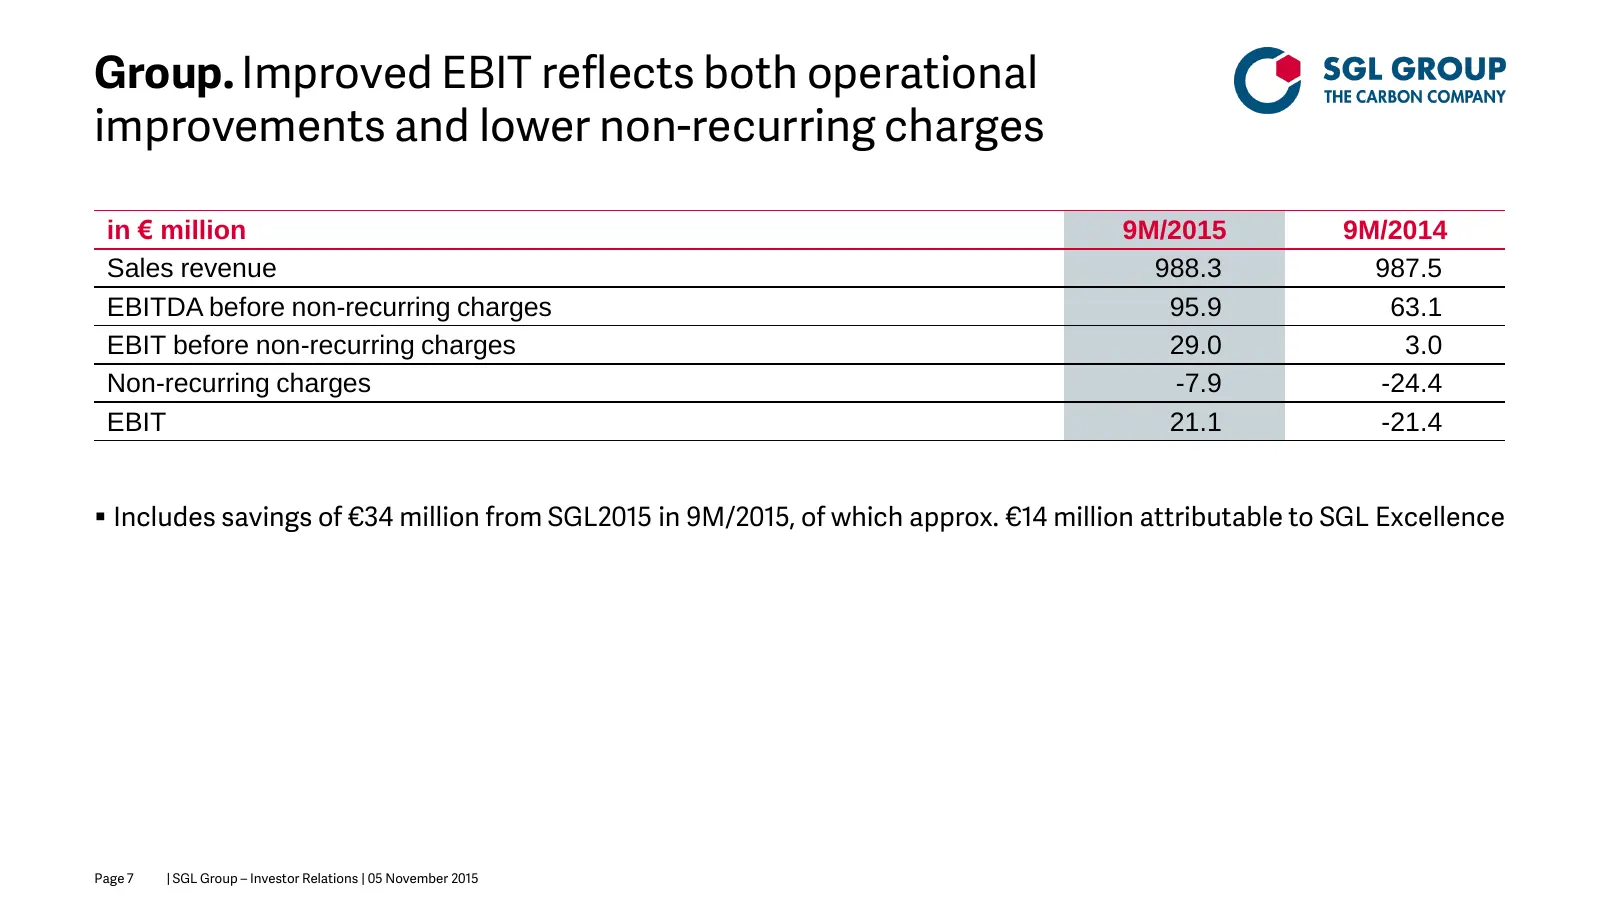
Slide 7: Group. Improved EBIT reflects operational improvements and lower non-recurring charges
Group. Improved EBIT reflects both operational improvements and lower non-recurring charges in € million 9M/2015 9M/2014 Sales revenue 988.3 987.5 EBITDA before non-recurring charges 95.9 63.1 EBIT before non-recurring charges 29.0 3.0 Non-recurring charges -7.9 -24.4 EBIT 21.1 -21.4 Includes savi
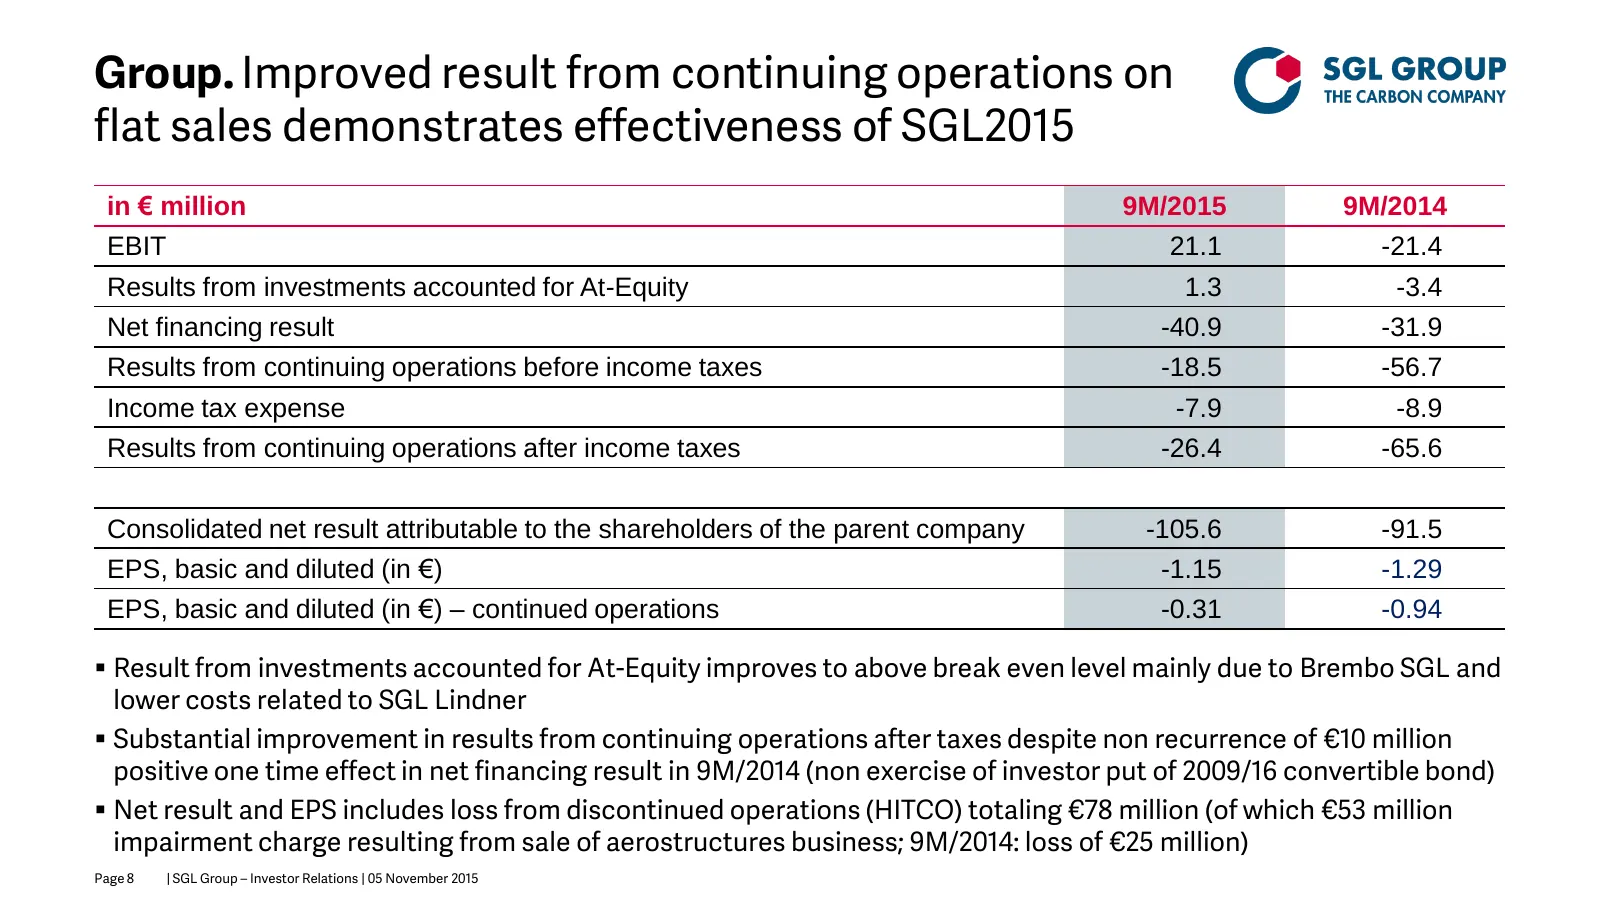
Slide 8: Group. Improved result from continuing operations on flat sales
Group. Improved result from continuing operations on flat sales demonstrates effectiveness of SGL2015 in € million 9M/2015 9M/2014 EBIT 21.1 -21.4 Results from investments accounted for At-Equity 1.3 -3.4 Net financing result -40.9 -31.9 Results from continuing operations before income taxes -18.5 -
Slide 9: Balance sheet. Solid despite slight deterioration
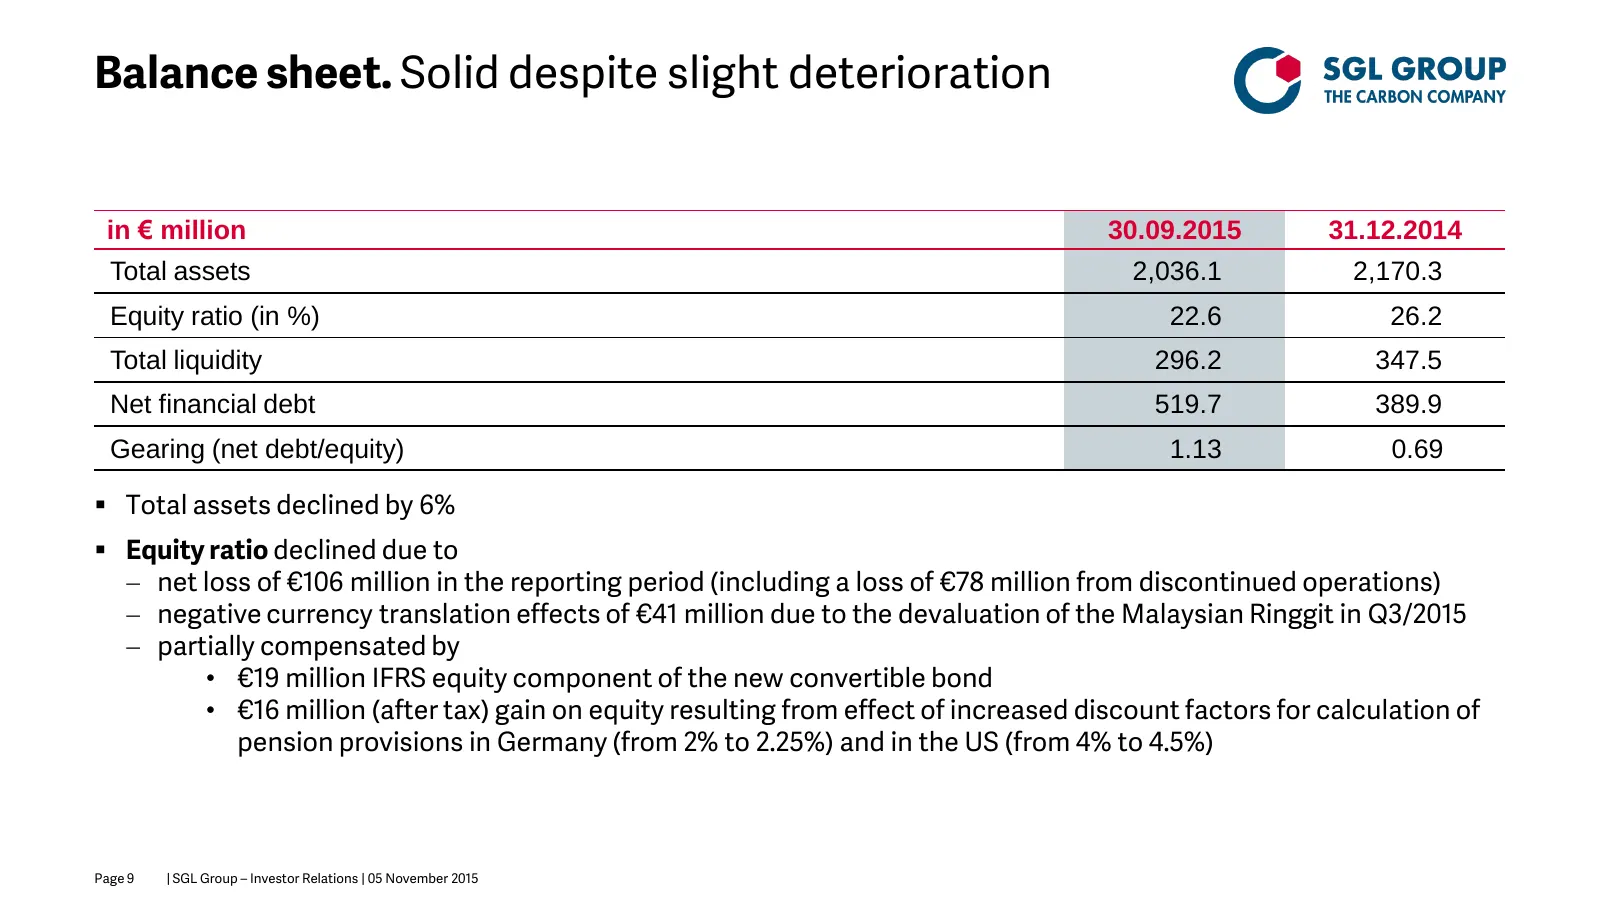
Balance sheet. Solid despite slight deterioration in € million 30.09.2015 31.12.2014 Total assets 2,036.1 2,170.3 Equity ratio (in %) 22.6 26.2 Total liquidity 296.2 347.5 Net financial debt 519.7 389.9 Gearing (net debt/equity) 1.13 0.69 Total assets declined by 6% Equity ratio declined due to
Slide 10: Free cash flow. Small positive free cash flow from continuing operations in Q3/2015
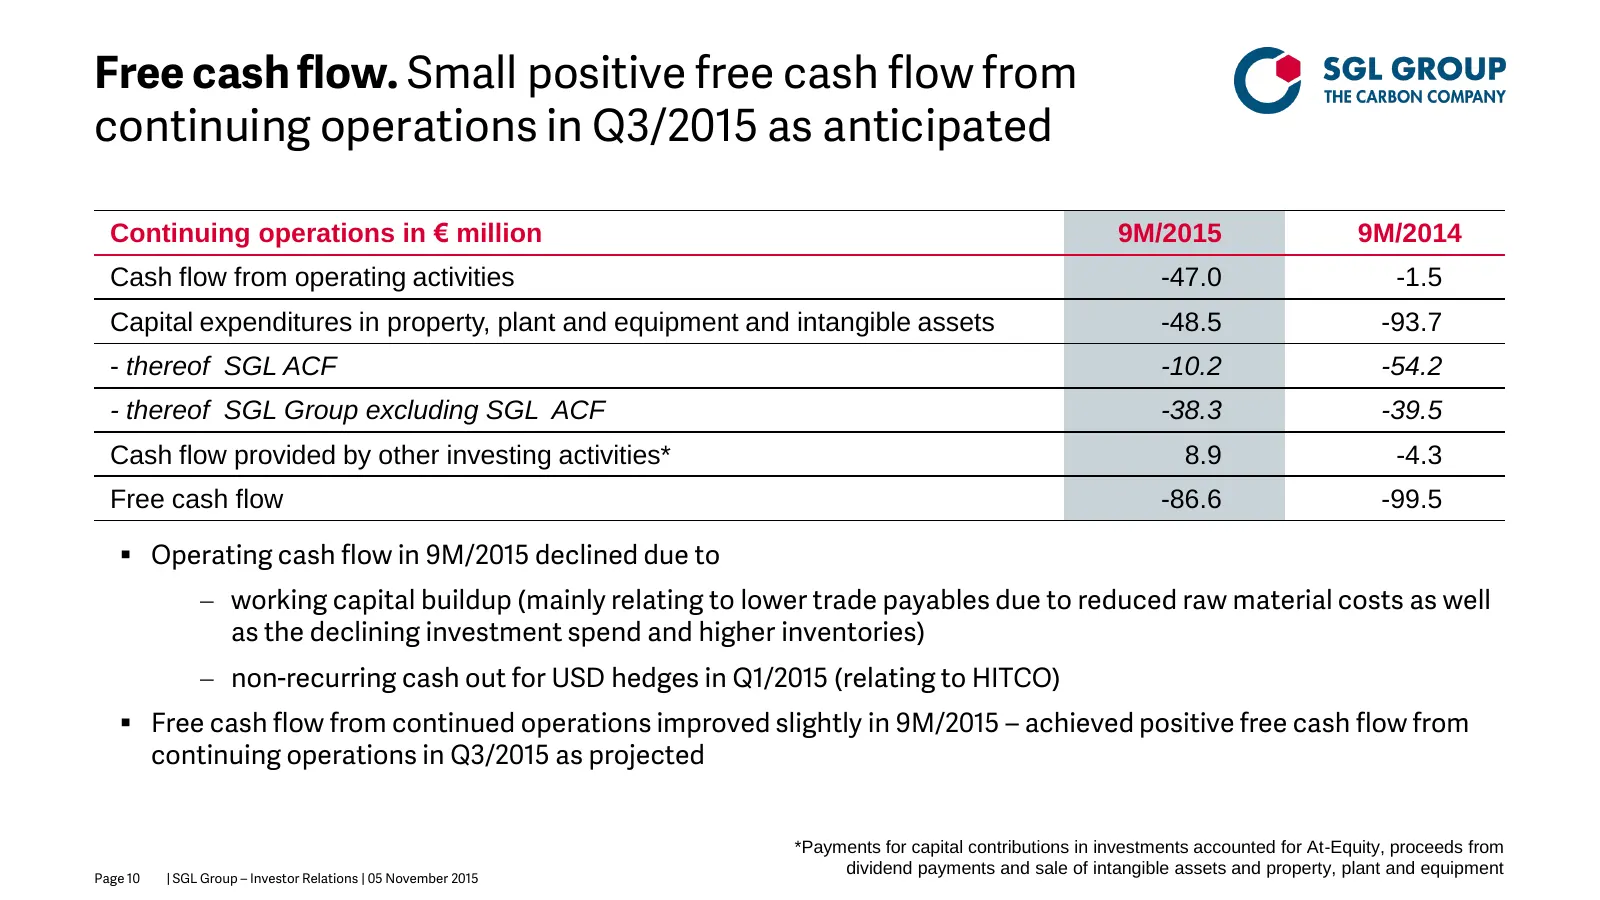
Free cash flow. Small positive free cash flow from continuing operations in Q3/2015 as anticipated Continuing operations in € million 9M/2015 9M/2014 Cash flow from operating activities -47.0 -1.5 Capital expenditures in property, plant and equipment and intangible assets -48.5 -93.7 - thereof SGL A
Slide 11: Agenda
Agenda. 1. Financials 9M/2015 2. Outlook Page 11 | SGL Group – Investor Relations | 05 November 2015
Slide 12: Business unit outlook 2015
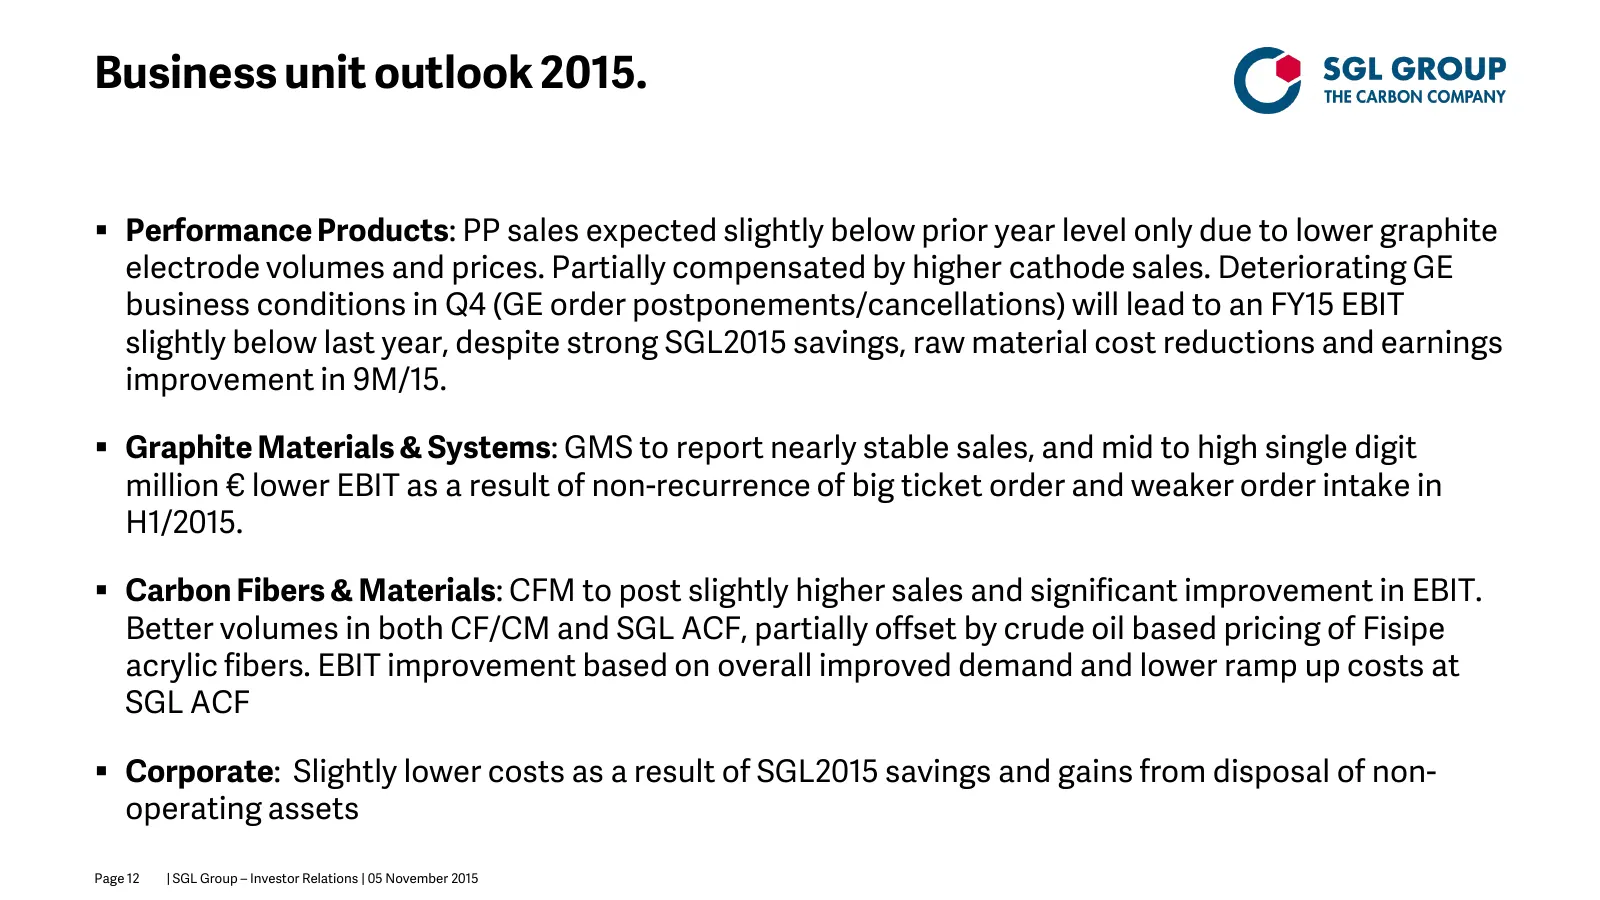
Business unit outlook 2015. Performance Products: PP sales expected slightly below prior year level only due to lower graphite electrode volumes and prices. Partially compensated by higher cathode sales. Deteriorating GE business conditions in Q4 (GE order postponements/cancellations) will lead to
Slide 13: Group outlook 2015
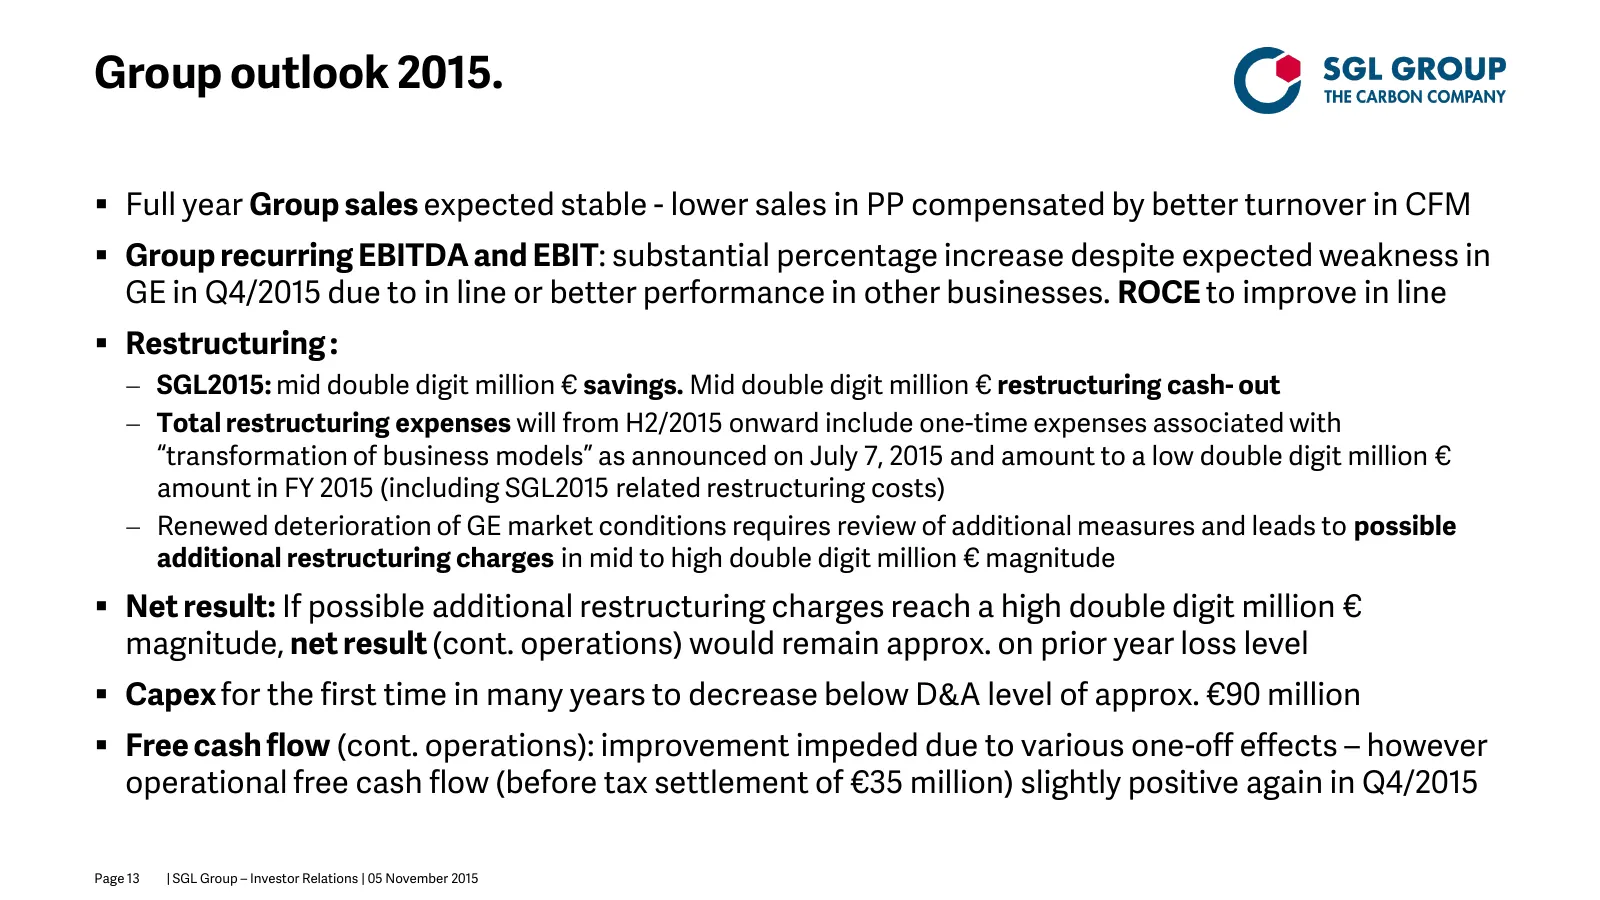
Group outlook 2015. Full year Group sales expected stable - lower sales in PP compensated by better turnover in CFM Group recurring EBITDA and EBIT: substantial percentage increase despite expected weakness in GE in Q4/2015 due to in line or better performance in other businesses. ROCE to improv
Slide 14: Renewed deterioration in GE market conditions. Chinese steel exports at record high
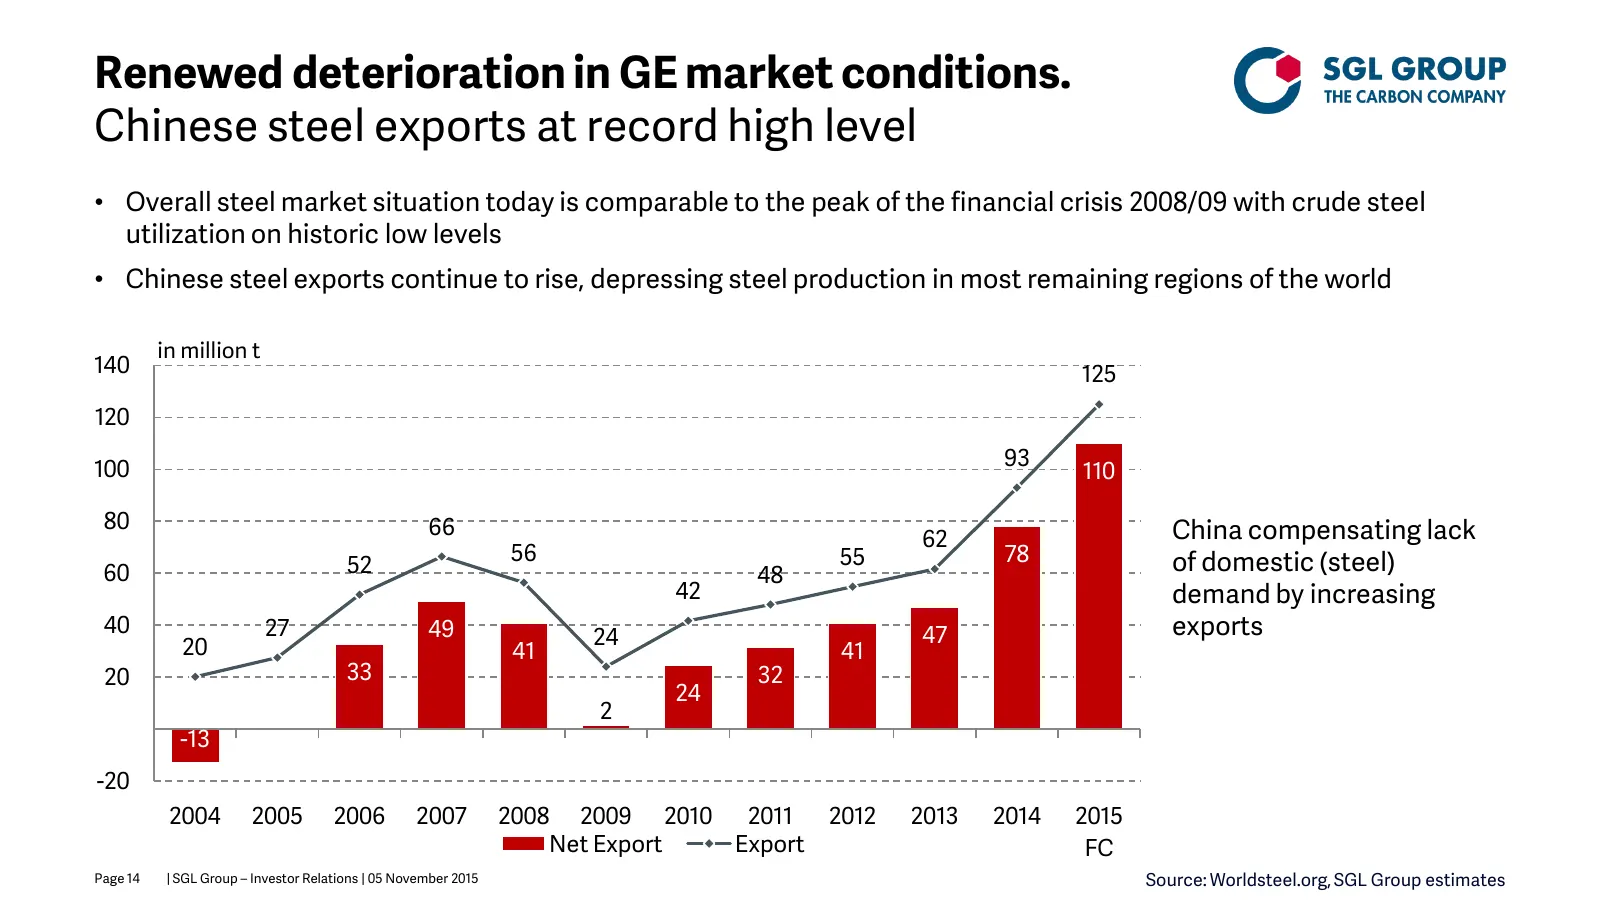
Renewed deterioration in GE market conditions. Chinese steel exports at record high level • Overall steel market situation today is comparable to the peak of the financial crisis 2008/09 with crude steel utilization on historic low levels • Chinese steel exports continue to rise, depressing steel pr
Slide 15: Renewed deterioration in GE market conditions. Iron ore prices favor BOF production
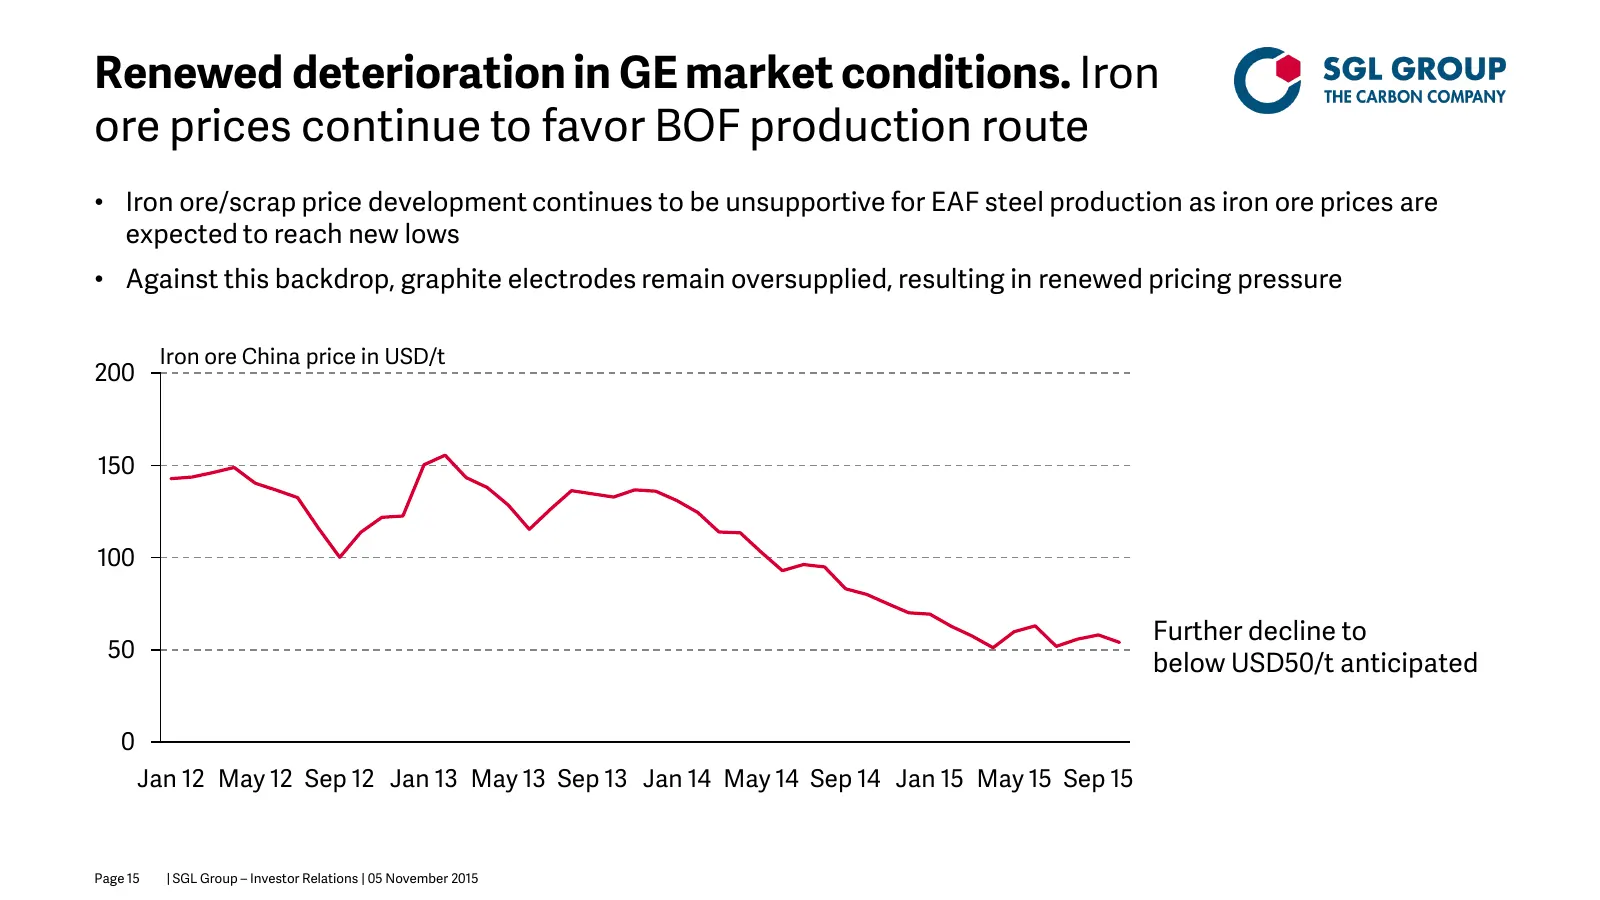
Renewed deterioration in GE market conditions. Iron ore prices continue to favor BOF production route • Iron ore/scrap price development continues to be unsupportive for EAF steel production as iron ore prices are expected to reach new lows • Against this backdrop, graphite electrodes remain oversup
Slide 16: Initial outlook on 2016 significantly impacted by renewed deterioration in GE market
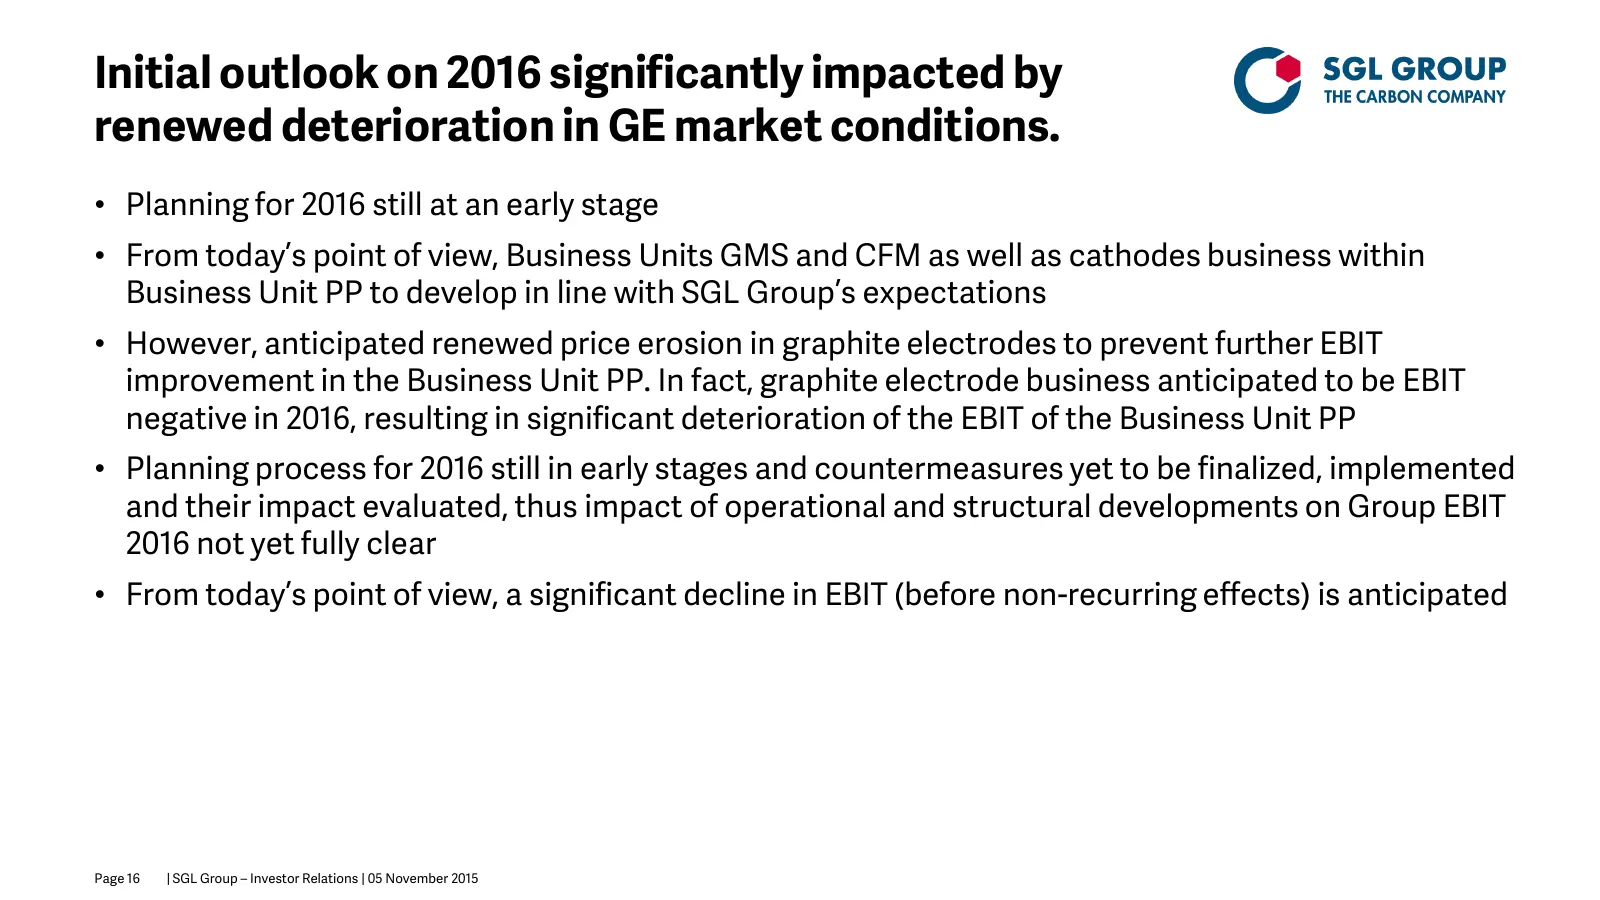
Initial outlook on 2016 significantly impacted by renewed deterioration in GE market conditions. • Planning for 2016 still at an early stage • From today’s point of view, Business Units GMS and CFM as well as cathodes business within Business Unit PP to develop in line with SGL Group’s expectations
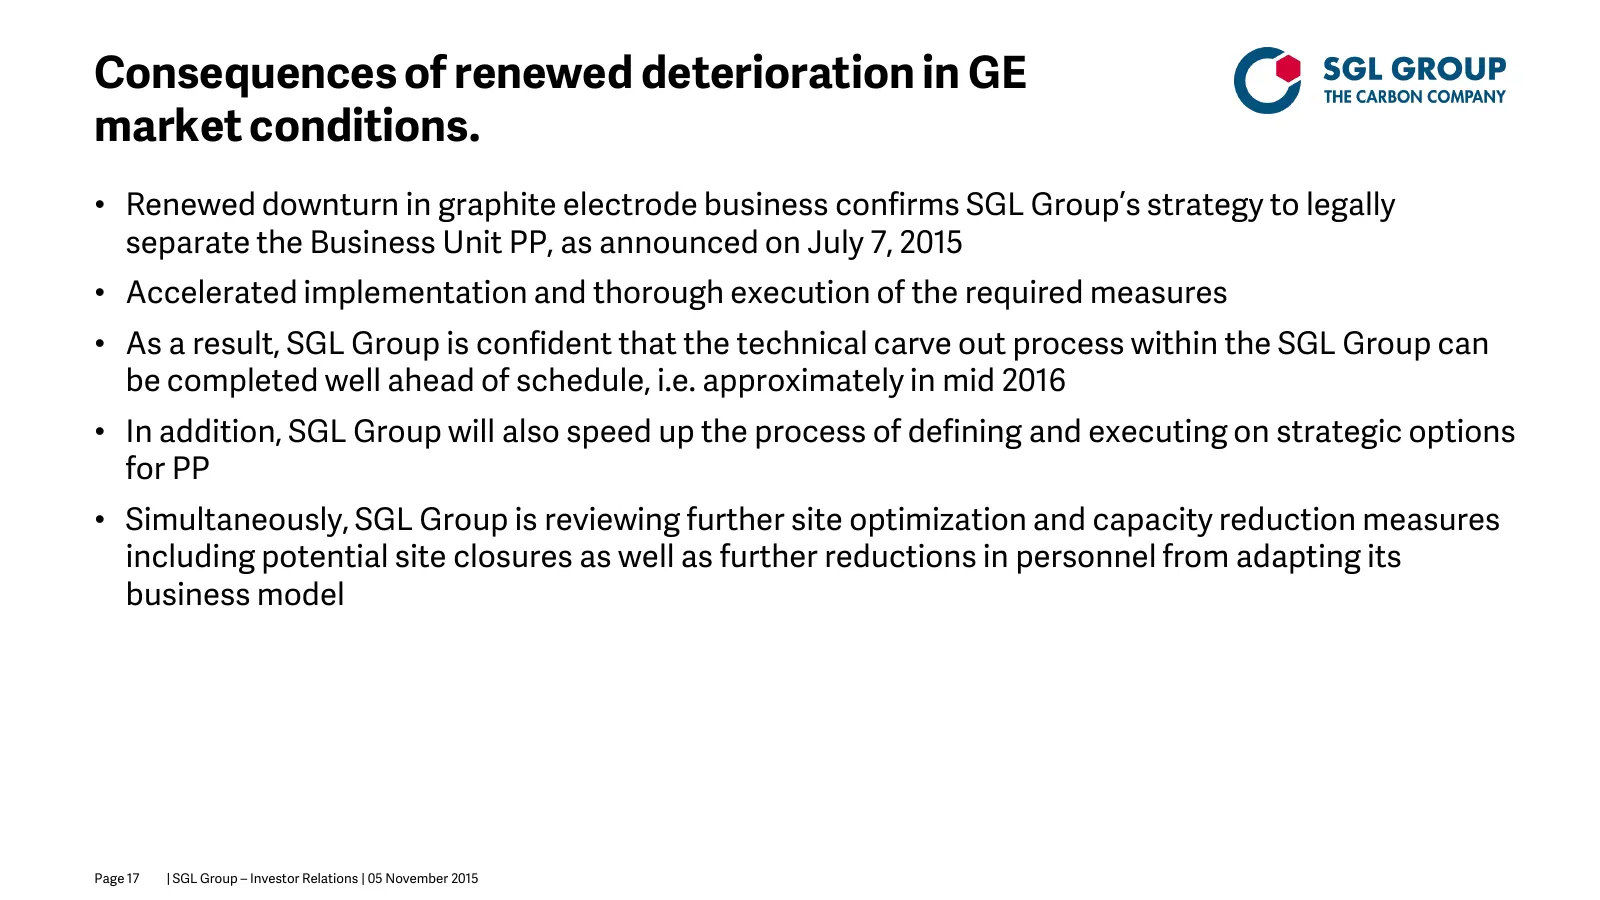
Slide 17: Consequences of renewed deterioration in GE market conditions
Consequences of renewed deterioration in GE market conditions. • Renewed downturn in graphite electrode business confirms SGL Group’s strategy to legally separate the Business Unit PP, as announced on July 7, 2015 • Accelerated implementation and thorough execution of the required measures • As a re
Slide 18: Thank you for your attention! Your questions, please
Thank you for your attention ! Your questions, please © Copyright SGL CARBON SE ® Registered trademarks of SGL CARBON SE
Source: Internet Archive copy of sglgroup.com
More decks from SGL Carbon SE
 9M 2026 Earnings Presentation30 slides · Nov 5, 2026
 9M 2026 Earnings Presentation17 slides · Nov 5, 2026
 Q3 2024 Earnings Presentation28 slides · Nov 7, 2024
 H1 2024 Earnings Presentation18 slides · Aug 8, 2024
 Q1 2024 Earnings Presentation19 slides · May 8, 2024
 ESG Presentation (March 2024)7 slides · Mar 22, 2024