Res Care — UBS Healthcare Conference 2005
31 slides from Res Care's conference presentation, Feb 16, 2005

Slide 1: UBS Healthcare Conference February 16, 2005
UBS HEALTHCARE CONFERENCE FEBRUARY 16, 2005 !-- Page Number -->

Slide 2: Forward-Looking Statement
Except for historical information discussed, the statements made today are forward-looking statements that involve risks and uncertainties. Investors are cautioned that such statements are only predictions and that actual events or results may differ materially. In our filings under federal securiti

Slide 3: Company History
Organic growth focus–adding new homes to fill- in existing markets Infrastructure update substantially complete Went public in 1992 and developed nationwide footprint thru acquisitions in 1997 - 2000 Entered disabilities market in 1978 Founded in 1974 as Job Corps contractor 51 consecutive quarters
Slide 4: Geographic Presence
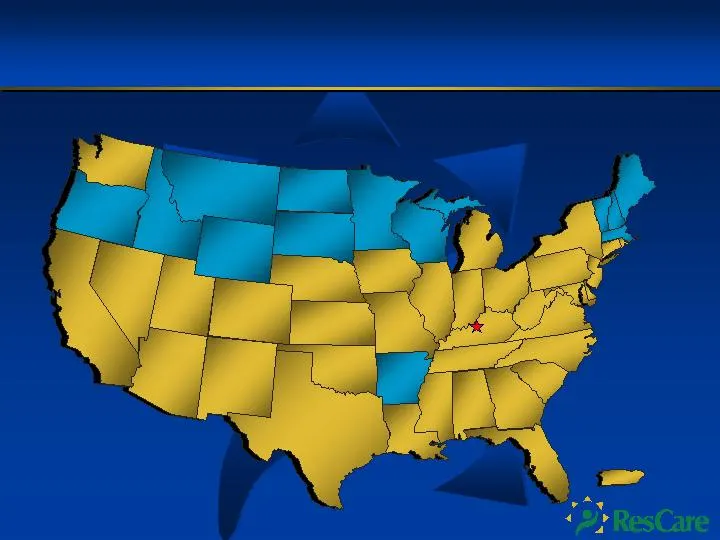
33 states, Washington, D.C., Puerto Rico and Canada PR Niagara-on-the-Lake, Ontario, Canada CA CO NE KS OK NM TX IL IN OH WV KY TN LA FL NY NJ MO GA AZ NC VA PA IA SC UT WA MS AL NV Washington, D.C. MI 3 G EOGRAPHIC P RESENCE

Slide 5: Special Needs Markets
Youth Services Foster Care Alternative -Site Schools Charter Schools Community Group Homes Outdoor Therapeutic Programs Emergency Shelters Residential Treatment Centers Education & Training Basic Education Vocational Skills Career Counseling/ Placement Life Skills Programs Residential Services Socia
Slide 6: Payor Mix
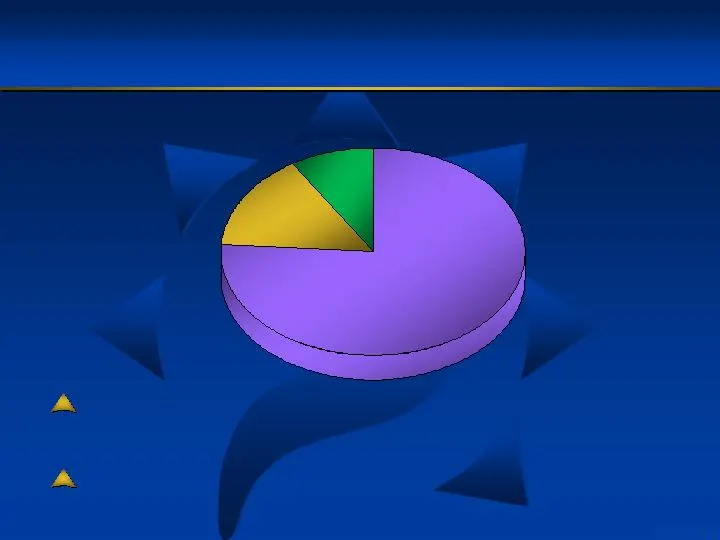
Medicaid reimbursement through 28 state programs Medicaid Dept of Labor Others 75% 14% 11% No Medicare 5 P AYOR M IX

Slide 7: Business Segments
LTM - Ended 9/30/04 ($ in millions) (1) Includes a charge for the 2003 refinancing, and director stock option expense as a result of the Onex transaction. $ (46.3) Operating income Revenues Other expense Add: Depreciation & amortization $ 72.2 -- $ 20.1 $ 180.9 -- EBITDA $ 2.4 1.3 $ 50.2 $ 764.4 $ 9

Slide 8: Disabilities Services
No federally mandated reimbursement rates State and local agencies are responsible for establishing rates based on individual needs States must offer services to receive federal Medicaid matching funds National Advocacy Campaign focuses on direct support wages Small portion of most state Medicaid bu
Slide 9: Developmental Disabilities Demographics
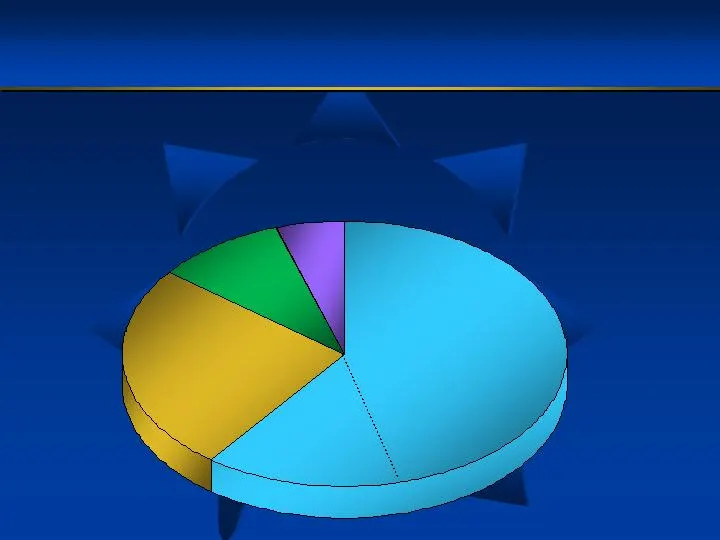
4.6 million people with developmental disabilities in U.S. Residential Services 460,000 Waiting Lists 220,000 Family Caregivers 2.6 million Other 1.3 million 25% of family caregivers over 60 years old 8 D EVELOPMENTAL D ISABILITIES D EMOGRAPHICS

Slide 10: Developmental Disabilities Growth Drivers
Strong Demand Due to Demographics - Aging family caregivers Legislation & Litigation - Americans with Disabilities Act - June 1999 Olmstead decision Privatization Trend - State operated programs decreased from 51.4% in 1977 to 11% in 2000 Rise of Vocal Advocacy Groups - ARC, AAMR Pressure to Reduce

Slide 11: Value Added Services
Improved quality of life and self-empowerment Active participation in community life Opportunities for self-employment/job training Individualized support in a positive environment Proximity to family and friends Reduced burden of care Respite services to assist Improved proximity and access Cost-ef
Slide 12: Disabilities Service Delivery Models
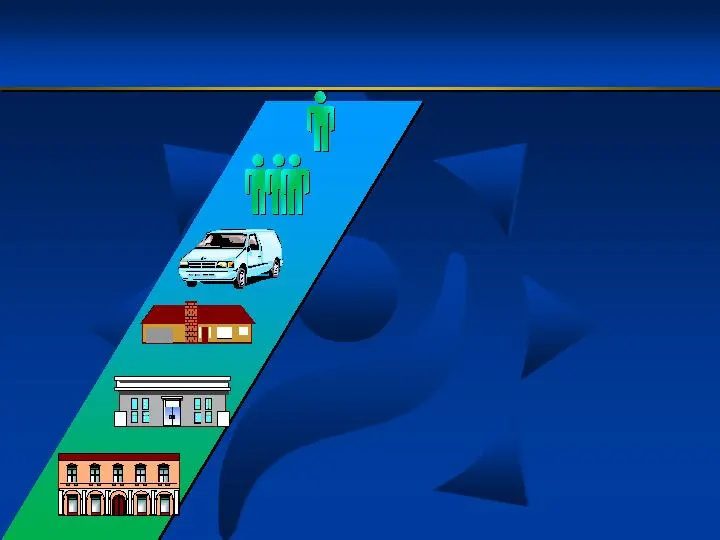
ICF/MR Group Home ICF/MR Facility Periodic In-Home Services Staffed Waiver Home Host Home State Institution Supported Employment Day Habilitation Services Self directed services 11 D ISABILITIES S ERVICE D ELIVERY M ODELS

Slide 13: ResCare Disabilities Services
12 People Served Sites Larger Facilities 1,050 13 Group Homes and Supported 8,250 2,530 Living In-Home, Periodic Services 10,000 Other (Case Management, Supported Employment, Day 1,500 Programs) R ESCARE D ISABILITIES S ERVICES
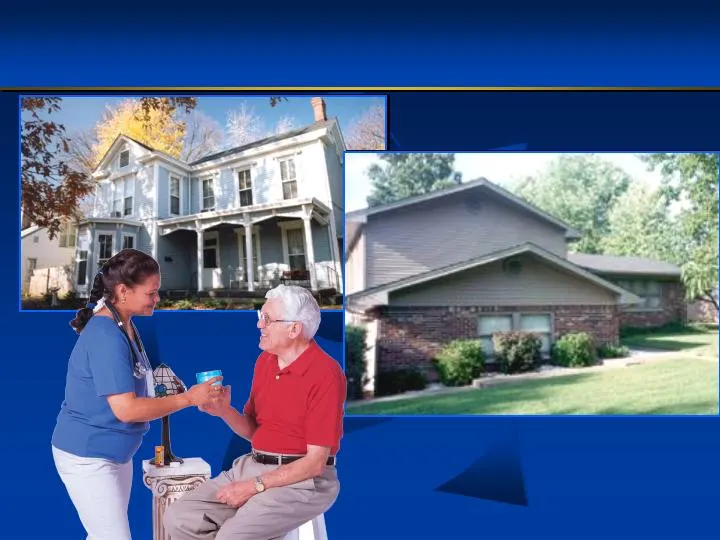
Slide 14: Disabilities Services
13 D ISABILITIES S ERVICES

Slide 15: Reimbursement Landscape
States have been under significant budget pressures Environment is showing some signs of improvement - State treasuries appear to be getting stronger Reimbursement rates have been essentially flat in the aggregate for last three years Each state has its own reimbursement system - Three states increa

Slide 16: Organic Growth
Periodic in-home services Double digit growth since 2001 Expect trend to continue Over 40% are services to elderly Tuck-Ins represent contra-cyclical opportunity 2003 completed 15 tuck-ins with annualized revenues of $11 million 2004 expect to complete tuck-ins representing annualized revenues of $1

Slide 17: Organic Growth Opportunities in 2004
Growth opportunities in both disabilities services and elder care Rolling out managed care adaptation for MR/DD piloted in Arizona Economically distressed operations may be “tucked into” our existing operations Filling in our existing clusters by continuing to open new homes Expanding Foster Care Se

Slide 18: Job Corps/Training Services
17 J OB C ORPS/ T RAINING S ERVICES

Slide 19: ResCare Job Corps
Second largest Job Corps contractor 16 centers in 12 states and Puerto Rico providing training services to almost 7,000 people each day - 12,000 annually Operate and sub-contract for 5 additional centers Low capital intensity 30 years experience and quality provider 18 R ES C ARE J OB C ORPS

Slide 20: Arbor E&T
Arbor E & T has 20 years experience Serves over 7,500 under-skilled persons on a continuing basis with a goal of employment – 20,000 people annually Funding primarily from HHS and DOL to local agencies Low capital intensity Expanding opportunities - Acquired TTI in December 2004 - Added We Care cont

Slide 21: Key Investment Considerations
Leading Market Position Strong Long Term Market Drivers Market Leading Platform Franchise Stable and Recurring Revenues Established Relationships with Government Agencies and Advocacy Groups Proven Ability to Grow During Adverse Economic Conditions Motivated and Experienced Management Team 20 K EY I

Slide 22: Financial Overview
21 F INANCIAL O VERVIEW

Slide 23: New Credit Facility
$100 million senior secured revolving credit facility with $75 million sub-limit for the issuance of standby letters of credit. Bank One Capital Markets (JP Morgan Chase) $35 million term loan Maximum Leverage of 4.25 – Currently at 2.13 Minimum Fixed Charge of 1.20 – Currently at 1.47 Closed Decemb

Slide 24: Equity Infusion
On June 23, 2004 Onex Partners, LP invested $50.5 million in Convertible Preferred Shares Net proceeds to company will be used to fund growth Onex Partners also acquired 3.7 million shares of common stock from three insiders Onex Partners appointed 3 Directors to our Board of Directors 23 E QUITY I

Slide 25: Historical Balance Sheet
($ in millions) Cash A/R Net PP&E Total Assets Senior Bank Debt Senior Unsecured Debt Convertible Debt Other Debt/Leases Total Debt Equity Net Debt $ 72.1 124.6 61.7 $ 546.6 150.0 106.2 6.2 $ 262.4 $ 177.2 $ 190.3 $ 23.4 129.2 68.4 $ 503.0 22.0 150.0 12.8 4.9 $ 189.7 $ 192.3 $ 166.3 129.9 68.1 $ 590

Slide 26: Credit Rating Agencies
S&P Revised ResCare’s Corporate Rating from B to B+ – January, 2005 S&P revised outlook from Negative to Stable – November 2003 ResCare’s Leverage Ratio at Historic Low – June 2004 S&P revised outlook from Stable to Positive – May 2004 Moody’s Corporate Rating is B1 25 C REDIT R ATING A GENCIES

Slide 27: Leverage Ratio Improvement
EBITDA $55.4 $59.7 $63.9 EBITDAR $87.5 $95.1 $101.0 NET DEBT $190.3 $166.3 $83.3 LEVERAGE RATIO - EBITDA 3.4x 2.8x 1.3x NET LEASE ADJUSTED DEBT $448.0 $449.1 $380.1 LEVERAGE RATIO - EBITDAR 5.1x 4.7x 3.8x ($ in millions) 26 L EVERAGE R ATIO I MPROVEMENT FY 2002 FY 2003 LTM 9/30/04

Slide 28: Historical Operating Results
($ in millions except for EPS) (1) Actual results exclude specified items. (2) Excludes impact of accounting for non-cash beneficial conversion feature. 27 Revenue $ 919.7 $ 961.3 $ 995.5 $ 1,000 - 1,020 Net Income (1) $ 12.4 $ 14.8 $ 19.2 $ 18.5 - 20.0 Fully Diluted EPS (2) $ 0.50 $ 0.60 $ 0.69 $ 0

Slide 29: Reconciliation of Non-GAAP Information
Net income Add: Specified Items A/R related Insurance/Legal related Capital/Refinancing related Less: Tax effect of specified items Non-GAAP net income Add: Depreciation and amortization Interest expense, net Income taxes EBITDA Facility rent EBITDAR EPS as reported Specified items above Non-cash be

Slide 30: ResCare Strengths
Infrastructure and systems give ResCare a competitive advantage Demonstrated ability to grow in an adverse economy Expect incremental gains as economy improves Proven track record on acquisition strategy Right time to move forward 29 R ES C ARE S TRENGTHS

Slide 31: ResCare - Building Lives, Reaching Potential
iy ResCare Building Lives - Reaching Potential
Source: SEC EDGAR · 8-K filed Feb 16, 2005
More decks from Res Care Inc
 Debt Investor Presentation (December 2010)32 slides · Dec 8, 2010
 Investor Presentation (June 2009)20 slides · Jun 12, 2009
 Investor Presentation (March 2009)19 slides · Mar 11, 2009
 Investor Presentation (November 2008)19 slides · Nov 17, 2008
 Investor Presentation (May 2008)18 slides · May 14, 2008
 Investor Presentation (March 2008)17 slides · Mar 25, 2008