AltaGas Ltd. · TSX:ALA
AltaGas — Investor Presentation (October 2020)
42 slides from AltaGas's investor presentation, October 2020
Slide 1: Investor Presentation: October 2020
Investor Presentation: October 2020
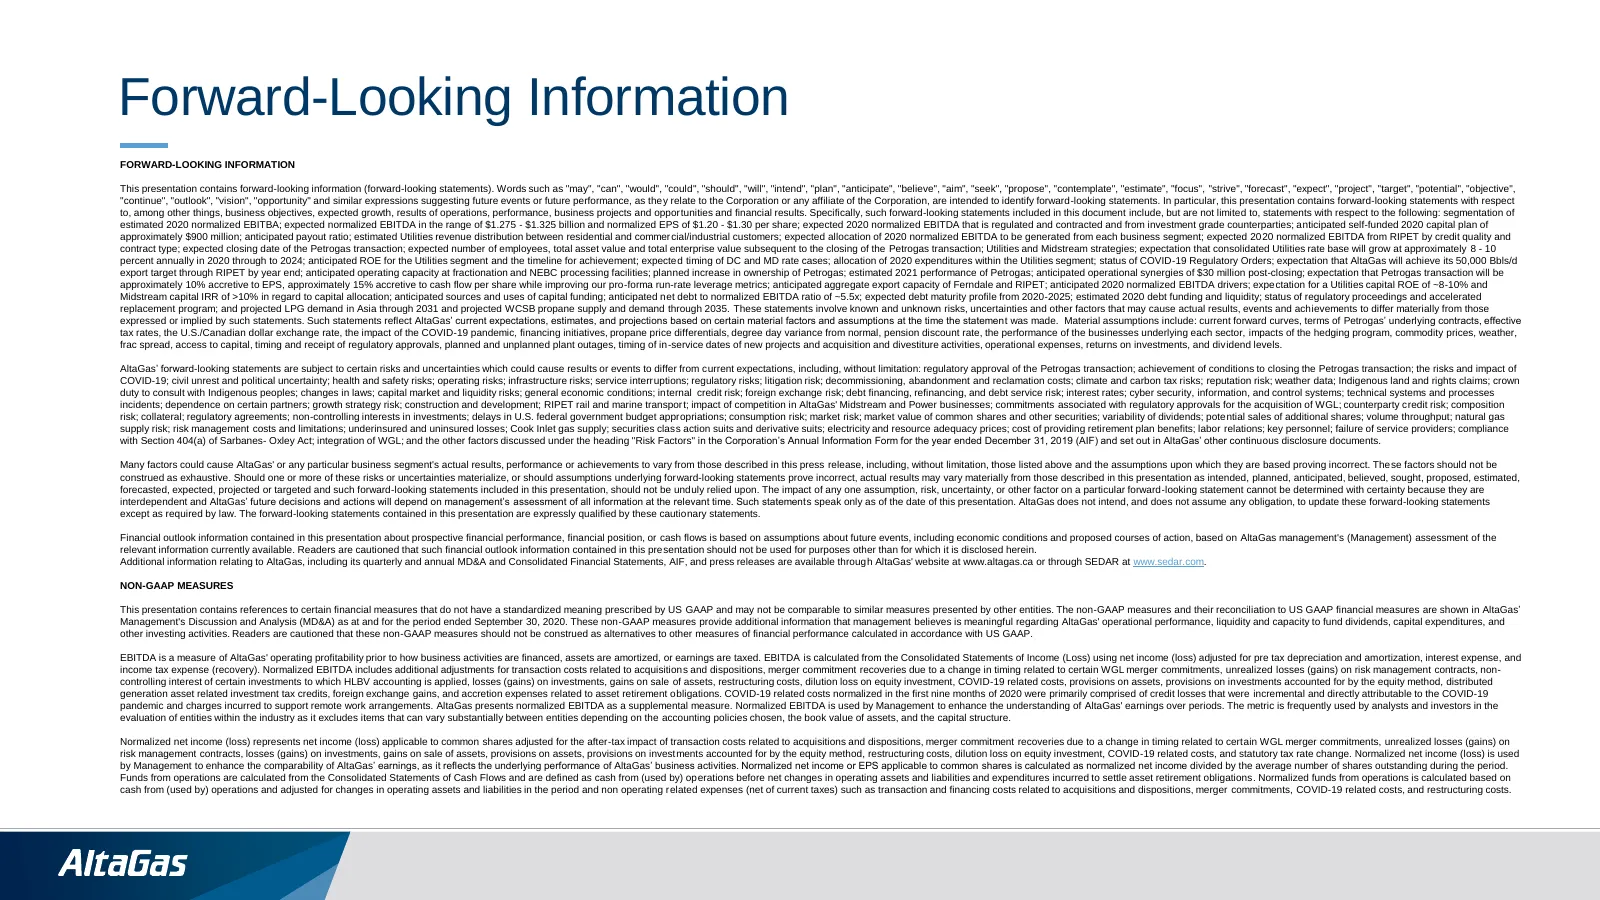
Slide 2: Forward-Looking Information
Forward-Looking Information FORWARD-LOOKING INFORMATION This presentation contains forward-looking information (forward-looking statements). Words such as "may", "can", "would", "could", "should", "will", "intend", "plan", "anticipate", "believe", "aim", "seek", "propose", "contemplate", "estimate",
Slide 3: Vision and Mission
Vision and Mission Our Vision: A leading North American infrastructure company that connects NGL and natural gas to domestic and global markets. Our Mission: To improve quality of life by safely and reliably connecting customers to affordable sources of energy for today and tomorrow. 3
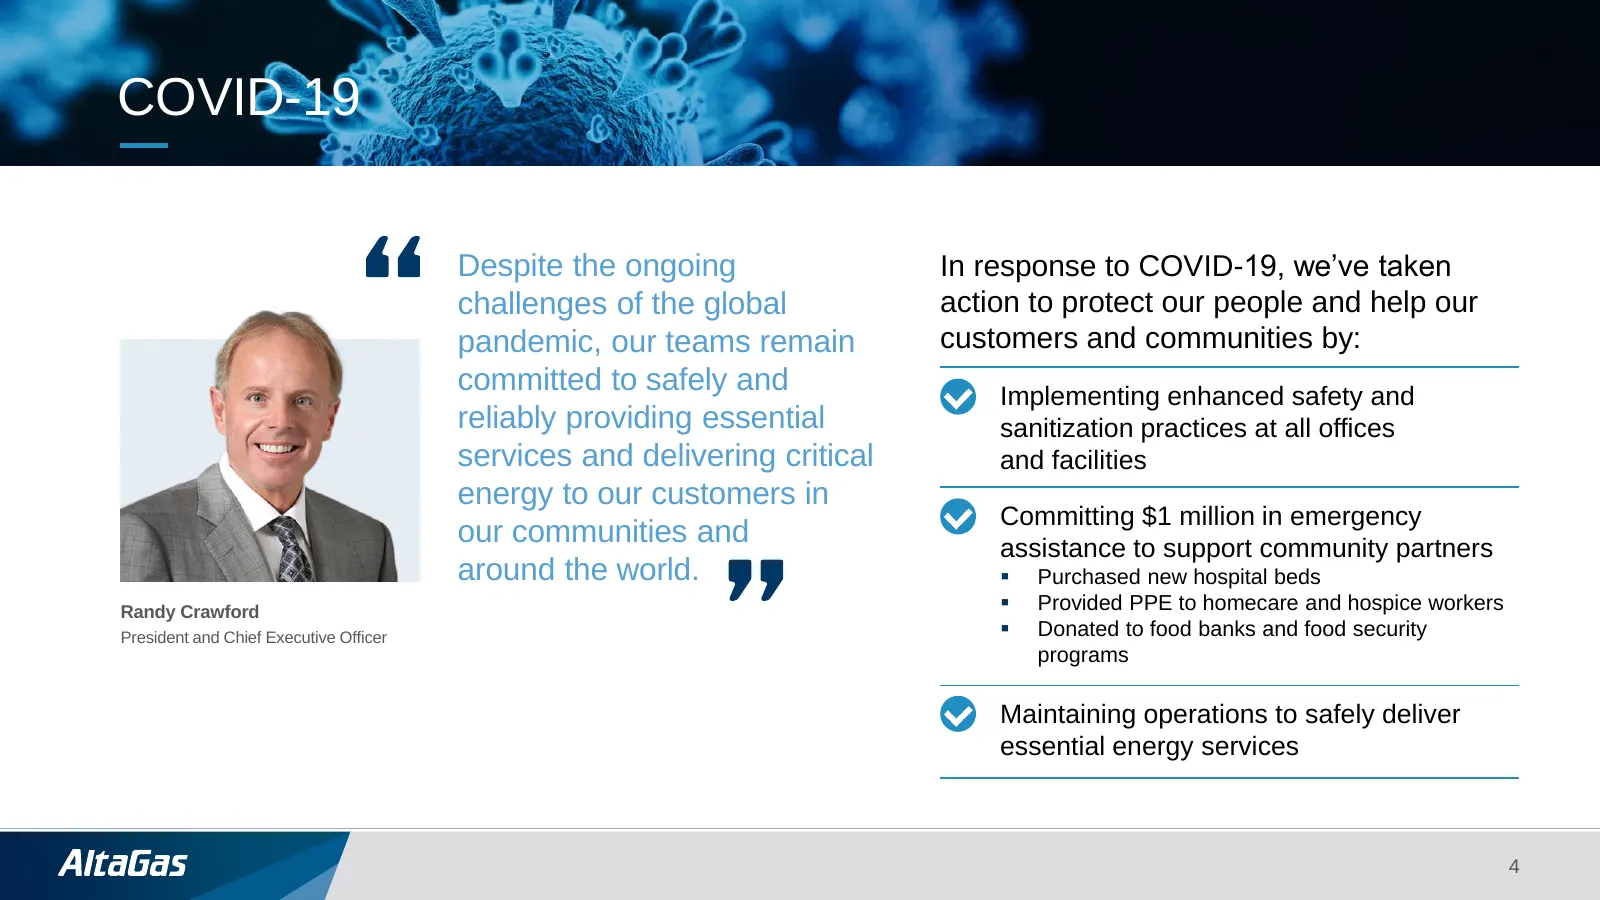
Slide 4: COVID-19
COVID-19 Despite the ongoing In response to COVID-19, we’ve taken challenges of the global action to protect our people and help our pandemic, our teams remain customers and communities by: committed to safely and Implementing enhanced safety and reliably providing essential sanitization practices a
Slide 5: Financial Highlights
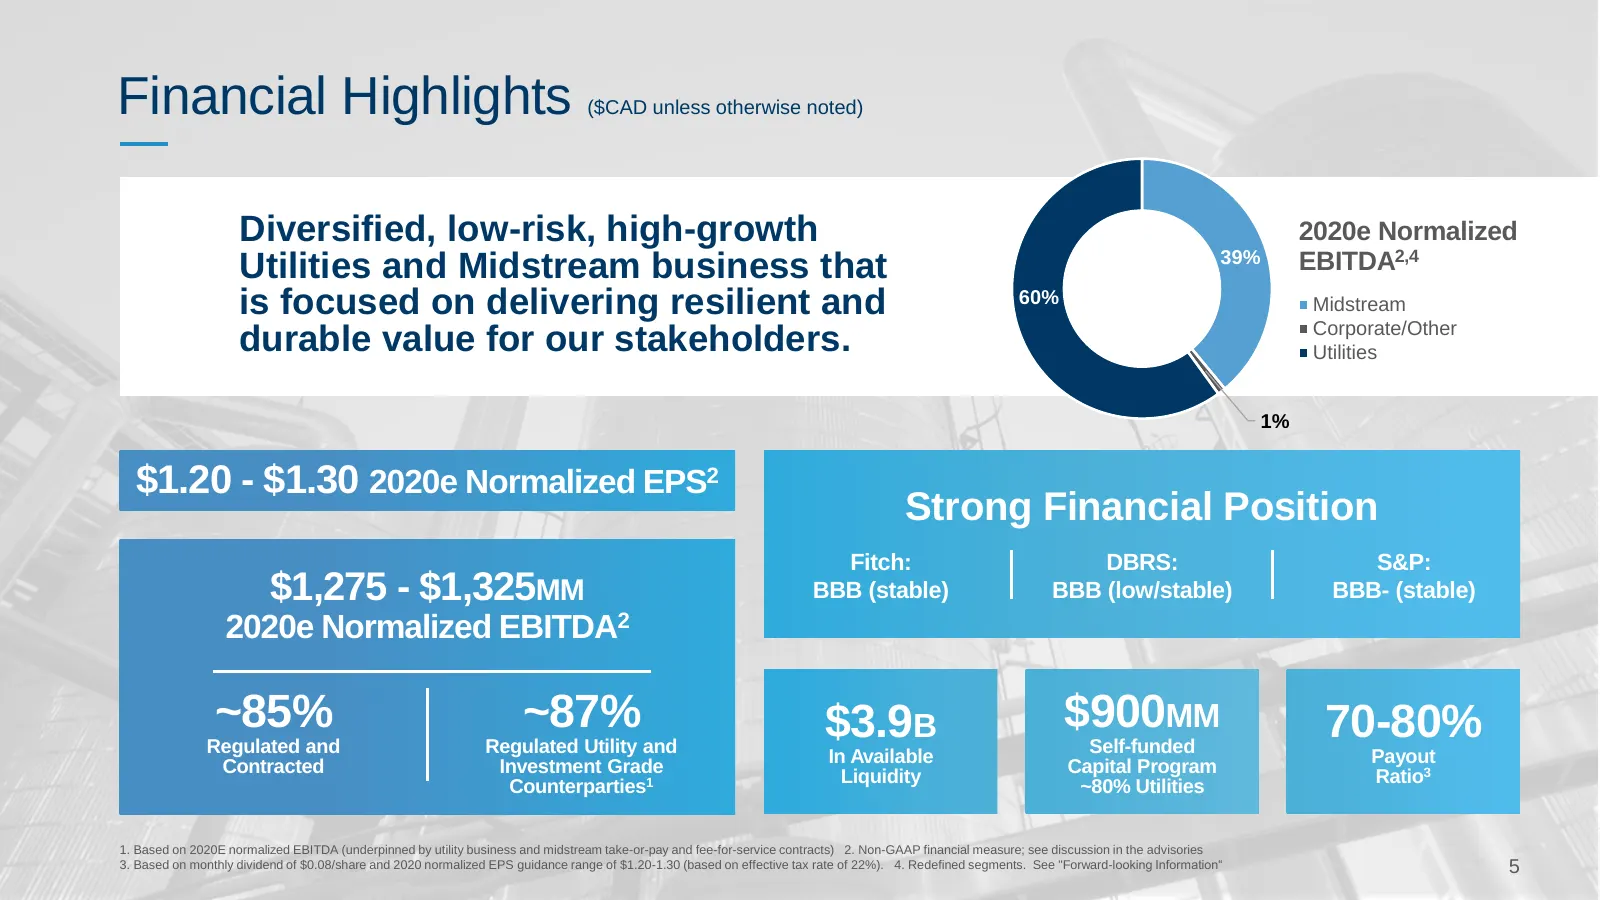
Financial Highlights ($CAD unless otherwise noted) Diversified, low-risk, high-growth 2020e Normalized Utilities and Midstream business that 39% EBITDA2,4 is focused on delivering resilient and 60% Midstream Corporate/Other durable value for our stakeholders. Utilities 1% $1.20 - $1.30 2020e Normali
Slide 6: Business Overview
Business Overview 6
Slide 7: AltaGas: Who We Are, Including Petrogas
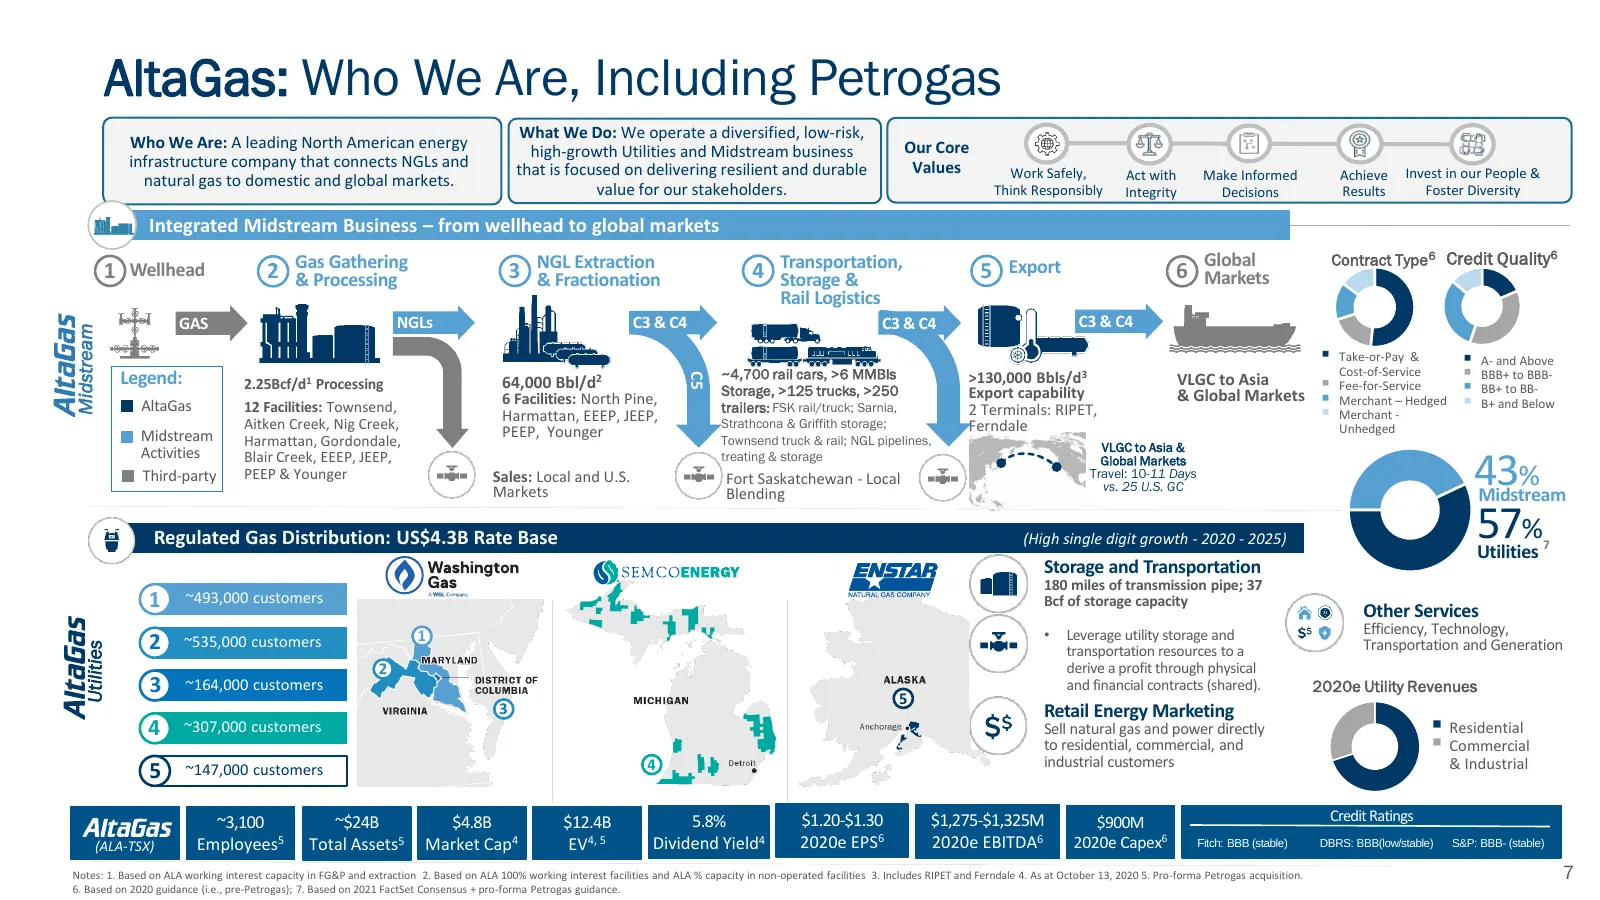
AltaGas: Who We Are, Including Petrogas What We Do: We operate a diversified, low-risk, Who We Are: A leading North American energy high-growth Utilities and Midstream business Our Core infrastructure company that connects NGLs and that is focused on delivering resilient and durable Values Work Safe
Slide 8: Rate Regulated Utilities Provide Stability and Growth
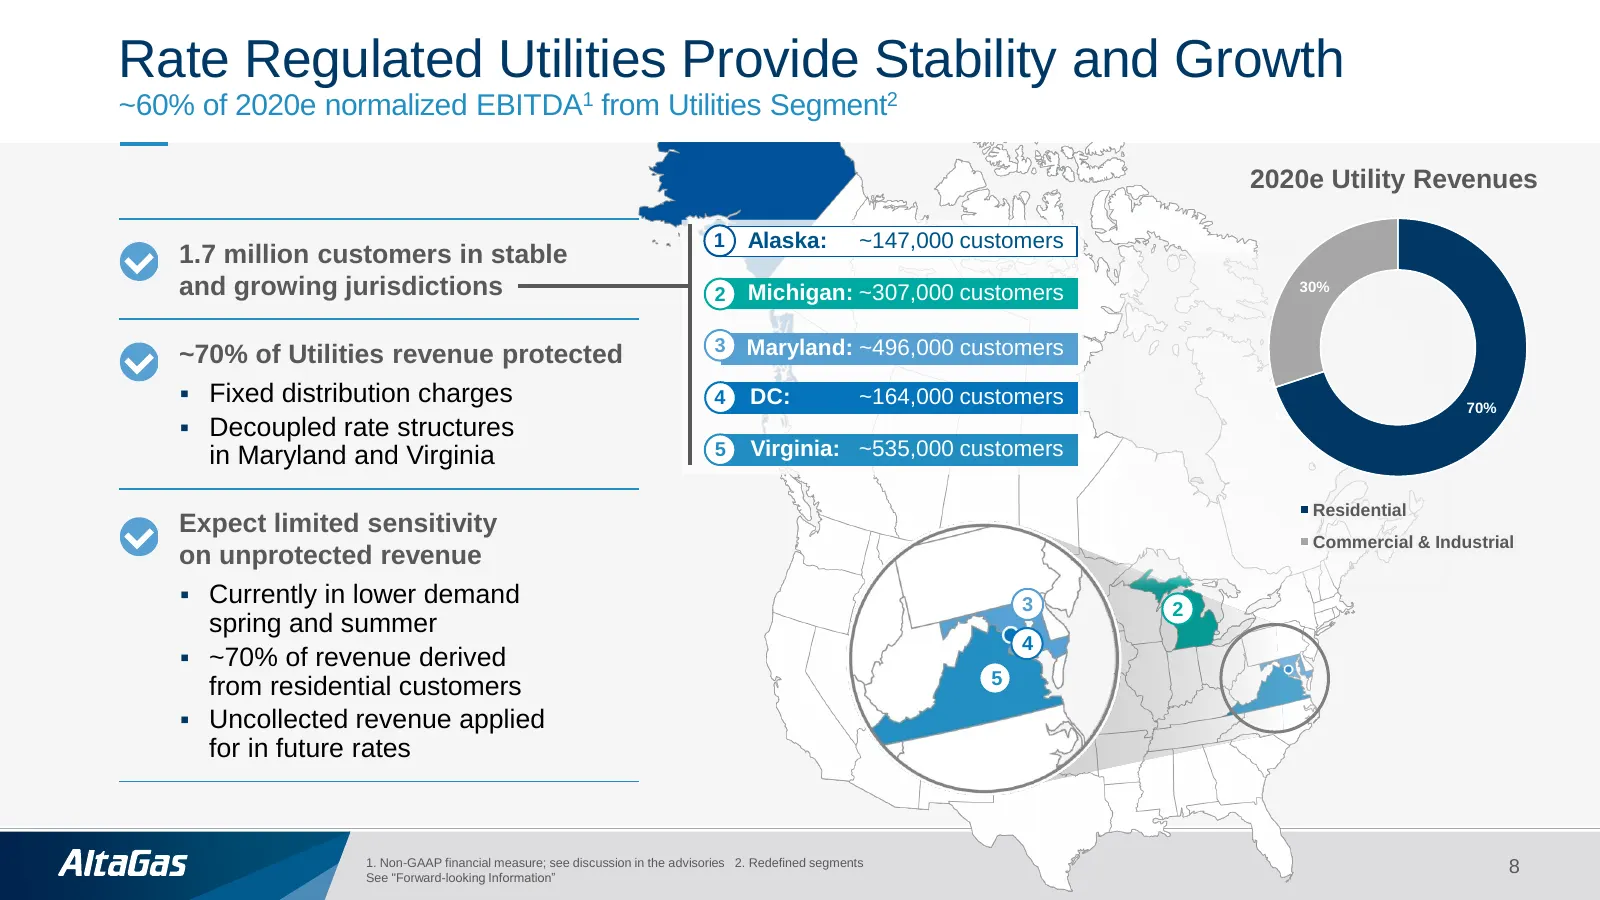
Rate Regulated Utilities Provide Stability and Growth ~60% of 2020e normalized EBITDA1 from Utilities Segment2 2020e Utility Revenues 1 Alaska: ~147,000 customers 1.7 million customers in stable and growing jurisdictions 2 Michigan: ~307,000 customers 30% 3 Maryland: ~496,000 customers r ~70% of Uti
Slide 9: Premier Midstream Business
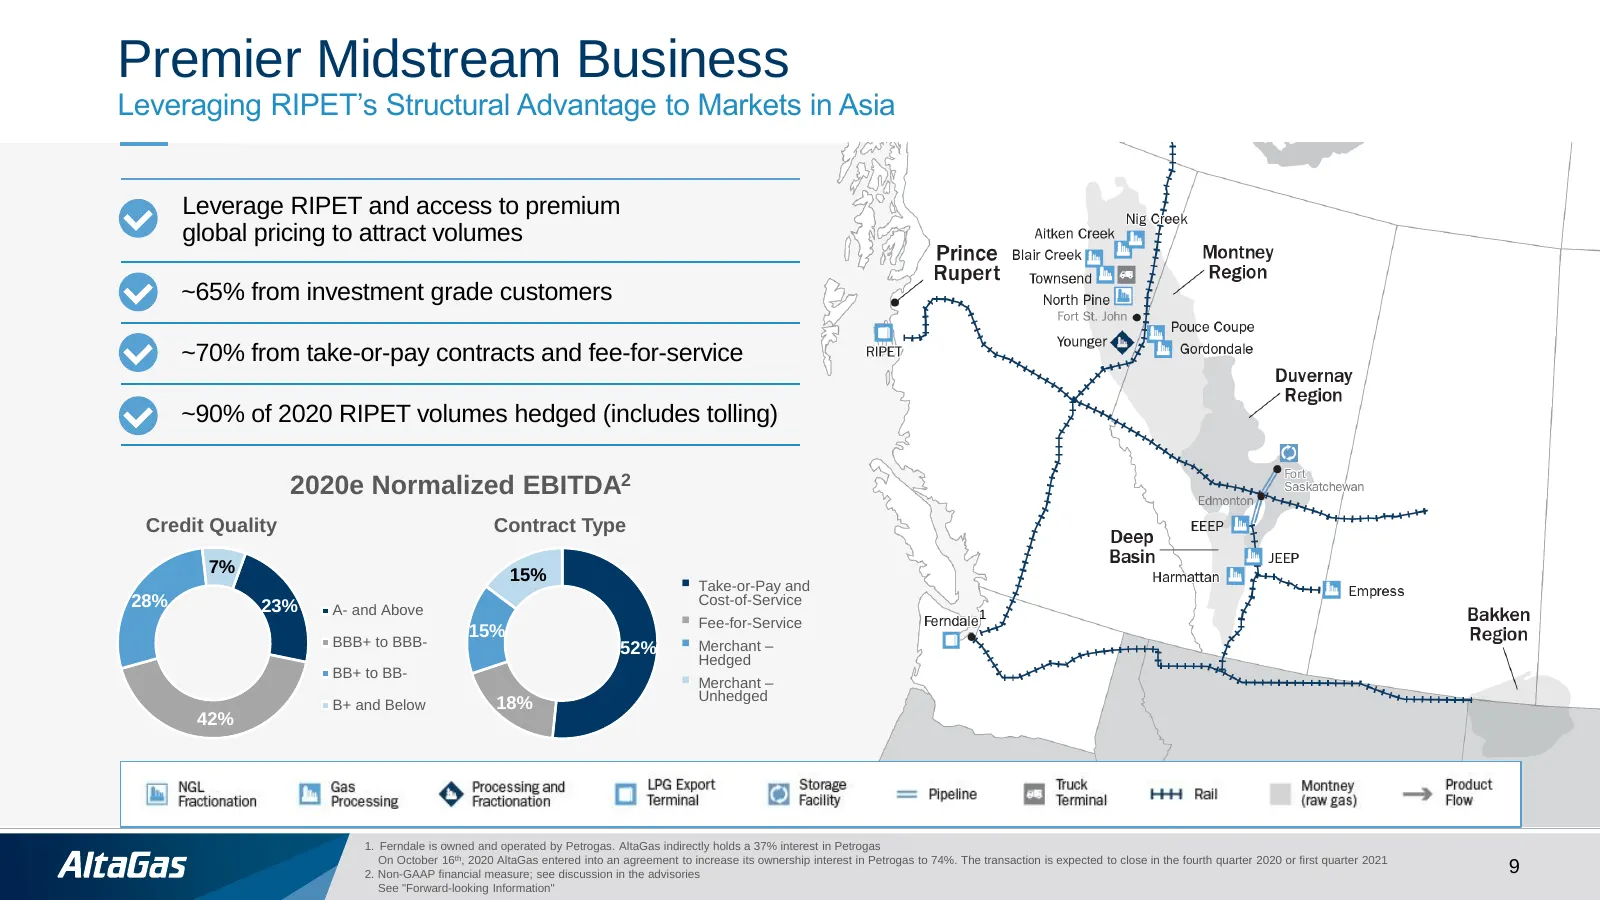
Premier Midstream Business Leveraging RIPET’s Structural Advantage to Markets in Asia Leverage RIPET and access to premium global pricing to attract volumes ~65% from investment grade customers ~70% from take-or-pay contracts and fee-for-service ~90% of 2020 RIPET volumes hedged (includes tolling) 2
Slide 10: Counterparty Credit
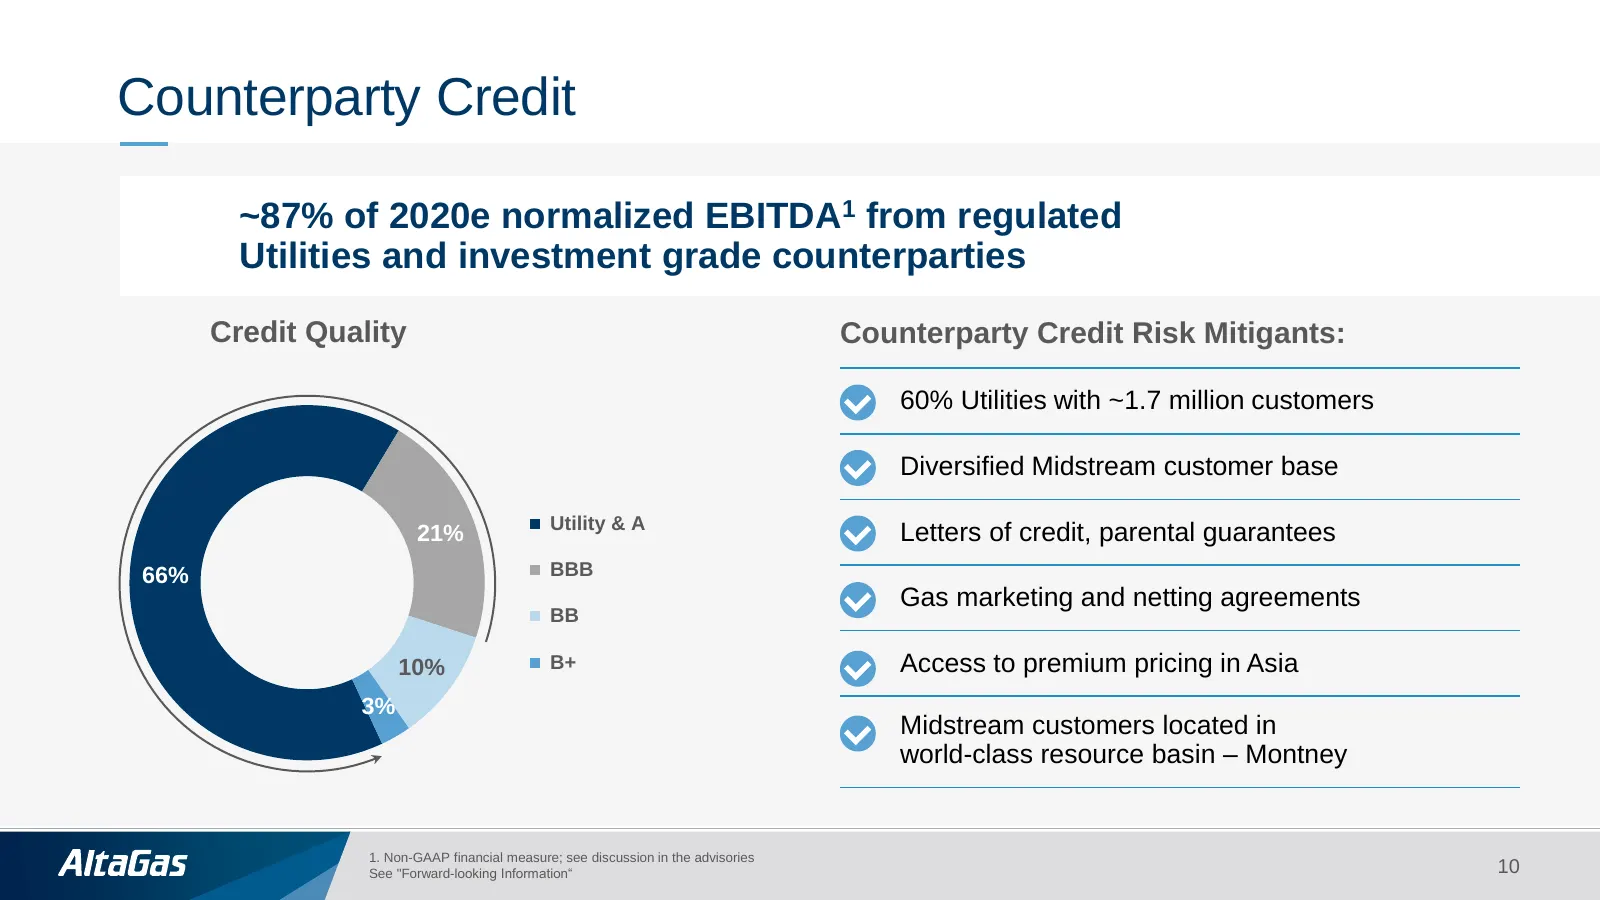
Counterparty Credit ~87% of 2020e normalized EBITDA1 from regulated Utilities and investment grade counterparties Credit Quality Counterparty Credit Risk Mitigants: 60% Utilities with ~1.7 million customers Diversified Midstream customer base Utility & A 21% Letters of credit, parental guarantees 66
Slide 11: Strong Commercial Underpinning
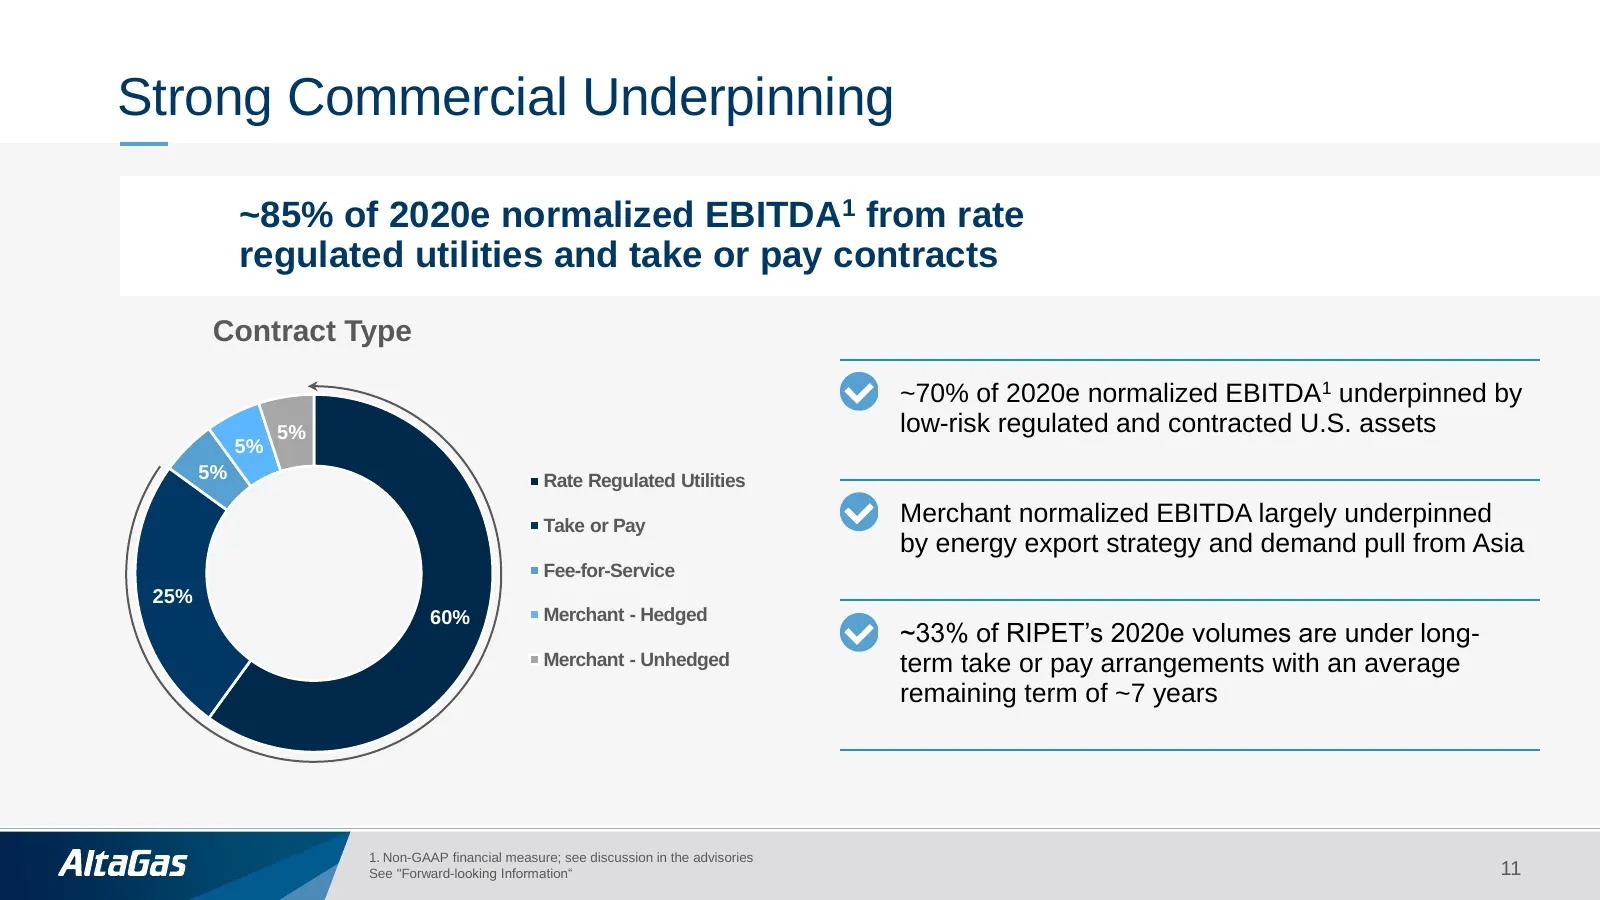
Strong Commercial Underpinning ~85% of 2020e normalized EBITDA1 from rate Top 5 producers regulated 2020e utilities and take or pay contracts Contract Type ~70% of 2020e normalized EBITDA1 underpinned by 5% low-risk regulated and contracted U.S. assets 5% 5% Rate Regulated Utilities Take or Pay Merc
Slide 12: Utilities
Utilities 12
Slide 13: Utilities Strategy - Drive Operational Excellence
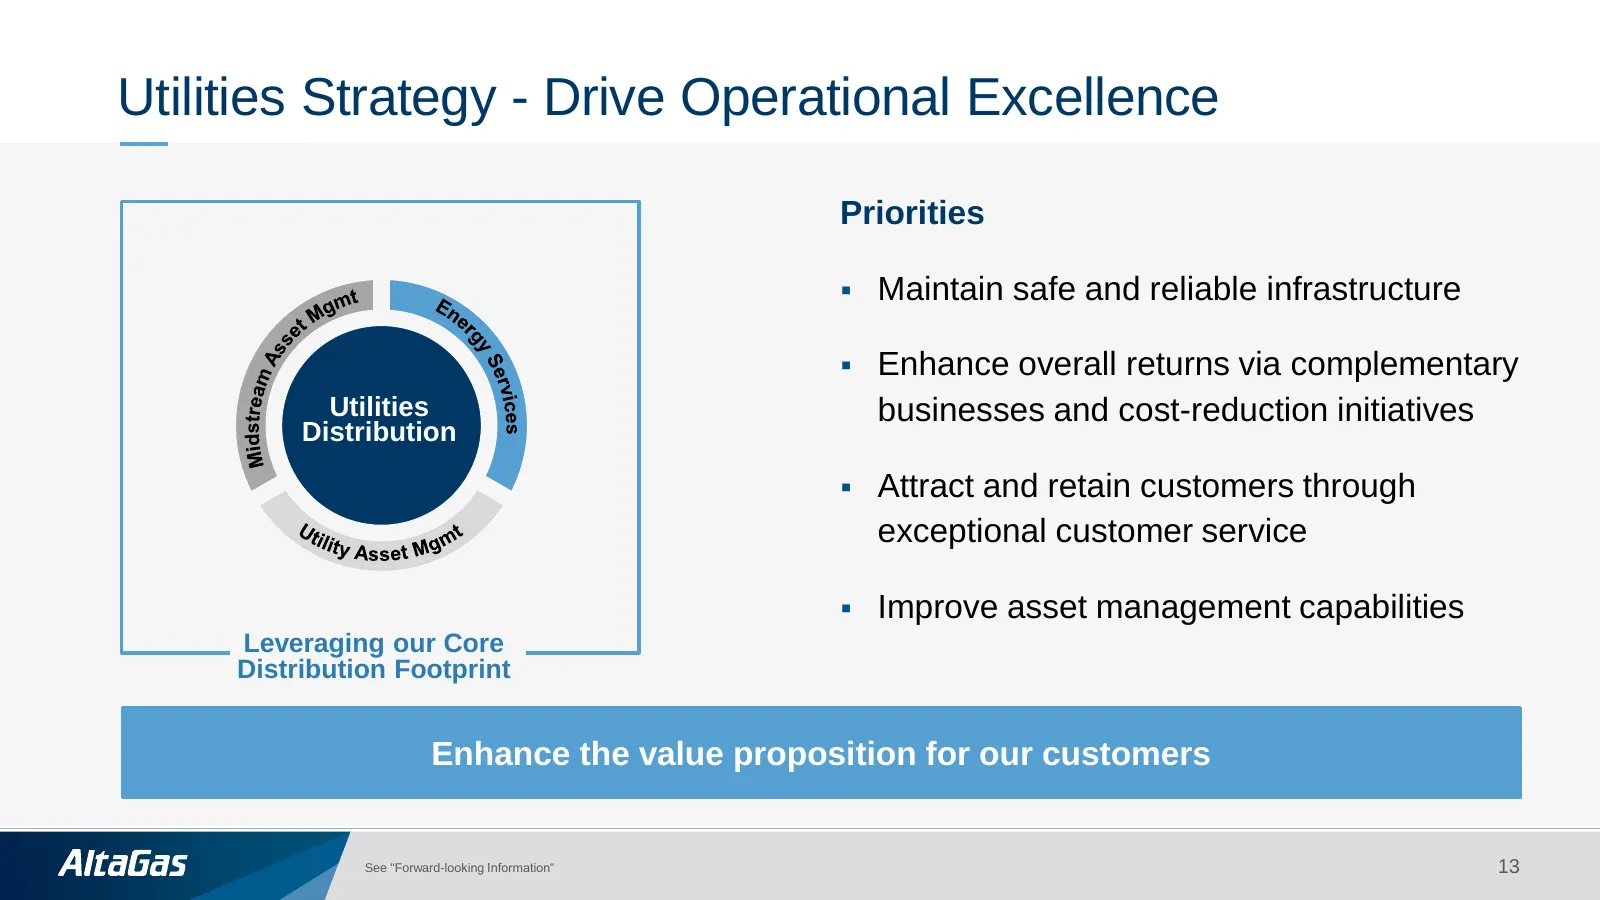
Utilities Strategy - Drive Operational Excellence Priorities ▪ Maintain safe and reliable infrastructure ▪ Enhance overall returns via complementary Utilities businesses and cost-reduction initiatives Distribution ▪ Attract and retain customers through exceptional customer service ▪ Improve asset ma
Slide 14: Our Utilities Business Operating Model
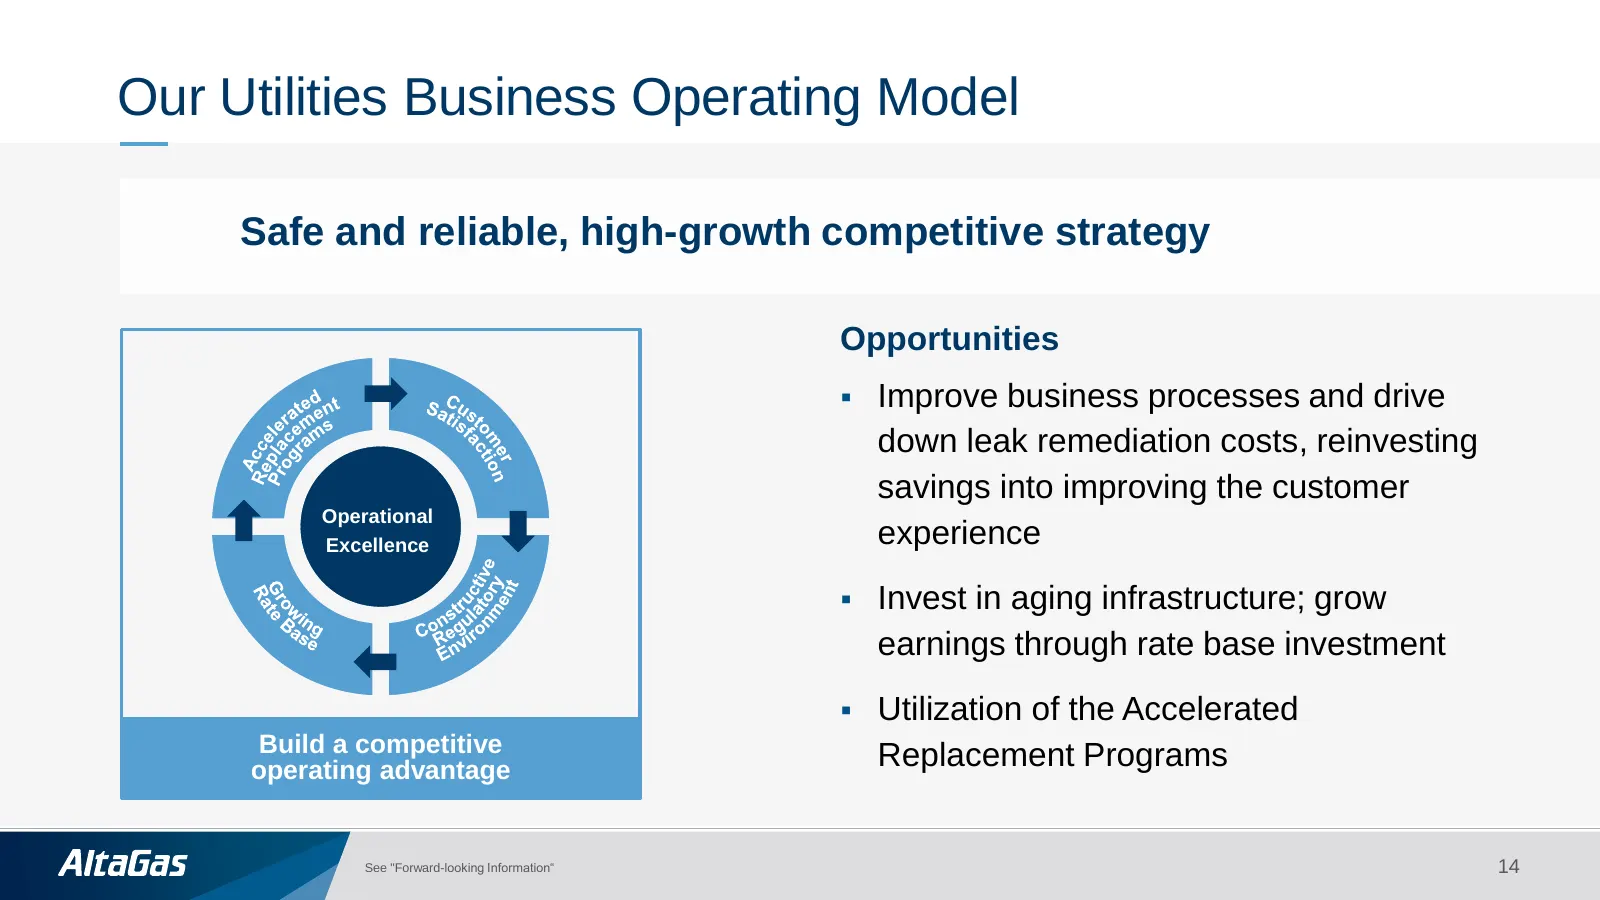
Our Utilities Business Operating Model Safe and reliable, high-growth competitive strategy Opportunities ▪ Improve business processes and drive down leak remediation costs, reinvesting savings into improving the customer Operational Excellence experience ▪ Invest in aging infrastructure; grow earnin
Slide 15: Utilities 2020 Growth Drivers
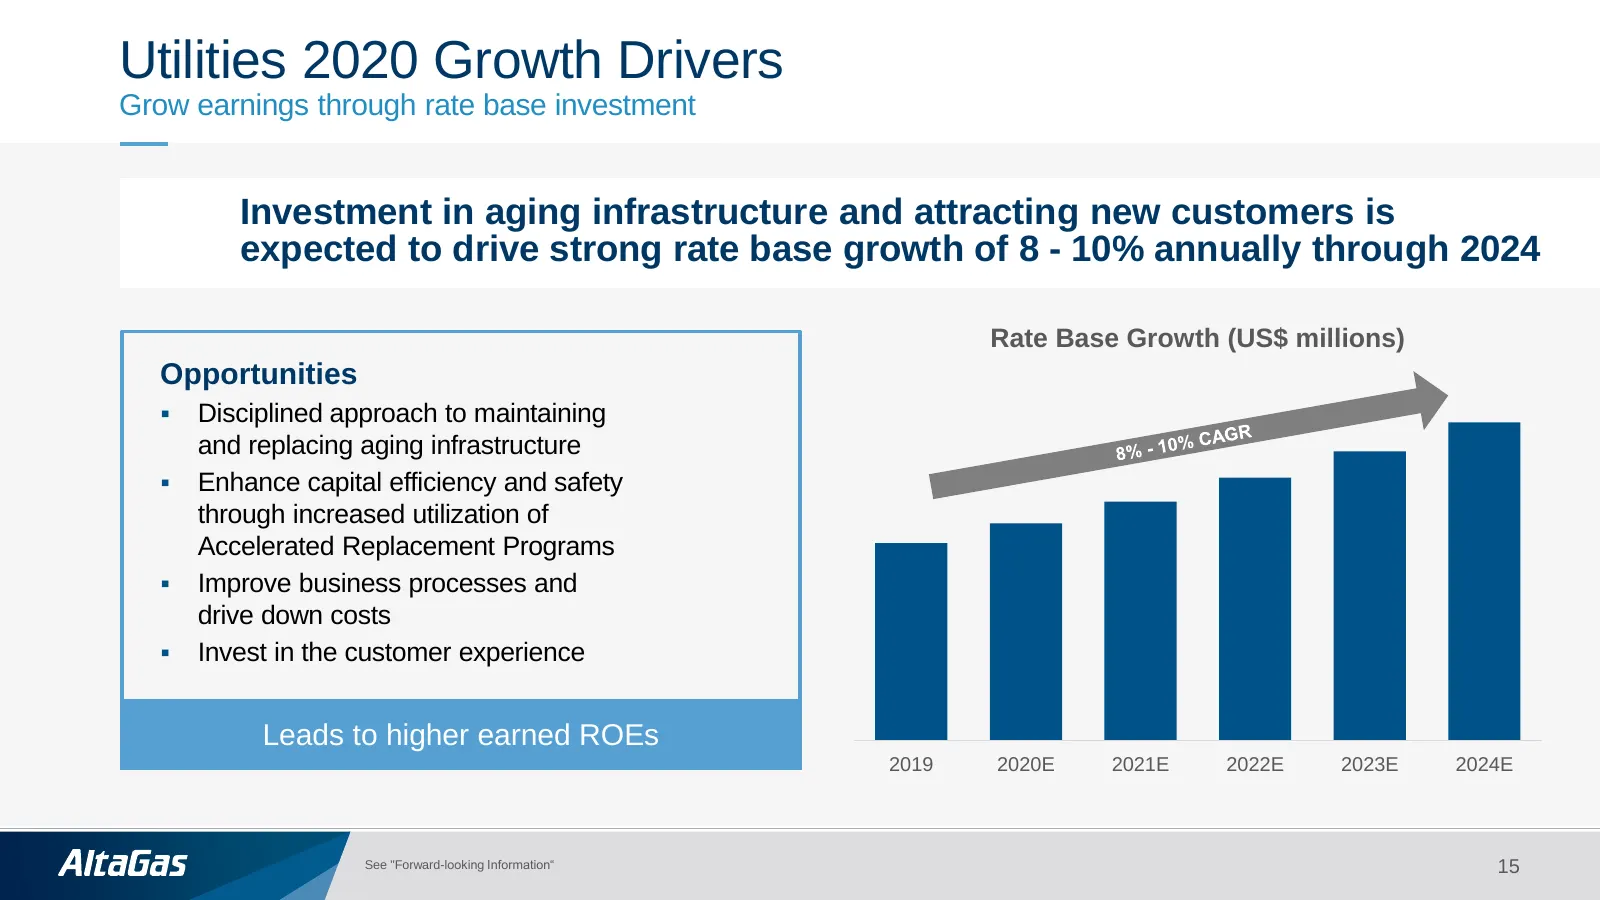
Utilities 2020 Growth Drivers Grow earnings through rate base investment Investment in aging infrastructure and attracting new customers is expected to drive strong rate base growth of 8 - 10% annually through 2024 Rate Base Growth (US$ millions) Opportunities ▪ Disciplined approach to maintaining a
Slide 16: WGL ROE Strategy
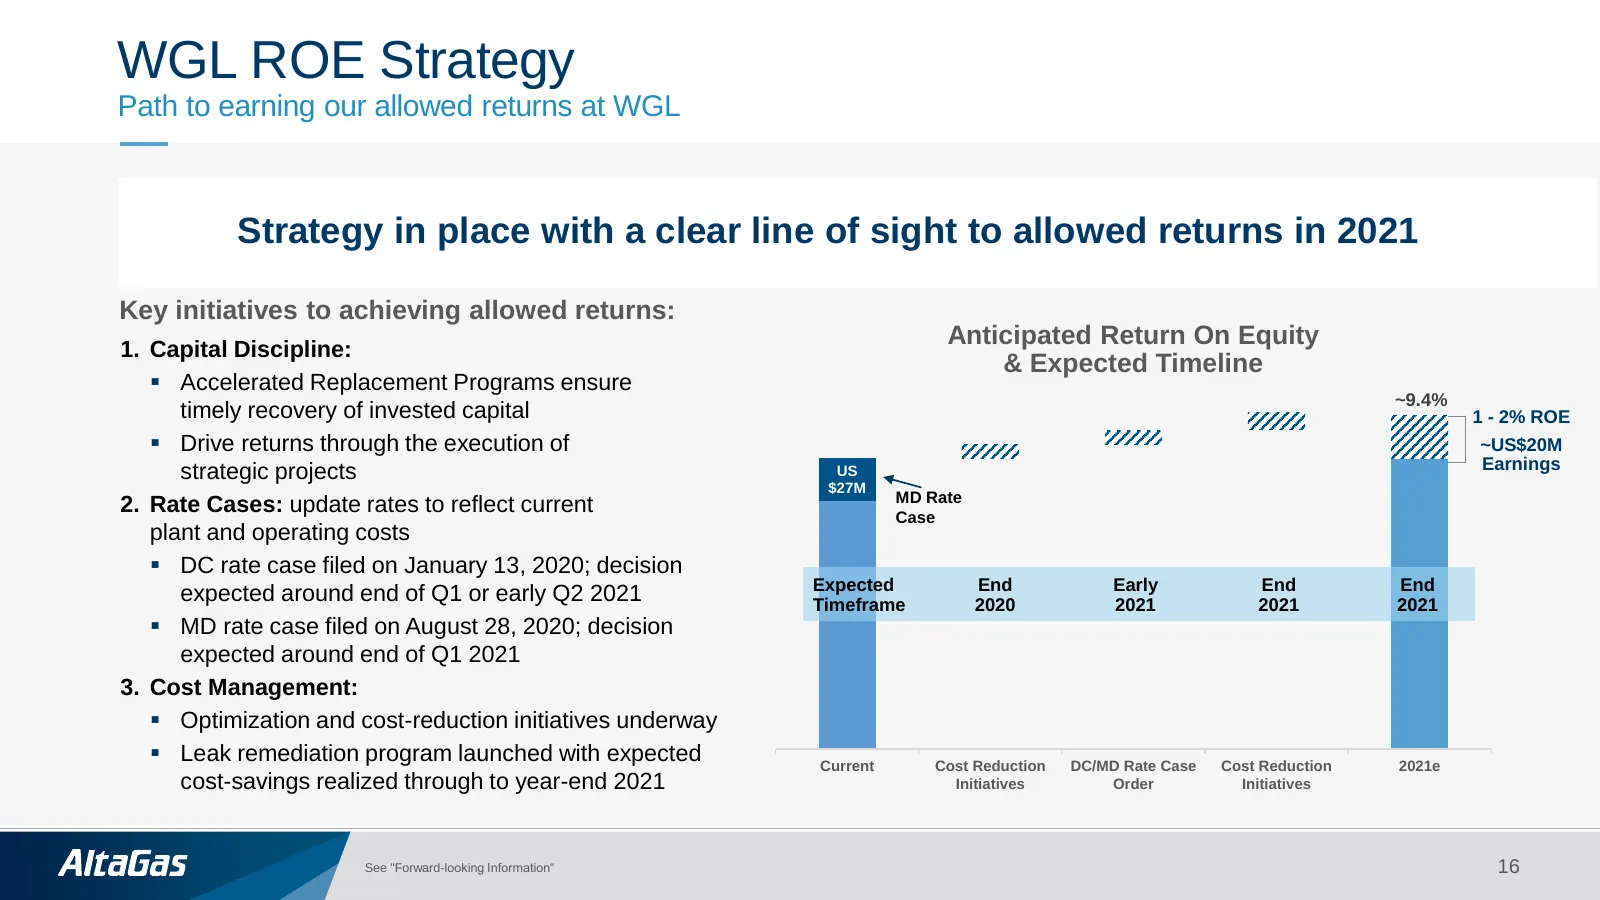
WGL ROE Strategy Path to earning our allowed returns at WGL Strategy in place with a clear line of sight to allowed returns in 2021 Key initiatives to achieving allowed returns: Anticipated Return On Equity 1. Capital Discipline: & Expected Timeline ▪ Accelerated Replacement Programs ensure ~9.4% ti
Slide 17: Utilities Segment Capital Spend
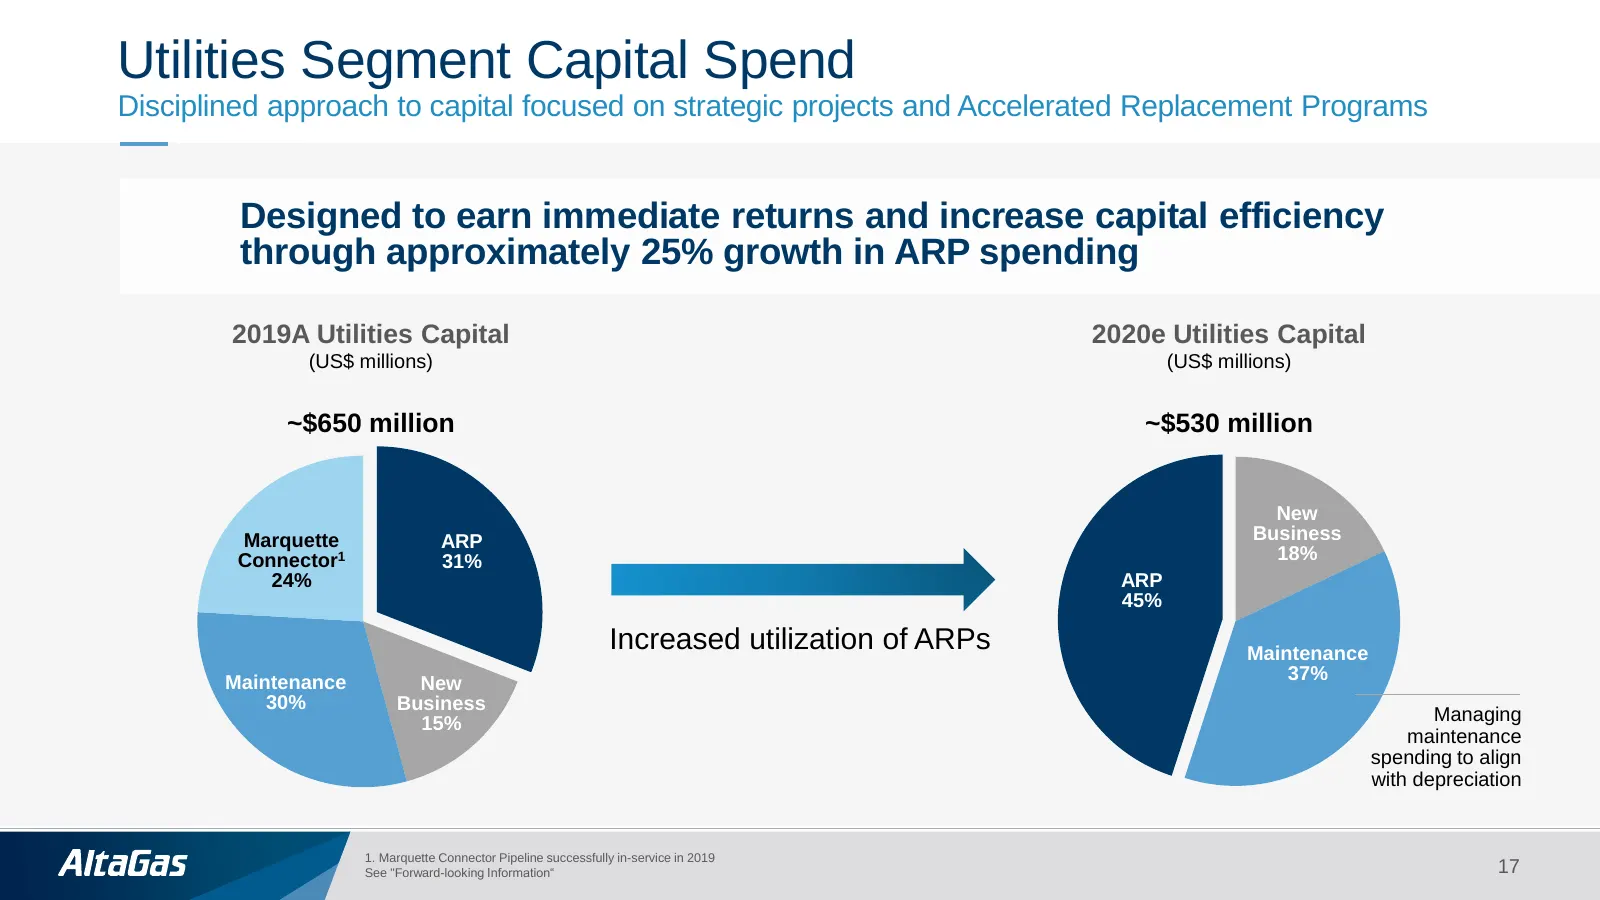
Utilities Segment Capital Spend Disciplined approach to capital focused on strategic projects and Accelerated Replacement Programs Designed to earn immediate returns and increase capital efficiency through approximately 25% growth in ARP spending 2019A Utilities Capital 2020e Utilities Capital (US$
Slide 18: Summary of Recent Rate Case Filings
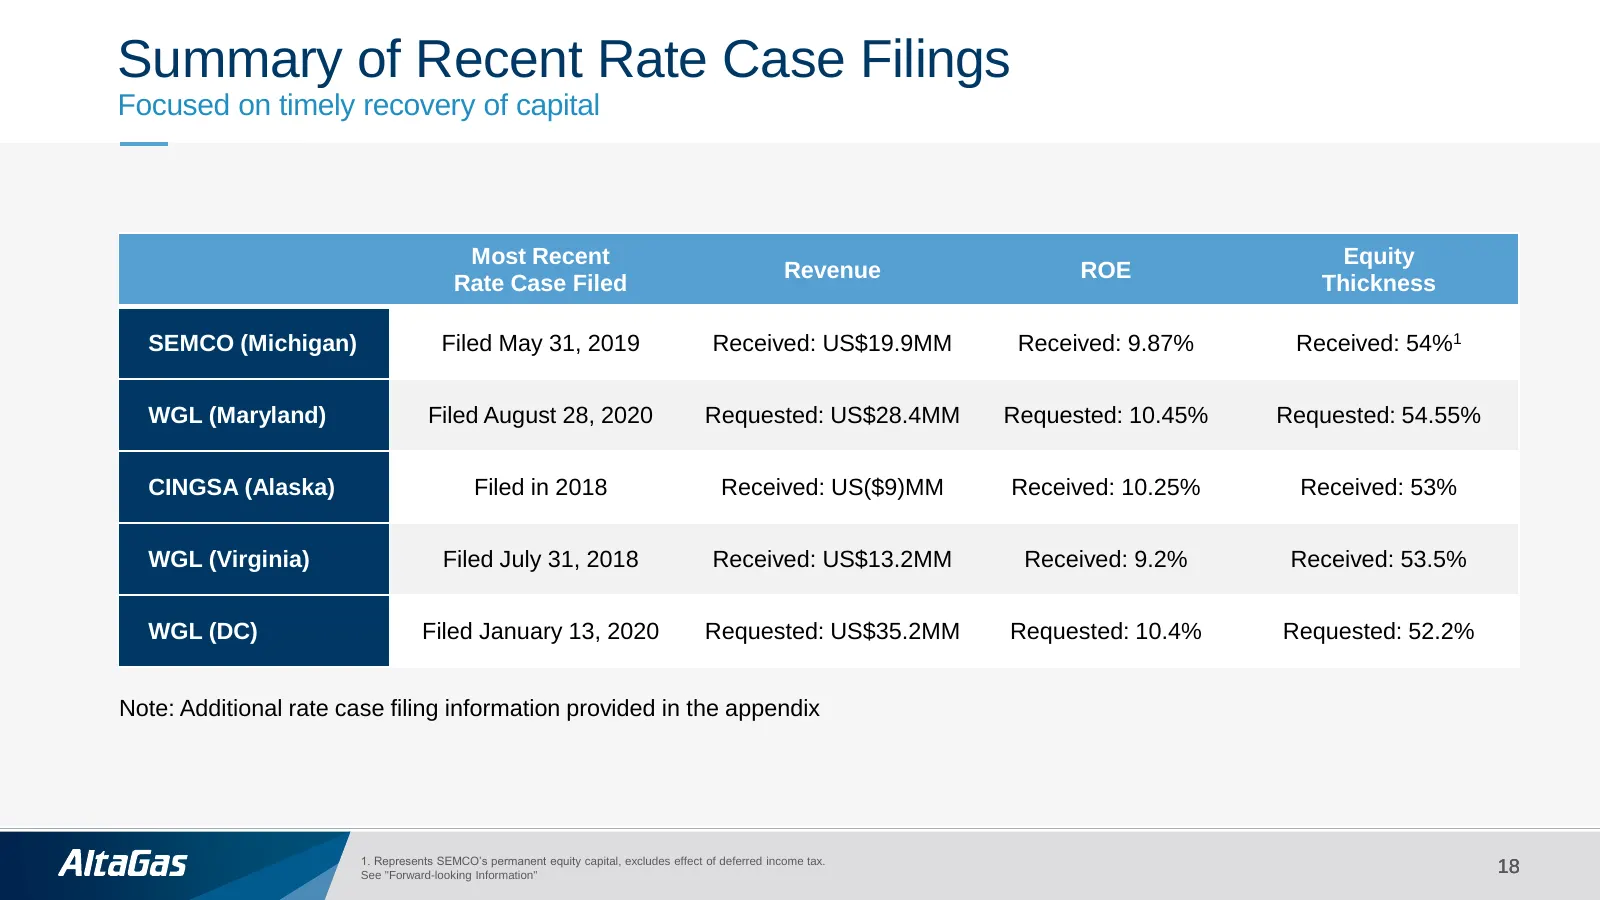
Summary of Recent Rate Case Filings Focused on timely recovery of capital Most Recent Equity Revenue ROE Rate Case Filed Thickness SEMCO (Michigan) Filed May 31, 2019 Received: US$19.9MM Received: 9.87% Received: 54%1 WGL (Maryland) Filed August 28, 2020 Requested: US$28.4MM Requested: 10.45% Reques
Slide 19: COVID-19 Regulatory Update
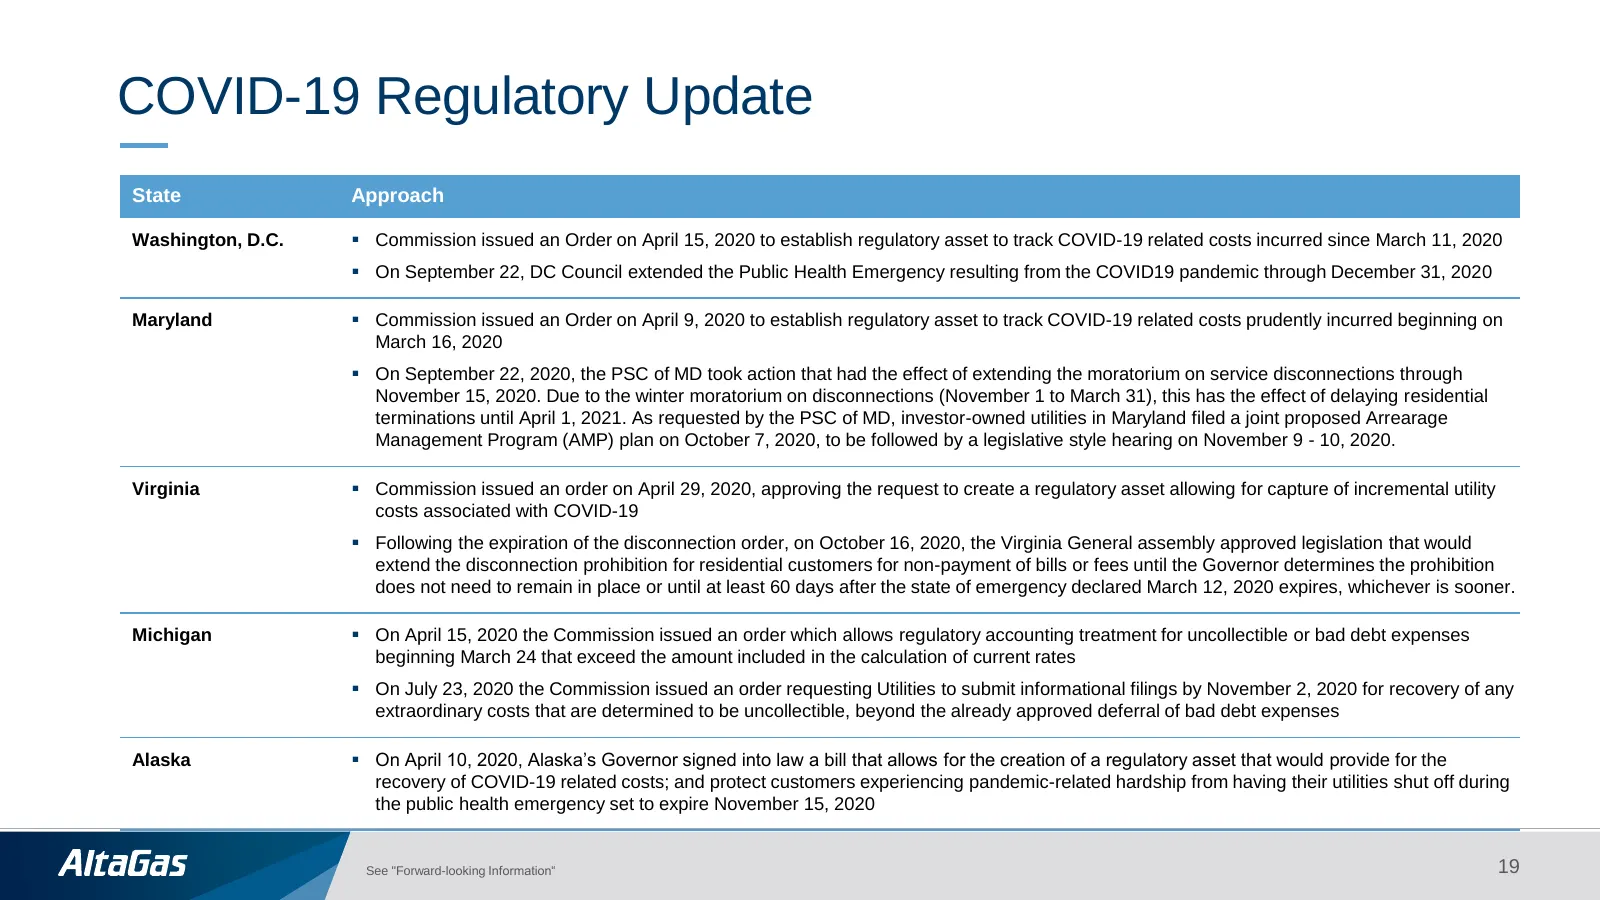
COVID-19 Regulatory Update State Approach Washington, D.C. ▪ Commission issued an Order on April 15, 2020 to establish regulatory asset to track COVID-19 related costs incurred since March 11, 2020 ▪ On September 22, DC Council extended the Public Health Emergency resulting from the COVID19 pandemic
Slide 20: Midstream
Midstream AltaGas nn
Slide 21: Our Midstream Strategy is Straightforward
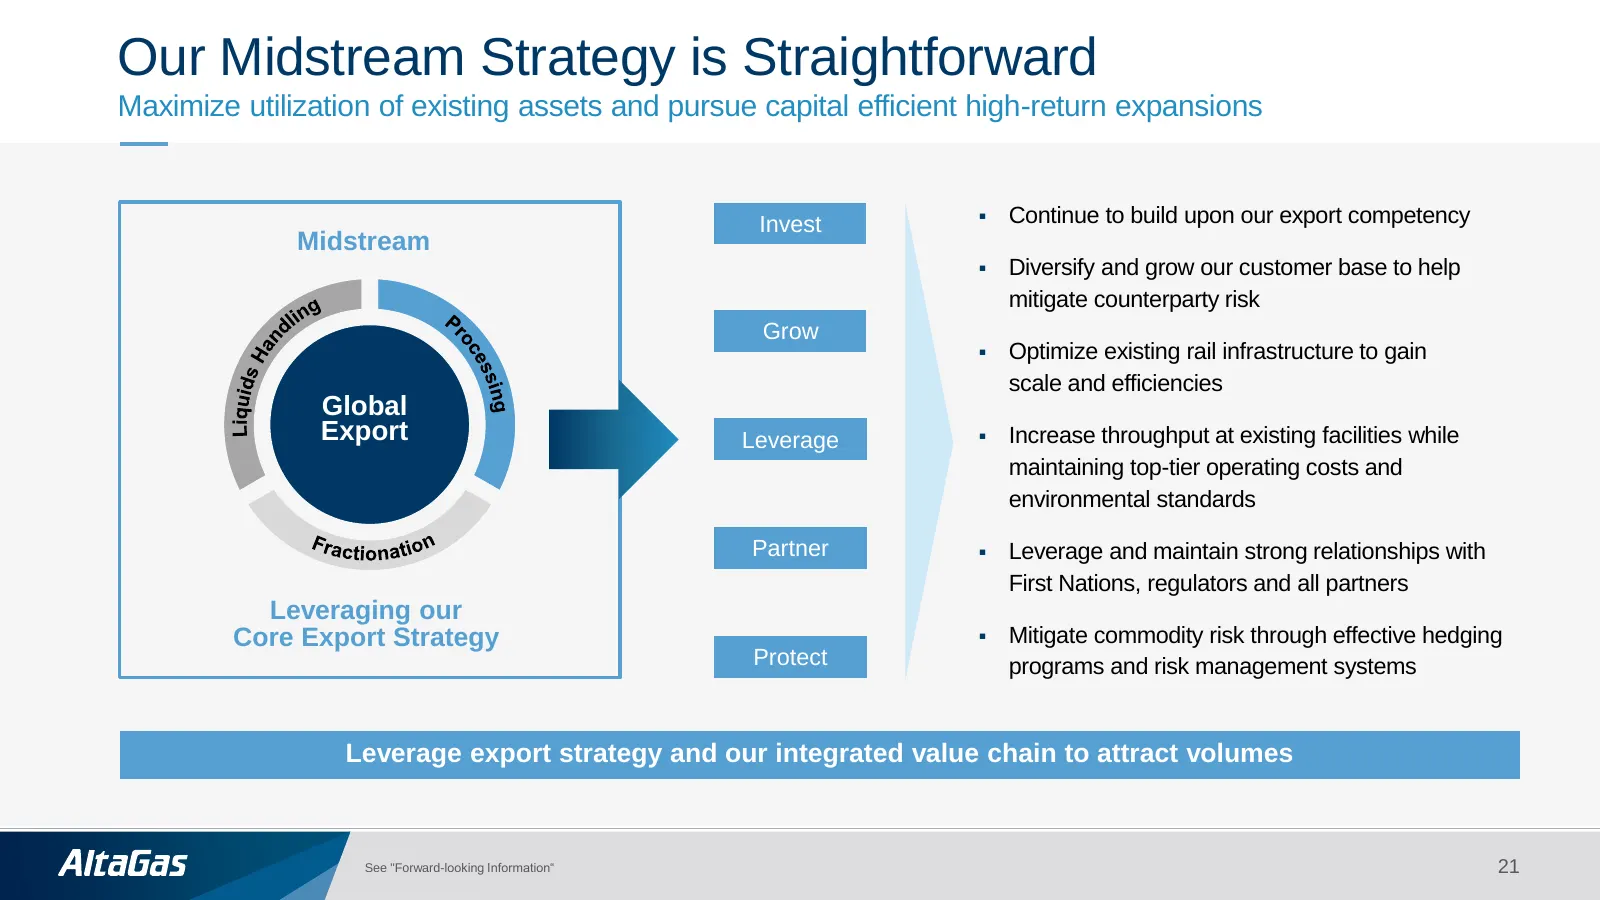
Our Midstream Strategy is Straightforward Maximize utilization of existing assets and pursue capital efficient high-return expansions Invest ▪ Continue to build upon our export competency Midstream ▪ Diversify and grow our customer base to help mitigate counterparty risk Grow ▪ Optimize existing rai
Slide 22: Premier Midstream Business Connecting Canadian Producers to Global Markets
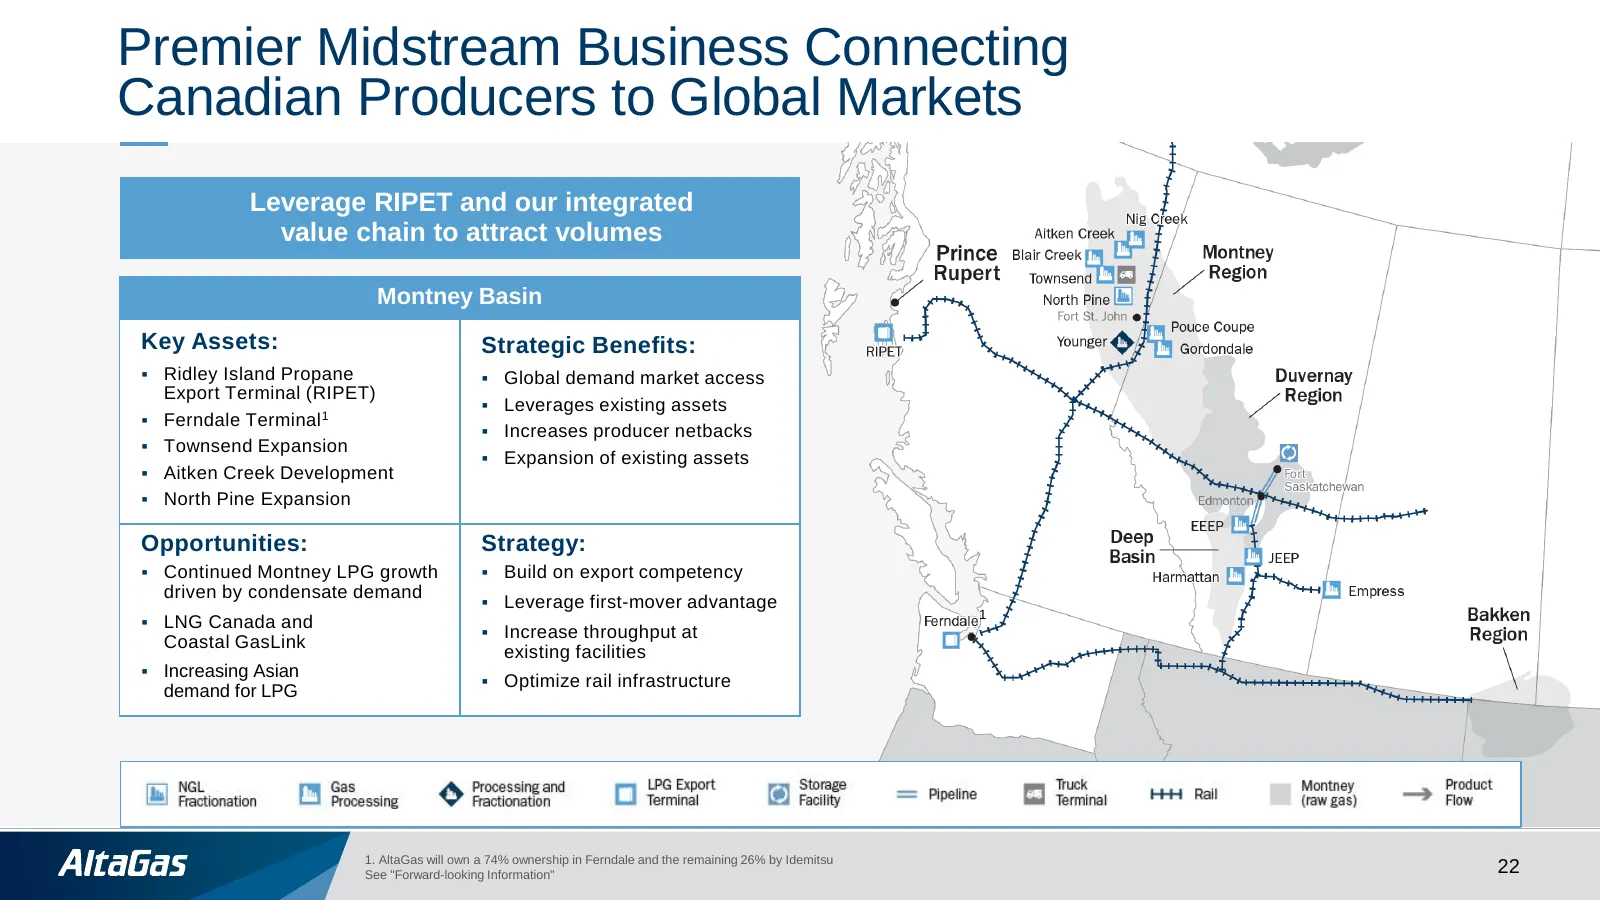
Premier Midstream Business Connecting Canadian Producers to Global Markets Leverage RIPET and our integrated value chain to attract volumes Montney Basin Key Assets: Strategic Benefits: ▪ Ridley Island Propane ▪ Global demand market access Export Terminal (RIPET) ▪ Leverages existing assets ▪ Fernda
Slide 23: RIPET – 2020 Operational Overview
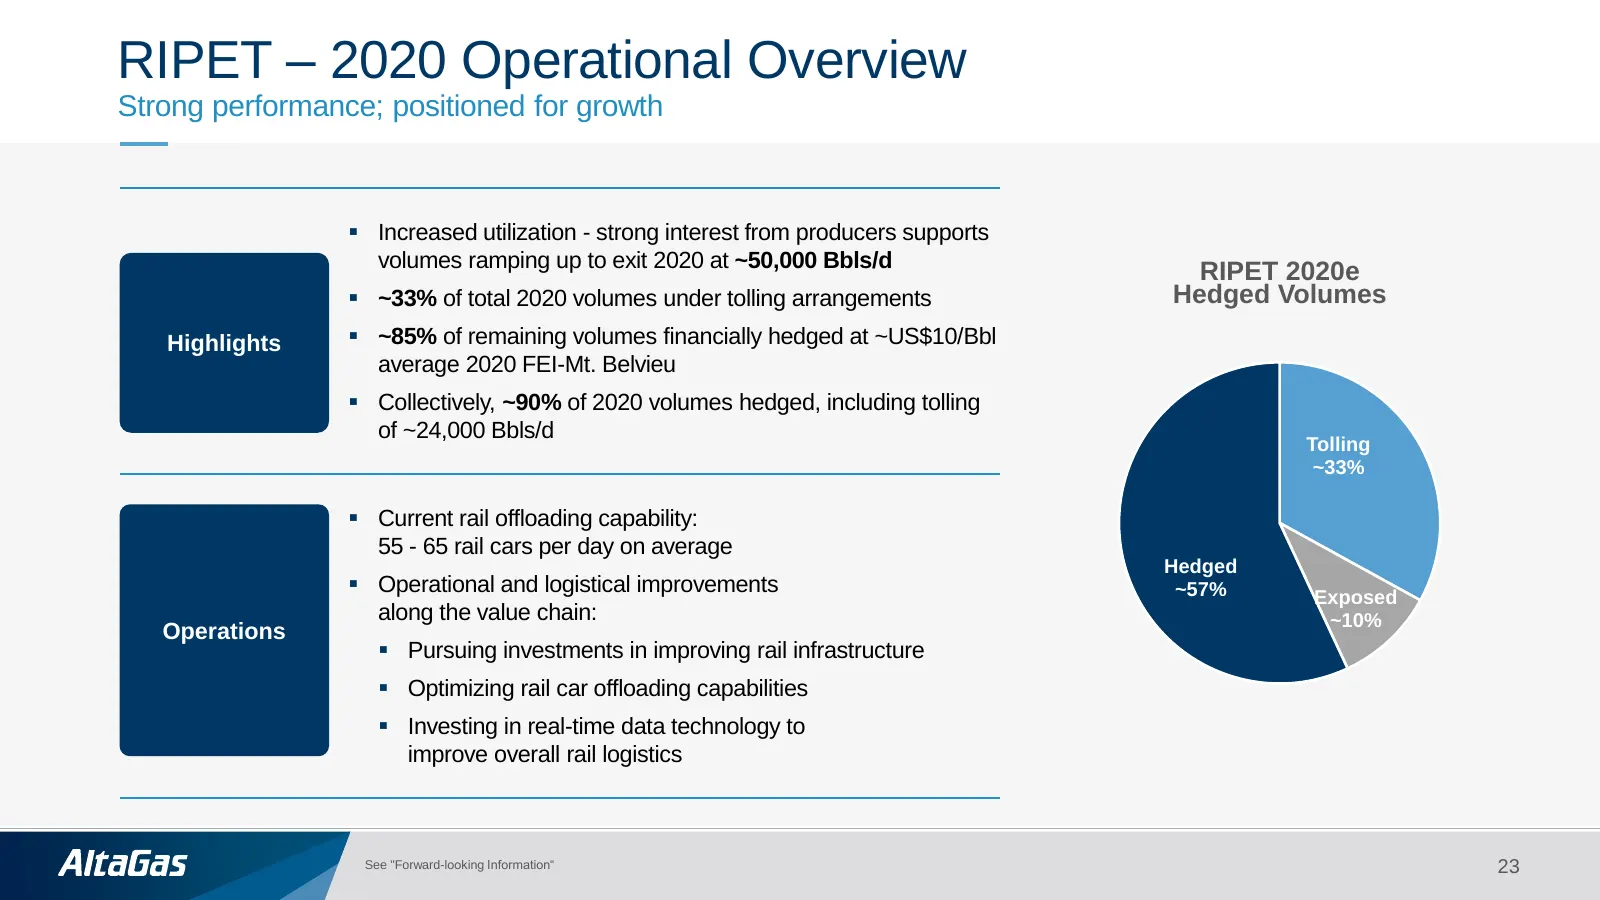
RIPET – 2020 Operational Overview Strong performance; positioned for growth ▪ Increased utilization - strong interest from producers supports volumes ramping up to exit 2020 at ~50,000 Bbls/d RIPET 2020e ▪ ~33% of total 2020 volumes under tolling arrangements Hedged Volumes Highlights ▪ ~85% of rema
Slide 24: Montney Processing
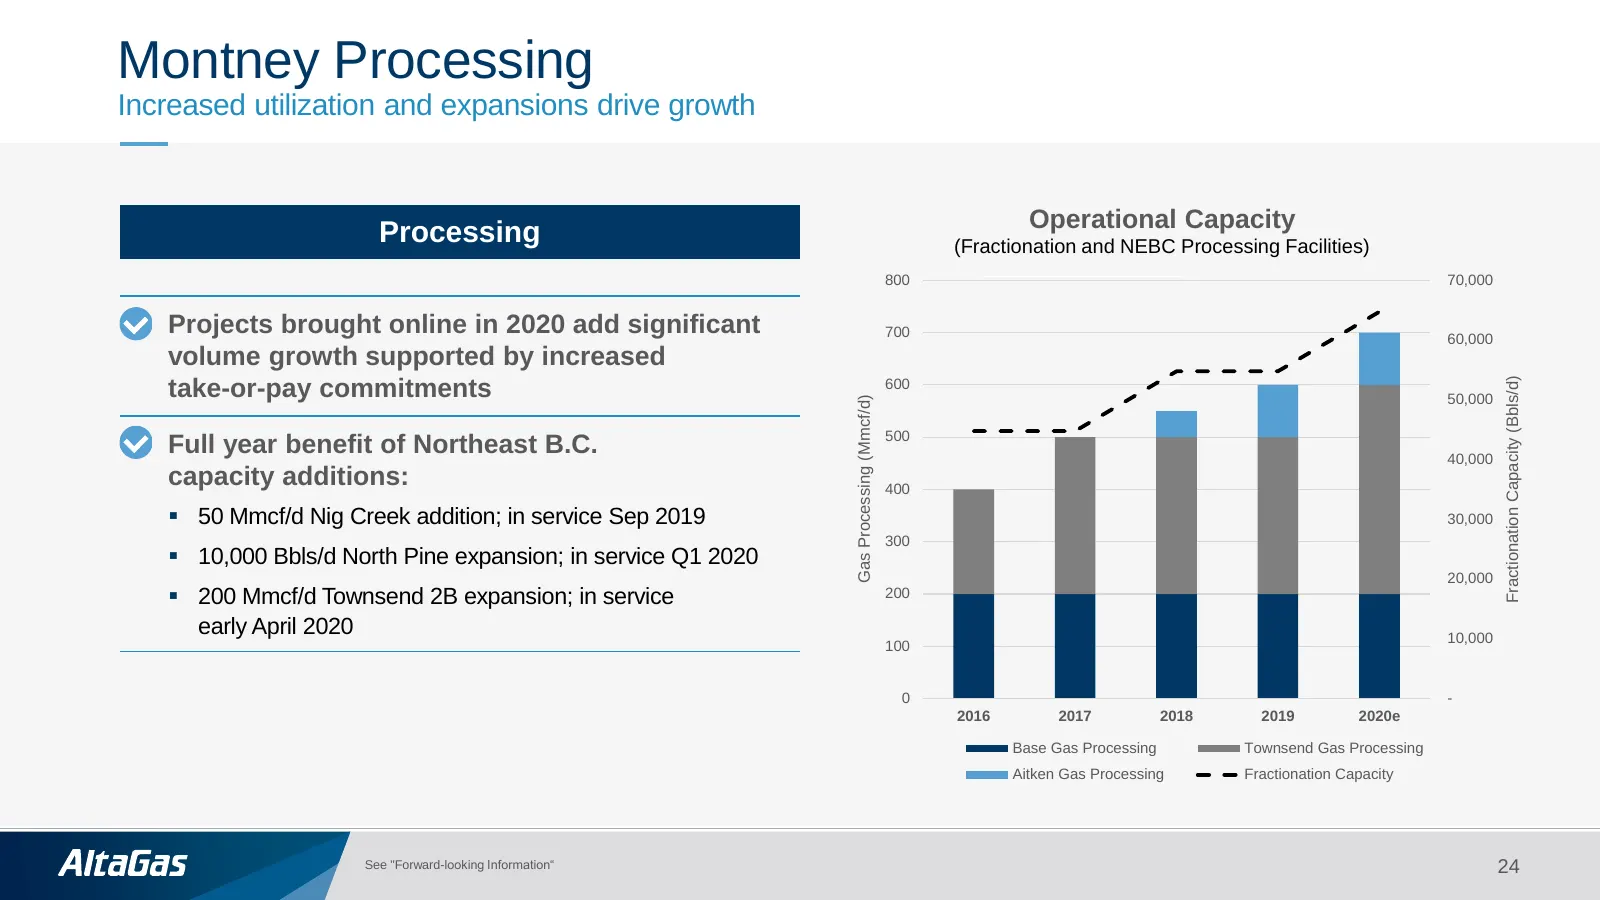
Montney Processing Increased utilization and expansions drive growth Operational Capacity Processing (Fractionation and NEBC Processing Facilities) 800 70,000 Projects brought online in 2020 add significant 700 60,000 volume growth supported by increased Fractionation Capacity (Bbls/d) take-or-pay c
Slide 25: Petrogas
Petrogas 25
Slide 26: Petrogas Transaction Summary
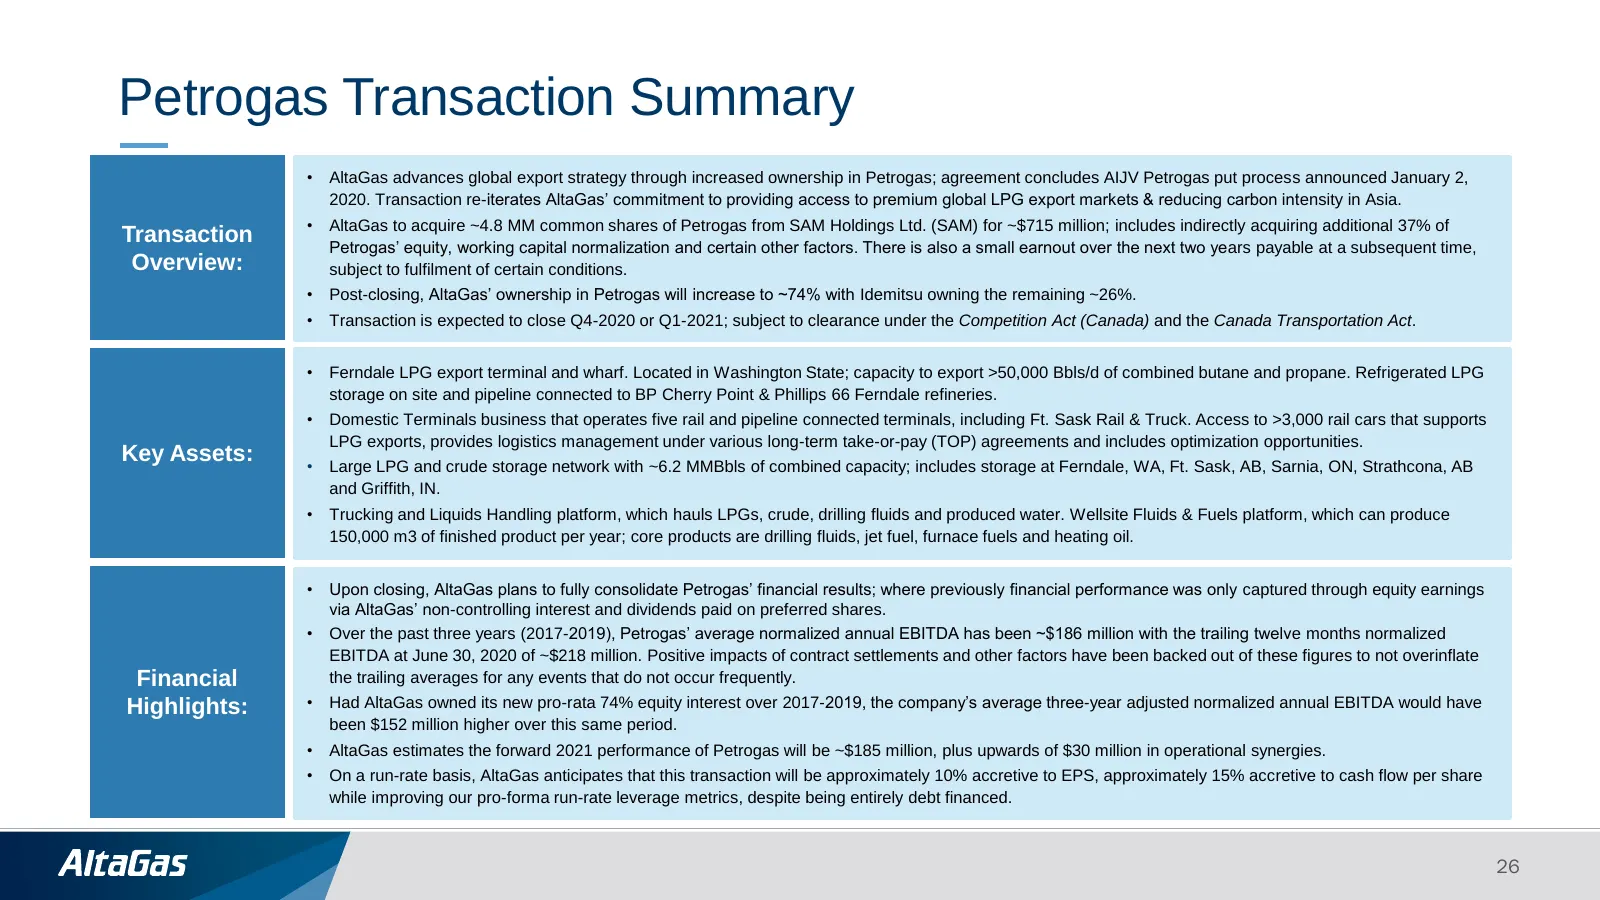
Petrogas Transaction Summary • AltaGas advances global export strategy through increased ownership in Petrogas; agreement concludes AIJV Petrogas put process announced January 2, 2020. Transaction re-iterates AltaGas’ commitment to providing access to premium global LPG export markets & reducing car
Slide 27: Strategic Rationale
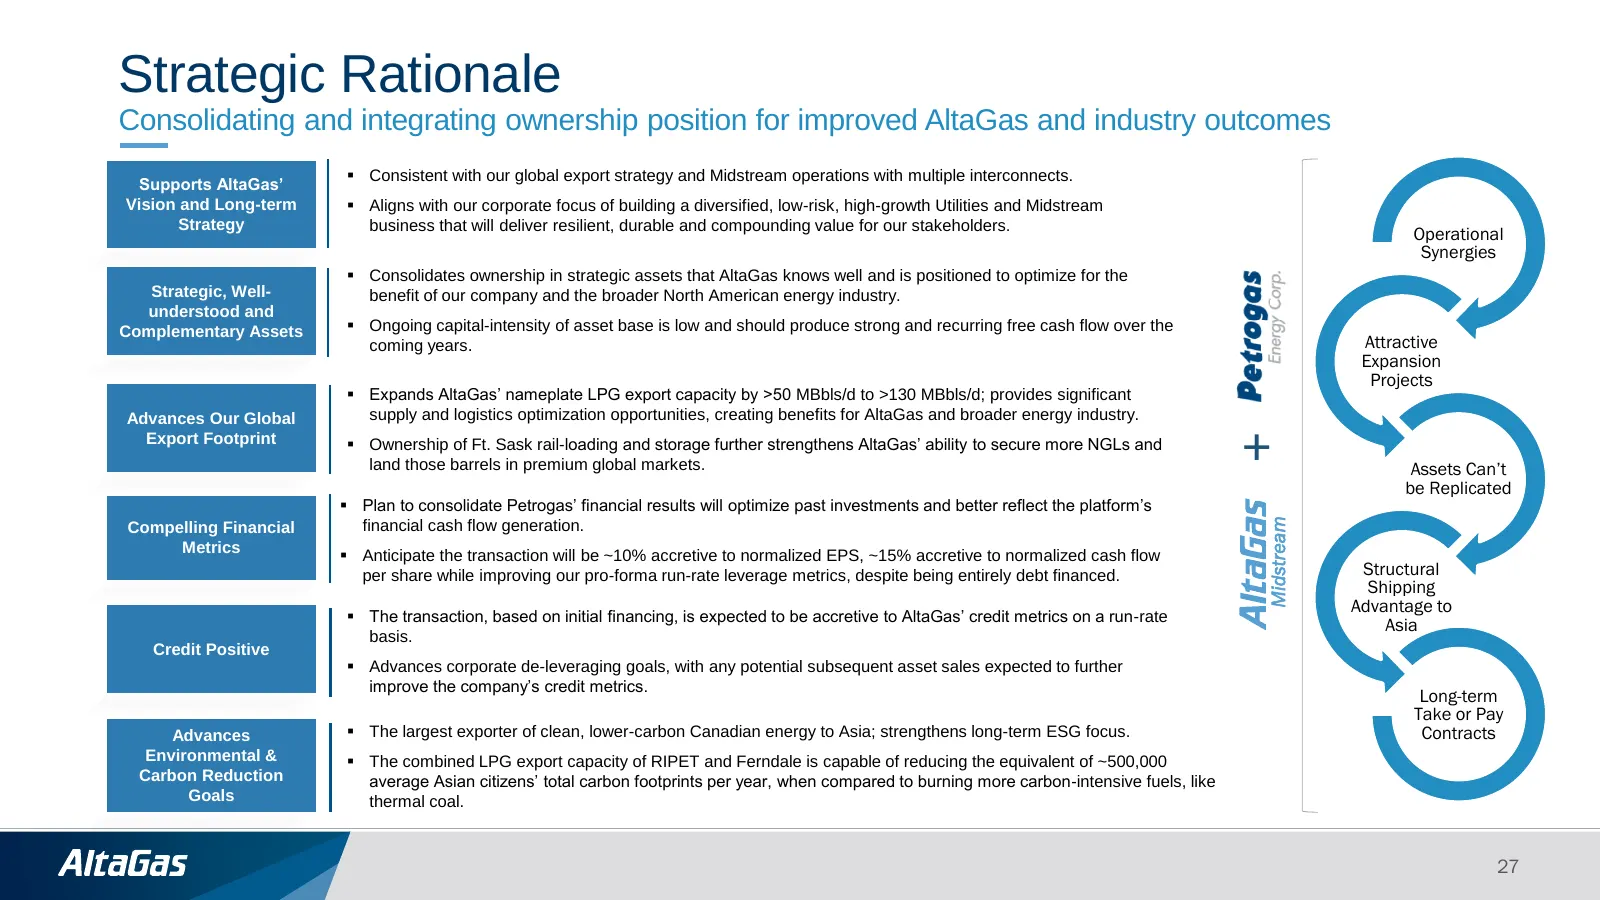
Strategic Rationale Consolidating and integrating ownership position for improved AltaGas and industry outcomes ▪ Consistent with our global export strategy and Midstream operations with multiple interconnects. Supports AltaGas’ Vision and Long-term ▪ Aligns with our corporate focus of building a di
Slide 28: Expands AltaGas Footprint; Focused On Optimization
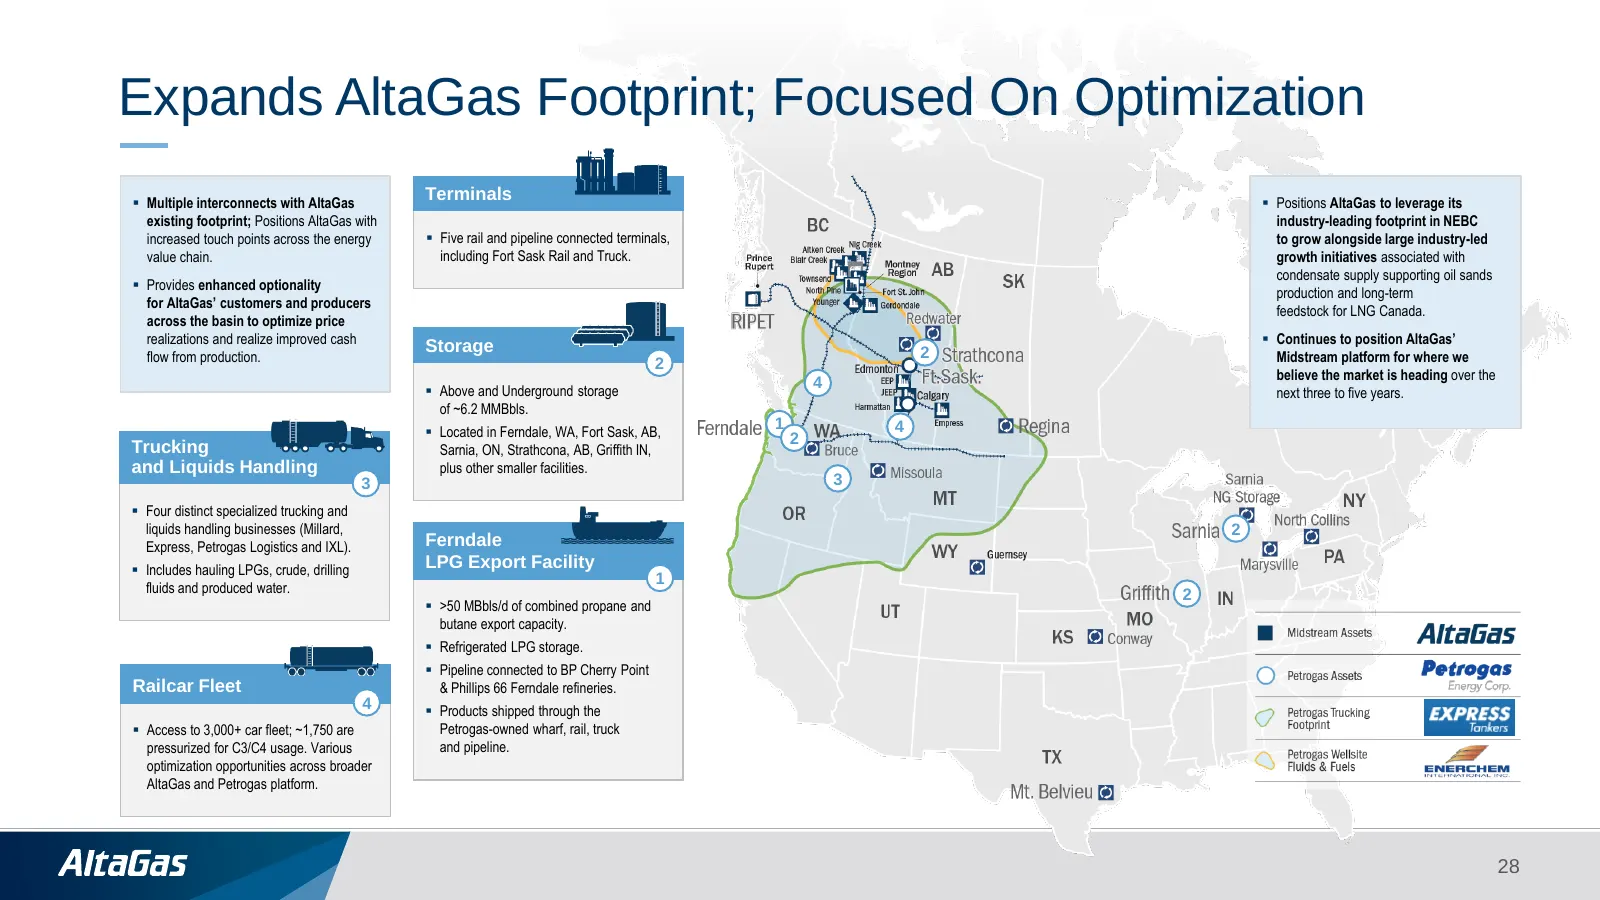
Expands AltaGas Footprint; Focused On Optimization ▪ Multiple interconnects with AltaGas Terminals ▪ Positions AltaGas to leverage its existing footprint; Positions AltaGas with industry-leading footprint in NEBC increased touch points across the energy ▪ Five rail and pipeline connected terminals,
Slide 29: The Ferndale Advantage
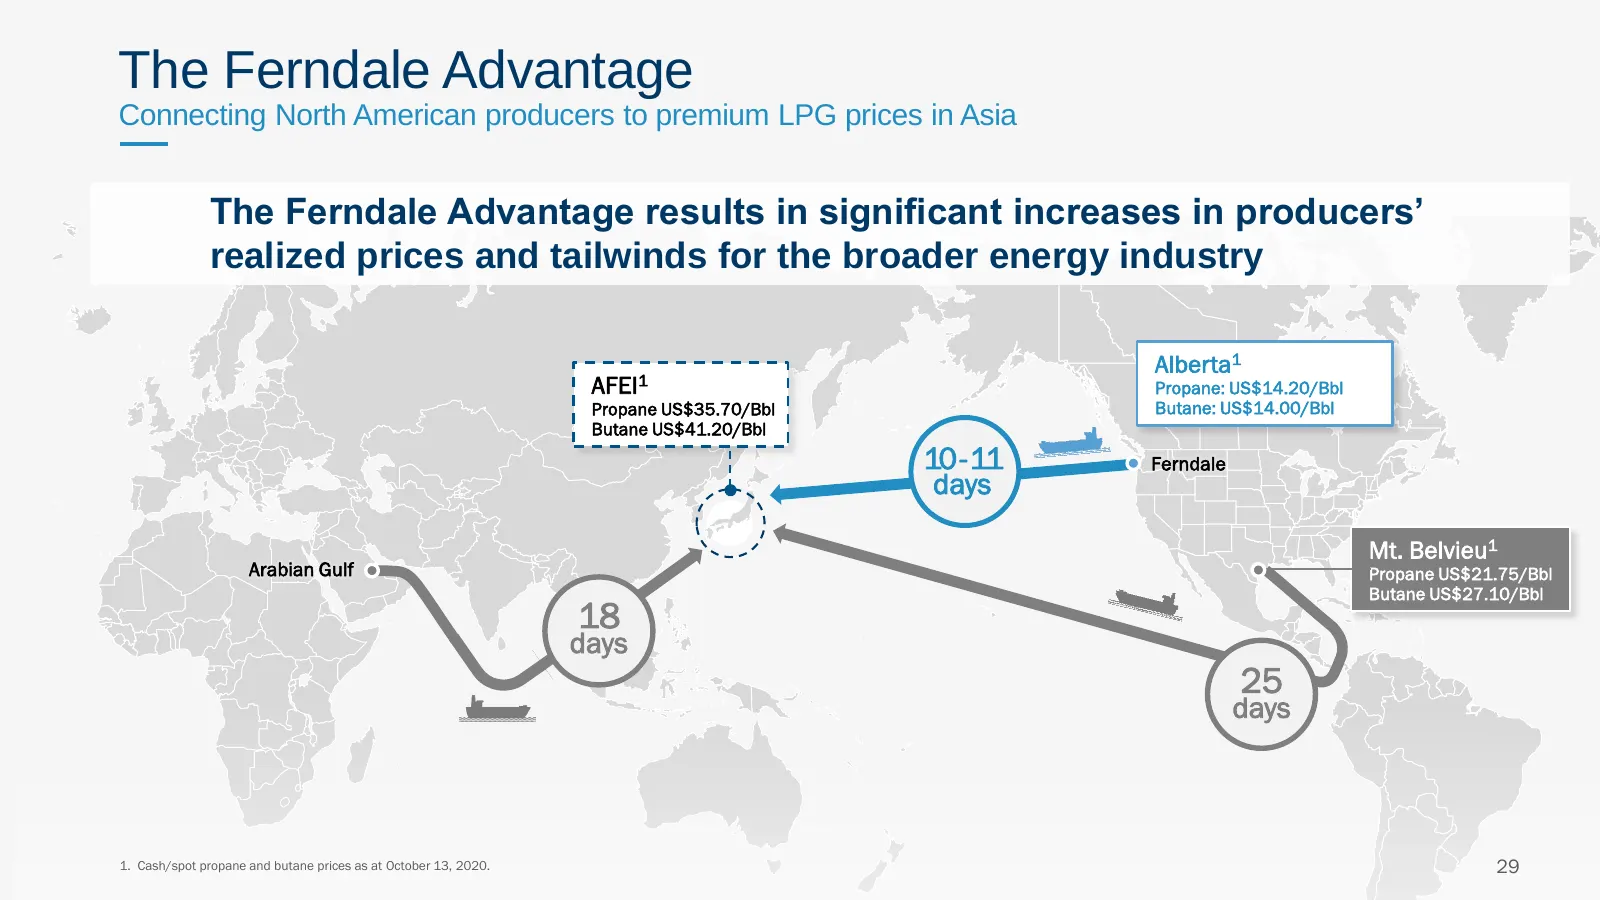
The Ferndale Advantage Connecting North American producers to premium LPG prices in Asia The Ferndale Advantage results in significant increases in producers’ realized prices and tailwinds for the broader energy industry Alberta1 AFEI1 Propane: US$14.20/Bbl Propane US$35.70/Bbl Butane: US$14.00/Bbl
Slide 30: Petrogas: How the Assets Fit Into AltaGas' Value Chain
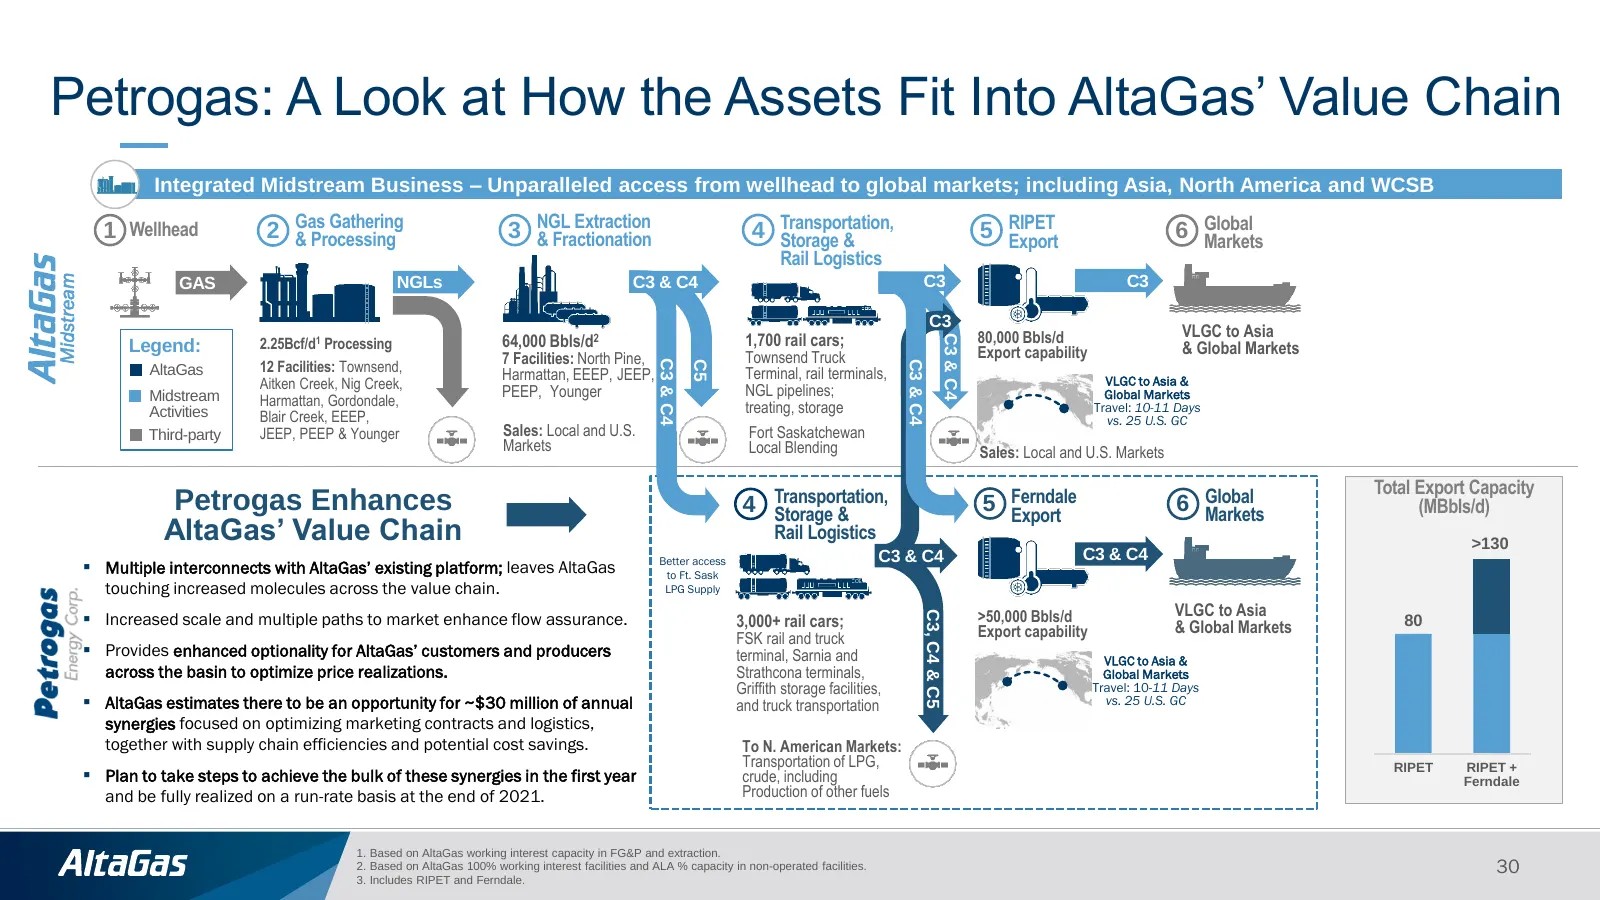
Petrogas: A Look at How the Assets Fit Into AltaGas’ Value Chain Integrated Midstream Business – Unparalleled access from wellhead to global markets; including Asia, North America and WCSB 1 Wellhead 2 Gas Gathering & Processing 3 NGL Extraction & Fractionation 4 Transportation, Storage & 5 RIPET Ex
Slide 31: Midstream: Who We Are Post Petrogas Transaction
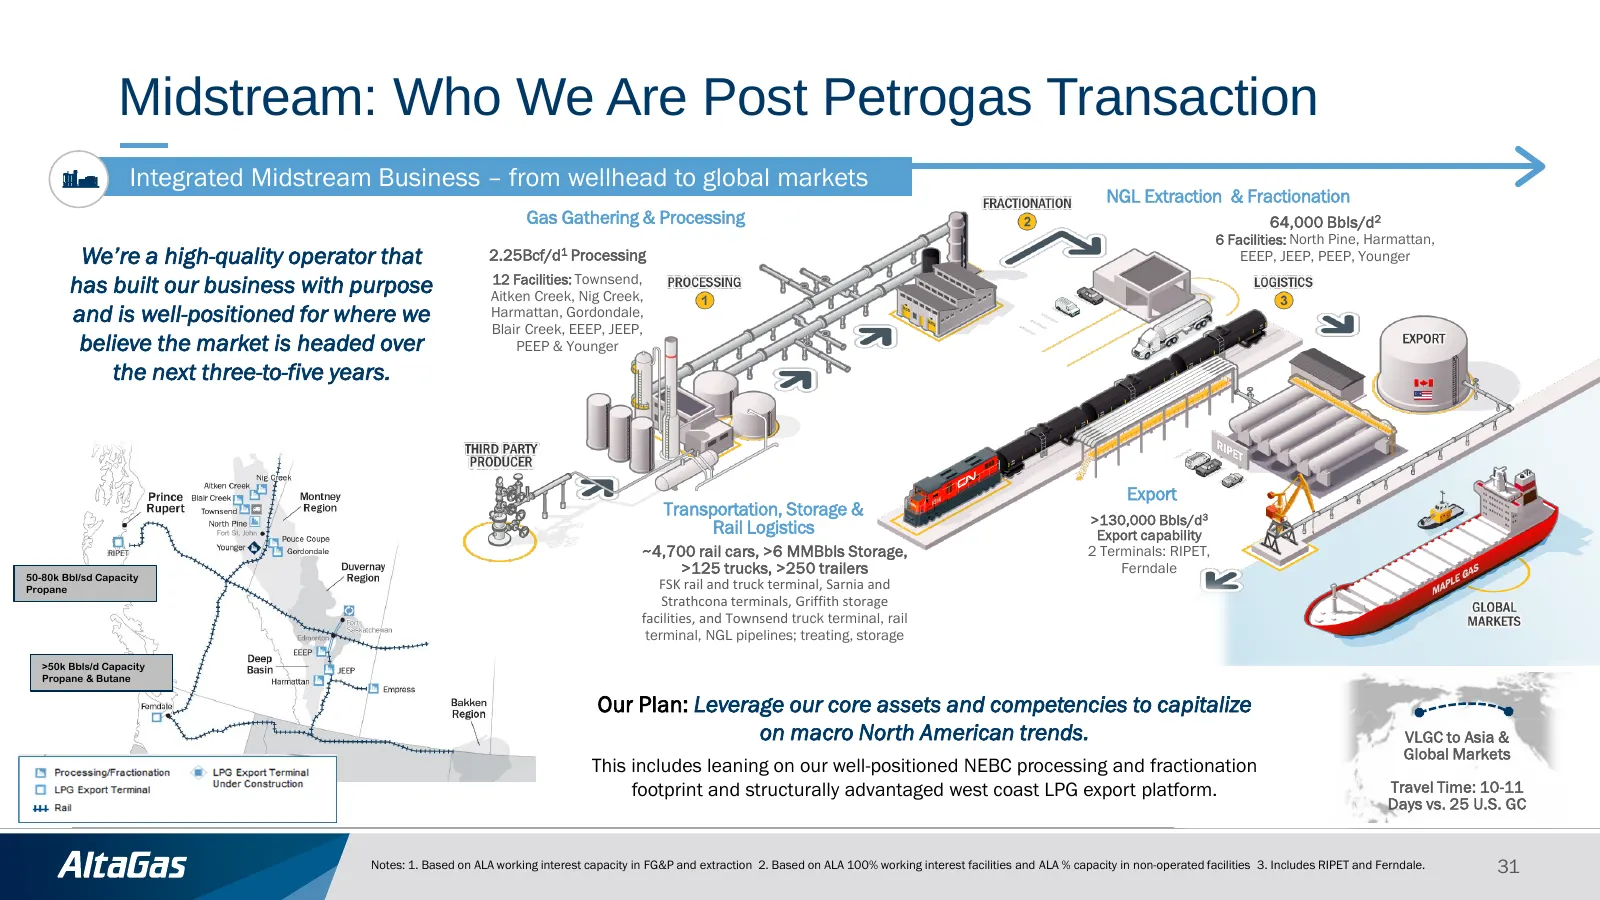
Midstream: Who We Are Post Petrogas Transaction Integrated Midstream Business – from wellhead to global markets NGL Extraction & Fractionation Gas Gathering & Processing 64,000 Bbls/d2 6 Facilities: North Pine, Harmattan, We’re a high-quality operator that 2.25Bcf/d1 Processing EEEP, JEEP, PEEP, You
Slide 32: The Road Ahead will be Paved with Integration and Optimization
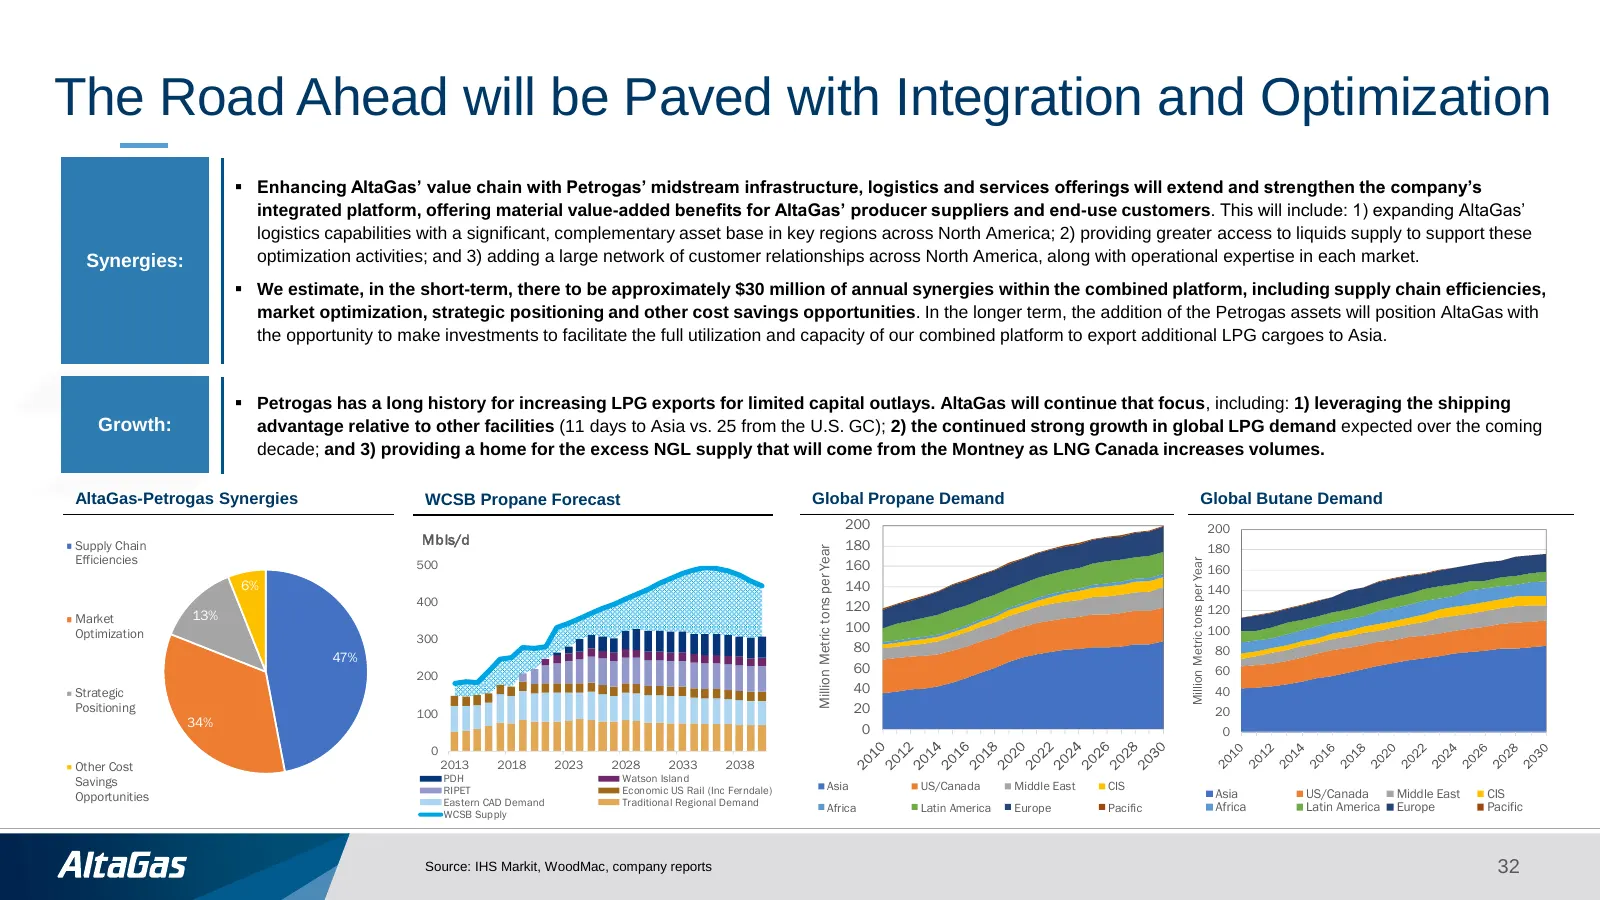
The Road Ahead will be Paved with Integration and Optimization ▪ Enhancing AltaGas’ value chain with Petrogas’ midstream infrastructure, logistics and services offerings will extend and strengthen the company’s integrated platform, offering material value-added benefits for AltaGas’ producer supplie
Slide 33: 2020 Outlook
2020 Outlook 33
Slide 34: 2020 Outlook Unchanged
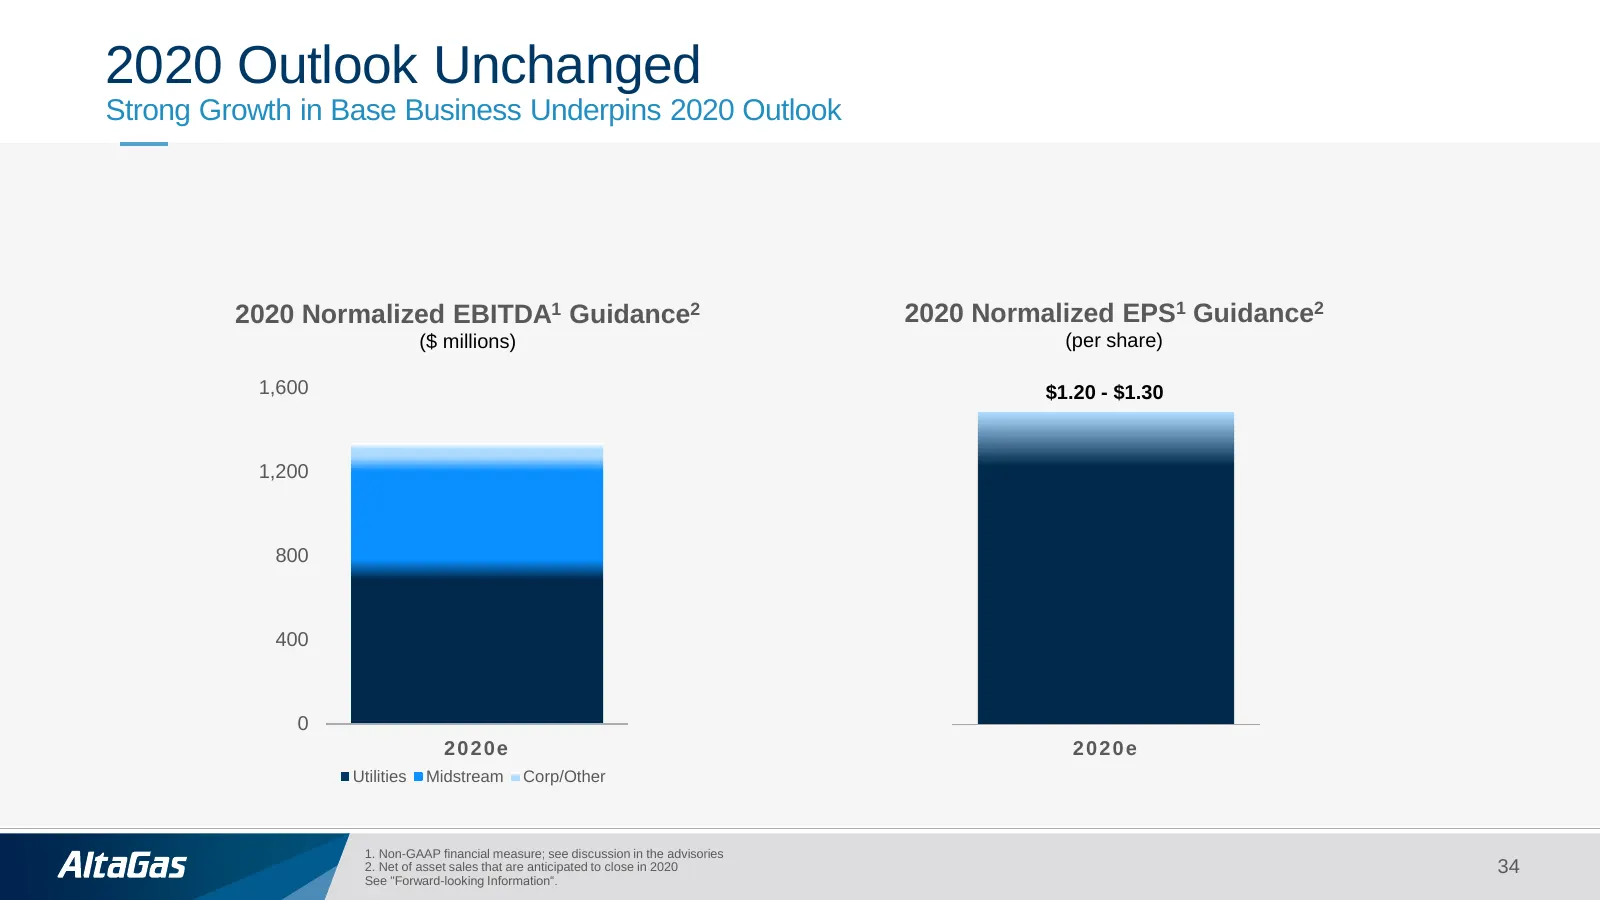
2020 Outlook Unchanged Strong Growth in Base Business Underpins 2020 Outlook 2020 Normalized EBITDA1 Guidance2 2020 Normalized EPS1 Guidance2 ($ millions) (per share) 1,600 $1.20 - $1.30 1,200 800 400 0 2020e 2020e Utilities Midstream Corp/Other 1. Non-GAAP financial measure; see discussion in the a
Slide 35: 2020 Normalized EBITDA Drivers
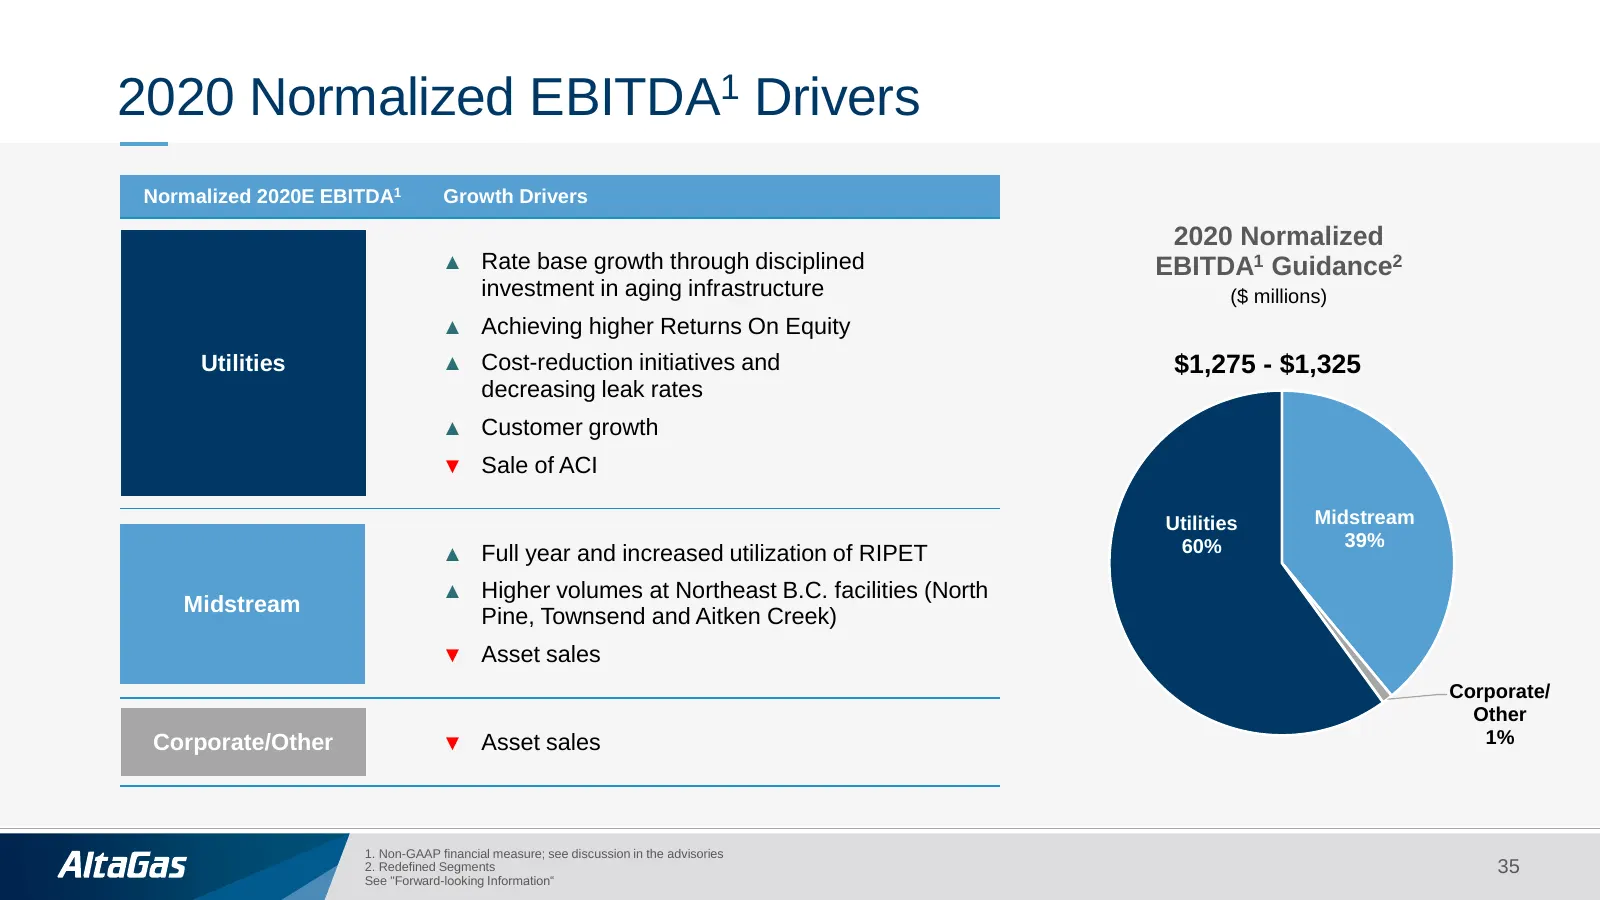
2020 Normalized EBITDA1 Drivers Normalized 2020E EBITDA1 Growth Drivers 2020 Normalized ▲ Rate base growth through disciplined EBITDA1 Guidance2 investment in aging infrastructure ($ millions) ▲ Achieving higher Returns On Equity Utilities ▲ Cost-reduction initiatives and $1,275 - $1,325 decreasing
Slide 36: 2020 Disciplined Capital Allocation
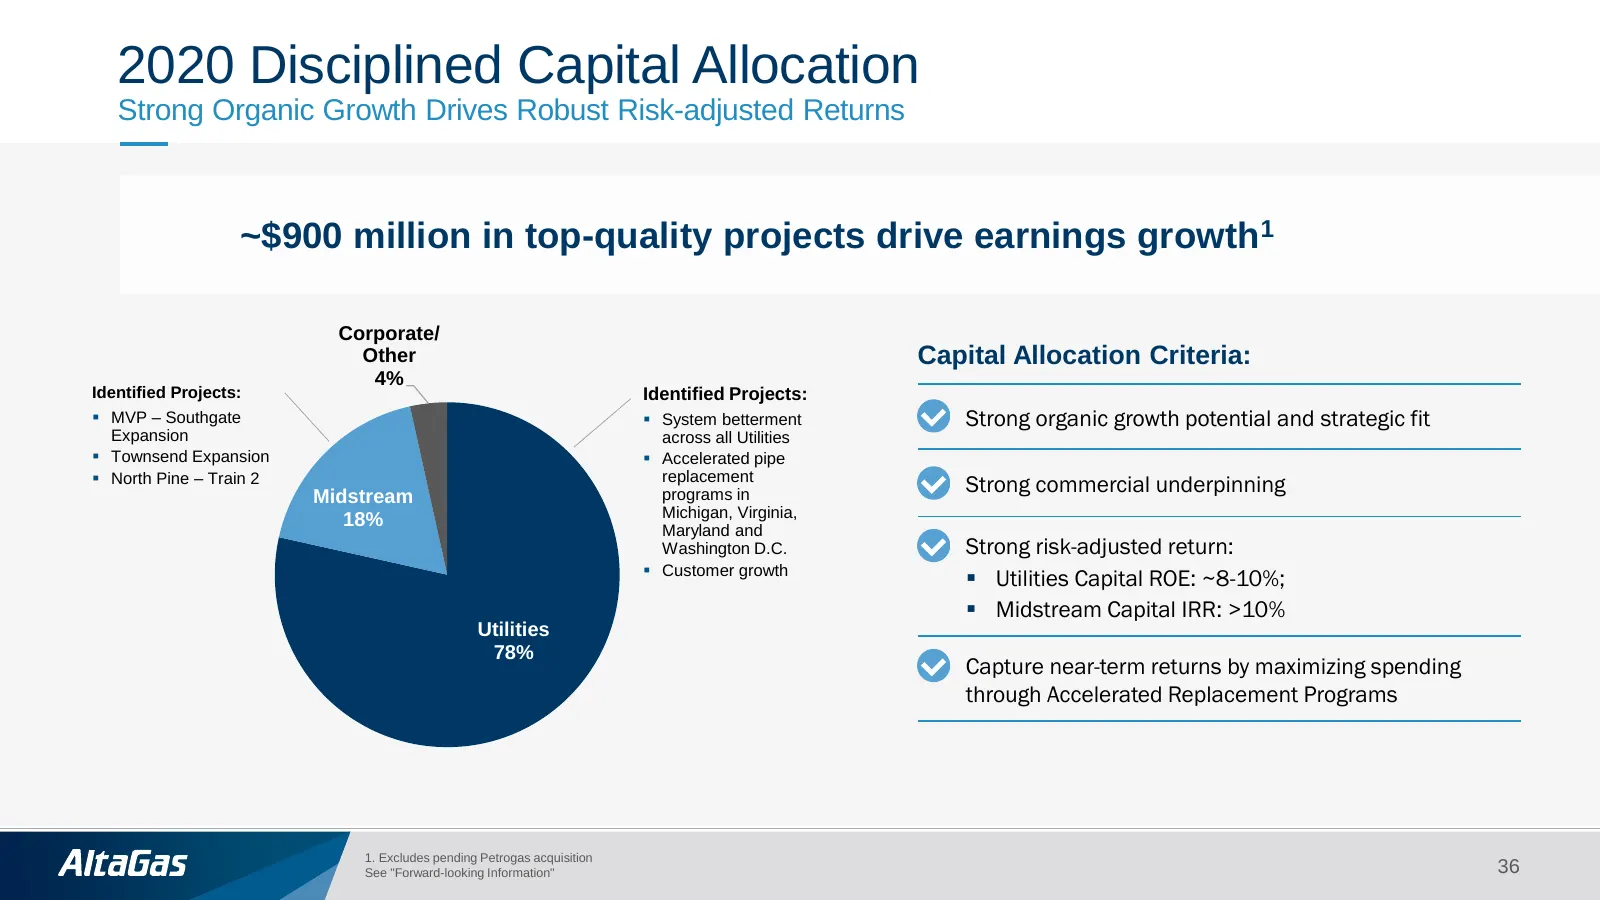
2020 Disciplined Capital Allocation Strong Organic Growth Drives Robust Risk-adjusted Returns ~$900 million in top-quality projects drive earnings growth1 Corporate/ Other Capital Allocation Criteria: 4% Identified Projects: Identified Projects: ▪ MVP – Southgate ▪ System betterment Strong organic g
Slide 37: Investment Grade Credit Rating
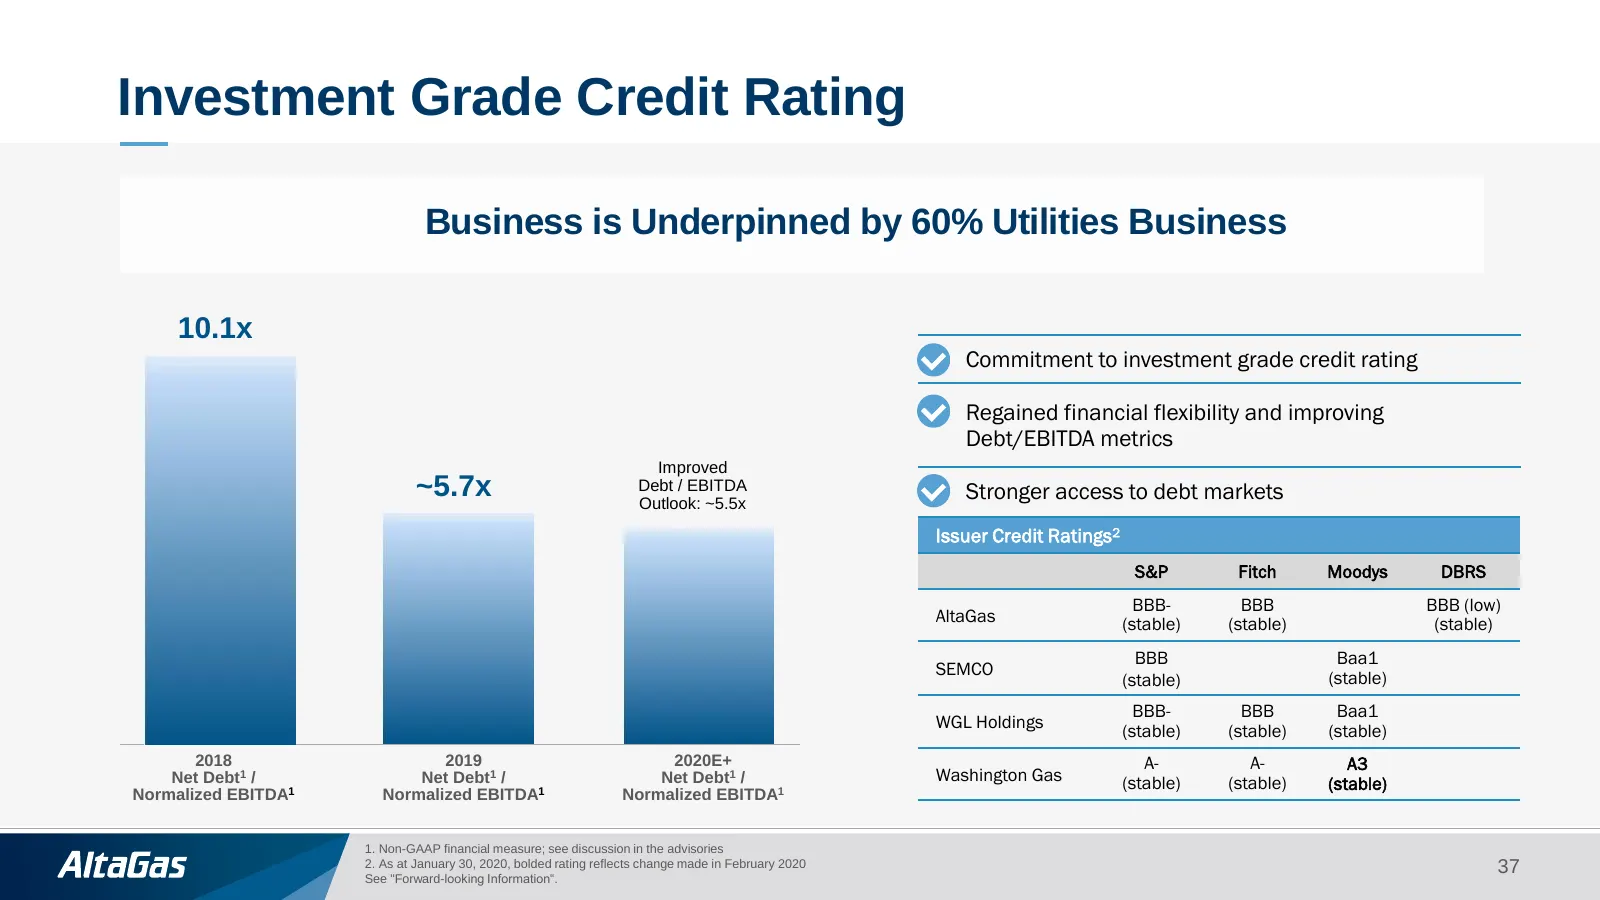
Investment Grade Credit Rating Business is Underpinned by 60% Utilities Business 10.1x Commitment to investment grade credit rating Regained financial flexibility and improving Debt/EBITDA metrics Improved ~5.7x Debt / EBITDA Outlook: ~5.5x Stronger access to debt markets Issuer Credit Ratings2 S&P
Slide 38: Financial Flexibility
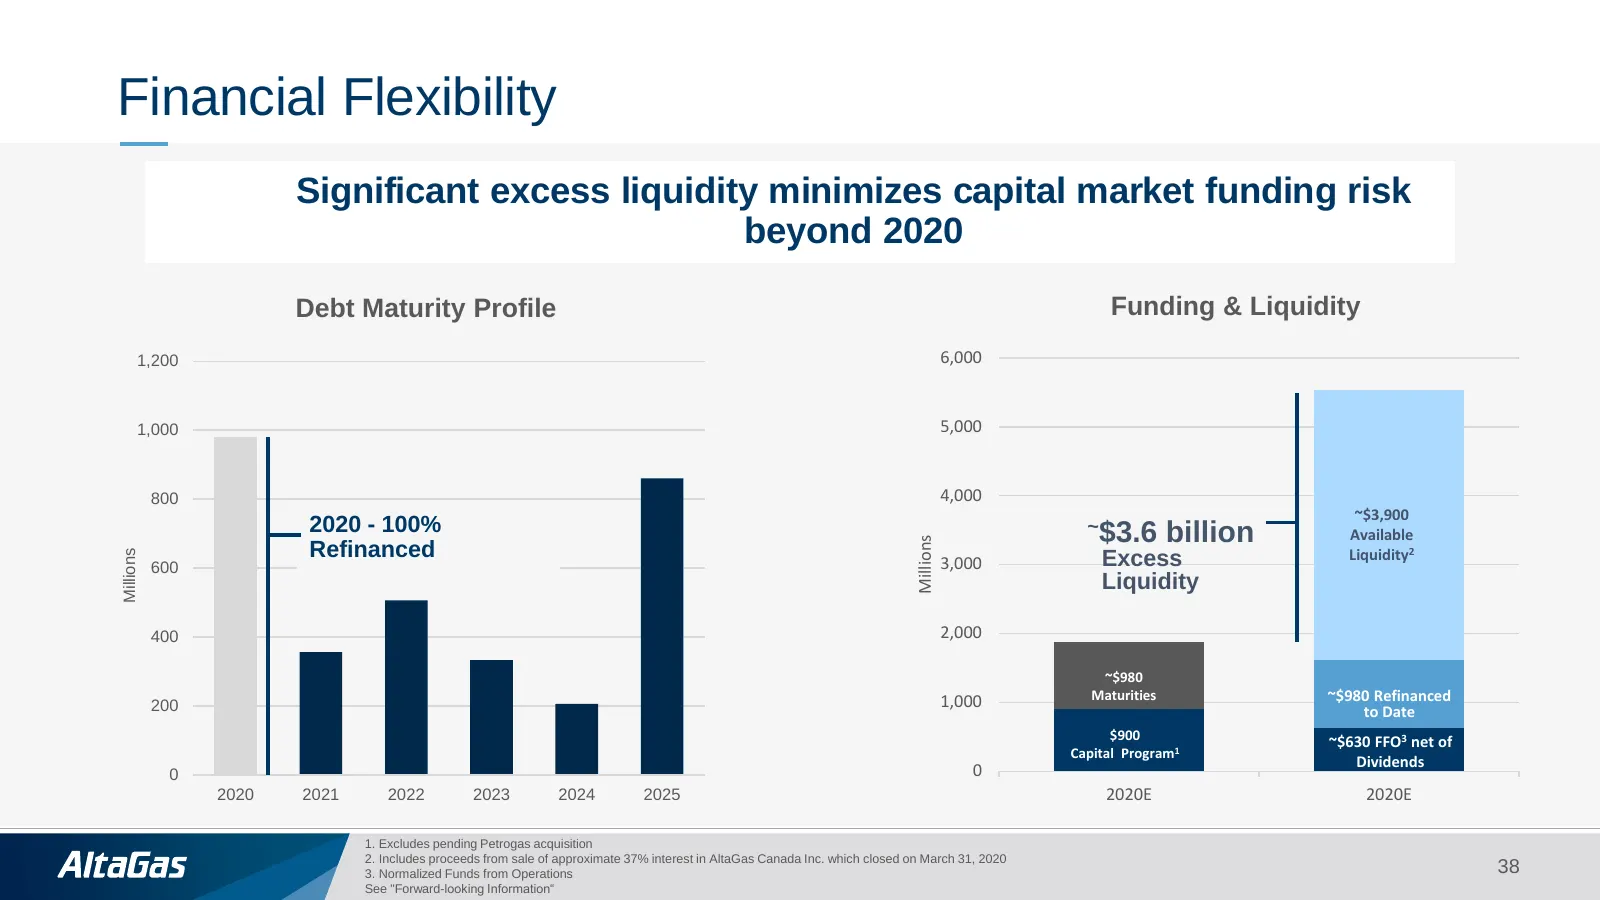
Financial Flexibility Significant excess liquidity minimizes capital market funding risk beyond 2020 Debt Maturity Profile Funding & Liquidity 1,200 6,000 1,000 5,000 800 4,000 ~$3,900 2020 - 100% ~$3.6 billion Available Millions Refinanced Liquidity2 Millions 600 3,000 Excess Liquidity 400 2,000 ~$
Slide 39: Appendix
Appendix 39
Slide 40: Supportive Regulatory Environment for Utilities
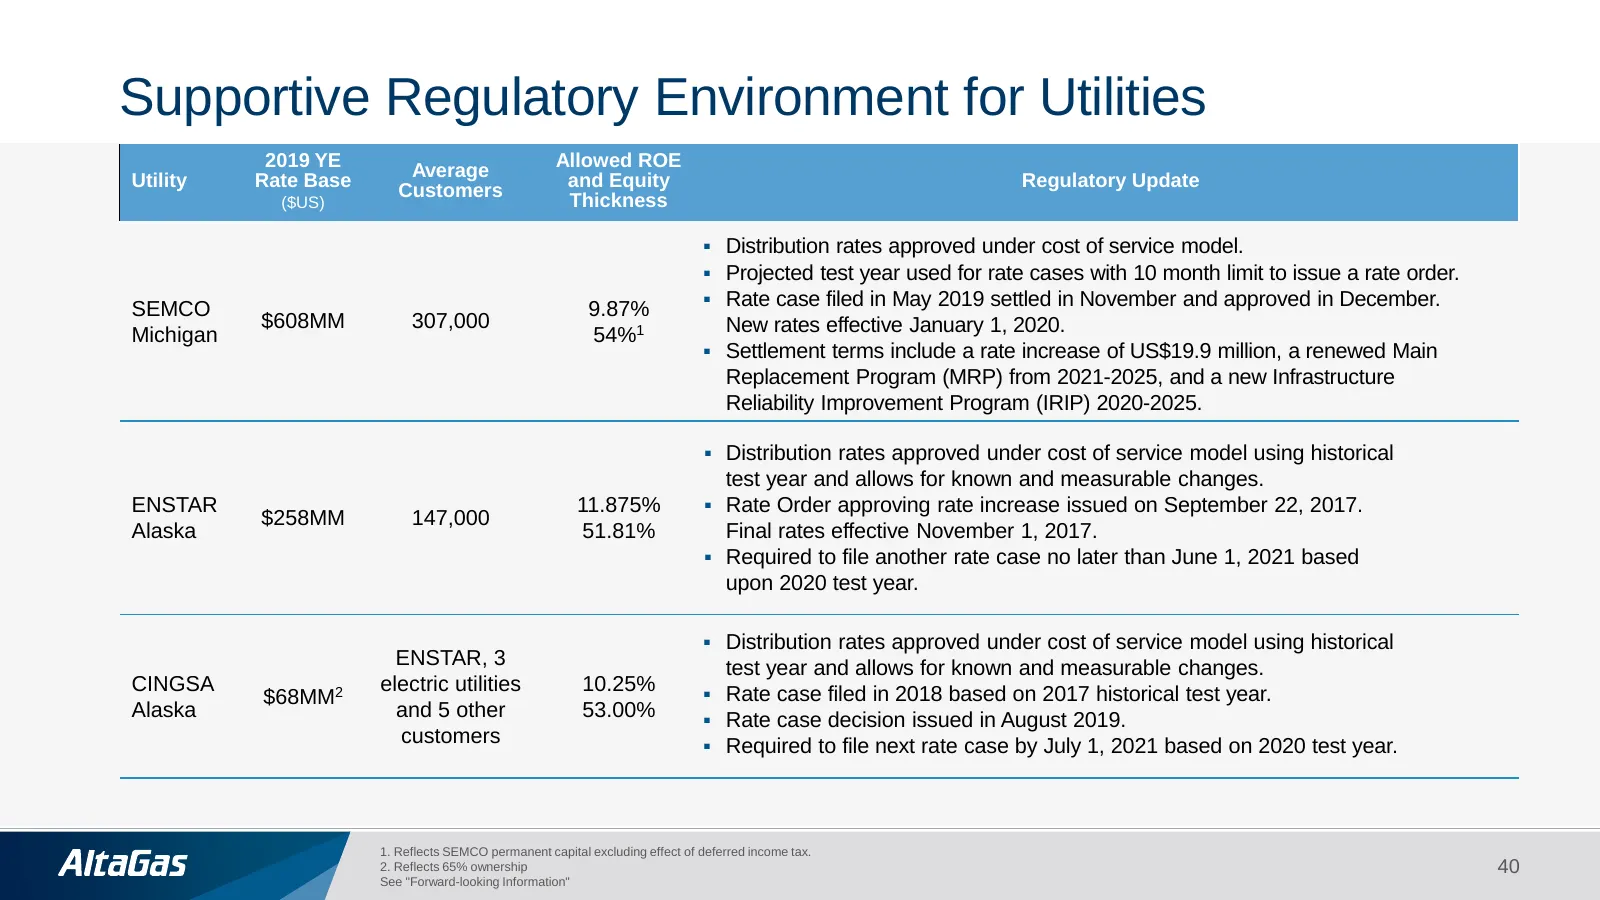
Supportive Regulatory Environment for Utilities 2019 YE Allowed ROE Average Utility Rate Base and Equity Regulatory Update Customers ($US) Thickness ▪ Distribution rates approved under cost of service model. ▪ Projected test year used for rate cases with 10 month limit to issue a rate order. ▪ Rate
Slide 41: Supportive Regulatory Environment for Utilities
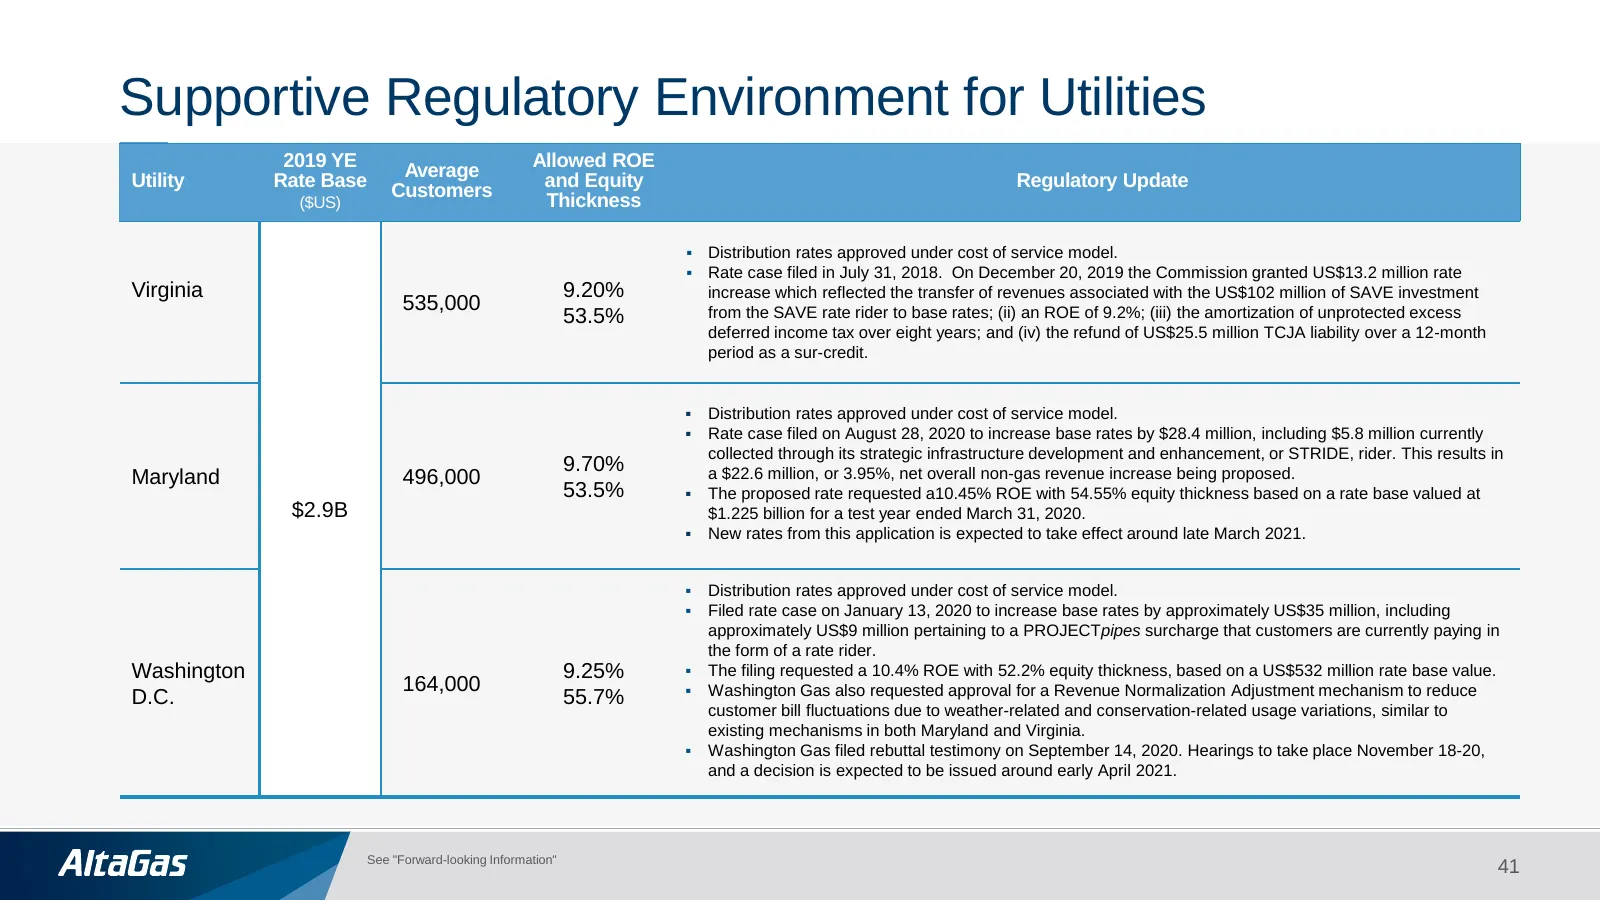
Supportive Regulatory Environment for Utilities 2019 YE Allowed ROE Average Utility Rate Base and Equity Regulatory Update Customers ($US) Thickness ▪ Distribution rates approved under cost of service model. ▪ Rate case filed in July 31, 2018. On December 20, 2019 the Commission granted US$13.2 mill
Slide 42: Accelerated Replacement Program
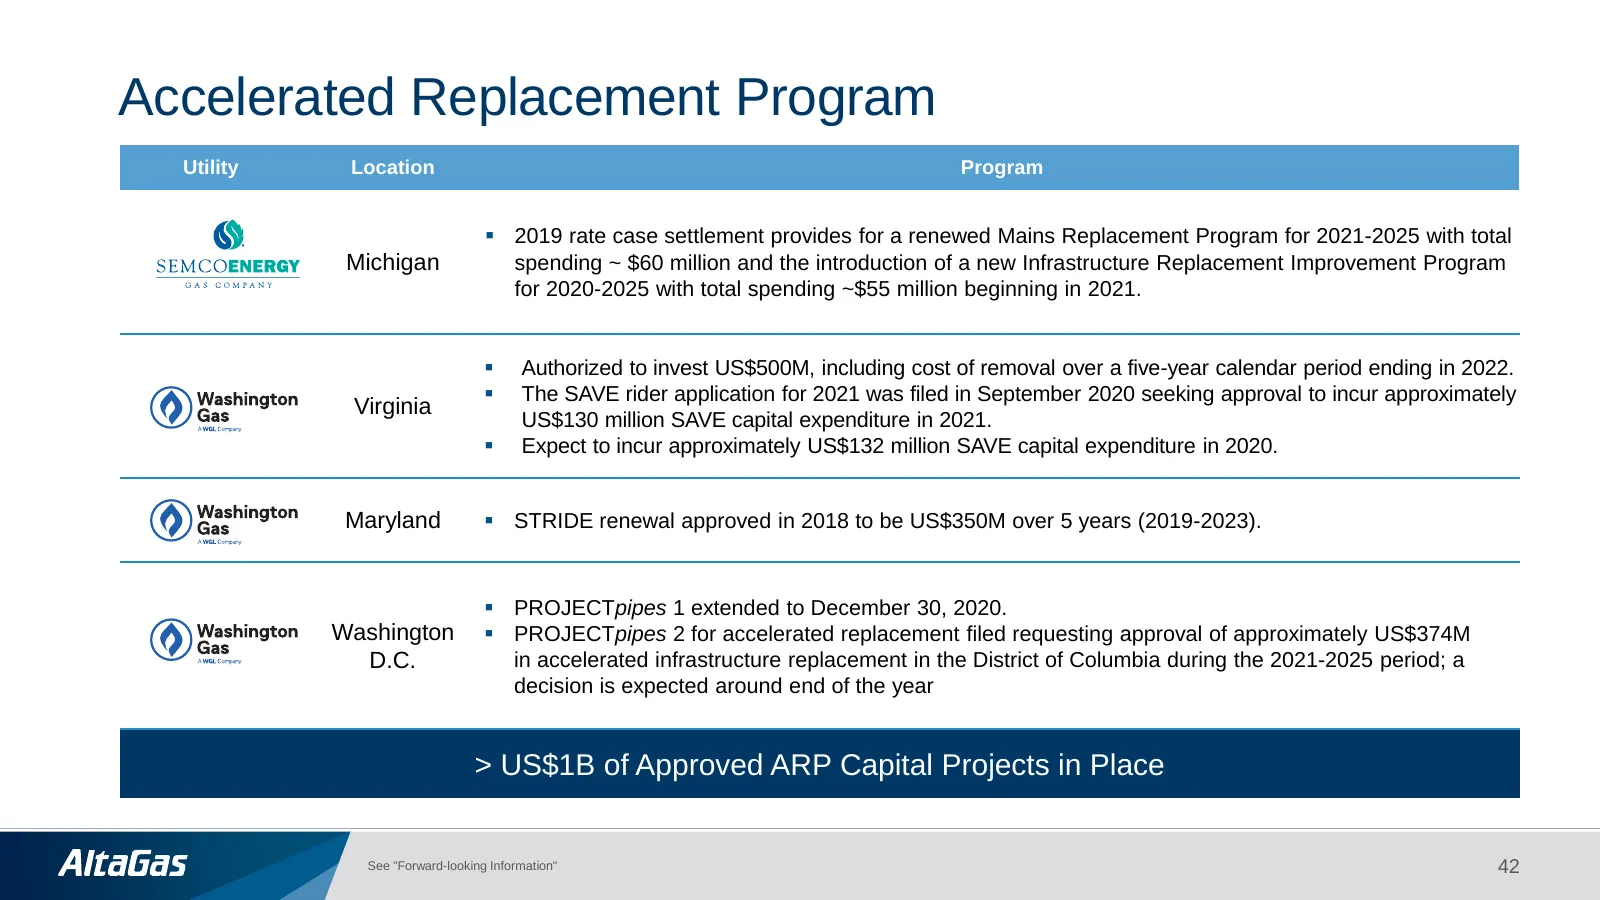
Accelerated Replacement Program Utility Location Program ▪ 2019 rate case settlement provides for a renewed Mains Replacement Program for 2021-2025 with total Michigan spending ~ $60 million and the introduction of a new Infrastructure Replacement Improvement Program for 2020-2025 with total spendin
Source: Internet Archive copy of altagas.ca
More decks from AltaGas Ltd.
 Q3 2026 Earnings Presentation23 slides · Oct 29, 2026
 Q2 2026 Earnings Presentation24 slides · Jul 30, 2026
 Investor Presentation (June 2026)58 slides · June 2026
 Investor Presentation (May 2026)61 slides · May 2026
 Q1 2026 Earnings Presentation24 slides · Apr 30, 2026
 Q4 2025 Earnings Presentation30 slides · Mar 6, 2026