NeoGenomics, Inc. · NASDAQ:NEO
NeoGenomics — Merger or Acquisition (October 2015)
20 slides from NeoGenomics's merger presentation, Oct 21, 2015
Slide 1: Special Investor Presentation: Acquisition of Clarient
Acquisition of Special Investor Presentation October 21, 2015
Slide 2: Forward-looking Statements
Forward-looking Statements This presentation contains statements which constitute forward-looking statements within the meaning of Section 27A of the Securities Act, as amended; Section 21E of the Securities Exchange Act of 1934; and the Private Securities Litigation Reform Act of 1995. The words “m
Slide 3: Transaction Background
Transaction Background • NeoGenomics’ long-standing Vision and Strategy: – Vision: to become America’s premier cancer testing laboratory – Key Strategic Elements • High-quality and low-cost provider. • Growth by market share gains as “one-stop-shop” for cancer genetic testing. • Innovate aggressivel
Slide 4: Clarient Overview
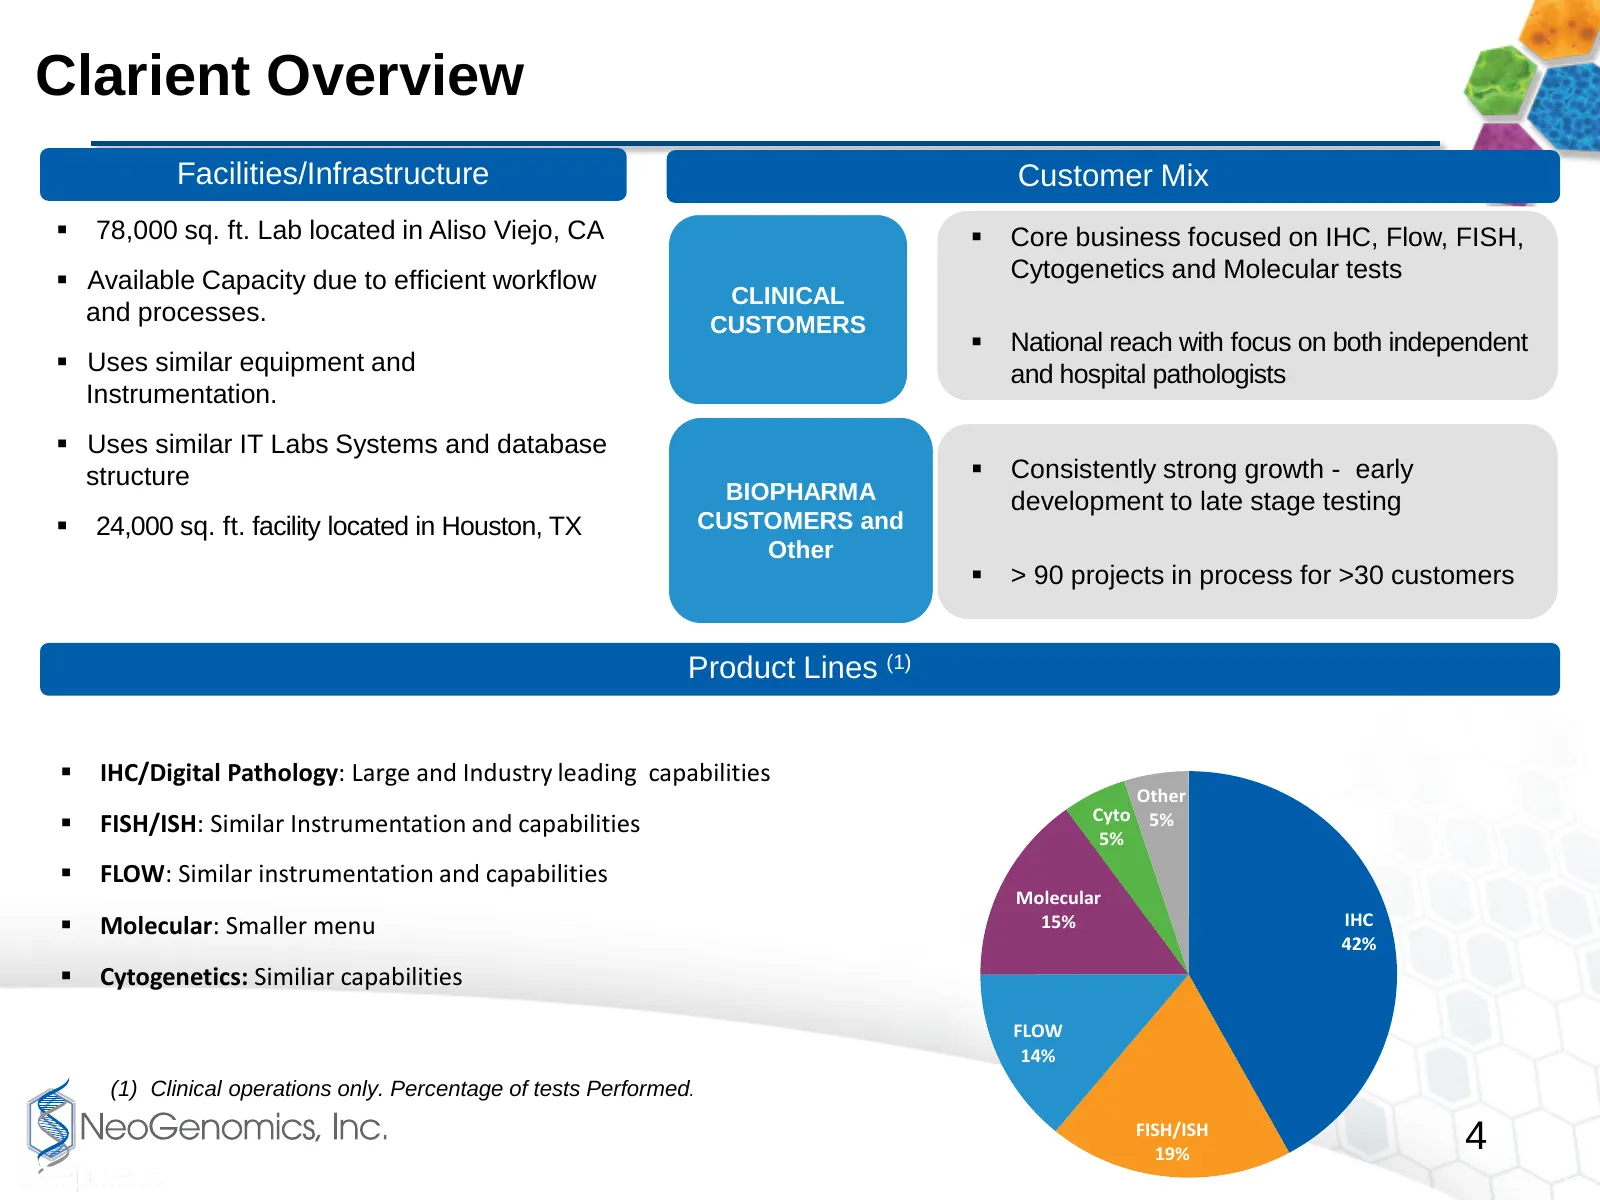
Clarient Overview Facilities/Infrastructure Customer Mix 78,000 sq. ft. Lab located in Aliso Viejo, CA Core business focused on IHC, Flow, FISH, Available Capacity due to efficient workflow Cytogenetics and Molecular tests CLINICAL and processes. CUSTOMERS National reach with focus on both i
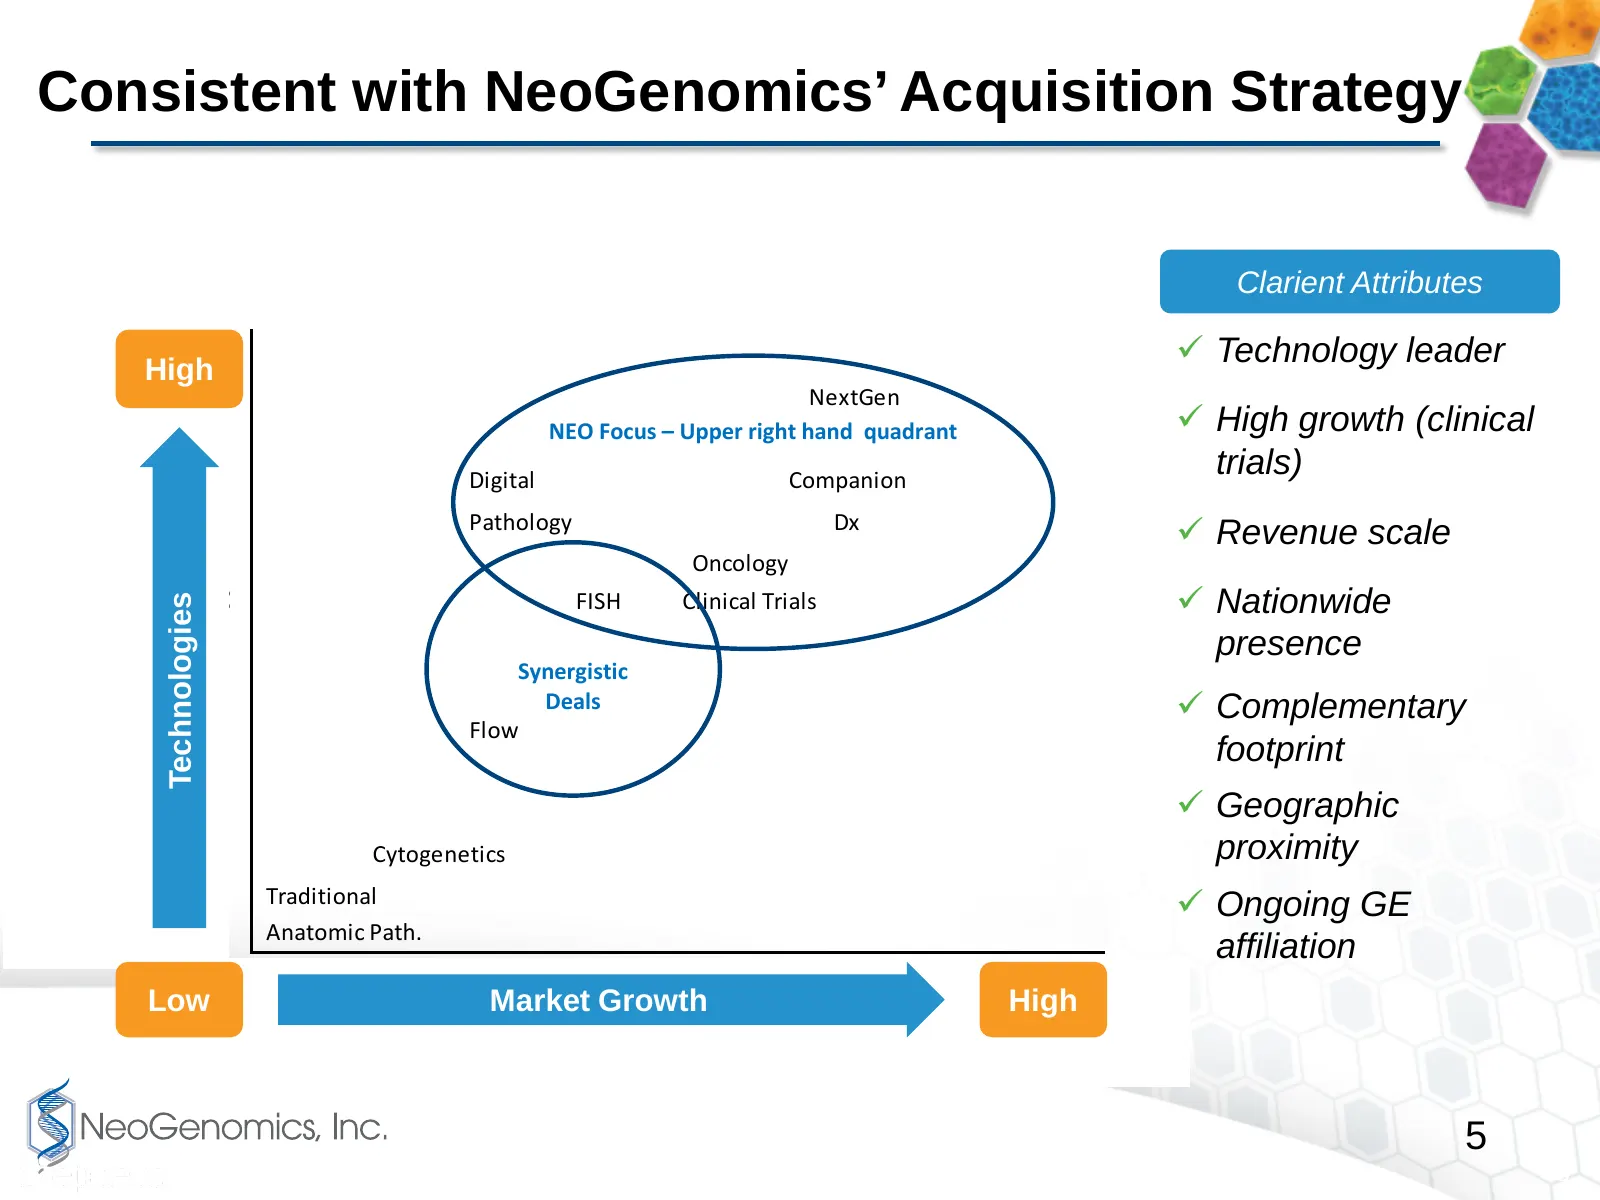
Slide 5: Technologies Consistent with NeoGenomics' Acquisition Strategy
Consistent with NeoGenomics’ Acquisition Strategy Clarient Attributes New Technology leader High NextGen NEO Focus – Upper right hand quadrant High growth (clinical Digital Companion trials) Pathology Dx Revenue scale Oncology Technologies: FISH Clinical Trials Nationwide Technologies presen
Slide 6: Strategic Rationale
Strategic Rationale 1. Opportunity to be the low-cost provider in each key laboratory discipline. 2. Ability to better balance clinical product portfolio and reduce risk profile from concentration in any one particular product line. 3. Enhance capability to develop a meaningful business in clinical
Slide 7: Key Benefits
Key Benefits • Synergy potential of $20mm - $30mm/year within 3-5 year – Laboratory, Purchasing, Cross-selling, etc. • East Coast/West Coast labs – Combine Irvine and Aliso Viejo • Low cost position in every testing discipline – FISH, Flow, Cytogenetics, IHC, Digital Pathology, Molecular • Leadershi
Slide 8: Clinical Trials - BioPharma
Clinical Trials - BioPharma A rapidly growing part of Clarient’s business and a fantastic opportunity . . . • Over $20mm/yr in current business • Strong relationships with several leading Pharmaceutical firms • PDL1 22C3 – FDA Approved companion diagnostic for Keytruda • Continued push into Companio
Slide 9: Revenue Synergies – Cross Selling
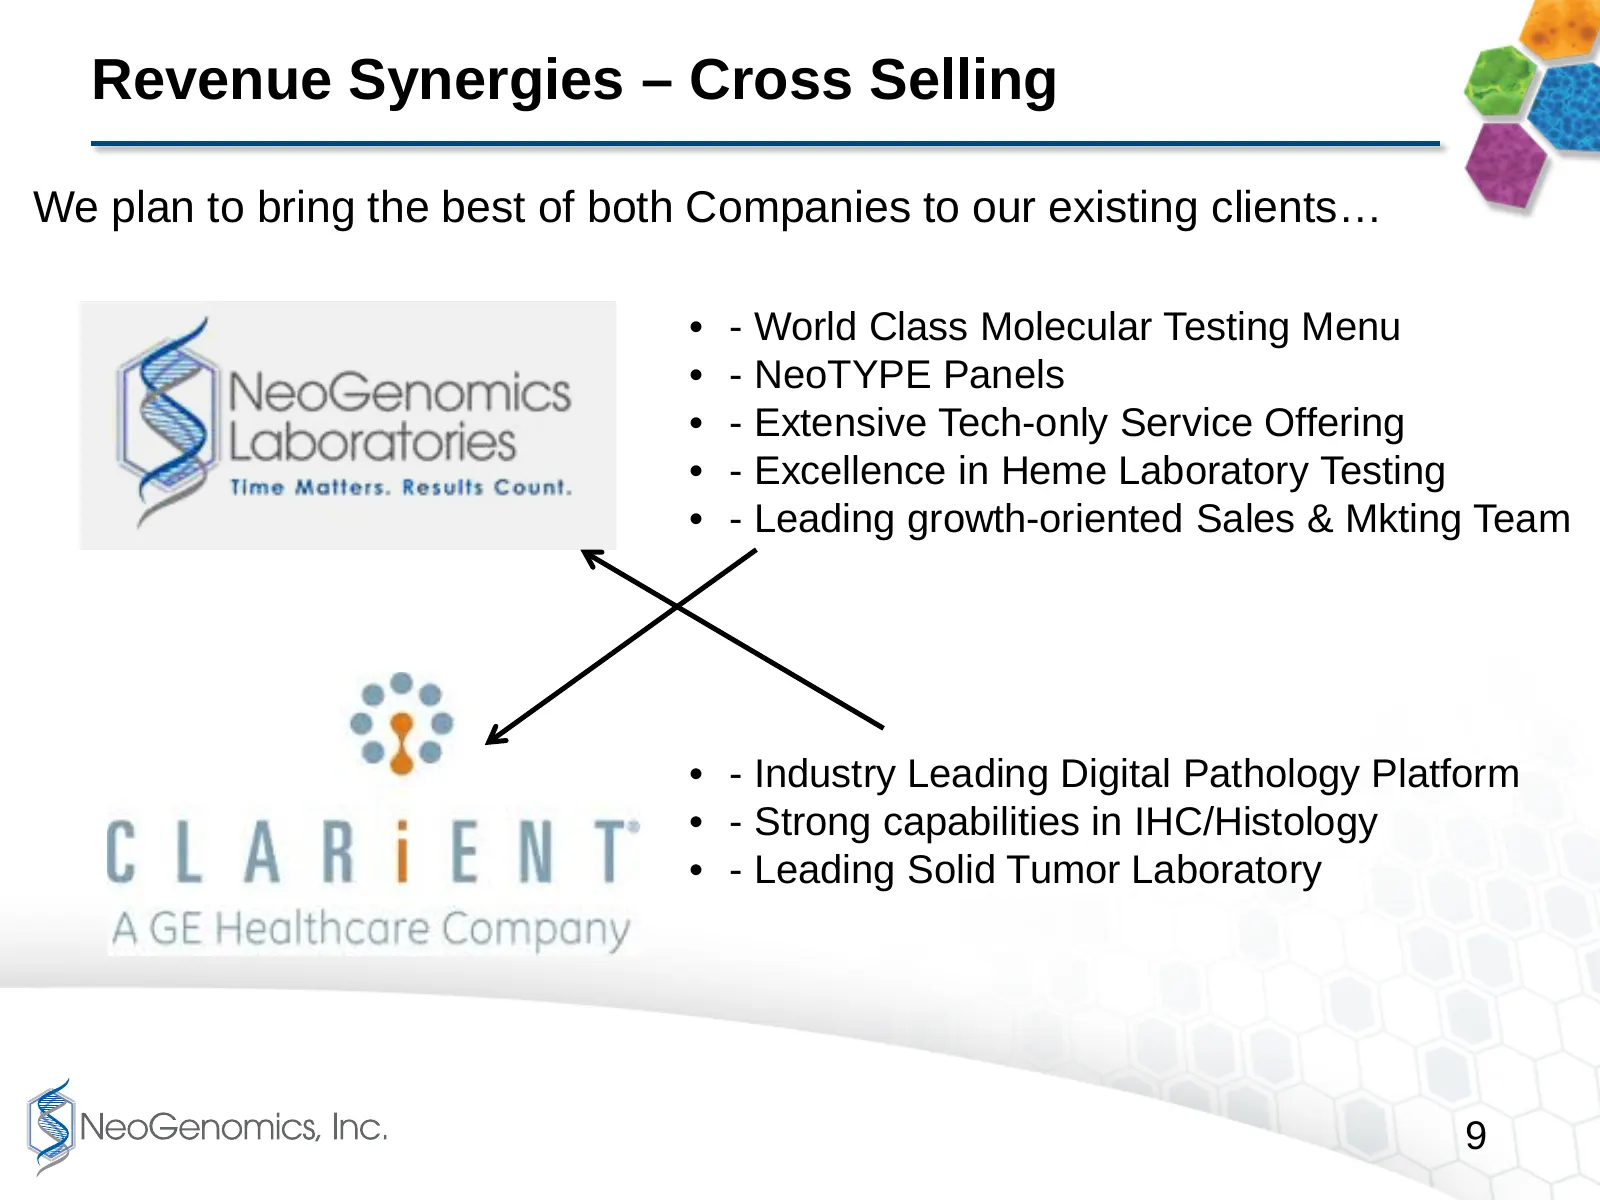
Revenue Synergies – Cross Selling We plan to bring the best of both Companies to our existing clients… • - World Class Molecular Testing Menu • - NeoTYPE Panels • - Extensive Tech-only Service Offering • - Excellence in Heme Laboratory Testing • - Leading growth-oriented Sales & Mkting Team • - Indu
Slide 10: Growth – Expanded Geographic Coverage
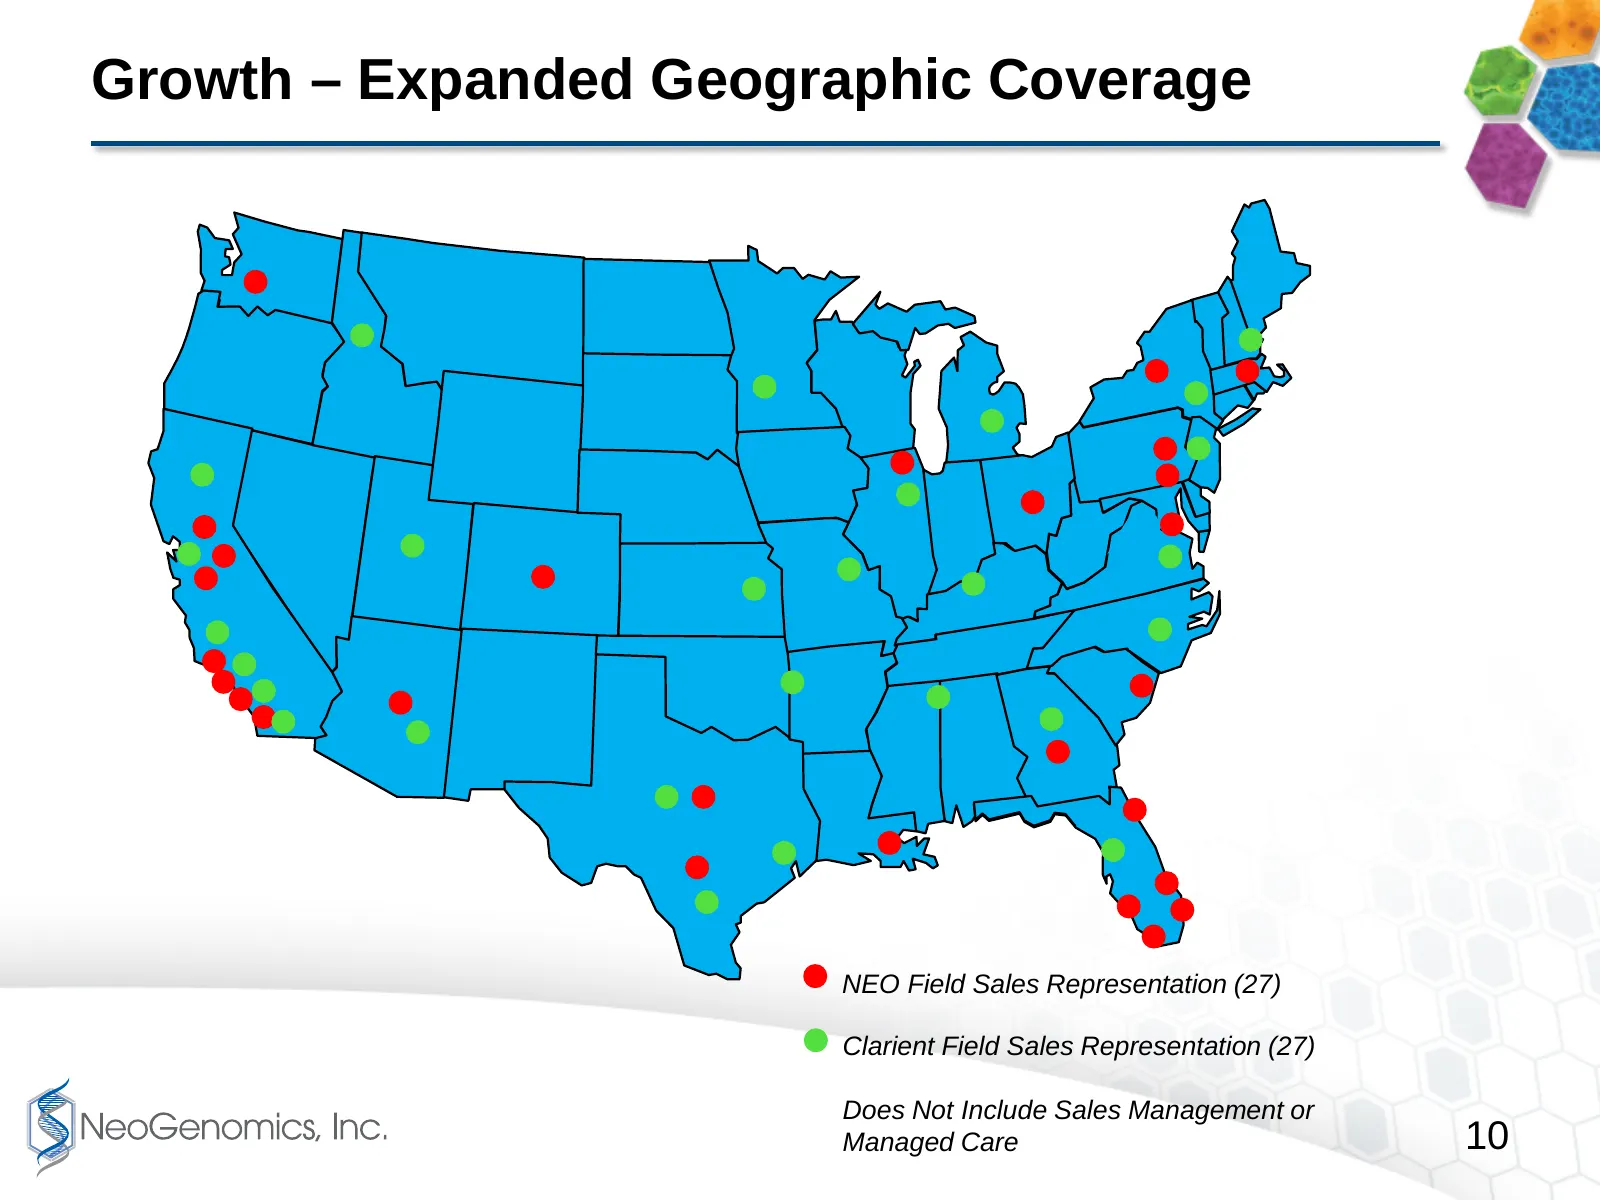
Growth – Expanded Geographic Coverage NEO Field Sales Representation (27) Clarient Field Sales Representation (27) Does Not Include Sales Management or Managed Care 10
Slide 11: Accelerates NEO Strategic Priorities
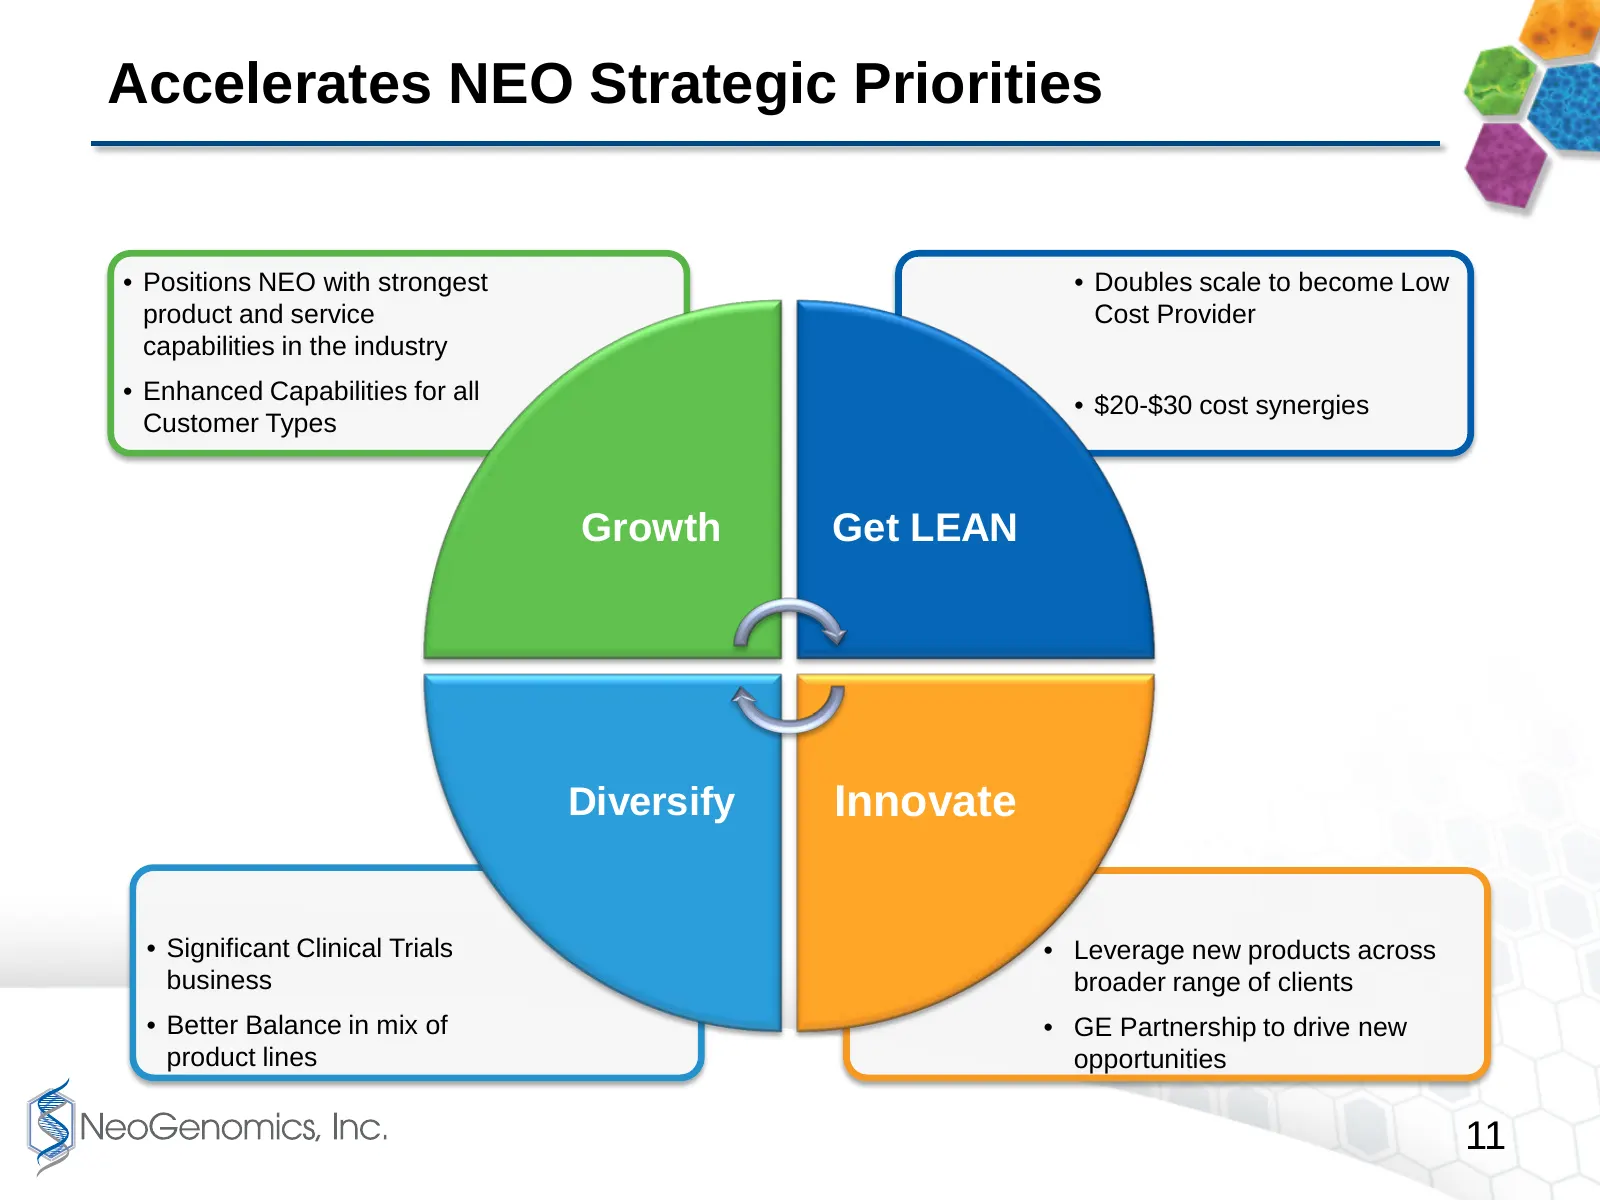
Accelerates NEO Strategic Priorities • Positions NEO with strongest • Doubles scale to become Low product and service Cost Provider capabilities in the industry • Enhanced Capabilities for all • $20-$30 cost synergies Customer Types Growth Get LEAN Diversify Innovate • Significant Clinical Trials •
Slide 12: Purchase Price Components
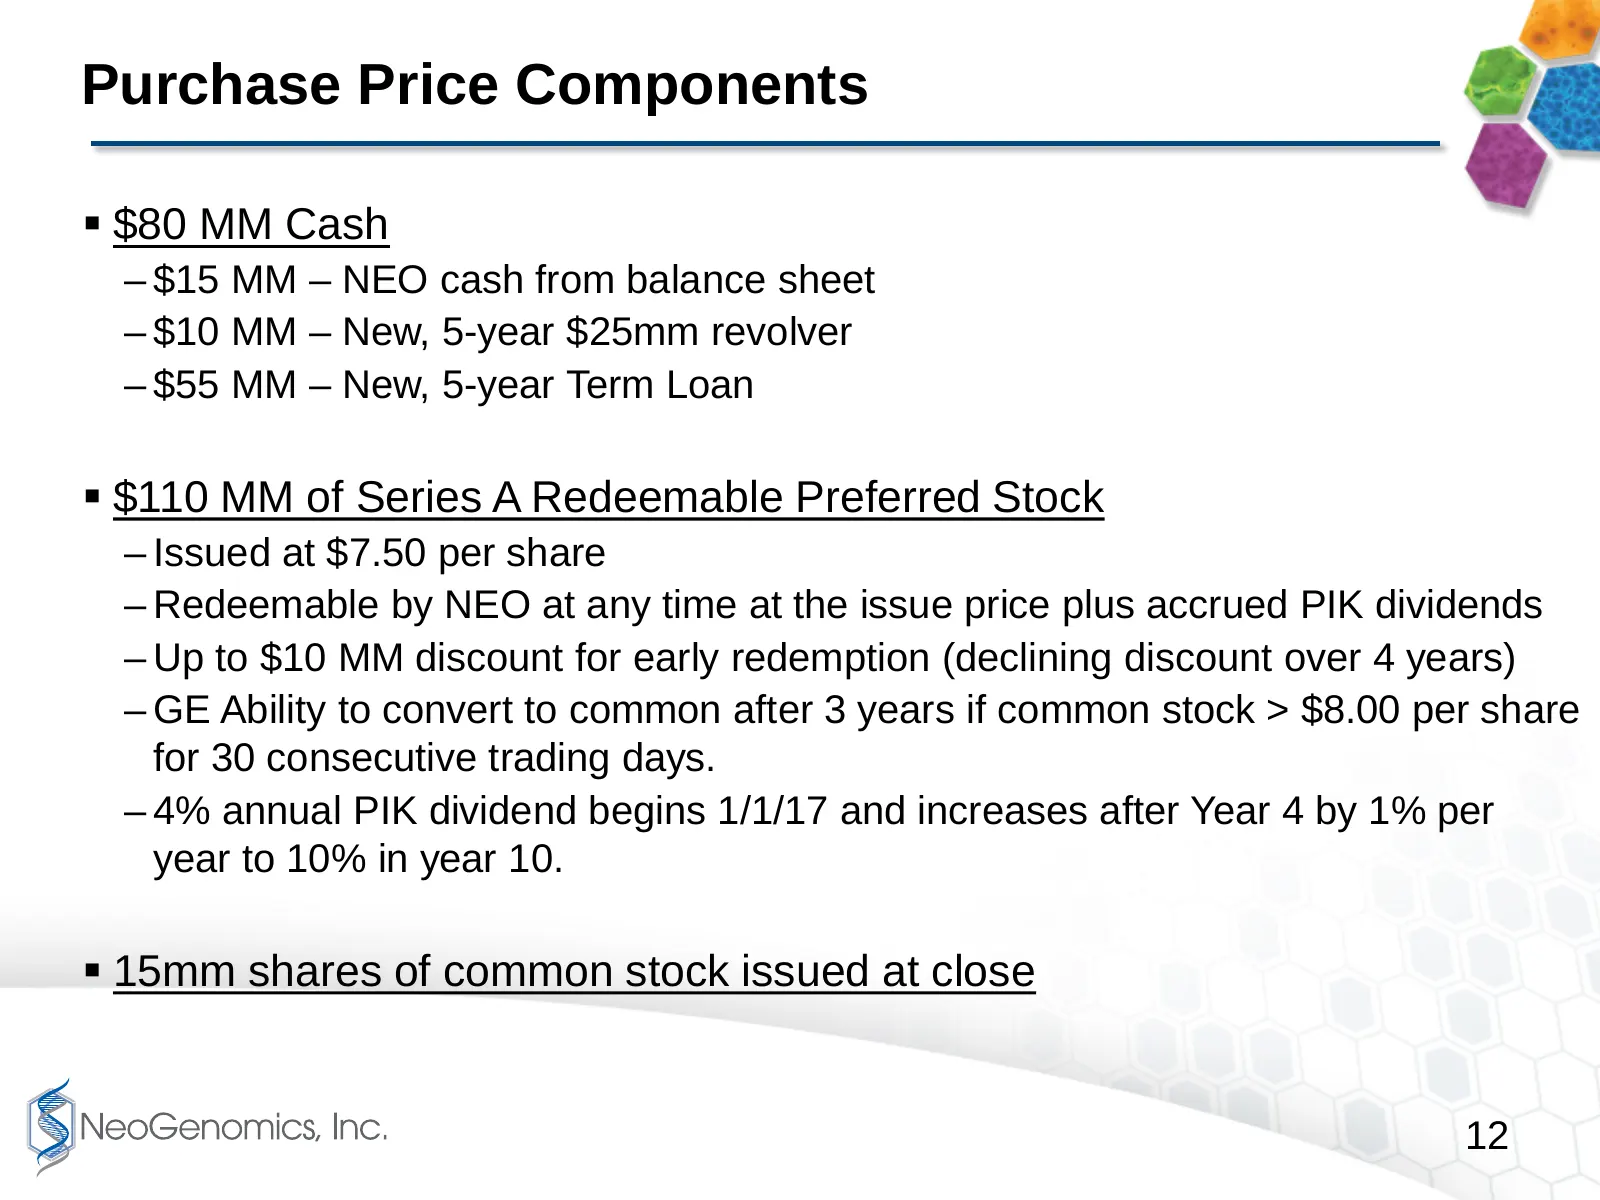
Purchase Price Components $80 MM Cash – $15 MM – NEO cash from balance sheet – $10 MM – New, 5-year $25mm revolver – $55 MM – New, 5-year Term Loan $110 MM of Series A Redeemable Preferred Stock – Issued at $7.50 per share – Redeemable by NEO at any time at the issue price plus accrued PIK divid
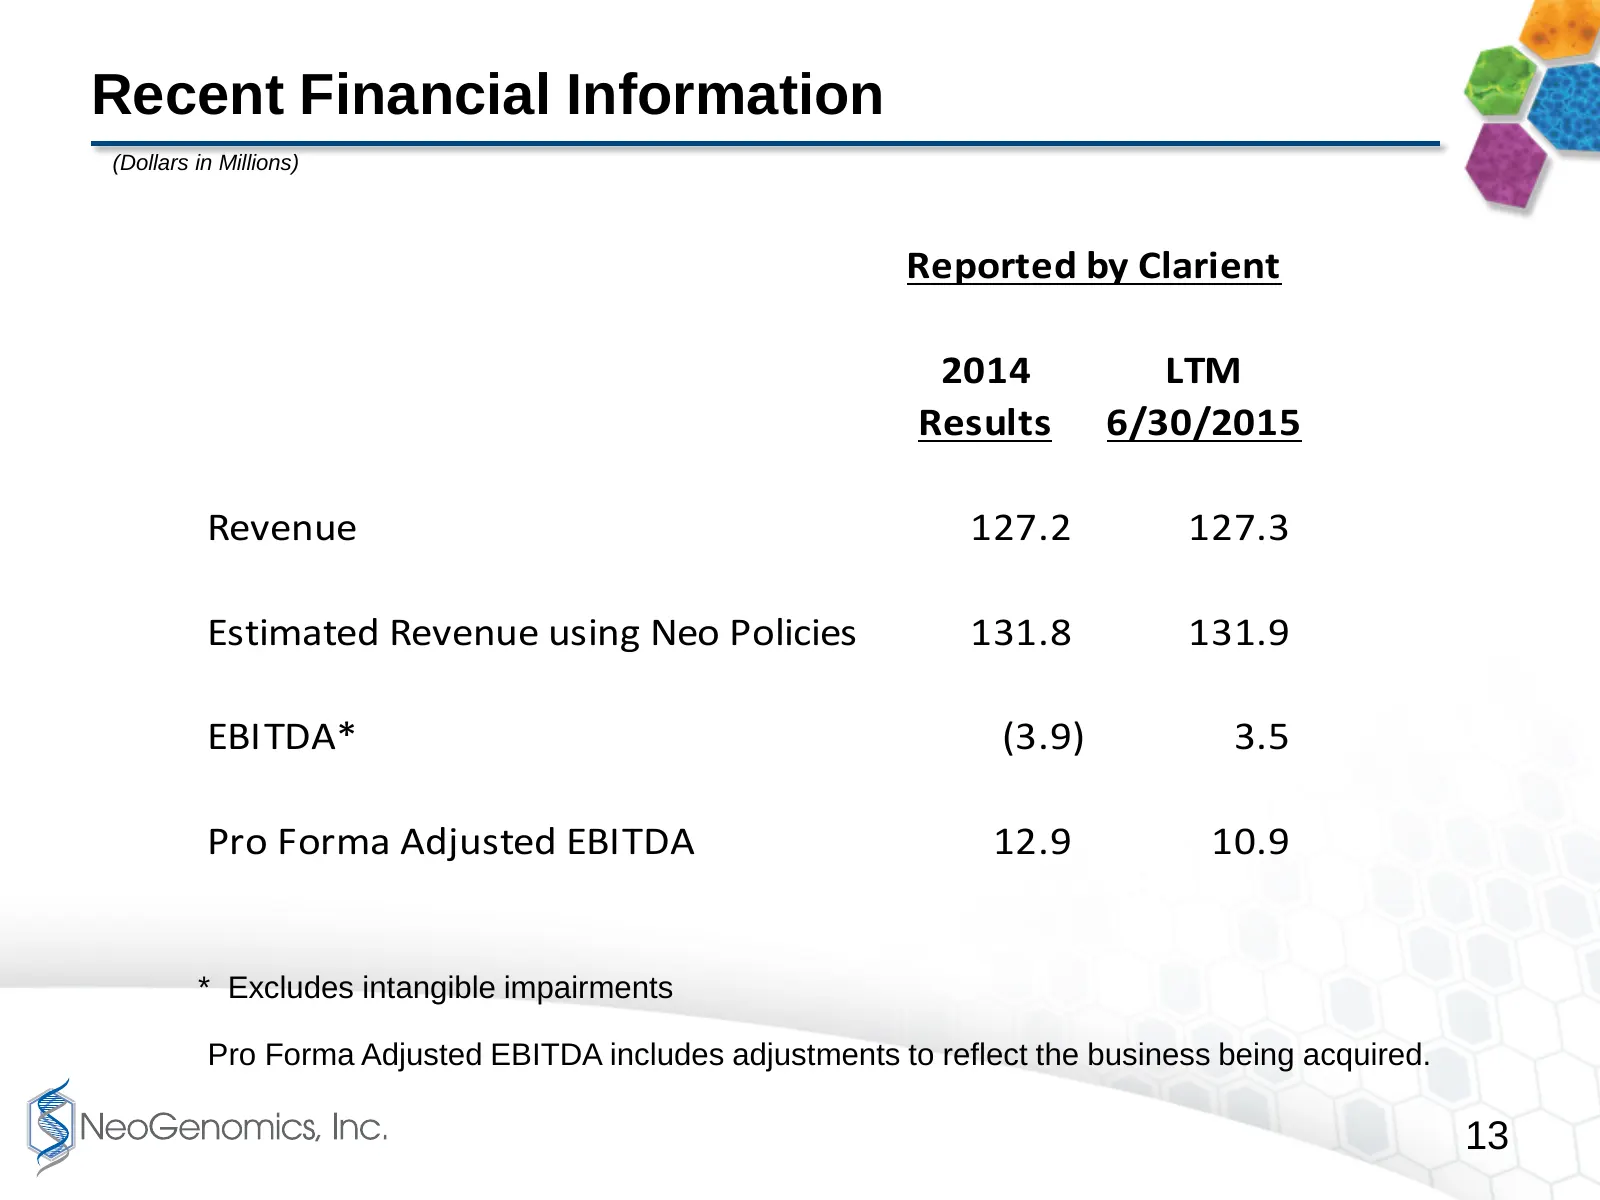
Slide 13: Recent Financial Information Reported by Clarient
Recent Financial Information (Dollars in Millions) Reported by Clarient 2014 LTM Results 6/30/2015 Revenue 127.2 127.3 Estimated Revenue using Neo Policies 131.8 131.9 EBITDA* (3.9) 3.5 Pro Forma Adjusted EBITDA 12.9 10.9 * Excludes intangible impairments Pro Forma Adjusted EBITDA includes adjustmen
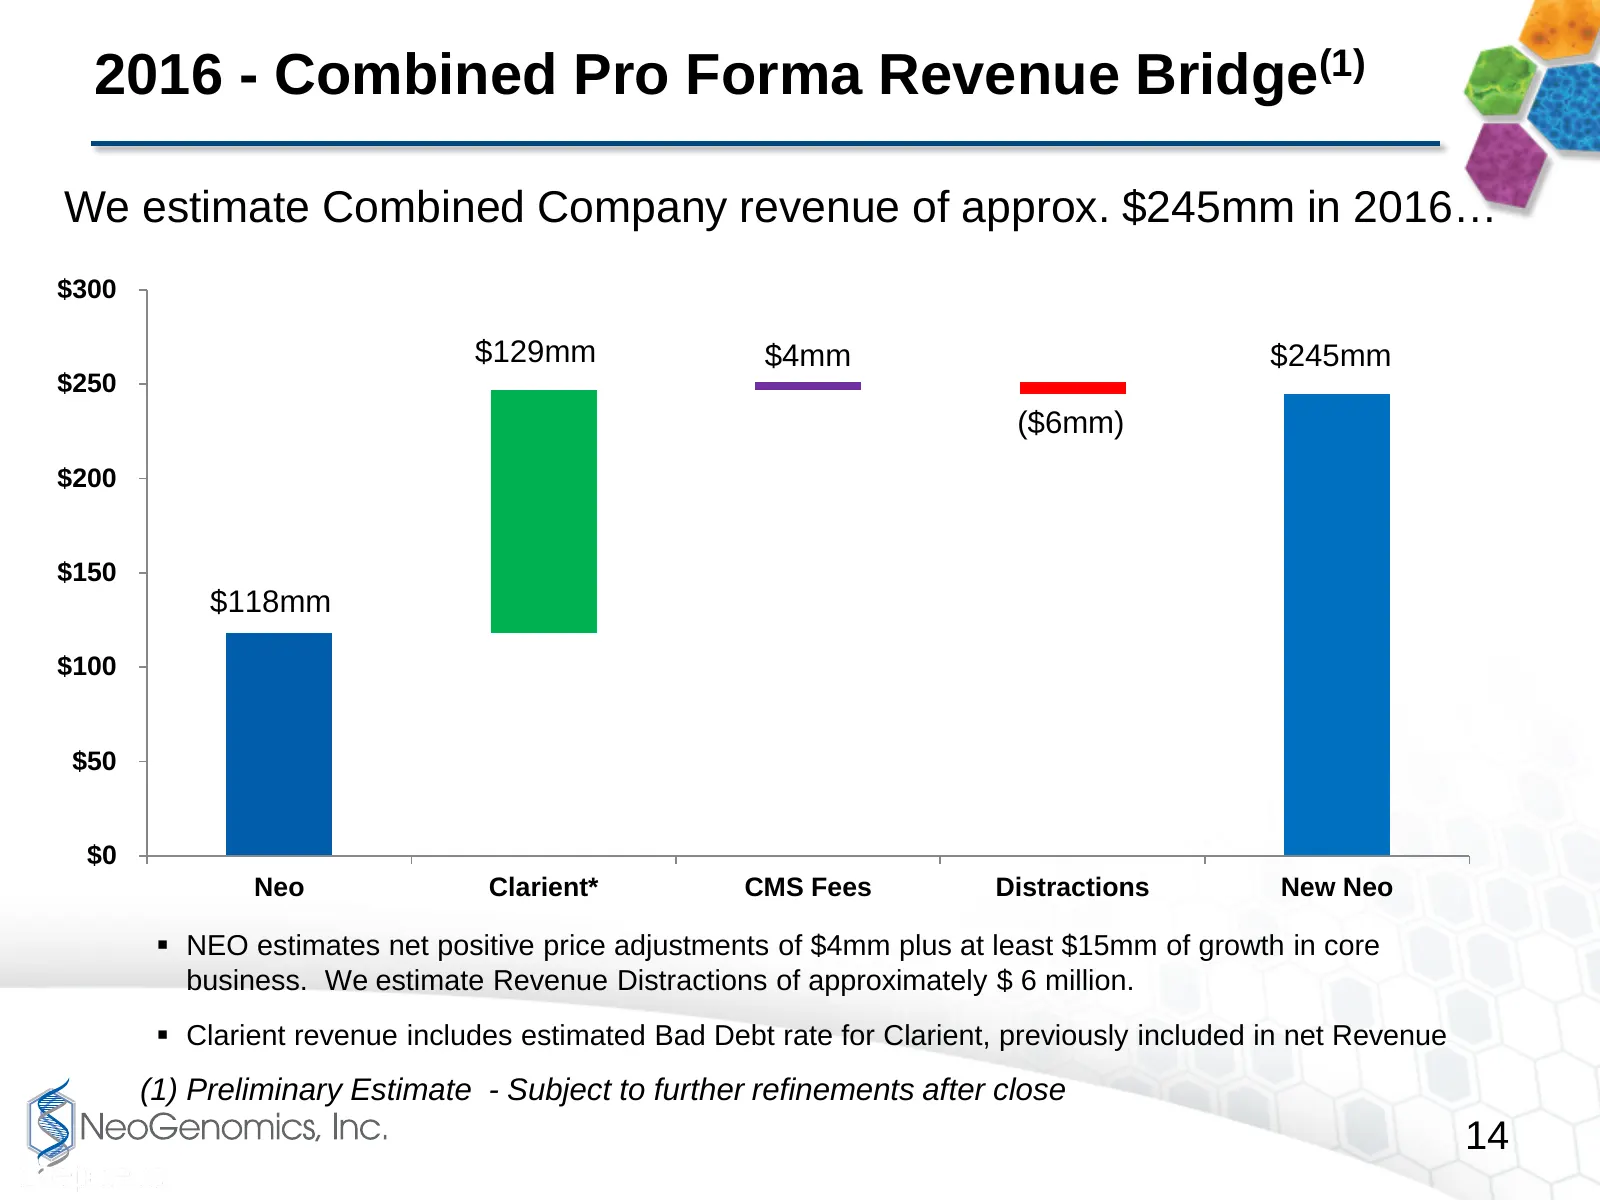
Slide 14: 2016 Combined Pro Forma Revenue Bridge
2016 - Combined Pro Forma Revenue Bridge(1) We estimate Combined Company revenue of approx. $245mm in 2016… $300 $129mm $4mm $245mm $250 ($6mm) $200 $150 $118mm $100 $50 $0 Neo Clarient* CMS Fees Distractions New Neo NEO estimates net positive price adjustments of $4mm plus at least $15mm of growt
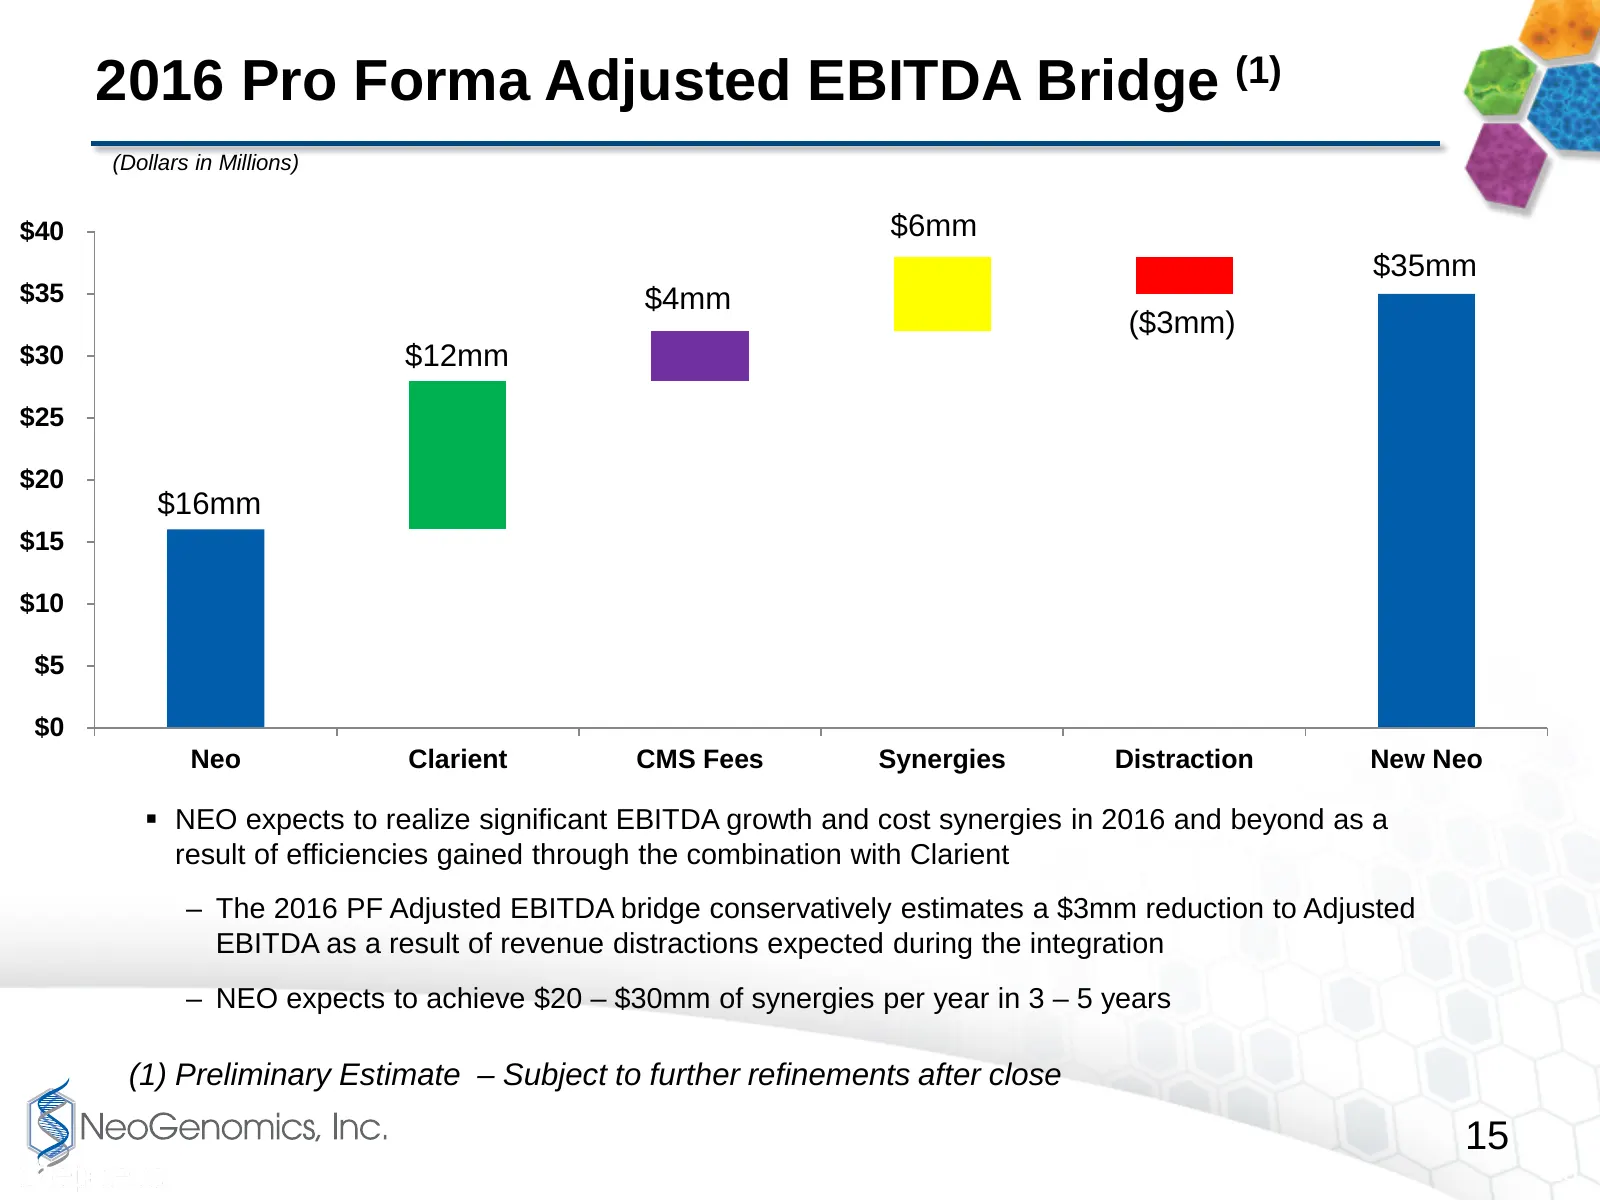
Slide 15: 2016 Pro Forma Adjusted EBITDA Bridge
2016 Pro Forma Adjusted EBITDA Bridge (1) (Dollars in Millions) $40 $6mm $35mm $35 $4mm ($3mm) $30 $12mm $25 $20 $16mm $15 $10 $5 $0 Neo Clarient CMS Fees Synergies Distraction New Neo NEO expects to realize significant EBITDA growth and cost synergies in 2016 and beyond as a result of efficiencie
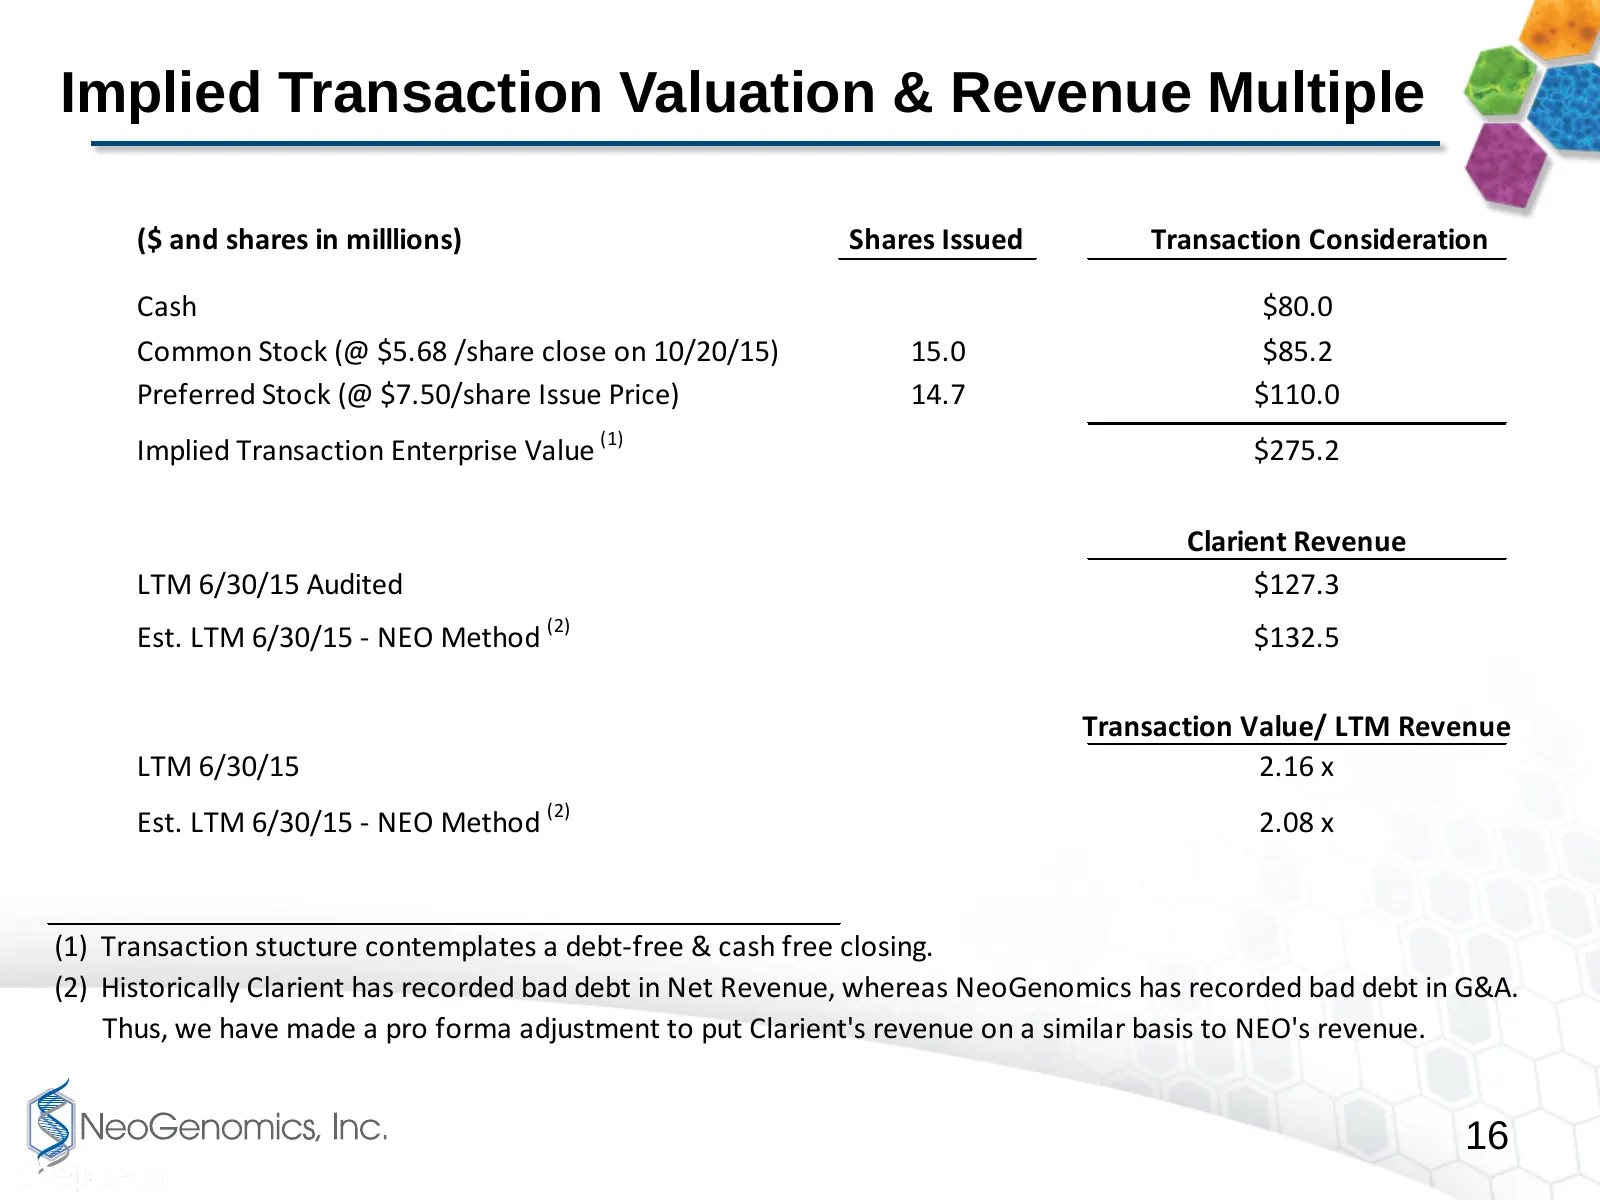
Slide 16: Implied Transaction Valuation & Revenue Multiple
Implied Transaction Valuation & Revenue Multiple ($ and shares in milllions) Shares Issued Transaction Consideration Cash $80.0 Common Stock (@ $5.68 /share close on 10/20/15) 15.0 $85.2 Preferred Stock (@ $7.50/share Issue Price) 14.7 $110.0 Implied Transaction Enterprise Value (1) $275.2 Clarient
Slide 17: NeoGenomics Emerging Vision and Goals
NeoGenomics Emerging Vision and Goals Leadership Goals: • Leading specialized, high-growth, high-technology, “precision medicine” testing and information company. Financial Performance Goals: • Consistent and sustainable double-digit revenue growth. • Clinical Trials > 15% of revenue. • Adjusted EBI
Slide 18: Appendix
oe Appendix & § NeoGenomics, Inc. $32 CLARIENT A GE Healthcare Company Appendix g NeoGenomics, Inc. 18
Slide 19: Clarient Test Volume and Average Unit Price
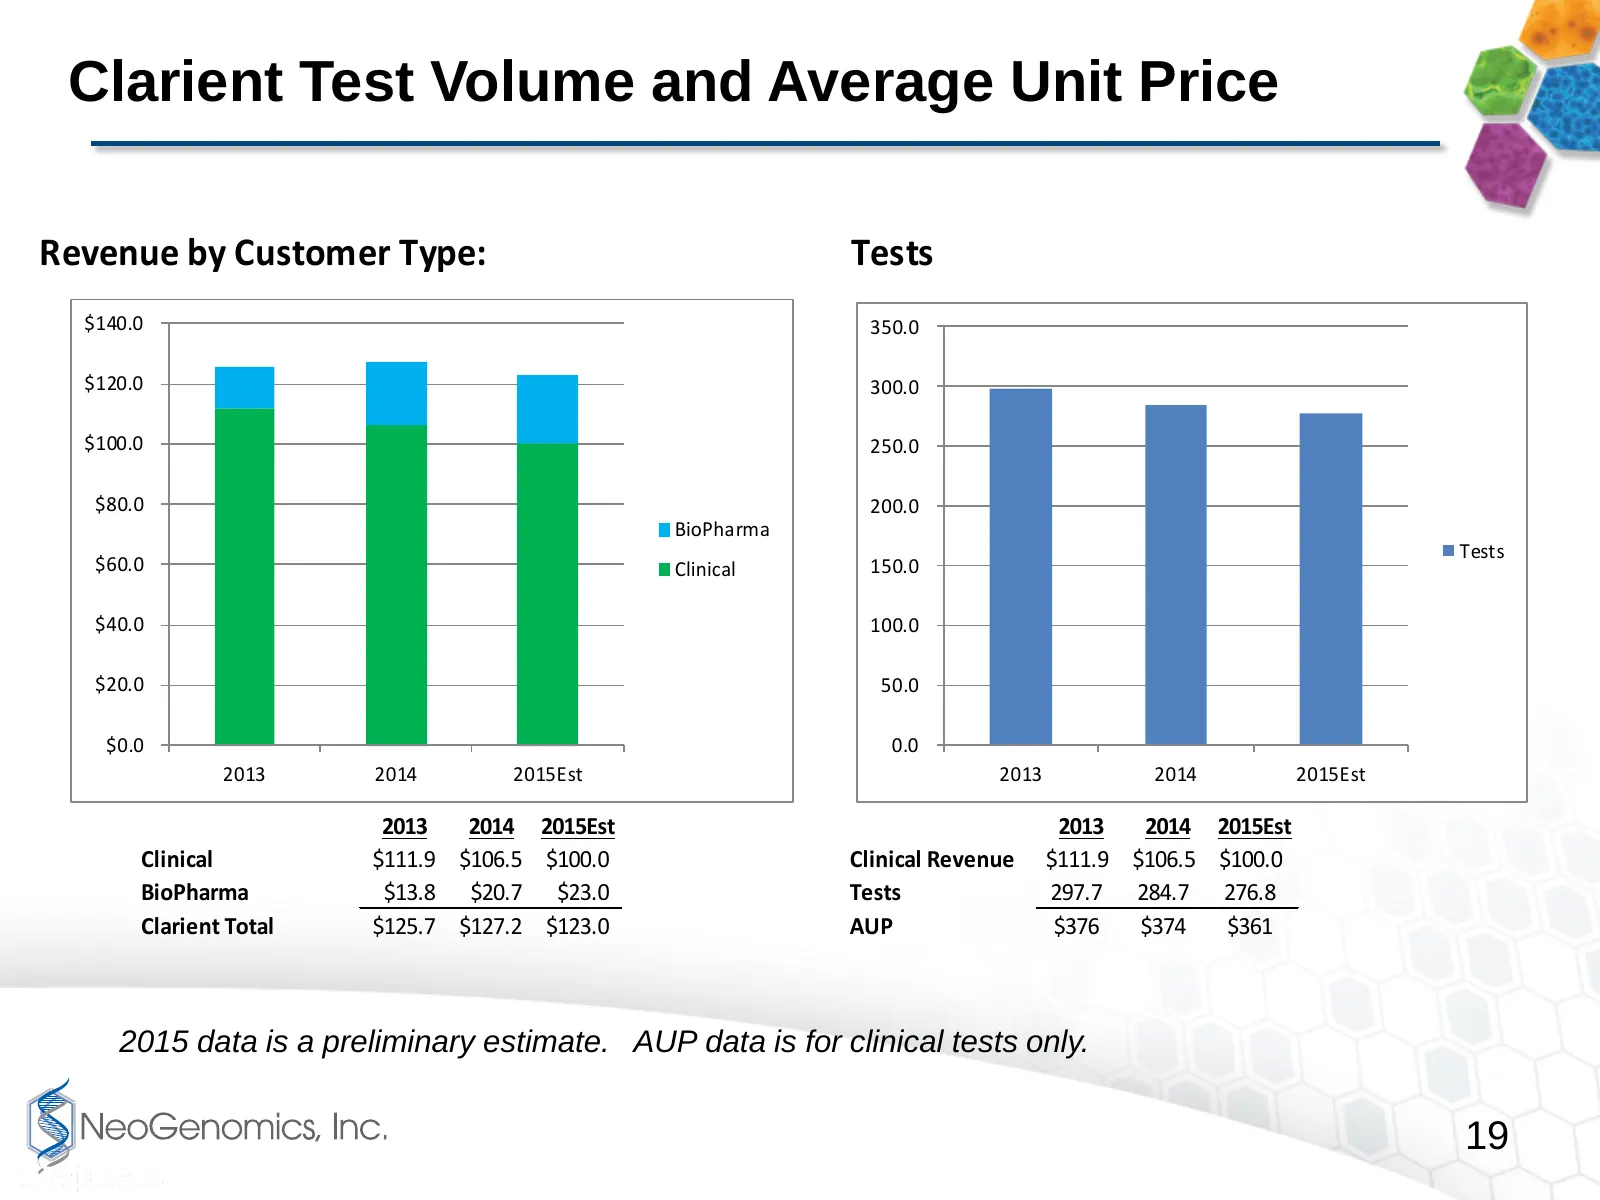
Clarient Test Volume and Average Unit Price Revenue by Customer Type: Tests $140.0 350.0 $120.0 300.0 $100.0 250.0 $80.0 200.0 BioPharma Tests $60.0 Clinical 150.0 $40.0 100.0 $20.0 50.0 $0.0 0.0 2013 2014 2015Est 2013 2014 2015Est 2013 2014 2015Est 2013 2014 2015Est Clinical $111.9 $106.5 $100.0 Cl
Slide 20: Payor Mix - 2014 Clinical Only
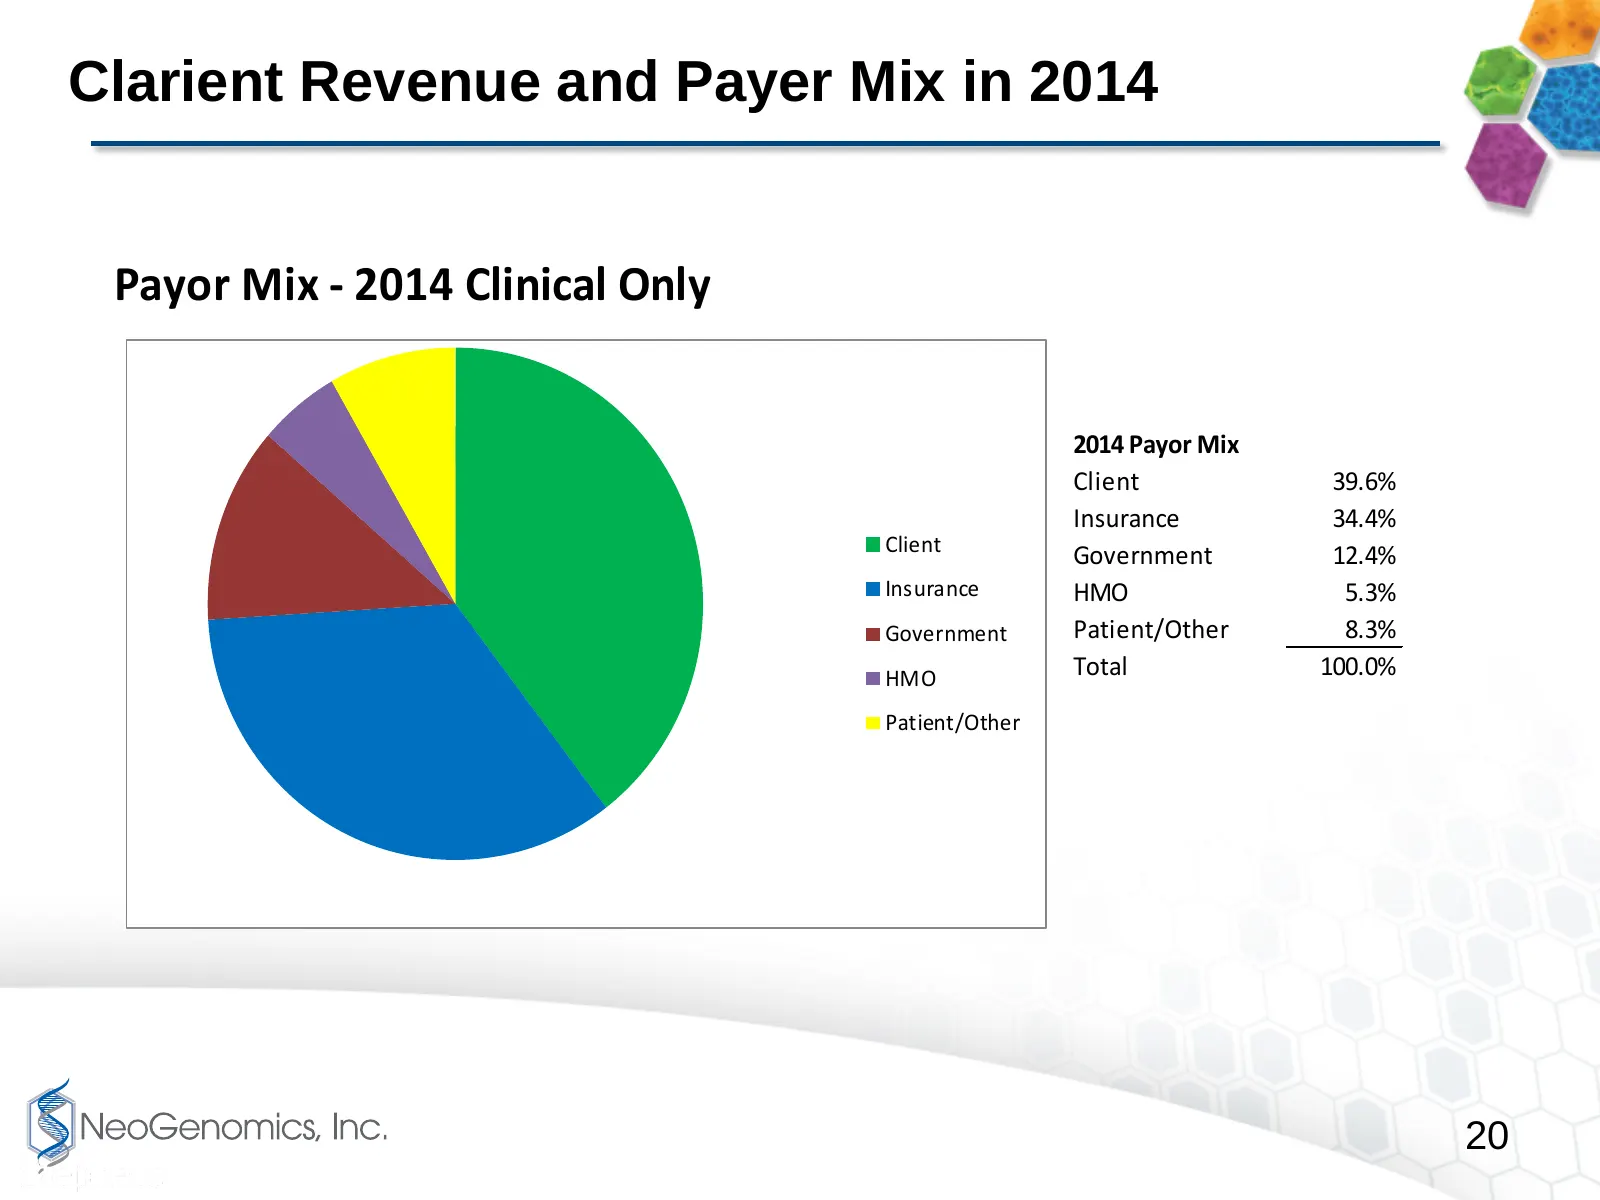
Clarient Revenue and Payer Mix in 2014 Payor Mix - 2014 Clinical Only 2014 Payor Mix Client 39.6% Insurance 34.4% Client Government 12.4% Insurance HMO 5.3% Government Patient/Other 8.3% HMO Total 100.0% Patient/Other 20 Confidential
Source: Internet Archive copy of neogenomics.com
More decks from NeoGenomics, Inc.
 Q3 2026 Earnings Presentation26 slides · Oct 28, 2026
 Q2 2026 Earnings Presentation24 slides · Jul 28, 2026
 Q1 2026 Earnings Presentation27 slides · Apr 28, 2026
 Q4 2025 Earnings Presentation15 slides · Feb 17, 2026
 Q3 2025 Earnings Presentation17 slides · Oct 28, 2025
 Q2 2025 Earnings Presentation17 slides · Jul 29, 2025