Peoples Energy — Midwest Seminar - Chicago, April 14-16, 2004
35 slides from Peoples Energy's conference presentation, Apr 14, 2004
Slide 1: Proven Strategies Producing Results
Proven Strategies Producing Results Midwest Seminar - Chicago April 14-16, 2004 PE@PLES ENERGY.
Slide 2: Forward-Looking Information
Forward-LookingJnto;maton In our presentation today, we will be making some forward-looking statements such as business plans and expectations for future development and earnings growth. Actual results could differ materially from such expectations because of many uncertainties, some of which are li
Slide 3: Strategic Overview
Strategic Overview PE@PLES ENERGY.
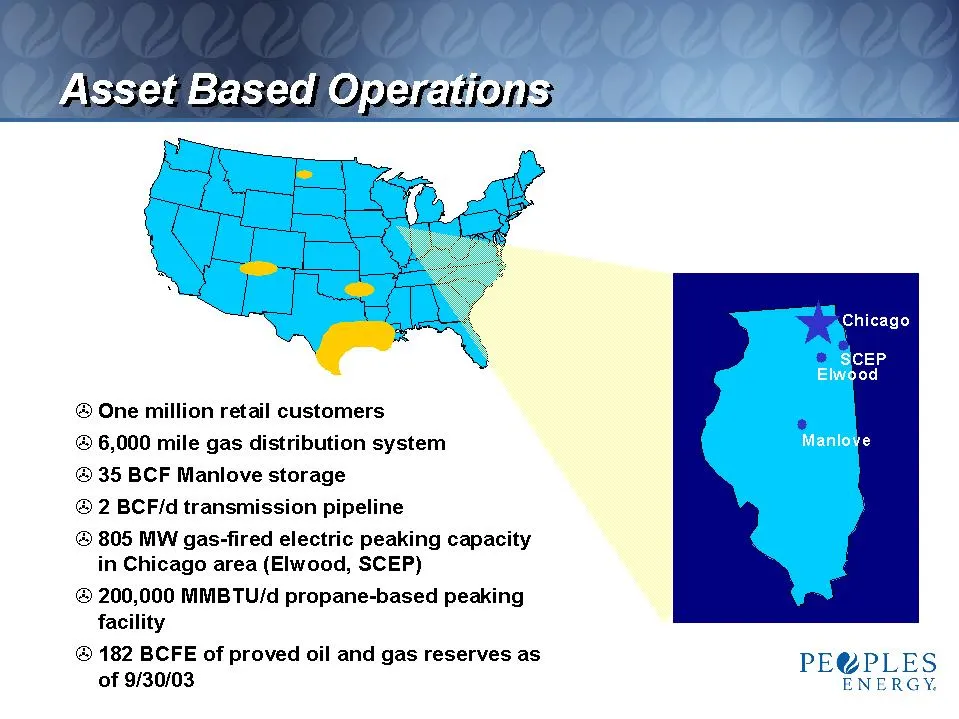
Slide 4: Chicago area energy assets and customers
© One million retail customers @ 6,000 mile gas distribution system @ 35 BCF Manlove storage ® 2 BCF/d transmission pipeline @ 805 MW gas-fired electric peaking capacity in Chicago area (Elwood, SCEP) ® 200,000 MMBTU/d propane-based peaking facility @ 182 BCFE of proved oil and gas reserves as of 9/
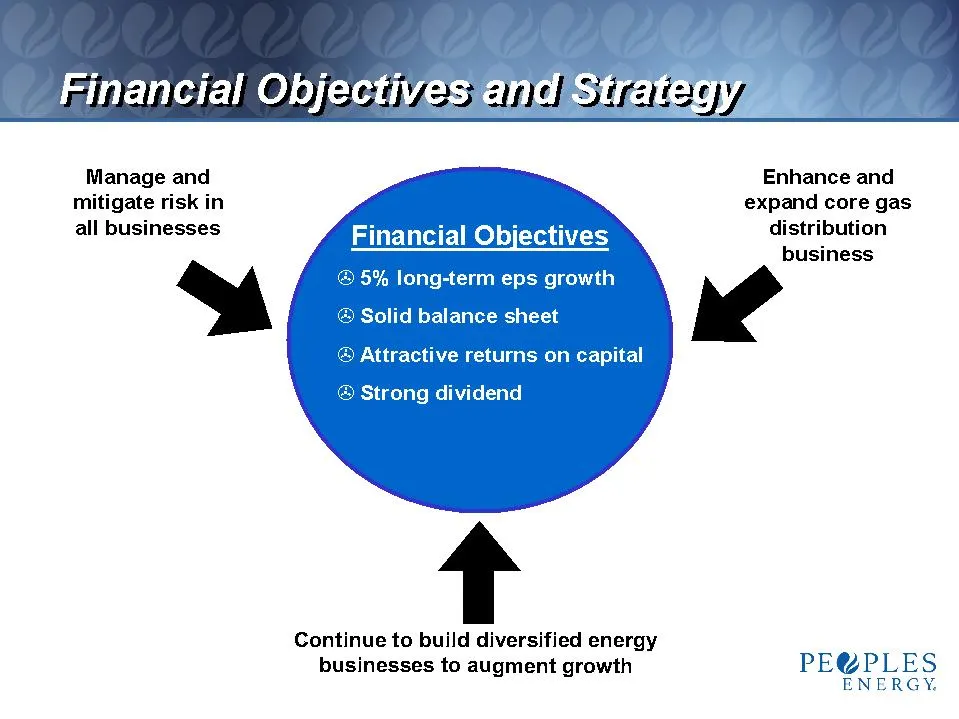
Slide 5: Financial Objectives and Strategy
| Financial Objectivesendistrateay, Enhance and expand core gas distribution business Manage and mitigate risk in all businesses Continue to build diversified energy businesses to augment growth PE@PLES ENERGY.
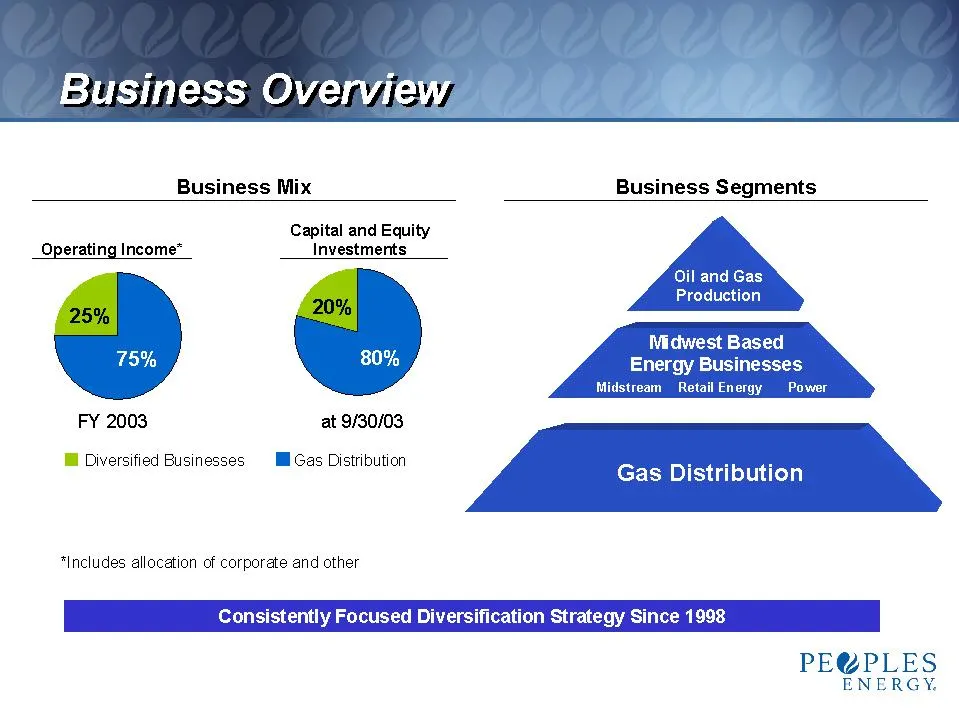
Slide 6: Business Overview
_ Business Overvie Business Mix Business Segments Capital and Equity Operating Income” Investments FY 2003 at 9/30/03 Il Diversified Businesses I Gas Distribution “Includes allocation of corporate and other Consistently Focused Diversification Str. PE@PLES ENERGY.
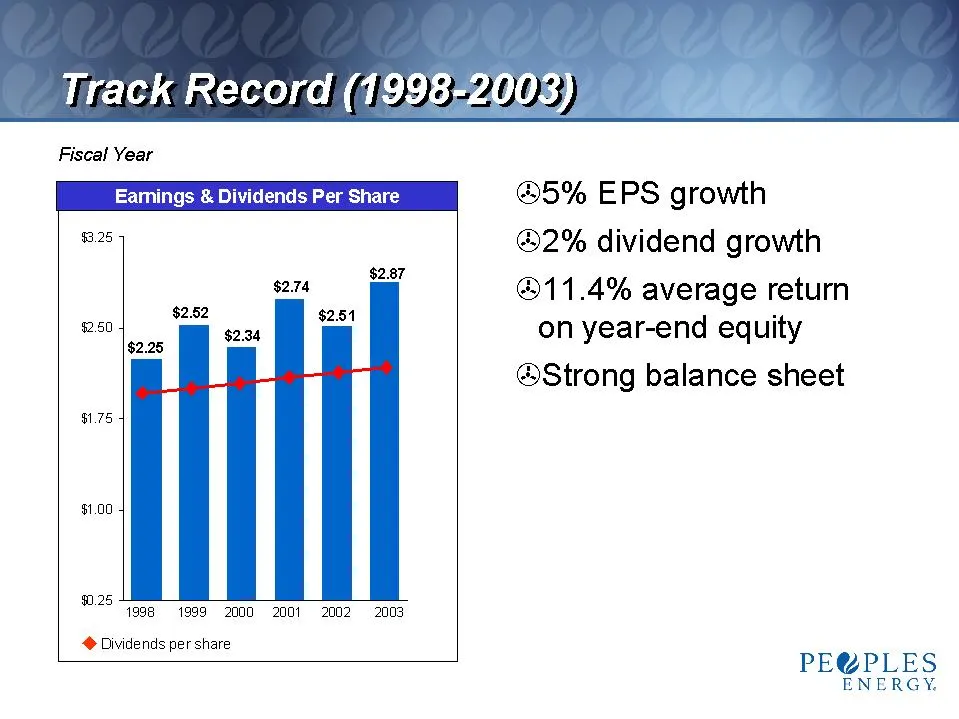
Slide 7: Track Record (1998-2003)
| tack Record (199872) Fiscal Year ©5% EPS growth @2% dividend growth @11.4% average return on year-end equity @Strong balance sheet $2.60 8175 $1.00 90.25 q998 1999 2000 2001 2002-2008 @ Dividends per share PE@PLES ENERGY.
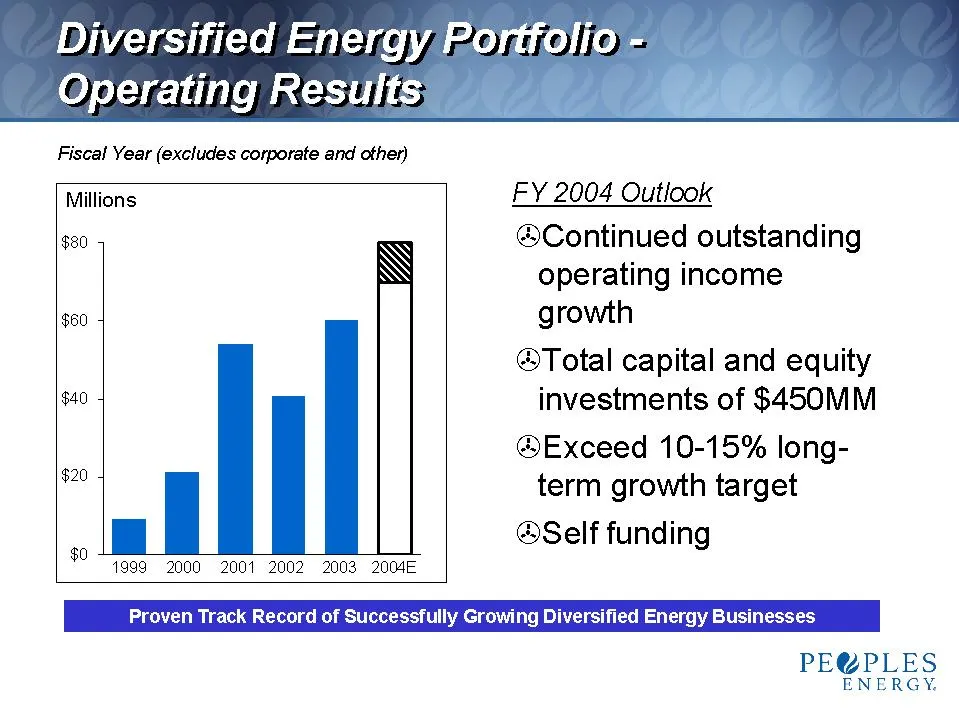
Slide 8: Diversified Energy Operating Results
Diversified Energy ges” . Operating Results| Fiscal Year (excludes corporate and other) Millions EY 2004 Outlook $80 Continued outstanding operating income $60 growth @Total capital and equity $40 investments of $450MM @®Exceed 10-15% long- term growth target @Self funding $20 0 § 1999 2000 2001 200
Slide 9: Drivers of Long-Term Earnings Growth
Drivers of LonglenmeEanngs Crow @lmproved operating efficiencies and asset utilization in all businesses @Strong cash flow — ~$250MM/syr in FFO generated from existing businesses — ~$50MM/jr free cash flow available for growth @Diversified energy business growth — Grow reserve base and production —
Slide 10: Gas Distribution
Gas Distribution PE@PLES ENERGY.
Slide 11: Gas Distribution core business
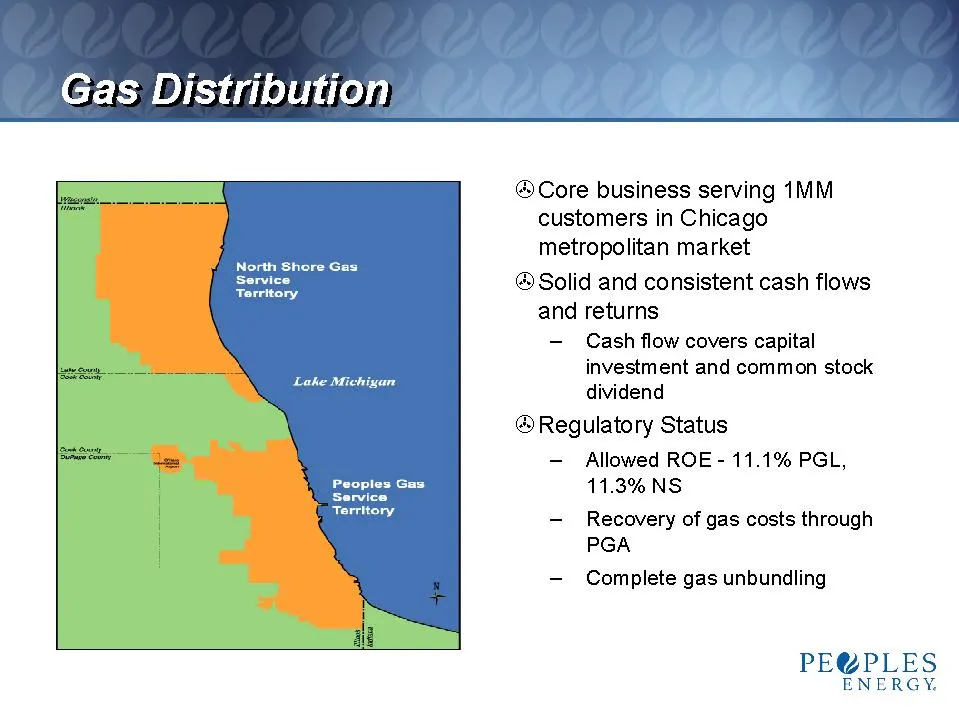
®Core business serving 1MM customers in Chicago metropolitan market ® Solid and consistent cash flows and returns - Cash flow covers capital investment and common stock dividend ® Regulatory Status — Allowed ROE - 11.1% PGL, 11.3% NS -— Recovery of gas costs through PGA - Complete gas unbundling PE@
Slide 12: Gas Distribution Margin
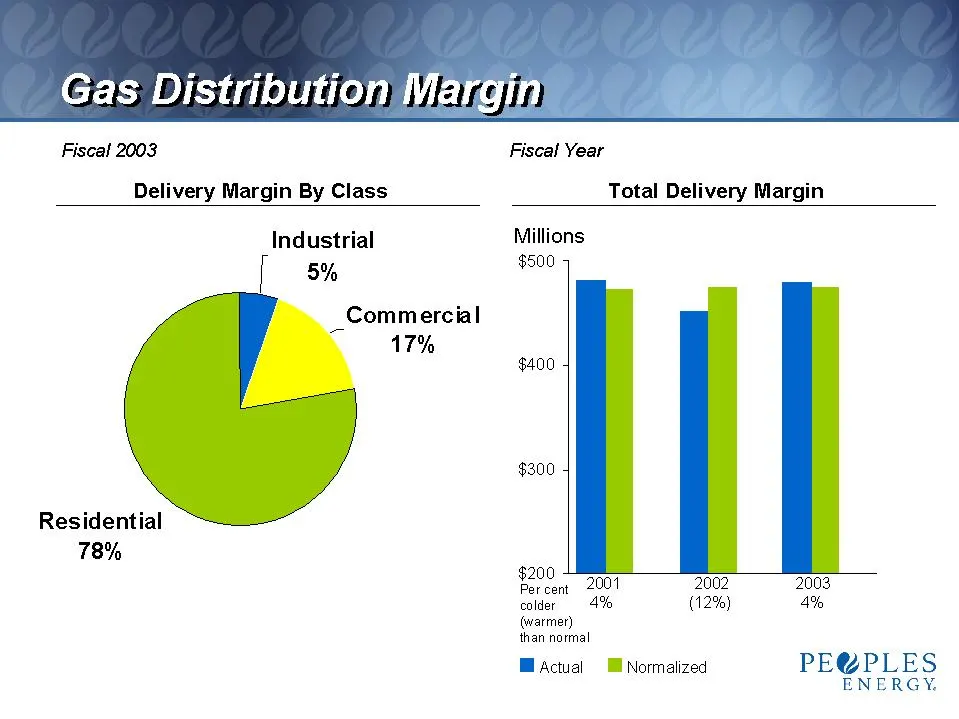
Gas Distribution Margin Fiscal 2003 Fiscal Year Delivery Margin By Class Total Delivery Margin [ Industrial Millions 5% $500 Commercial 17% $400 $300 Residential 78% $200 Percent 2001 2002 2003 colder 4% (12%) 4% (warmer) than normal MActual Ml Normalized PE@PLES ENERGY,
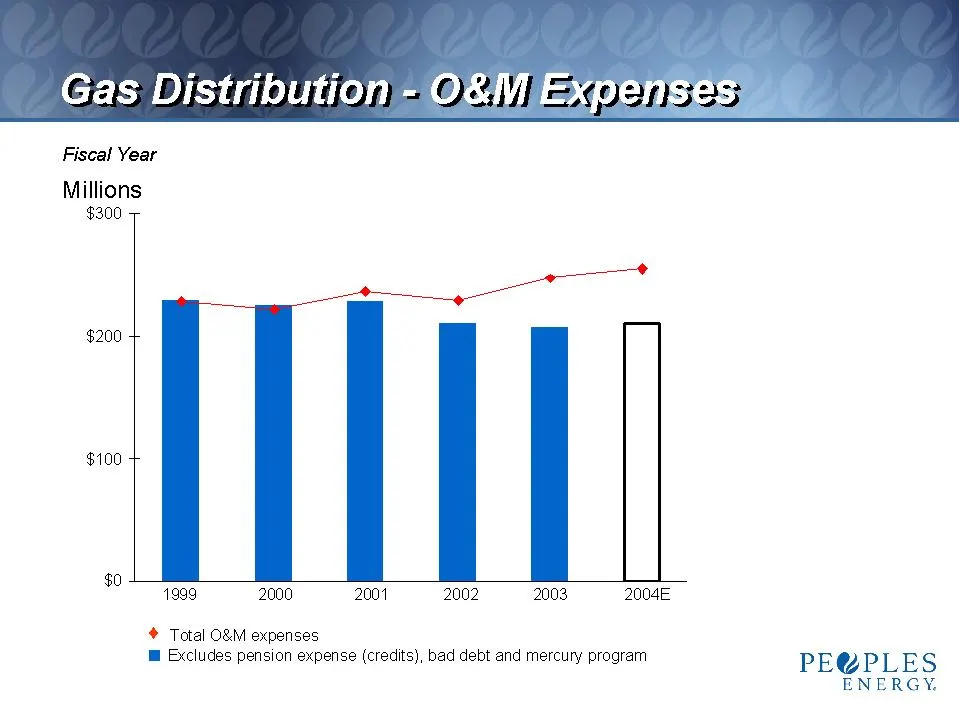
Slide 13: Gas Distribution O&M Expense
Gas Distribution= OSAV/Experise Fiscal Year Millions $300 $200 $100 1999 2000 2001 2002 2003 2004E * Total O&M expenses @ Excludes pension expense (credits), bad debt and mercury program PE@W PLES ENERGY.
Slide 14: Gas Distribution Strategic Direction
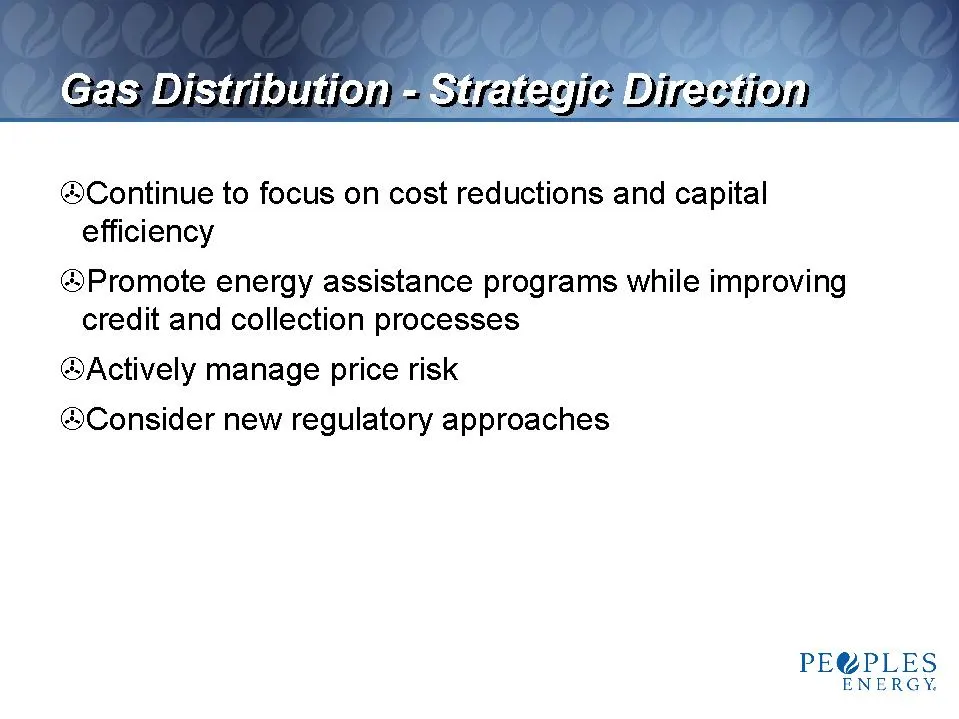
Gas Distribution -strategio Direction @Continue to focus on cost reductions and capital efficiency @Promote energy assistance programs while improving credit and collection processes @Actively manage price risk @Consider new regulatory approaches PE@PLES ENERGY.
Slide 15: Gas Distribution FY 2001 Gas Charge Reconciliation Case
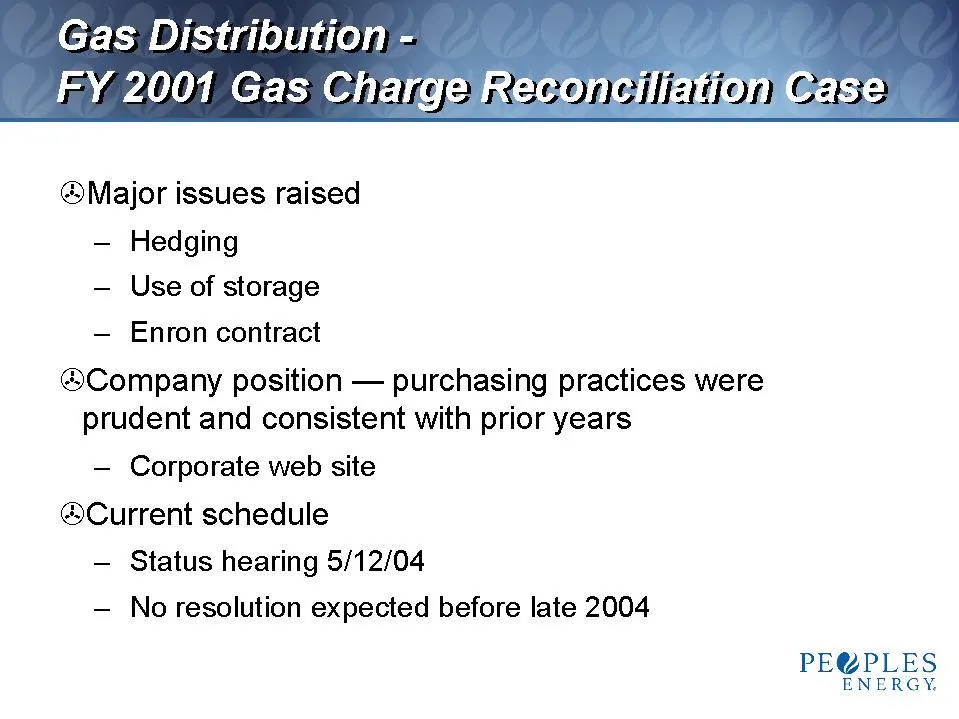
Gas Distribution = FY 2001 Gas Charge\Reconcillationiease @Major issues raised — Hedging — Use of storage — Enron contract @®Company position — purchasing practices were prudent and consistent with prior years — Corporate web site Current schedule — Status hearing 5/12/04 — No resolution expected be
Slide 16: Diversified Energy Businesses
Diversified Energy Businesses PE@PLES ENERGY. +
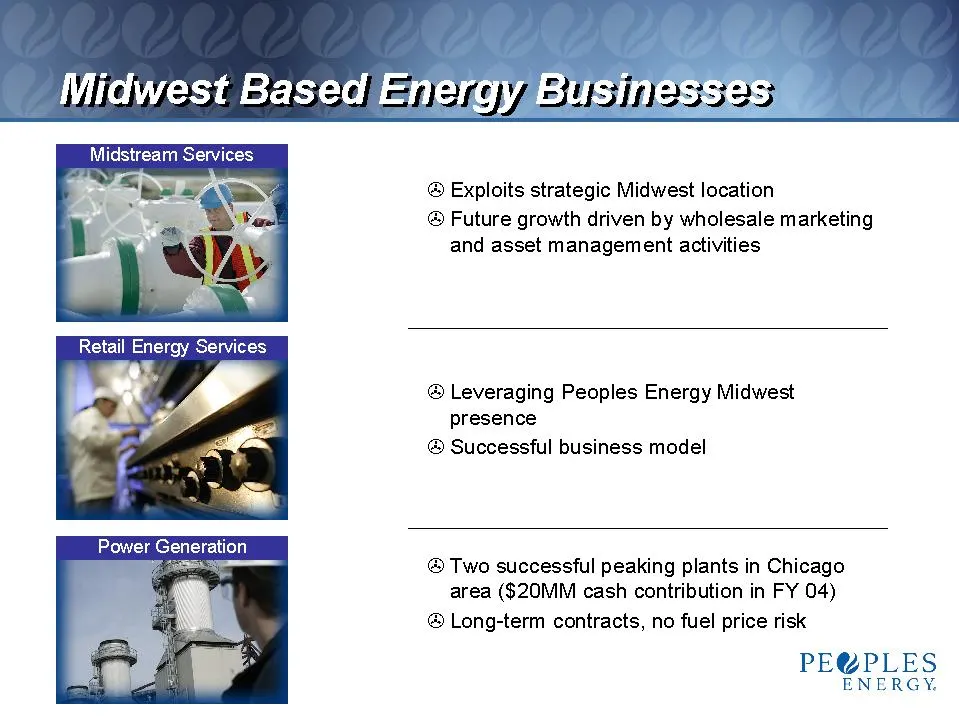
Slide 17: Midwest Based Energy Businesses
ag | Midwest Based E + IETGY BUSINESSES, Midstream Services ® Exploits strategic Midwest location ® Future growth driven by wholesale marketing and asset management activities Retail Energy Services a V 4 ® Leveraging Peoples Energy Midwest r “ presence ® Successful business model @ Two successful p
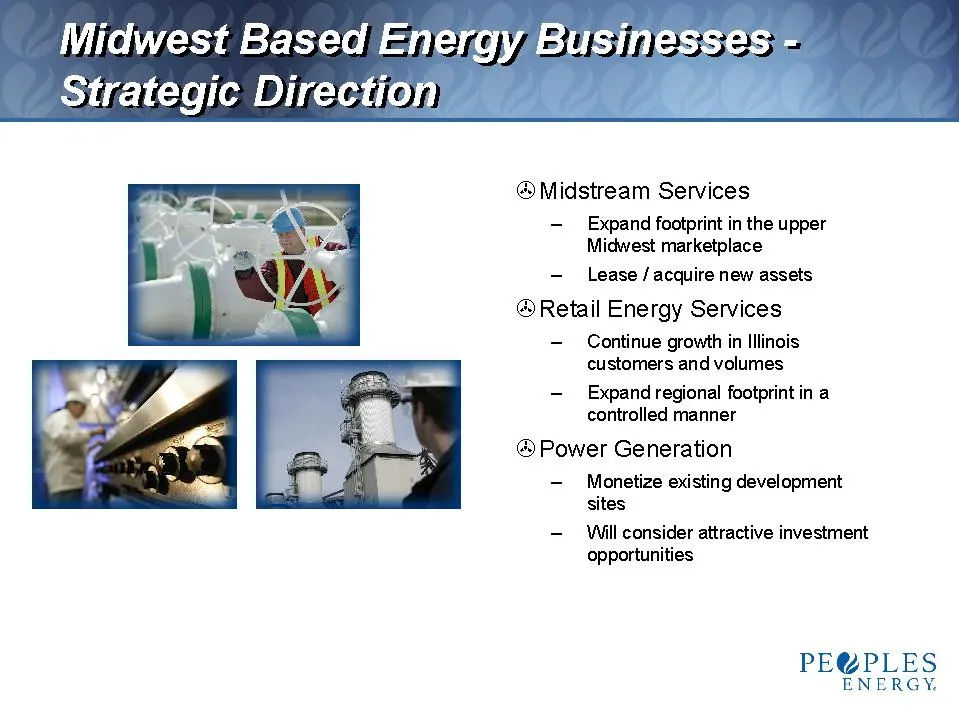
Slide 18: Diversified Energy Businesses strategy
— |e 7 es ergy BUSINESSES ® Midstream Services - Expand footprint in the upper Midwest marketplace - Lease / acquire new assets ® Retail Energy Services - Continue growth in Illinois customers and volumes - Expand regional footprint in a controlled manner ® Power Generation - Monetize existing devel
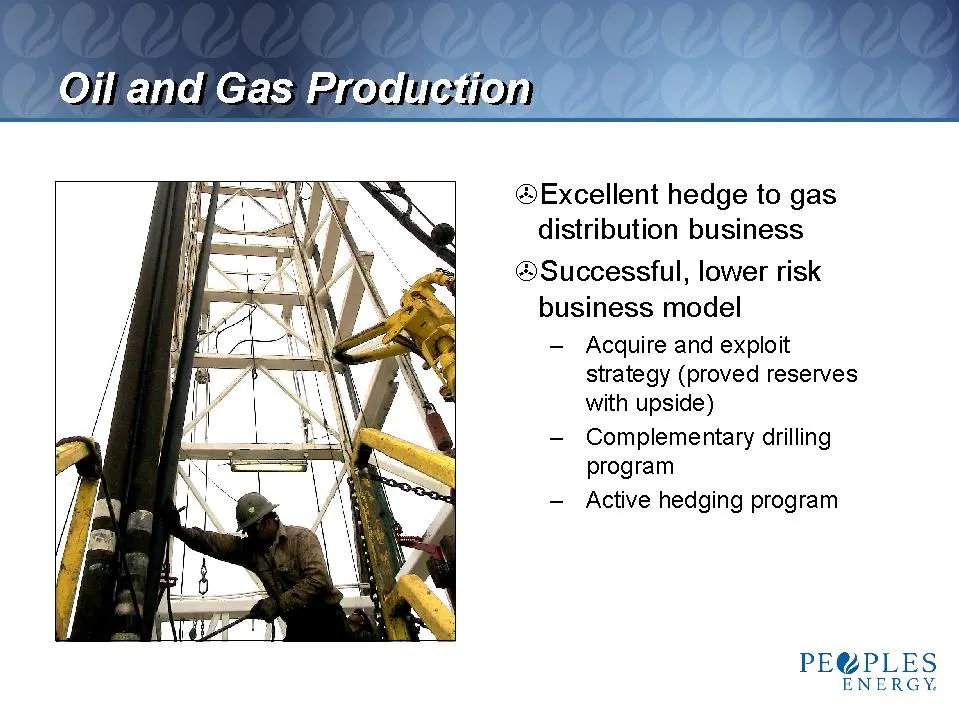
Slide 19: Oil and Gas hedge to gas distribution
@Excellent hedge to gas distribution business ®Successful, lower risk business model — Acquire and exploit strategy (proved reserves with upside) — Complementary drilling program — Active hedging program
Slide 20: Oil and Gas Production Strategic Direction
Oil and Gas Production = Strategic Direction @®Target 10% annual production growth @Acquisition of producing properties combined with complementary drilling program @®Expand operations into other region(s) ©$4.00-$5.00/MMBTU NYMEX price assumption over next several years PE@PLES ENERGY.
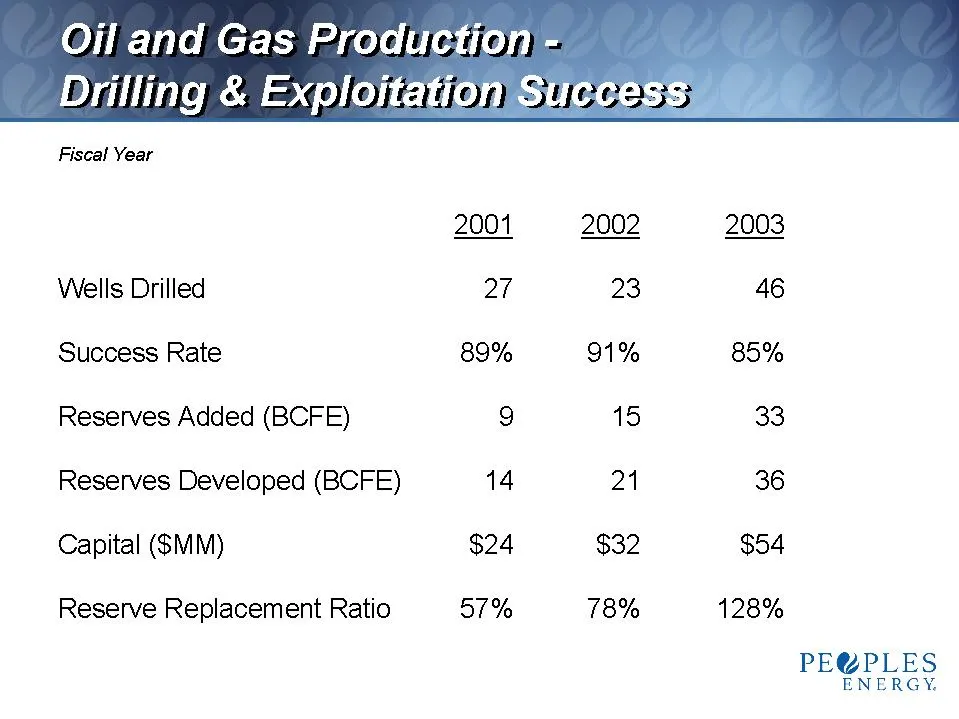
Slide 21: Drilling and Exploitation Success
Oil and Gas Production Drilling & Exploitationsuccess Fiscal Year 2001 2002 2003 Wells Drilled 27 23 46 Success Rate 89% 91% 85% Reserves Added (BCFE) 9 15 33 Reserves Developed (BCFE) 14 21 36 Capital (SMM) $24 $32 $54 Reserve Replacement Ratio 57% 78% 128% PE@PLES ENERGY.
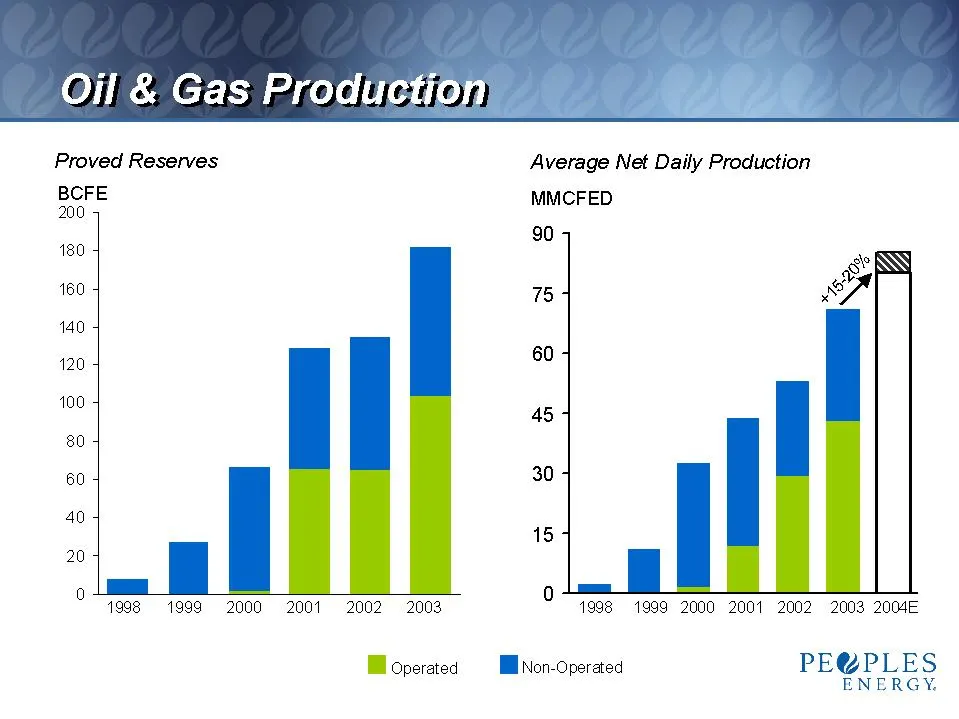
Slide 22: Oil & Gas Production
Oil & Gas Production Proved Reserves Average Net Daily Production BCFE MMCFED 200 180 909 ‘Ss INS) 160 75 4 A 140 120 60 4 100 454 80 60 30 7 40 154 20 1998 1999 2000 2001 2002 2003 O fees 1999 2000 200 2002 2003 2004E Hloperated — MNon-Operated PE@PLES ENERGY.
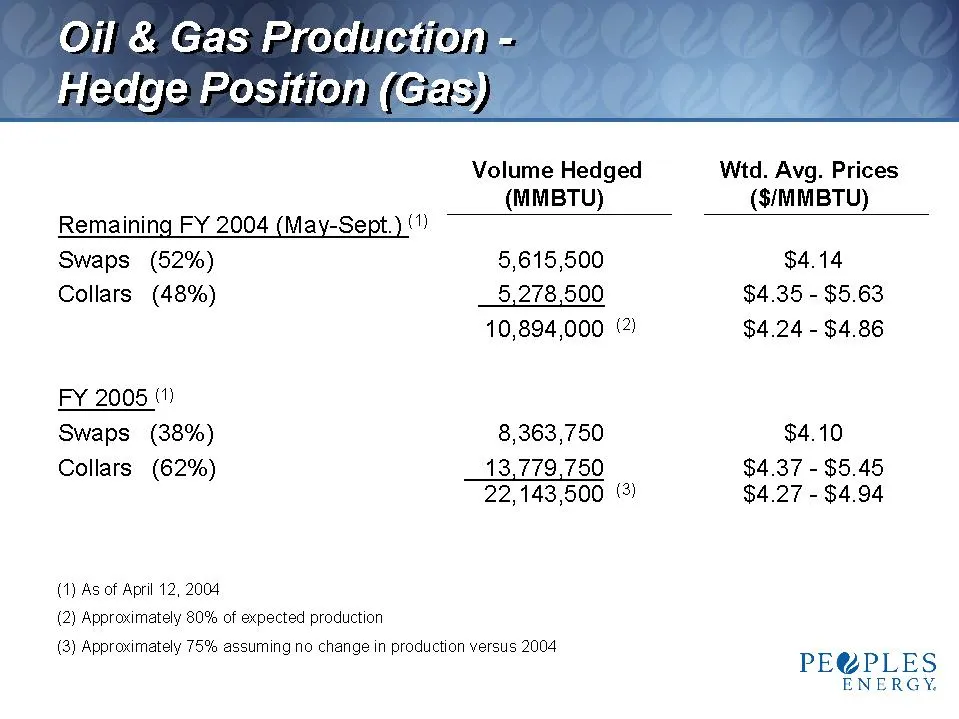
Slide 23: Hedge Position (Gas)
Oil & Gas Production Hedge Position (Gas) Volume Hedged Wtd. Avg. Prices (MMBTU) ($/MMBTU) Remaining FY 2004 (May-Sept.) ‘") Swaps (52%) 5,615,500 $4.14 Collars (48%) 5,278,500 $4.35 - $5.63 10,894,000 () $4.24 - $4.86 FY 2005 (1) Swaps (38%) 8,363,750 $4.10 Collars (62%) 13,779,750 $4.37 - $5.45 22
Slide 24: Financial Update
Financial Update PE@PLES ENERGY.
Slide 25: FY 2004 Outlook
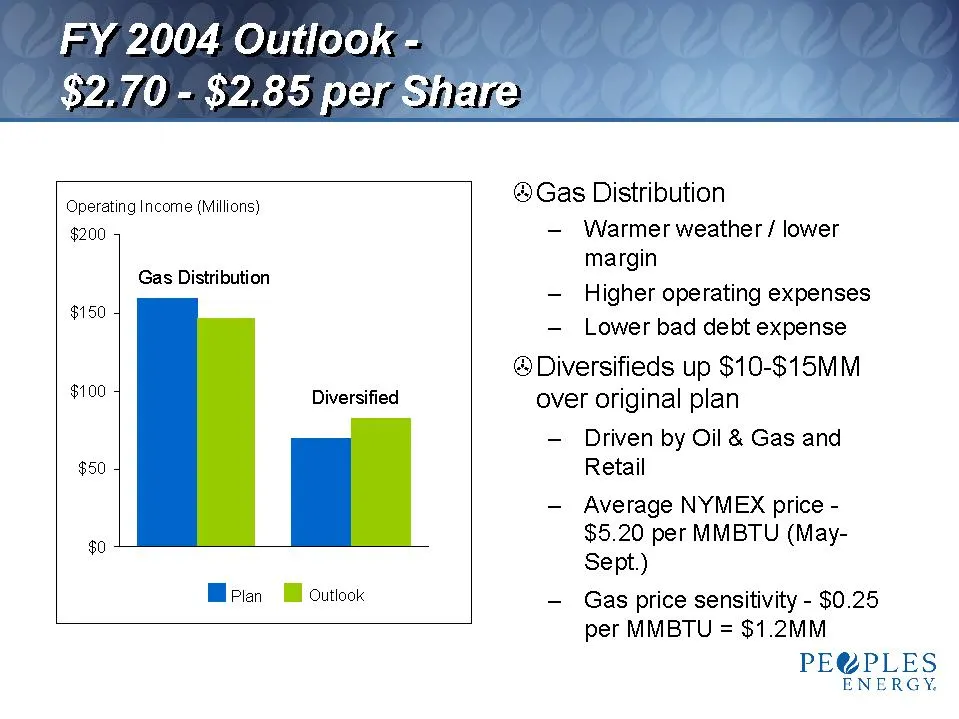
FY 2004 Outlook- $2.70 - $2:85 per Share 5 ®Gas Distribution erating Income (Millions) $200 — Warmer weather / lower margin Gas Distribution “ rs — Higher operating expenses — Lower bad debt expense ®Diversifieds up $10-$15MM over original plan — Driven by Oil & Gas and Retail — Average NYMEX price
Slide 26: Second Quarter Outlook
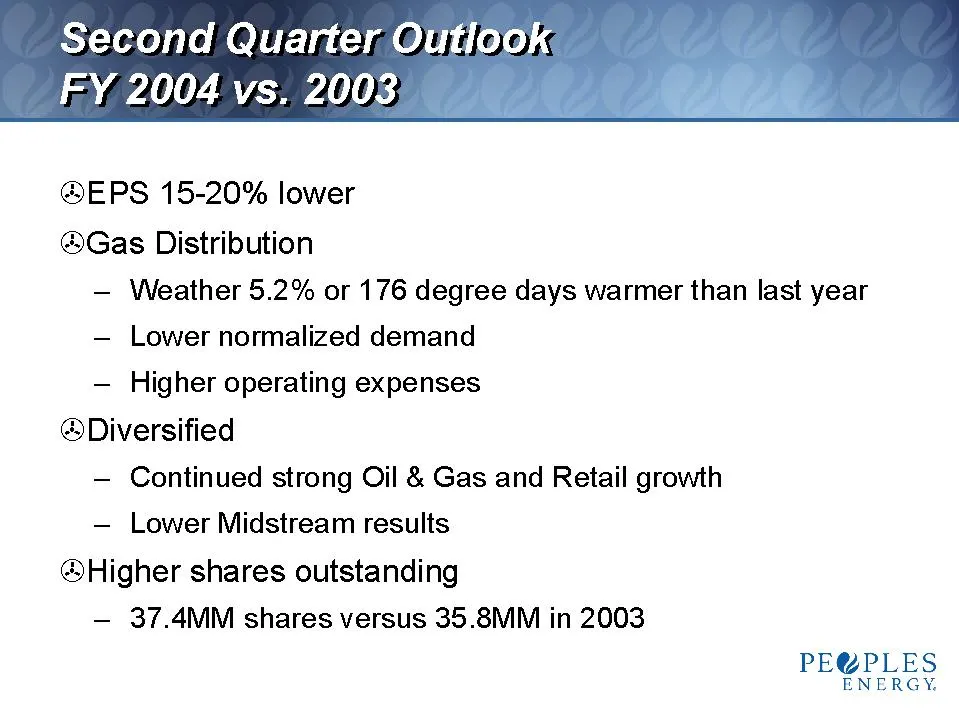
Second Quarter, Gutiook: FY 2004 vs. 2003 @®EPS 15-20% lower ®Gas Distribution — Weather 5.2% or 176 degree days warmer than last year — Lower normalized demand — Higher operating expenses @Diversified — Continued strong Oil & Gas and Retail growth — Lower Midstream results @Higher shares outstandin
Slide 27: Gas Production and realized price
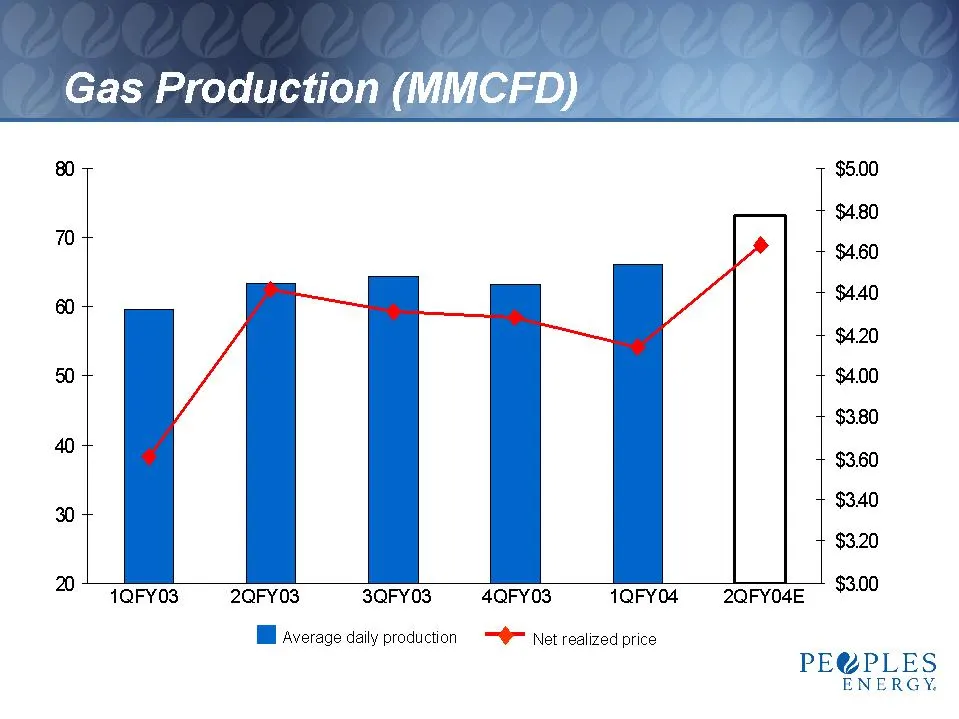
_ Gas Production ( 80 $5.00 $4.80 ” $460 60 $440 $4.20 50 $4.00 $3.80 4 $3.60 3.40 9 $ $3.20 2 1QFY03 2QFY03 3QFY03 4QFY03 1QFY04 2QFY04E $300 BB average daily production —@= Net realized price PE@PLES ENERGY.
Slide 28: Gas Distribution Bad Debt
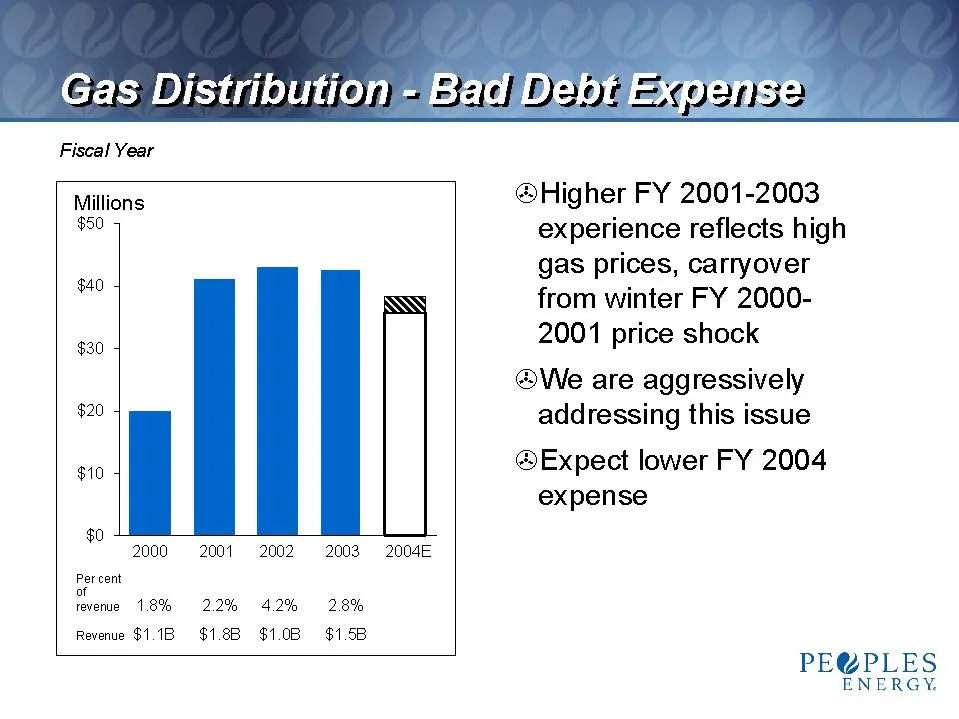
Gas Distribution =Bad DEbLE Fiscal Year Millions $50 $40 $30 $20 $10 $0 2000 Percent of reverue 1.8%. Revenue $1.1B 2001 2002 22% 42% $1.8B $1.08 2003 2004E 2.8% $1.58 ®Higher FY 2001-2003 experience reflects high gas prices, carryover from winter FY 2000- 2001 price shock @We are aggressively addre
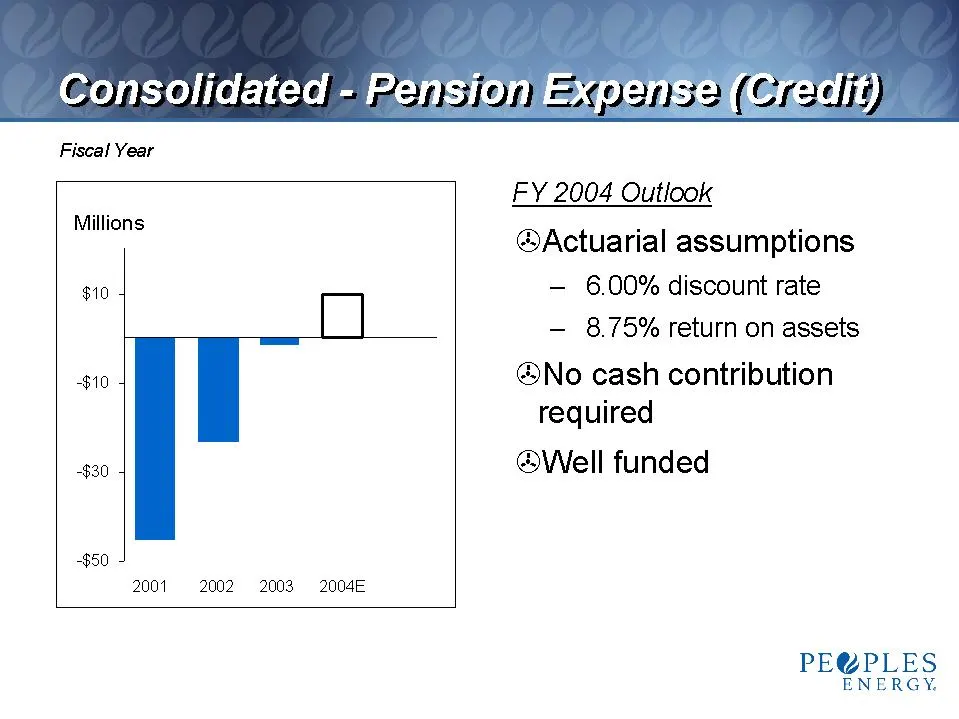
Slide 29: Consolidated Pension Expense (Credit)
Consolidated - PensigMEXpensey(Greait) Fiscal Year FY 2004 Outiook @Actuarial assumptions $10 — 6.00% discount rate — 8.75% return on assets Millions @No cash contribution required $30 @®Well funded -$10 -$50 2001 2002 «2003. 2004E PE@PLES ENERGY.
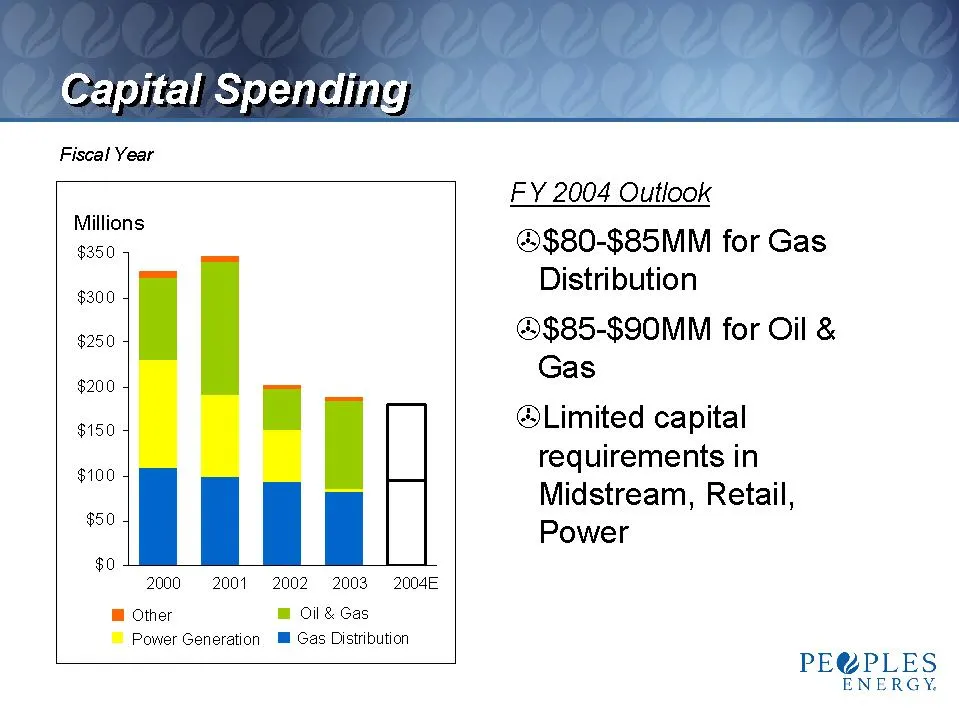
Slide 30: Capital Spending
Capital Spending Fiscal Year Millions $350 $300 $250 $200 $150 $100 $50 $0 2000 2001 «2002 «2003 §=2004E @ Other @ Oil & Gas © Power Generation Ml Gas Distribution FY 2004 Outlook ©$80-$85MM for Gas Distribution ©$85-$90MM for Oil & Gas @Limited capital requirements in Midstream, Retail, Power PE@PL
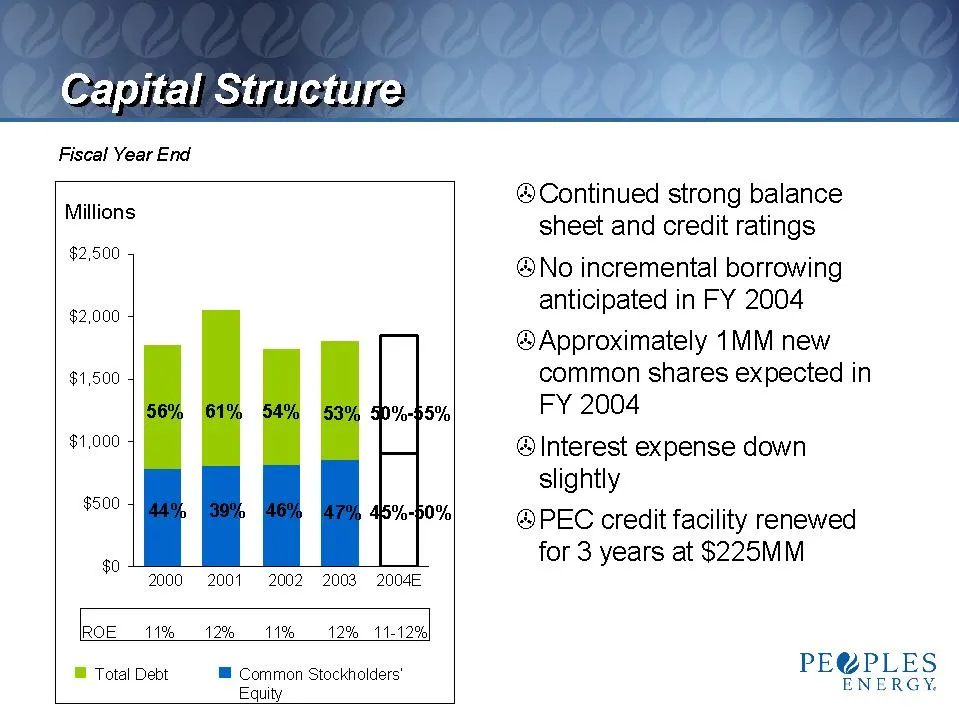
Slide 31: Capital Structure
Capital Structure Fiscal Year End wal ®Continued strong balance mons sheet and credit ratings $2,500 @®No incremental borrowing e000 anticipated in FY 2004 @Approximately 1MM new $1,500 common shares expected in p%-$5% FY 2004 $1,000 @ Interest expense down slightly 00 46%-p0%| @PEC credit facility
Slide 32: Financial Summary
Financial Summary @Still on track to hit original target range of $2.70-$2.85 per share @®Gas Distribution results lower than expected, diversified stronger (Oil & Gas, Retail) @Balance sheet and liquidity very strong @®Cash flow should approximately cover capex in FY 2004 PE@PLES ENERGY.
Slide 33: Recap
Recap PE@PLES ENERGY.
Slide 34: Key Investment Considerations
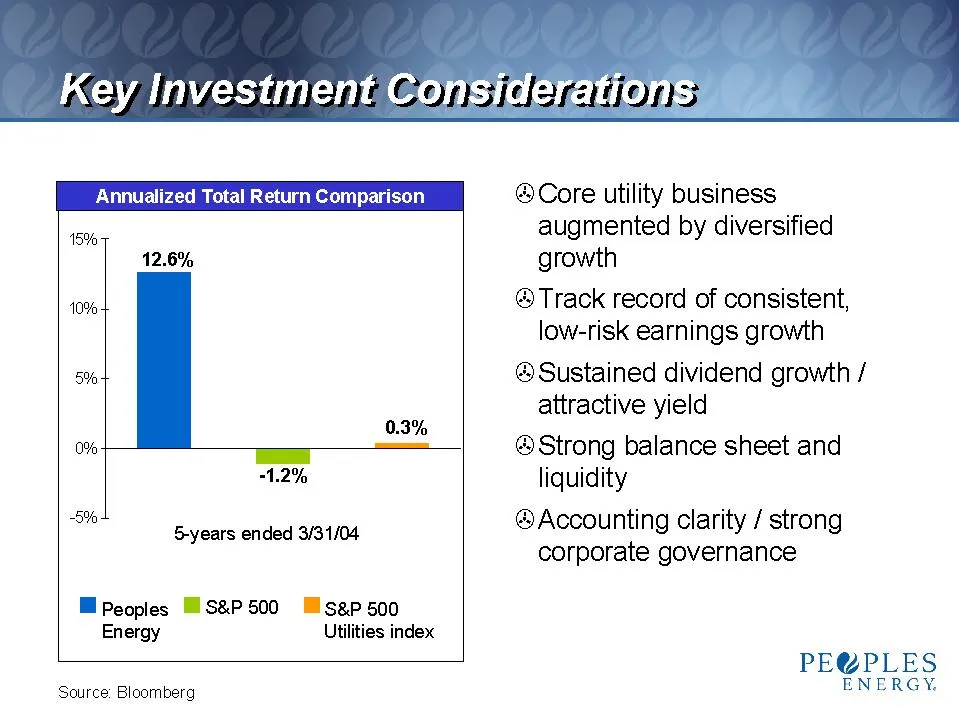
Key Investment Considerations Annualized Total Return Comparison 15% 12.6% 10% 5% 0.3% 0% ——=. 1.2% 5% 5-years ended 3/31/04 MPeoples Mis&P500 lMisap 500 Energy Utilities index Source: Bloomberg ®Core utility business augmented by diversified growth ®Track record of consistent, low-risk earnings gro
Slide 35: Q&A
Q&A Proven Strategies Producing Results PE@PLES ENERGY.
Source: SEC EDGAR · 8-K filed Apr 14, 2004
More decks from Peoples Energy Corp
 Merger or Acquisition (October 2006)13 slides · Oct 10, 2006
 Merger or Acquisition (July 2006)31 slides · Jul 13, 2006
 Merger or Acquisition (July 2006)32 slides · Jul 11, 2006
 AGA Financial Forum 200643 slides · May 5, 2006
 Berenson/Williams Capital Group Midwest Seminar, Chicago (April 2005)36 slides · Apr 13, 2005
 AGA Financial Forum 200457 slides · Apr 30, 2004