Cytec Industries — Q1 2012 Earnings Presentation
14 slides from Cytec Industries's earnings presentation, Apr 20, 2012
Slide 1: First Quarter 2012 Earnings Review
First Quarter 2012 Earnings Review Shane Fleming – Chairman, President and CEO Dave Drillock – Vice President and CFO April 20, 2012
Slide 2: Forward Looking Statement
Forward Looking Statement During the course of this meeting we may make forward-looking statements. All statements that address expectations or projections about the future are forward-looking statements. Some of these statements include words such as “expects”, “anticipates,” “plans,” “intends,” “p
Slide 3: Results Overview
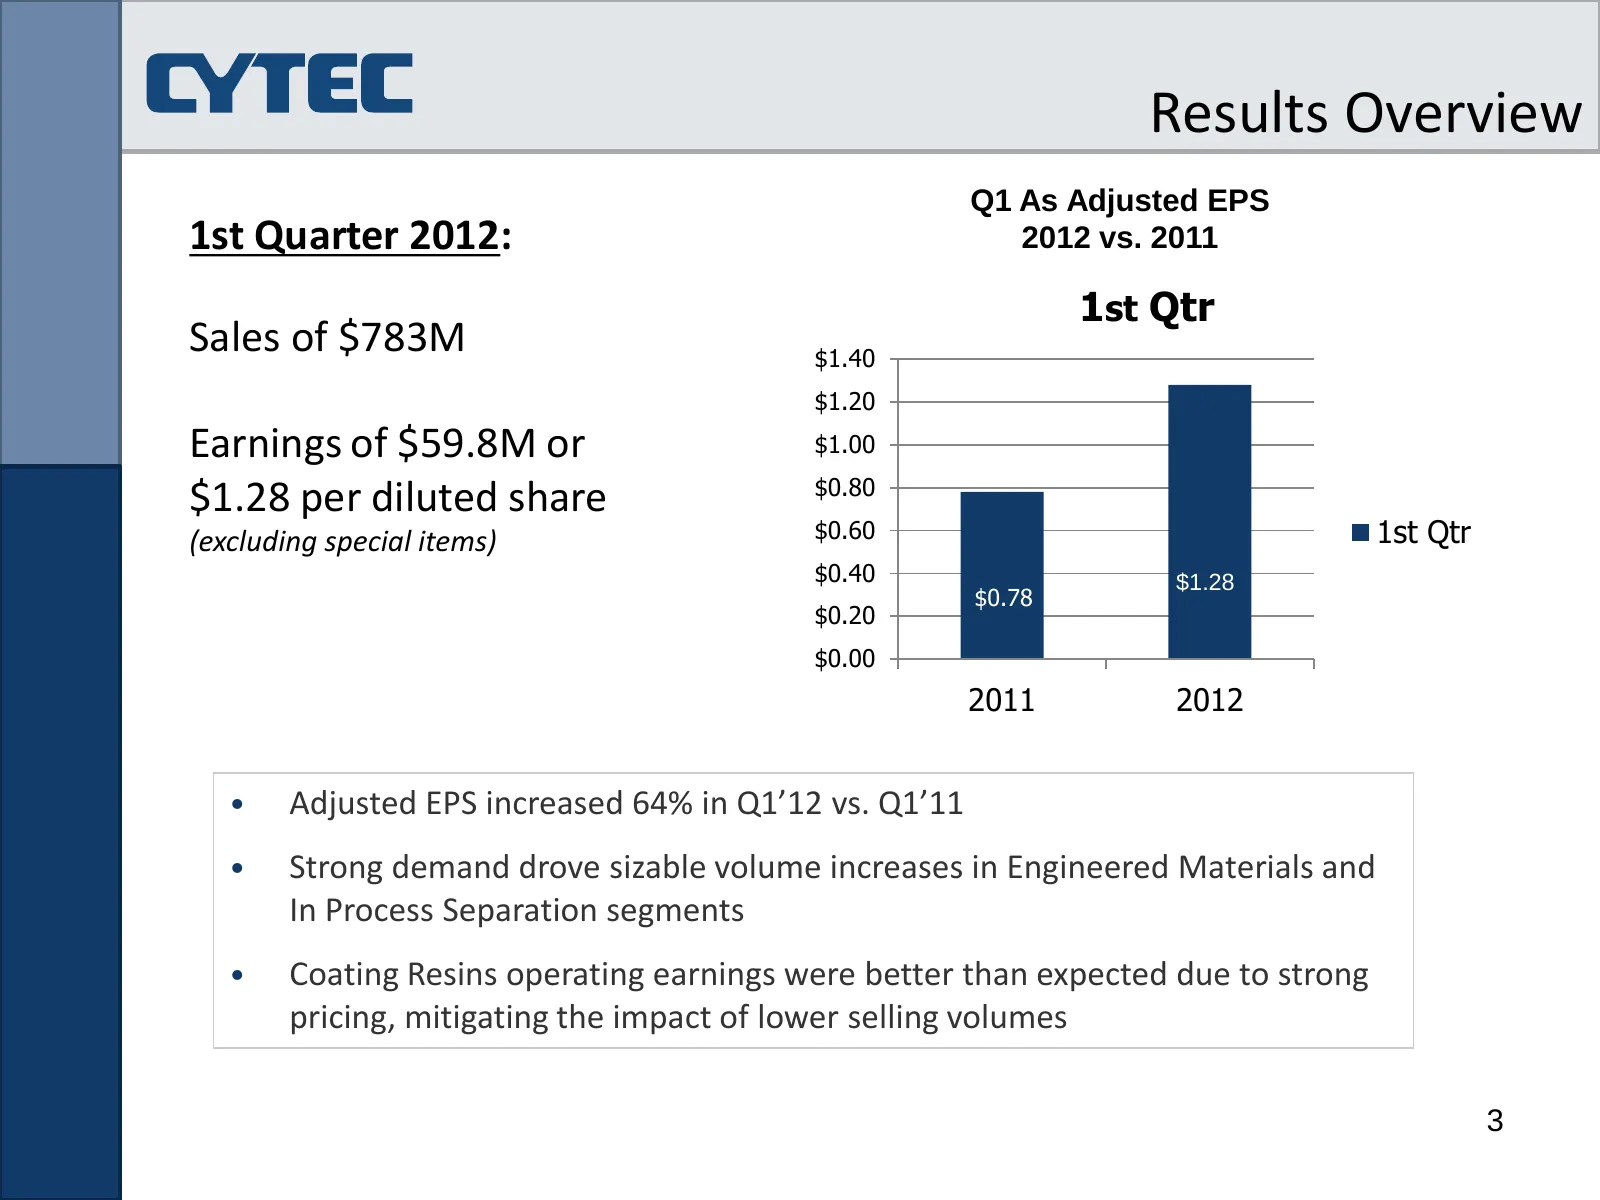
Results Overview Q1 As Adjusted EPS 1st Quarter 2012: 2012 vs. 2011 1st Qtr Sales of $783M $1.40 $1.20 Earnings of $59.8M or $1.00 $0.80 $1.28 per diluted share (excluding special items) $0.60 1st Qtr $0.40 $1.28 $0.78 $0.20 $0.00 2011 2012 • Adjusted EPS increased 64% in Q1’12 vs. Q1’11 • Strong de
Slide 4: Business Segment Results: Engineered Materials
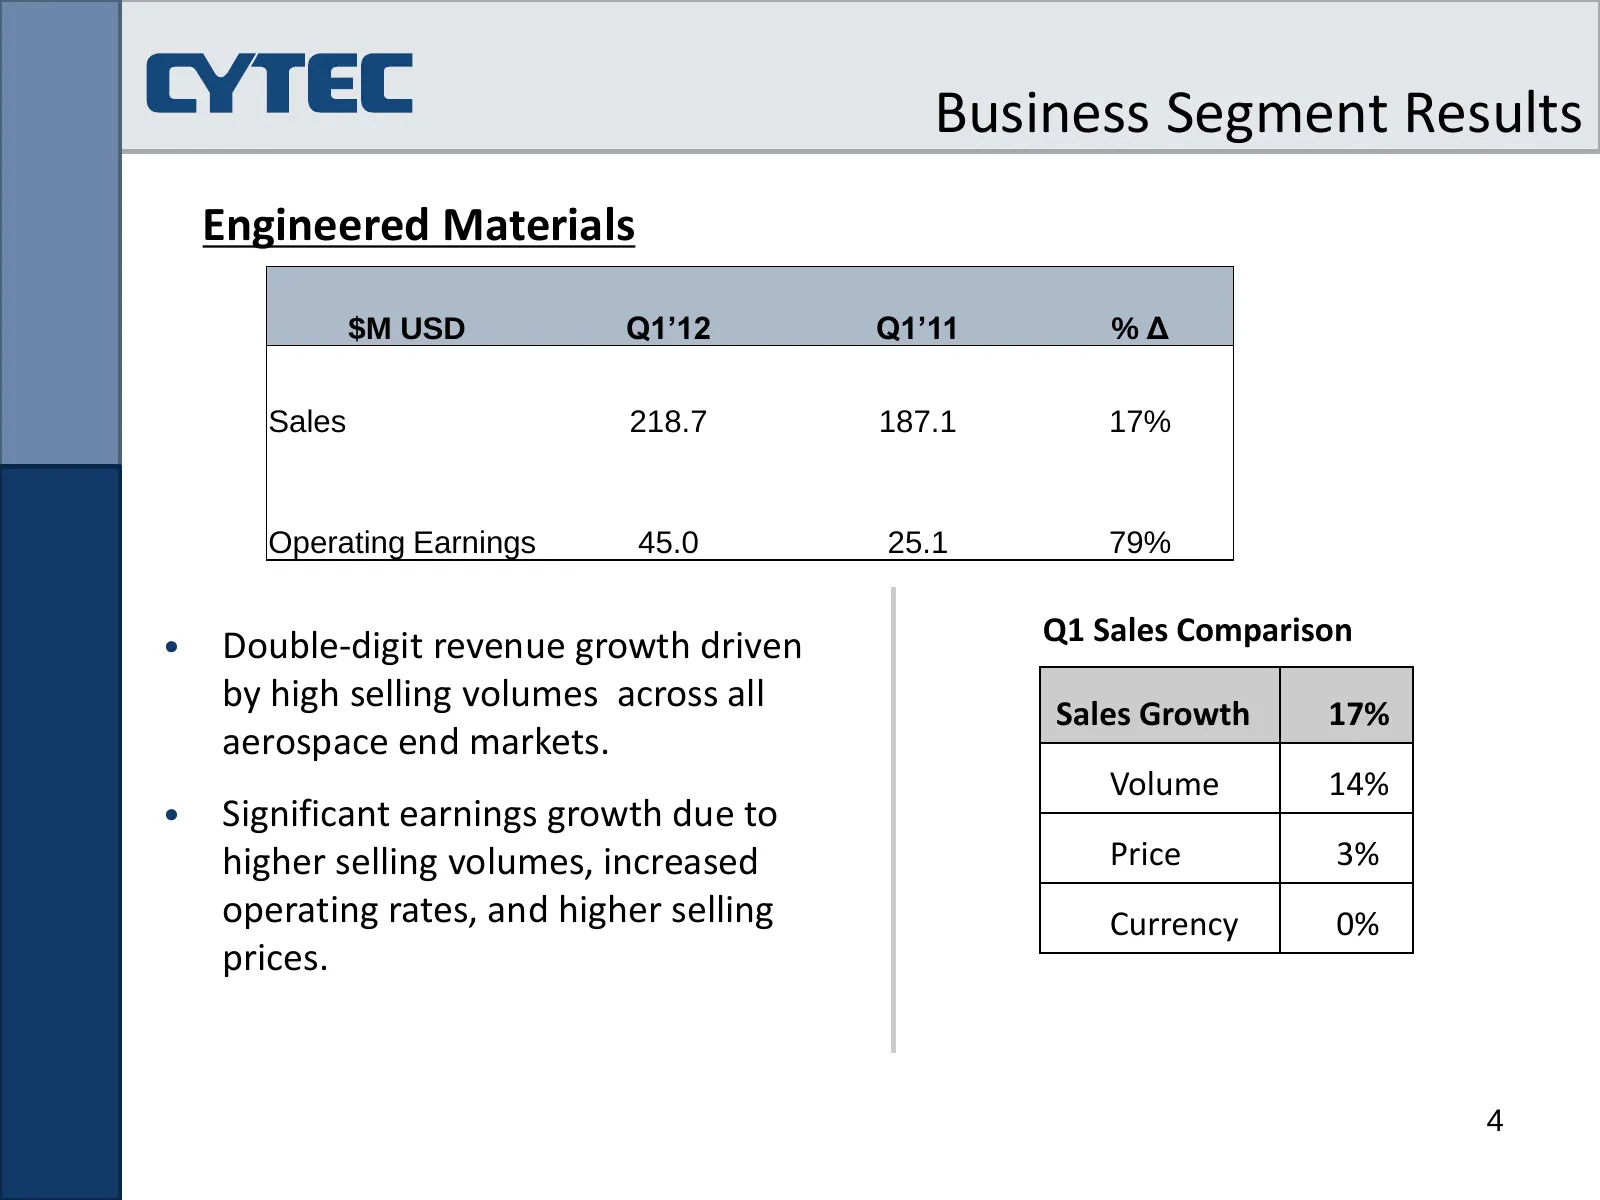
Business Segment Results Engineered Materials $M USD Q1’12 Q1’11 %Δ Sales 218.7 187.1 17% Operating Earnings 45.0 25.1 79% • Double-digit revenue growth driven Q1 Sales Comparison by high selling volumes across all Sales Growth 17% aerospace end markets. Volume 14% • Significant earnings growth due
Slide 5: Business Segment Results: In Process Separation
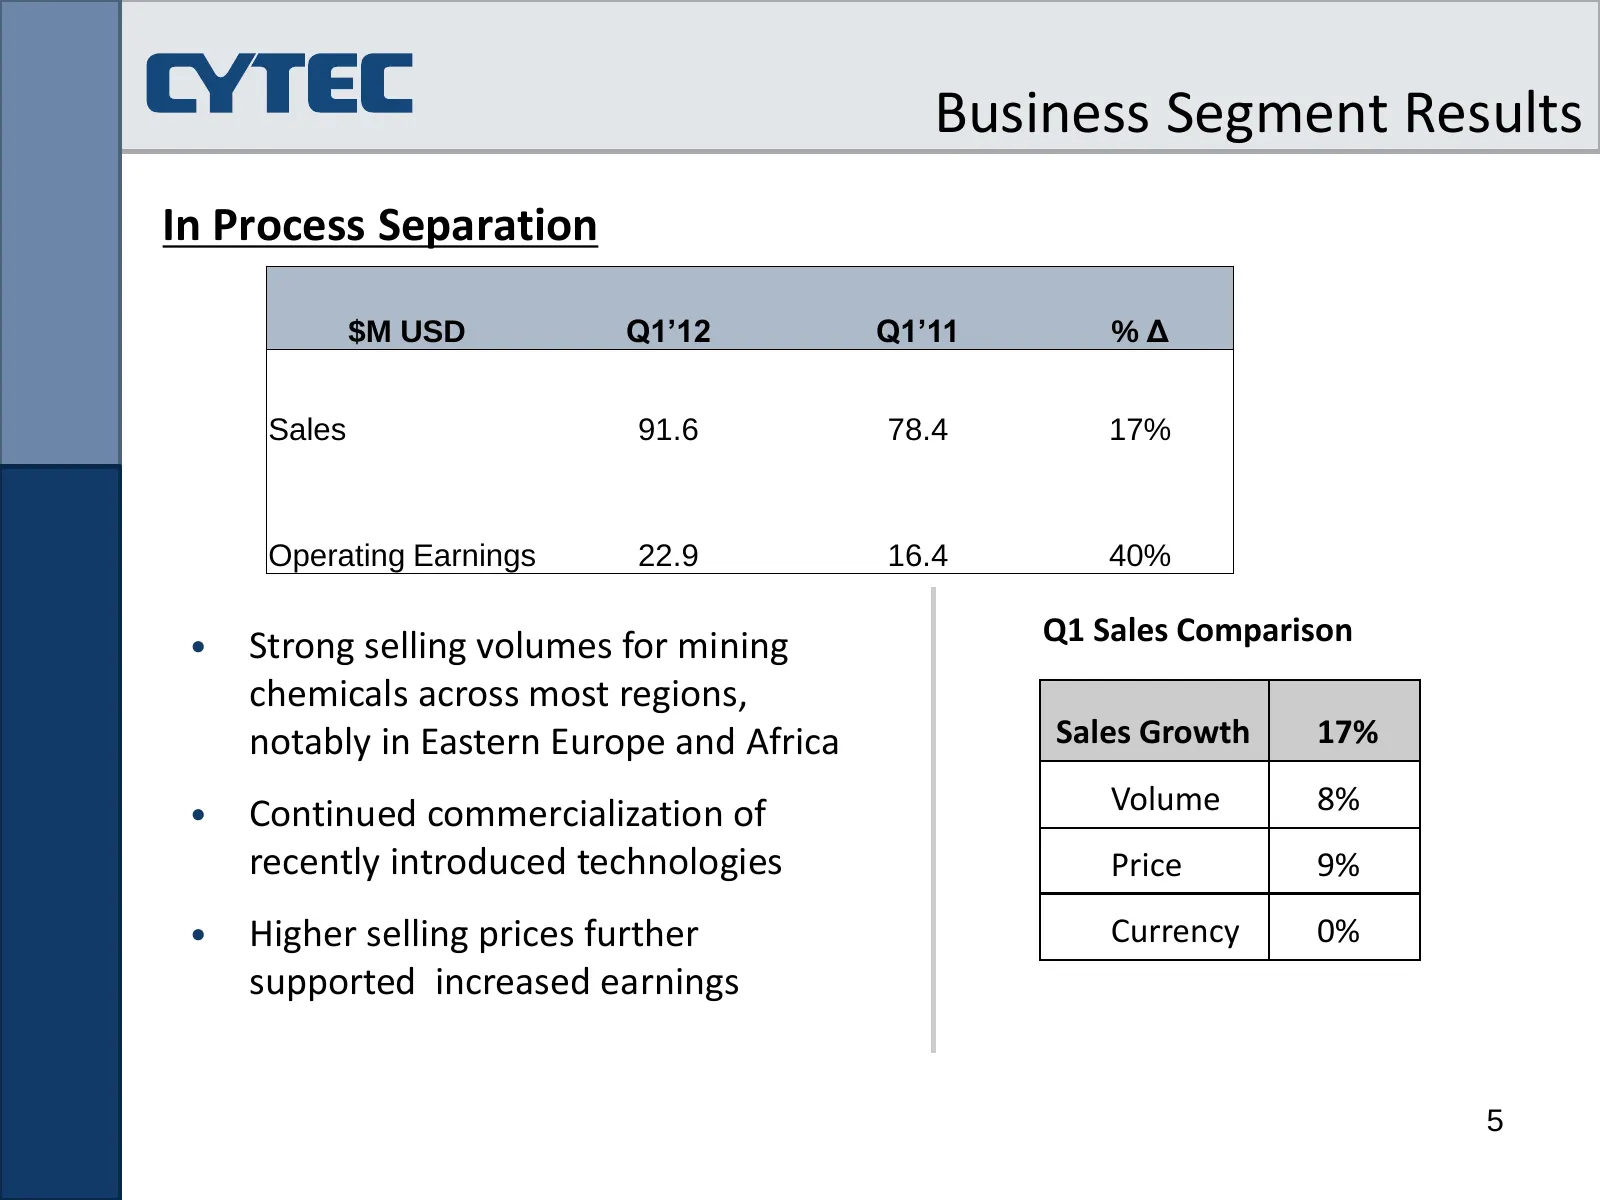
Business Segment Results In Process Separation $M USD Q1’12 Q1’11 %Δ Sales 91.6 78.4 17% Operating Earnings 22.9 16.4 40% • Strong selling volumes for mining Q1 Sales Comparison chemicals across most regions, notably in Eastern Europe and Africa Sales Growth 17% • Continued commercialization of Volu
Slide 6: Business Segment Results: Additive Technologies
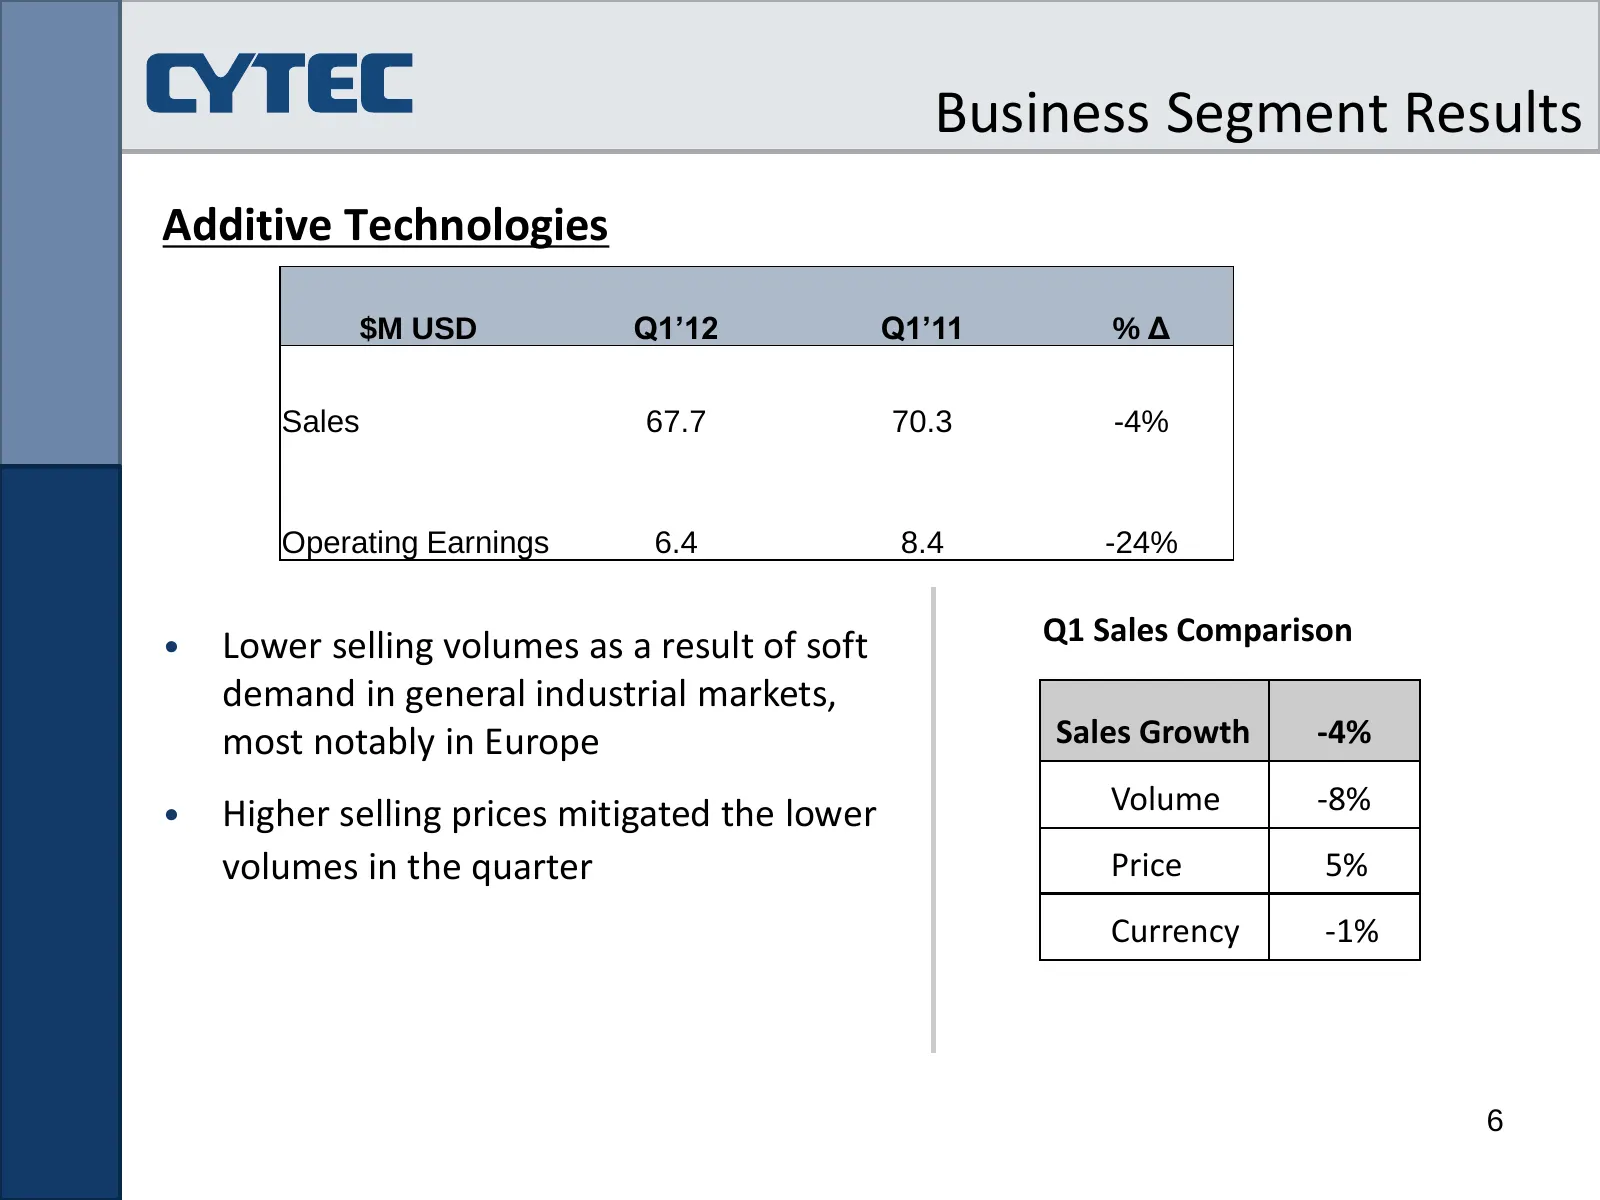
Business Segment Results Additive Technologies $M USD Q1’12 Q1’11 %Δ Sales 67.7 70.3 -4% Operating Earnings 6.4 8.4 -24% • Lower selling volumes as a result of soft Q1 Sales Comparison demand in general industrial markets, most notably in Europe Sales Growth -4% • Higher selling prices mitigated the
Slide 7: Business Segment Results: Coating Resins
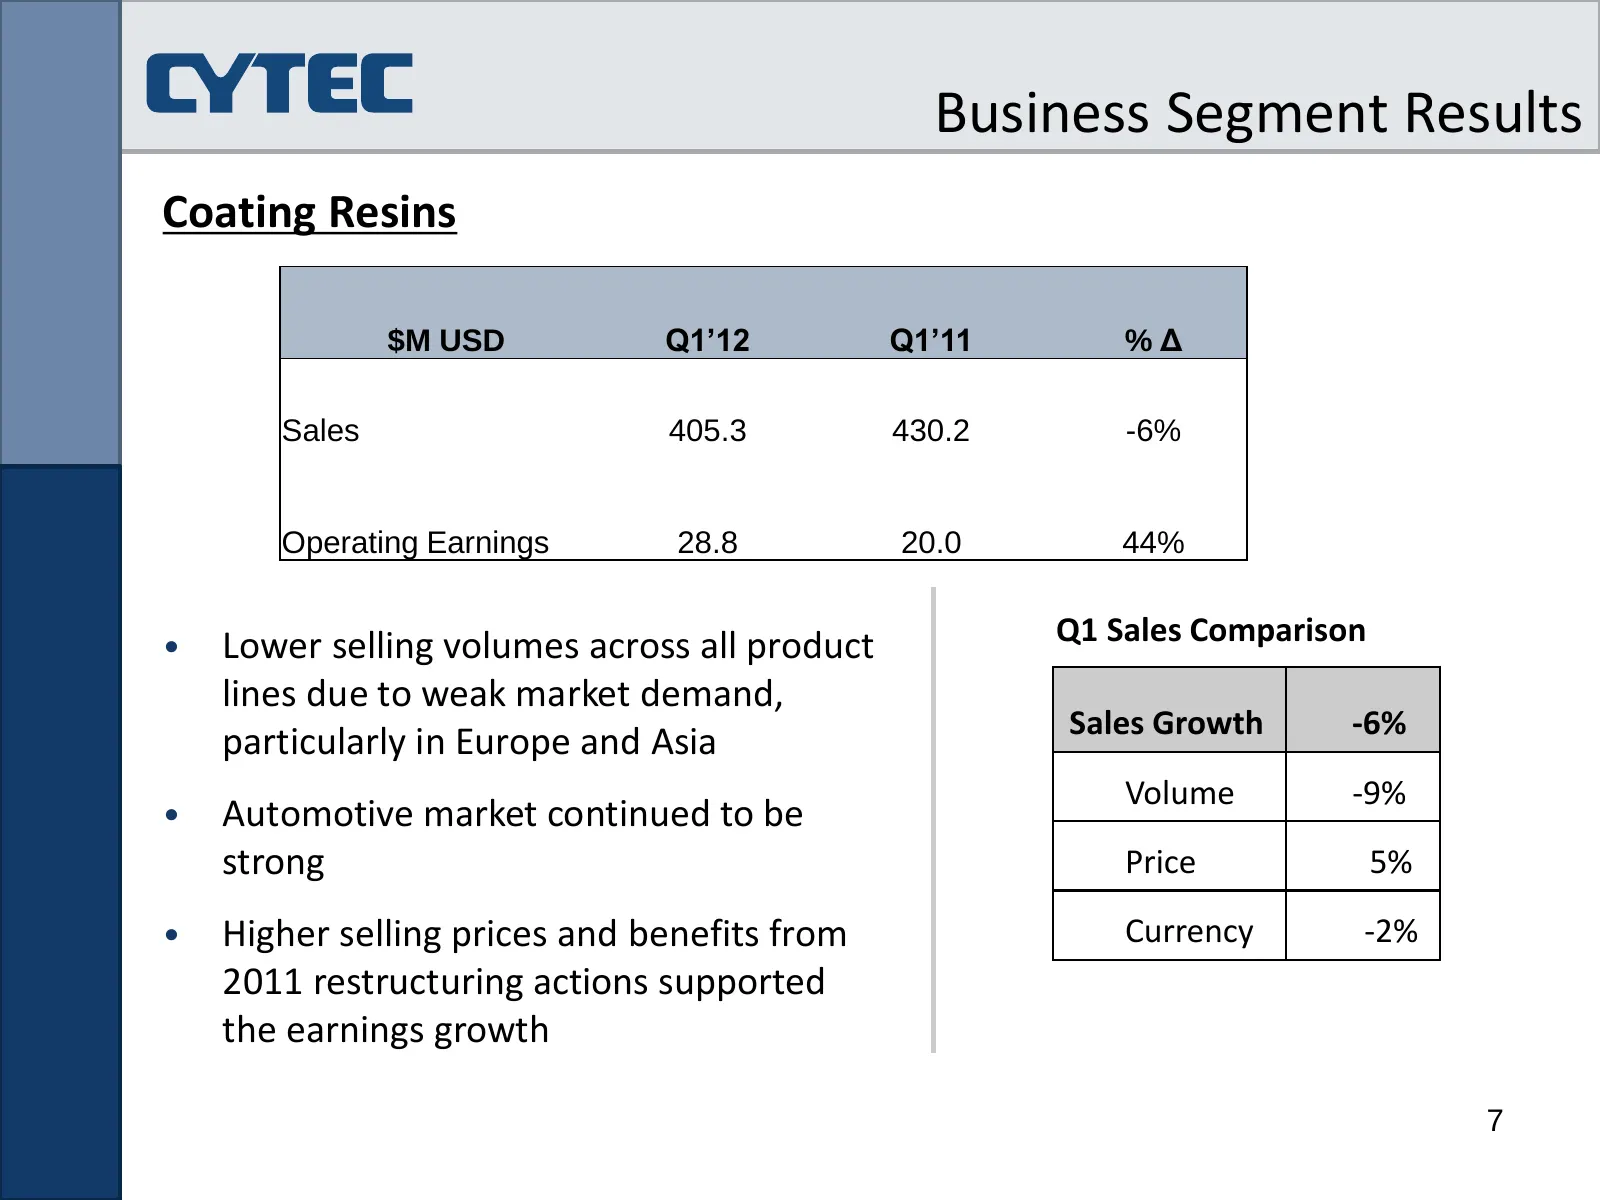
Business Segment Results Coating Resins $M USD Q1’12 Q1’11 %Δ Sales 405.3 430.2 -6% Operating Earnings 28.8 20.0 44% • Lower selling volumes across all product Q1 Sales Comparison lines due to weak market demand, Sales Growth -6% particularly in Europe and Asia Volume -9% • Automotive market continu
Slide 8: Financial Results
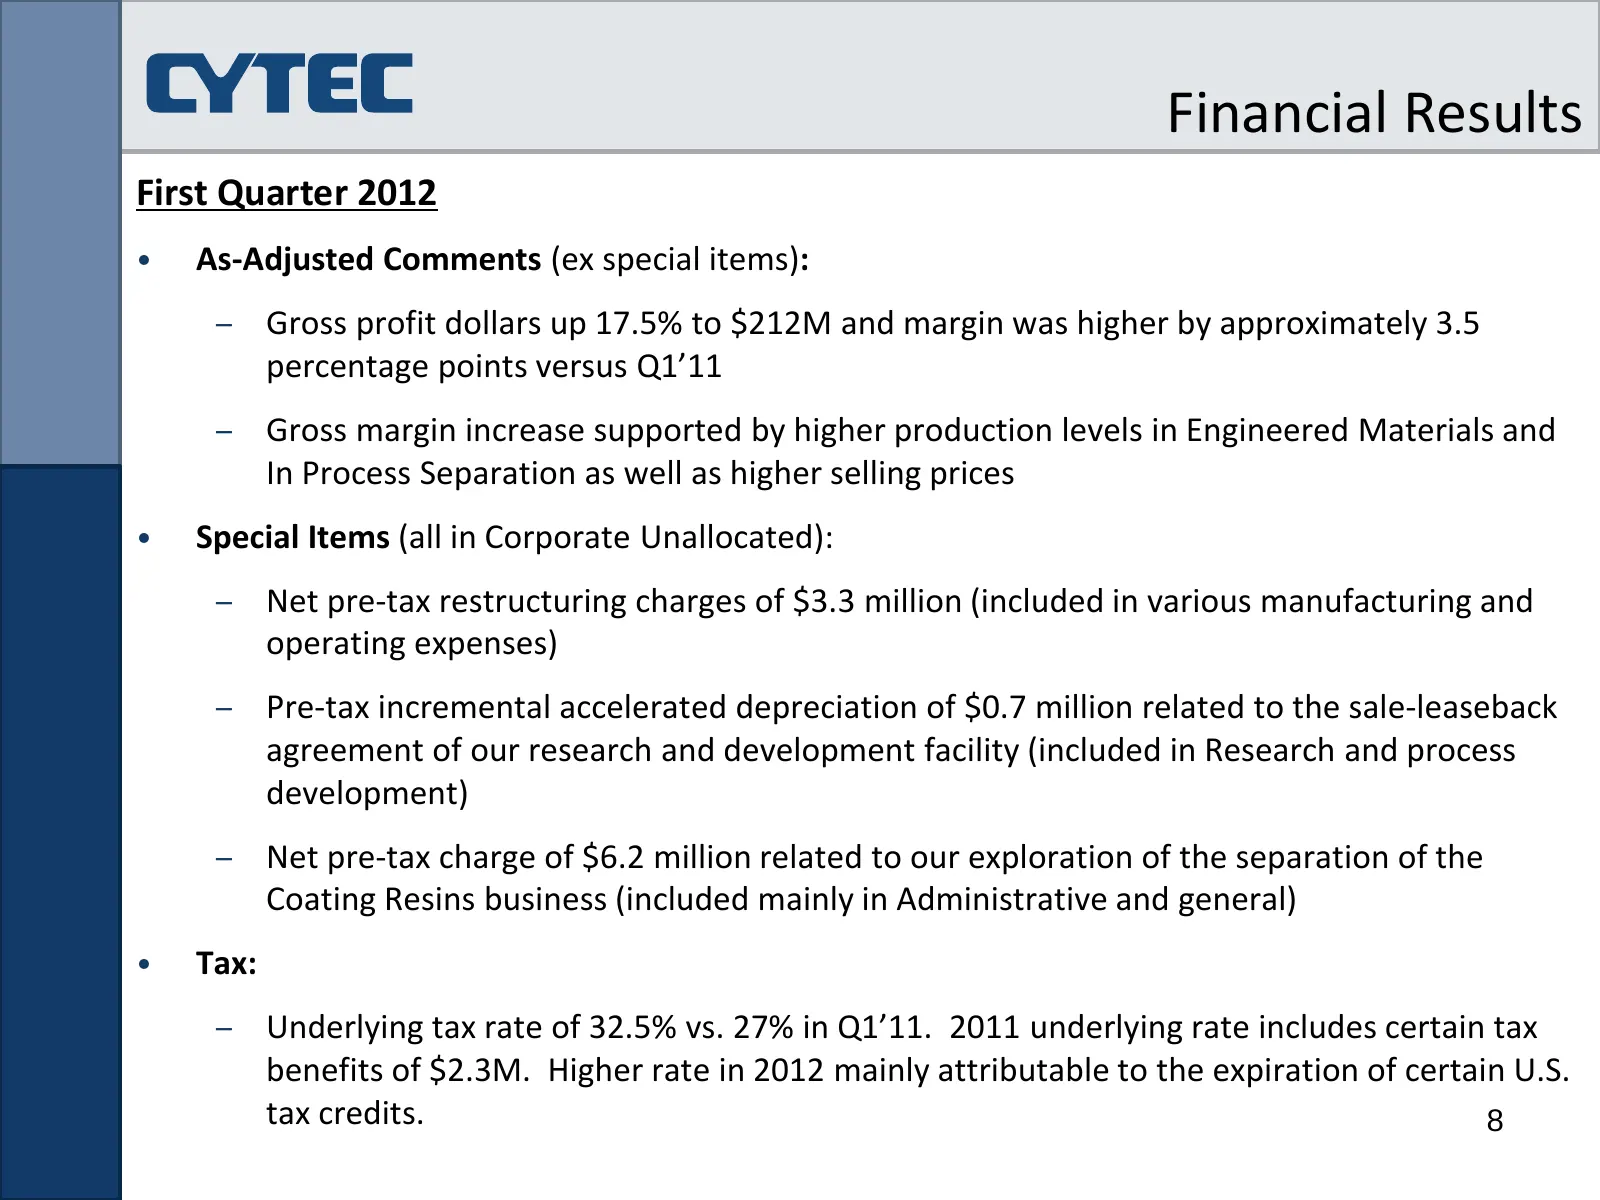
Financial Results First Quarter 2012 • As-Adjusted Comments (ex special items): – Gross profit dollars up 17.5% to $212M and margin was higher by approximately 3.5 percentage points versus Q1’11 – Gross margin increase supported by higher production levels in Engineered Materials and In Process Sepa
Slide 9: Cash Flow
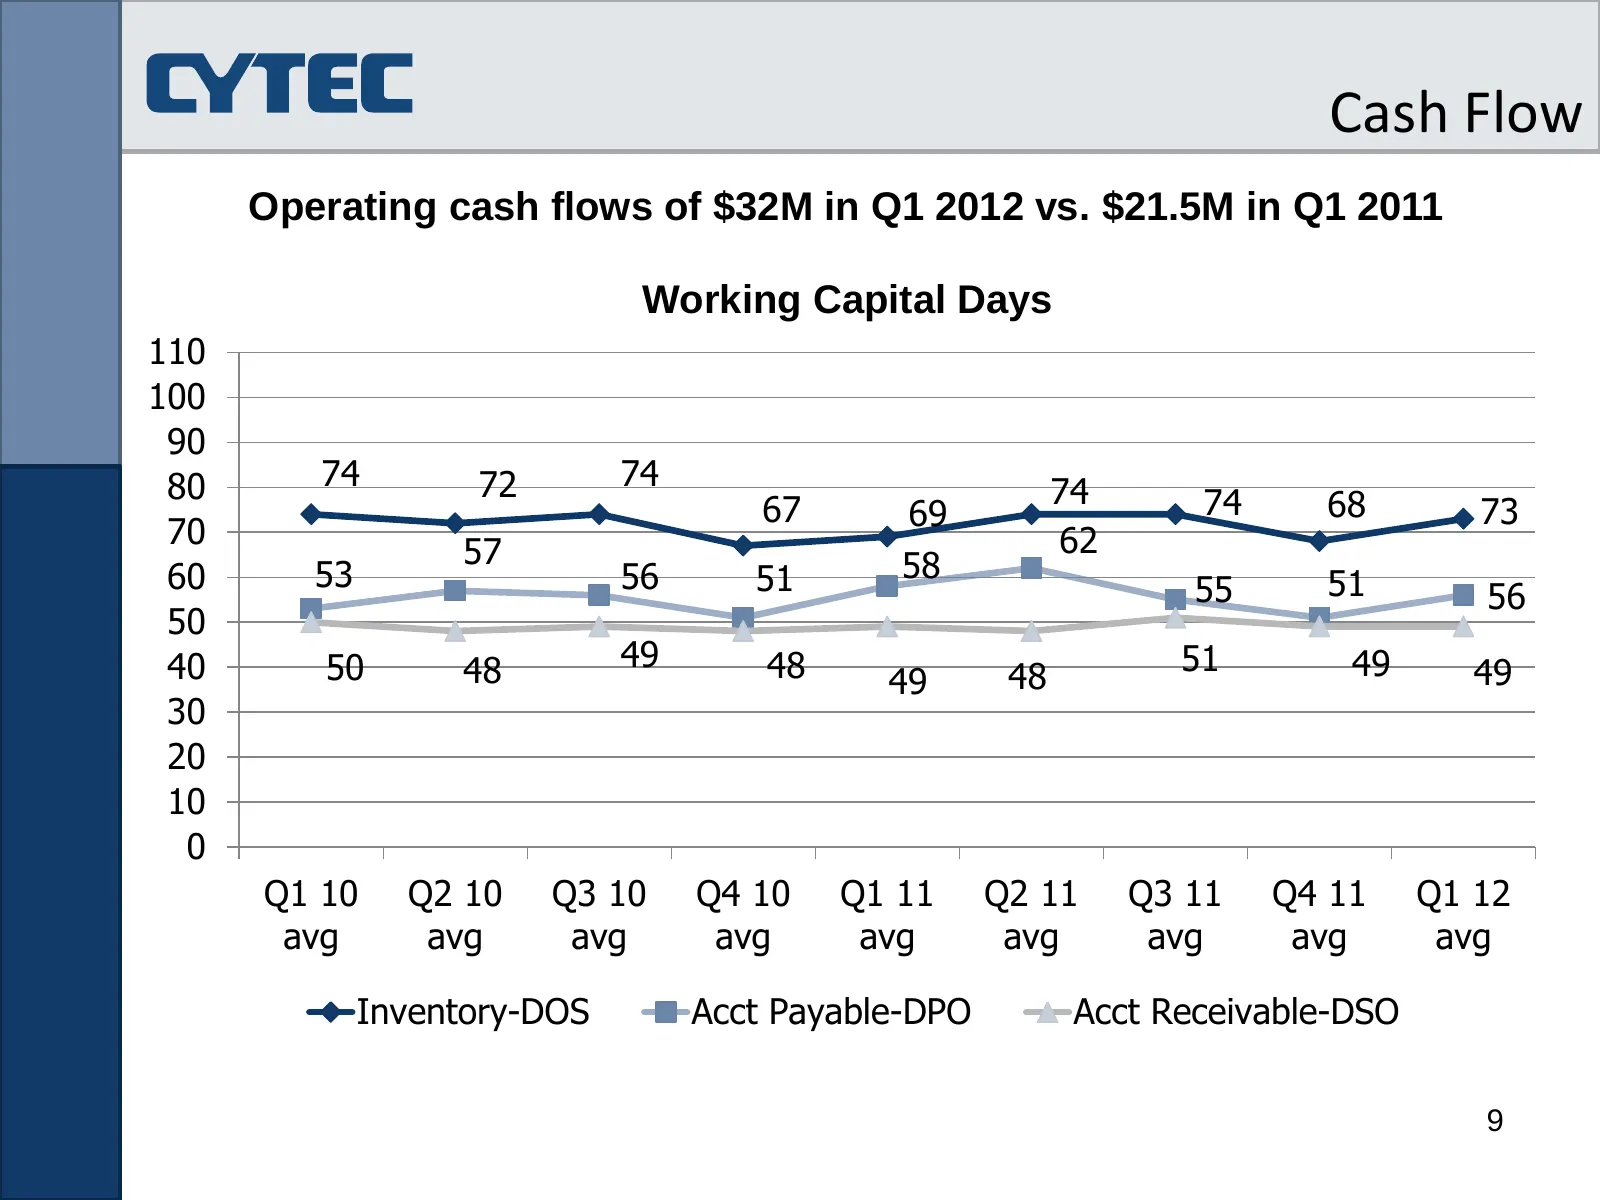
Cash Flow Operating cash flows of $32M in Q1 2012 vs. $21.5M in Q1 2011 Working Capital Days 110 100 90 80 74 72 74 74 74 68 67 69 73 70 62 57 58 60 53 56 51 55 51 56 50 40 50 48 49 48 51 49 49 48 49 30 20 10 0 Q1 10 Q2 10 Q3 10 Q4 10 Q1 11 Q2 11 Q3 11 Q4 11 Q1 12 avg avg avg avg avg avg avg avg avg
Slide 10: Balance Sheet
Balance Sheet Maintaining Liquidity • CAPEX of $24M in Q1 ’12 vs. $26M in Q1 ’11. Expected CAPEX for 2012 is approximately $200M • Acquired assets of Star Orechem International in India for $36M ($29M paid at closing) • No stock repurchase in Q1 ’12 due to our intention to acquire all shares of Umec
Slide 11: 2012 Outlook
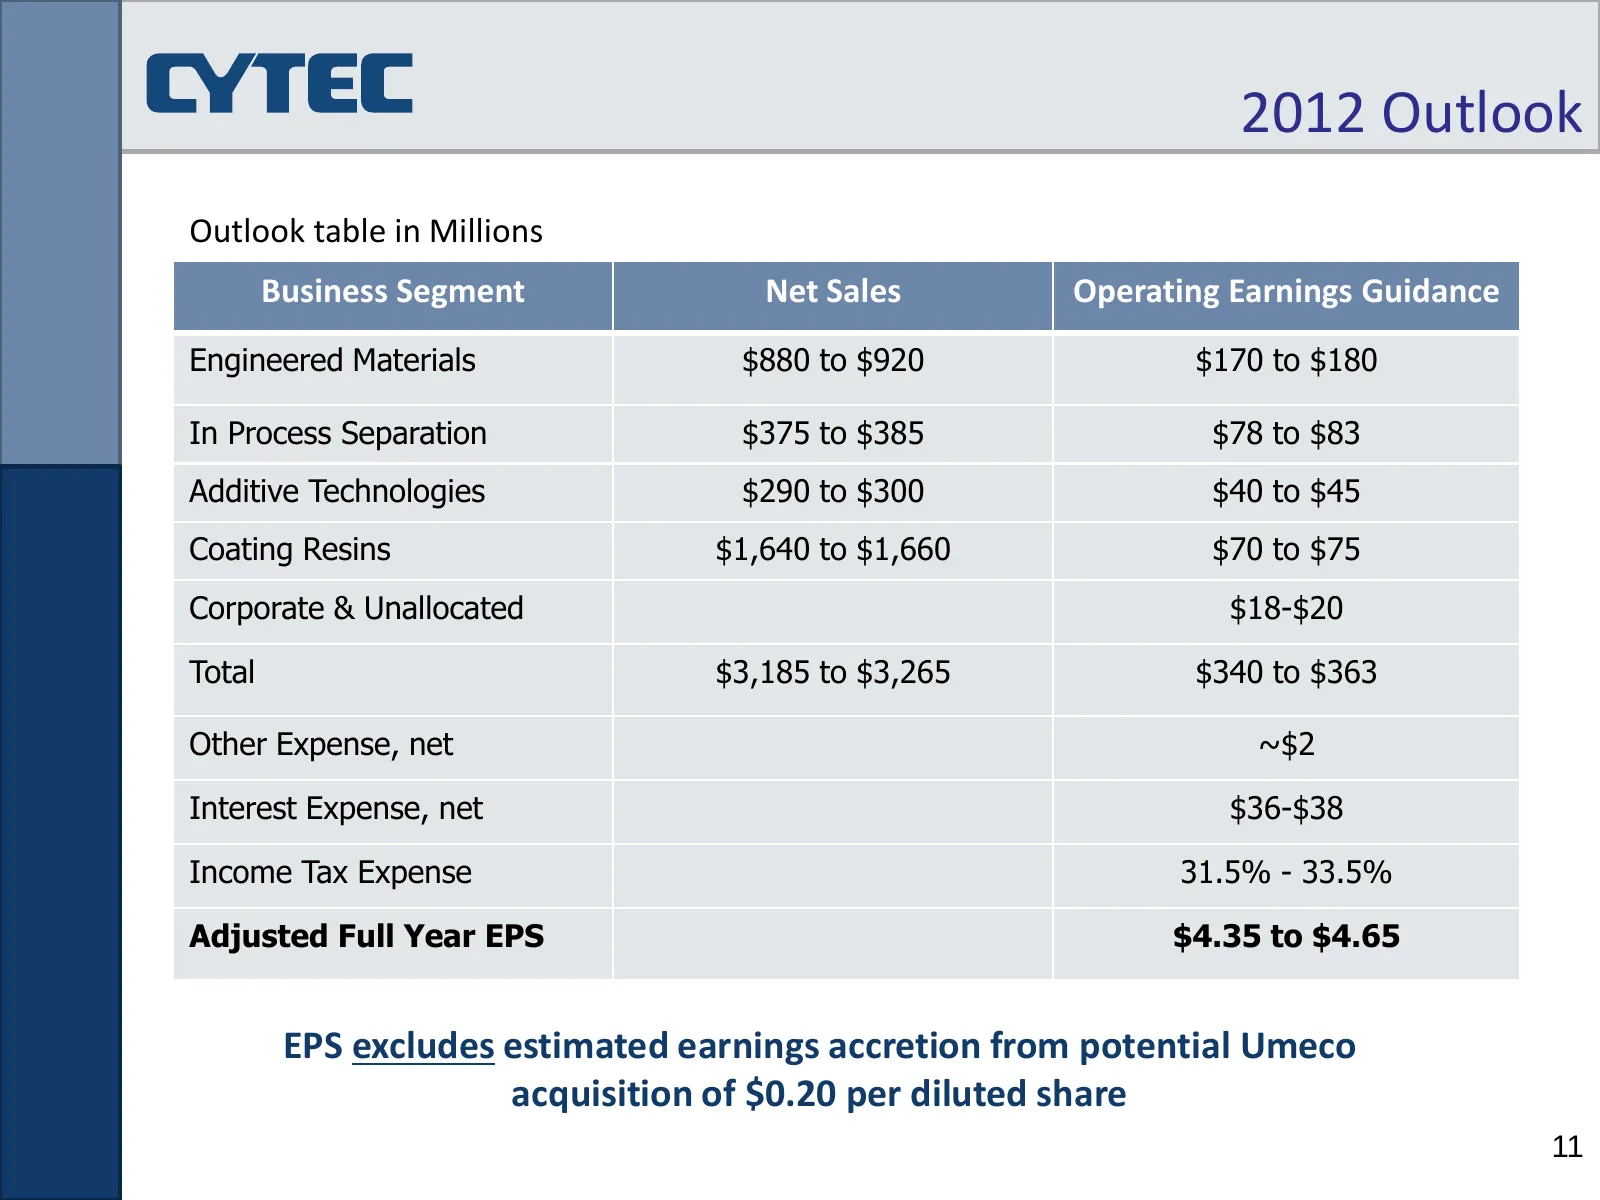
2012 Outlook Outlook table in Millions Business Segment Net Sales Operating Earnings Guidance Engineered Materials $880 to $920 $170 to $180 In Process Separation $375 to $385 $78 to $83 Additive Technologies $290 to $300 $40 to $45 Coating Resins $1,640 to $1,660 $70 to $75 Corporate & Unallocated
Slide 12: Coating Resins Update
Balance Sheet Coating Resins Update • Previously announced that we have retained J.P. Morgan to assist in an analysis of alternatives available to effect a potential separation of the entire Coating Resins business including the PSA product line • Making good progress on evaluation of strategic opti
Slide 13: NYSE: CYT
CYTEC Delivering Technology Beyond Our Customers’ Imagination™ NYSE: CYT
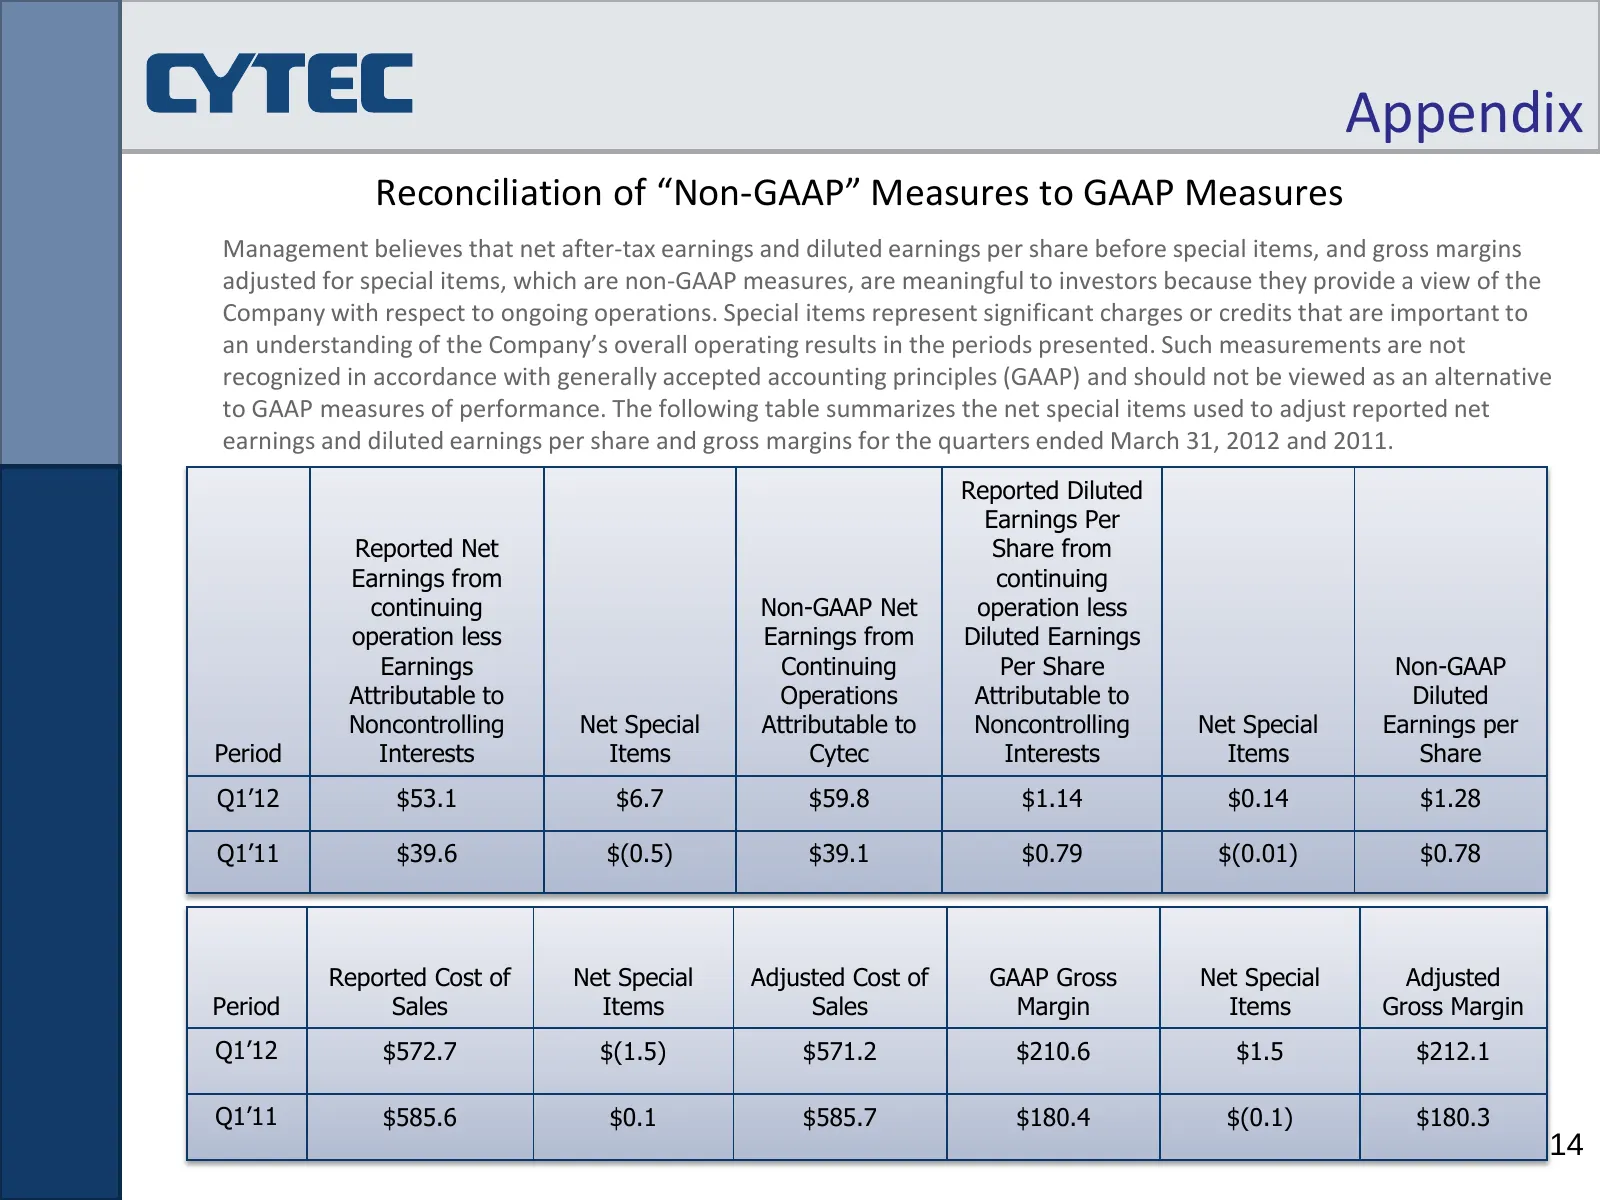
Slide 14: Appendix: Reconciliation of Non-GAAP Measures to GAAP Measures
Appendix Reconciliation of “Non‐GAAP” Measures to GAAP Measures Management believes that net after‐tax earnings and diluted earnings per share before special items, and gross margins adjusted for special items, which are non‐GAAP measures, are meaningful to investors because they provide a view of t
Source: Internet Archive copy of solvay.com
More decks from Cytec Industries Inc
 Q2 2015 Earnings Presentation12 slides · Jul 17, 2015
 Q1 2015 Earnings Presentation12 slides · April 2015
 Q4 2014 Earnings Presentation14 slides · Jan 28, 2015
 Q3 2014 Earnings Presentation14 slides · Oct 17, 2014
 Q2 2014 Earnings Presentation14 slides · Jul 18, 2014
 Q1 2014 Earnings Presentation13 slides · Apr 23, 2014